Article

Study on the Mechanism of Cross-Layer Fracture Propagation in Deep Coal Rock Based on True Triaxial Physical Simulation Experiments

by
Ruiguo Xu
1,
Haoyin Xu
1,
Xudong Li
2,
Yinxin Deng
3,*,
Guojun Yang
2,
Shuang Lv
4,
Fuping Hu
4,
Xinghua Qu
1,
Zhao Bai
2 and
Ran Zhang
3
1
Engineering Technology Research Institute, CNPC Bohai Drilling Engineering Co., Ltd., Tianjin 300280, China
2
Downhole Technical Service Branch, CNPC Bohai Drilling Engineering Co., Ltd., Tianjin 300280, China
3
State Key Laboratory of Reservoir Geology and Development Engineering, Southwest Petroleum University, Chengdu 610500, China
4
Oil and Gas Cooperative Development Branch, CNPC Bohai Drilling Engineering Co., Ltd., Tianjin 300280, China
*
Author to whom correspondence should be addressed.
Processes 2025, 13(11), 3411; https://doi.org/10.3390/pr13113411 (registering DOI)
Submission received: 18 September 2025 / Revised: 10 October 2025 / Accepted: 19 October 2025 / Published: 24 October 2025
(This article belongs to the Section Energy Systems)

Abstract

The lithological composition of deep coal rock reservoirs in the Ordos Block is complex. The characteristics of hydraulic fracture propagation directly impact reservoir stimulation effectiveness. Therefore, efficient development requires an in-depth understanding of the cross-layer propagation mechanisms of fractures in deep coal rock. To clarify the cross-layer patterns and explore the controlling factors in deep coal rock, large-scale laboratory true triaxial hydraulic fracturing physical simulation experiments were conducted. These experiments, combined with CT scanning and post-fracture 3D reconstruction technology, investigated Ordos Block deep coal rock under different perforation locations, and the complexity of fractures was quantitatively characterized. Due to the well-developed weak planes such as natural fractures in coal rock, perforations in coal rock significantly reduce the breakdown pressure compared to perforations in sandstone. The complexity of perforation fractures in coal rock is far greater than in sandstone. Quantitative characterization of fracture complexity shows that the number of perforation fractures in coal rock fracturing reached 450% of that in sandstone, and the fracture area ratio reached 131.7%. Under high-rate and high-viscosity fracturing conditions, dominant hydraulic fractures tend to form, while the well-developed natural fractures in the coal rock interact with each other, resulting in a complex fracture network. Perforations in coal rock can effectively connect adjacent sandstone layers through cross-layer propagation, whereas perforations in sandstone form dominant hydraulic fractures without connecting the adjacent coal rock layers. The findings can provide operational guidance for optimizing field fracturing operations.

1. Introduction

With the continuous exploitation of oil and gas resources, the increase in oil and gas reserves and production has transitioned from conventional reservoir development to unconventional reservoir development [1,2]. Deep coalbed methane is an important component of unconventional oil and gas resources, and ensuring the efficient development of deep coalbed methane is of great significance [3,4,5,6].
Deep coal rock is characterized by low permeability, strong adsorption capacity, and complex composition of adjacent lithology [7,8,9]. To obtain industrial gas flow, most coalbed methane wells need to undergo fracturing modification before going into production [10,11,12]. Reservoir fracturing modification technology generates high-flow-capacity fractures by injecting a large amount of fracturing fluid into the formation to increase oil and gas production capacity and is widely applied in coalbed methane development [13,14,15]. Due to the complex lithological composition of deep coal rock reservoirs, the propagation of hydraulic fractures often faces the problem of cross-layer propagation [16,17,18]. Whether hydraulic fractures can penetrate layers to form a complex fracture network with high-speed flow will directly affect the fracturing effect. Therefore, it is of great significance to study the layer penetration and key factors of deep coal rock fracturing [19,20,21,22].
In recent years, many scholars have carried out research on the propagation and penetration of deep coal rock fractures [23,24,25,26]. Based on the established reservoir-fracture interference propagation model for coal rock composites, it was discovered that leveraging the dilation effect of fractured roof rocks to form long-term stable fractures can significantly enhance coal seam stimulation effectiveness [27]. By studying the propagation mode of fracturing fluid at the interface between coal seams and other rock strata, nine modes of hydraulic fracture propagation at the interface of coal-bearing rock strata were proposed [28]. In hydraulic fracturing simulations of coal seams with varying perforation locations in roof and floor rocks, it was observed that when perforating within the coal seam, hydraulic fractures were confined to the coal layer and failed to propagate across the interface into adjacent limestone or mudstone layers [29]. By altering the properties of the fracturing fluid, such as using nanofluids, the complexity of fractures can be enhanced by taking advantage of their thermochemical characteristics, thereby increasing the oil recovery rate [30]. By constructing the coal–transition layer–rock (CFR) composite specimens, it is proposed that the fracture zone gradually shifts from the coal seam to the transition layer, and the acoustic emission position gradually concentrates at the interface between the coal seam and the transition layer [31]. By conducting true triaxial tests on the layered coal rock composite, it was recognized that the uniaxial strength of the composite layered coal rock lies between that of pure sandstone and coal. The direction of the bedding affects the overall strength of the sample, and its true triaxial strength first increases and then decreases with the increase in the intermediate principal stress [32].
Based on the research findings, current studies mainly focus on the fracture propagation laws and mechanical strength of coal seams within coal and rock reservoirs. However, there are still deficiencies in understanding the mechanism of fracture propagation under the complex lithological composition of longitudinal multi-layers. The cross-layer diagrams of different lithologies are shown in Figure 1.
In summary, this study takes the deep coal rock of the Ordos Basin as the research object. Large-scale physical model test specimens were prepared. Using a true triaxial seepage platform to simulate the rock stress state under in-situ geological stress conditions, hydraulic fracturing experiments with perforations in different lithologies were conducted. Combined with scanning and post-fracture 3D reconstruction technology, the longitudinal cross-layer propagation laws of fractures were investigated. This provides guidance for on-site operations in the Ordos Basin.

2. Materials and Methods

2.1. Experimental Materials

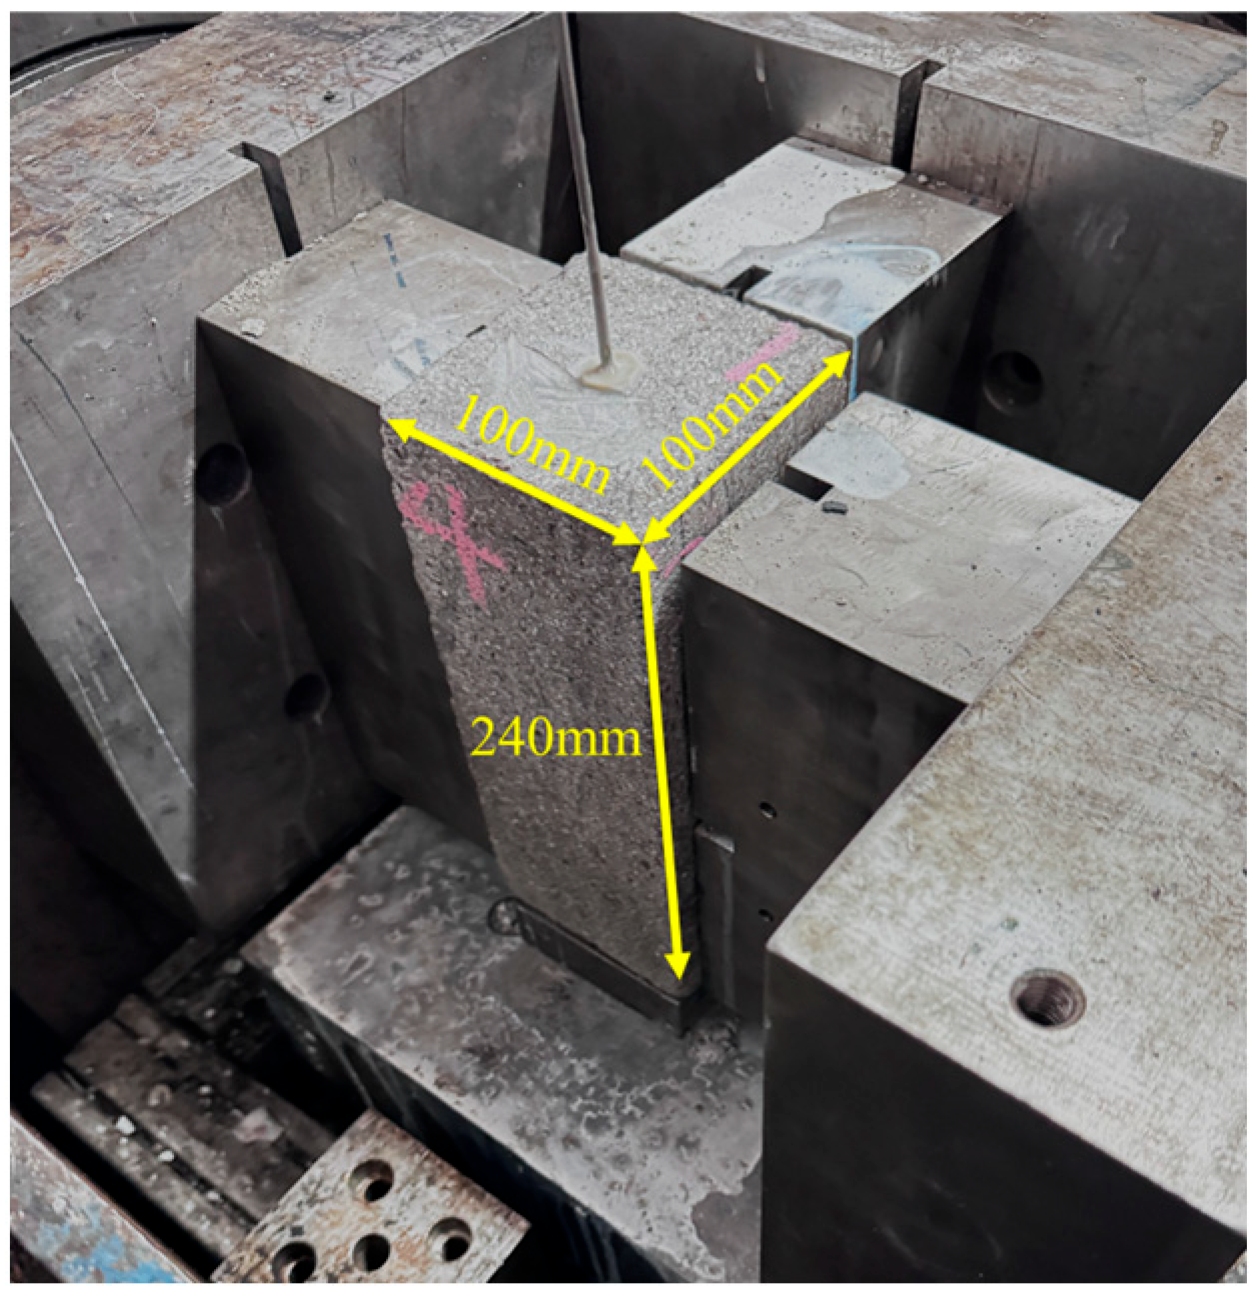
This experiment takes deep coal rock as the research object. Deep coal rock in the Ordos Block and related sandstone and mudstone are selected and cast into 100 × 100 × 240 mm samples, as shown in Figure 2. Boreholes are drilled perpendicularly to the coal rock layer, and the boreholes are used as channels to be buried in the wellbore.
The coal rock is buried relatively deep. The mechanical test results show that under specific confining pressure conditions, the coal rock presents a primary structure, has relatively soft mechanical properties and low compressive strength. The overall experimental results of the sandstone show high rigidity, brittleness and compressive strength, reflecting a dense internal structure and a brittle dominant failure mode. The mechanical properties are shown in Table 1, primarily including the Young’s modulus, Poisson’s ratio, and uniaxial compressive strength (UCS) of deep coal rock.
The main steps for material preparation include sampling, cutting, splicing, pouring, drilling, embedding in the well shaft, and bonding.
(1)
Sampling: The experimental rock samples were all selected from the outcrops of coal rock, sandstone and mudstone in the Ordos area.
(2)
Cutting: To meet the requirements of large physical model test samples, each selected lithologic sample is cut into cylindrical samples with a diameter of 80 mm, and efforts are made to ensure that the surface of the rock sample is flat during the cutting process.
(3)
Splicing: The selected rock samples are longitudinally superimposed in the order of perforation, and different rock types are bonded with strong glue. And to minimize errors as much as possible, keep the bonding surface thin (<2 mm) and flat. Wait until the bonding surface is fully dry.
(4)
Pouring: Place the assembled experimental rock samples into the mold, and pour a thin layer of cement on the outside to form a casting piece of 100 mm × 100 mm × 240 mm. Ensure that the surface of the rock samples is flat during the pouring process to facilitate the subsequent experiments.
(5)
Drilling: After the cement has dried, drill a hole at the center of the upper part of the sample, perpendicular to the coal rock layer. The diameter of the hole is 8 mm and the length is 140 mm ± 5 mm.
(6)
Wellbore installation: The wellbore is embedded inside the sample in the direction of the borehole. The wellbore specification is a liquid injection steel pipe with an outer diameter of 6 mm, and its embedding depth is 120 mm. A 20 mm open hole well section is retained at the bottom of the hole.
(7)
Cementation: Subsequently, high-strength adhesives are used to seal the wellbore and wellbore. To avoid problems such as stress concentration caused by uneven coal and rock surfaces during hydraulic fracturing experiments, two-component adhesives are used to repair the missing corners on the outside of the samples to obtain samples with smooth surfaces. The finished product is shown in Figure 3.

2.2. Experimental Equipment

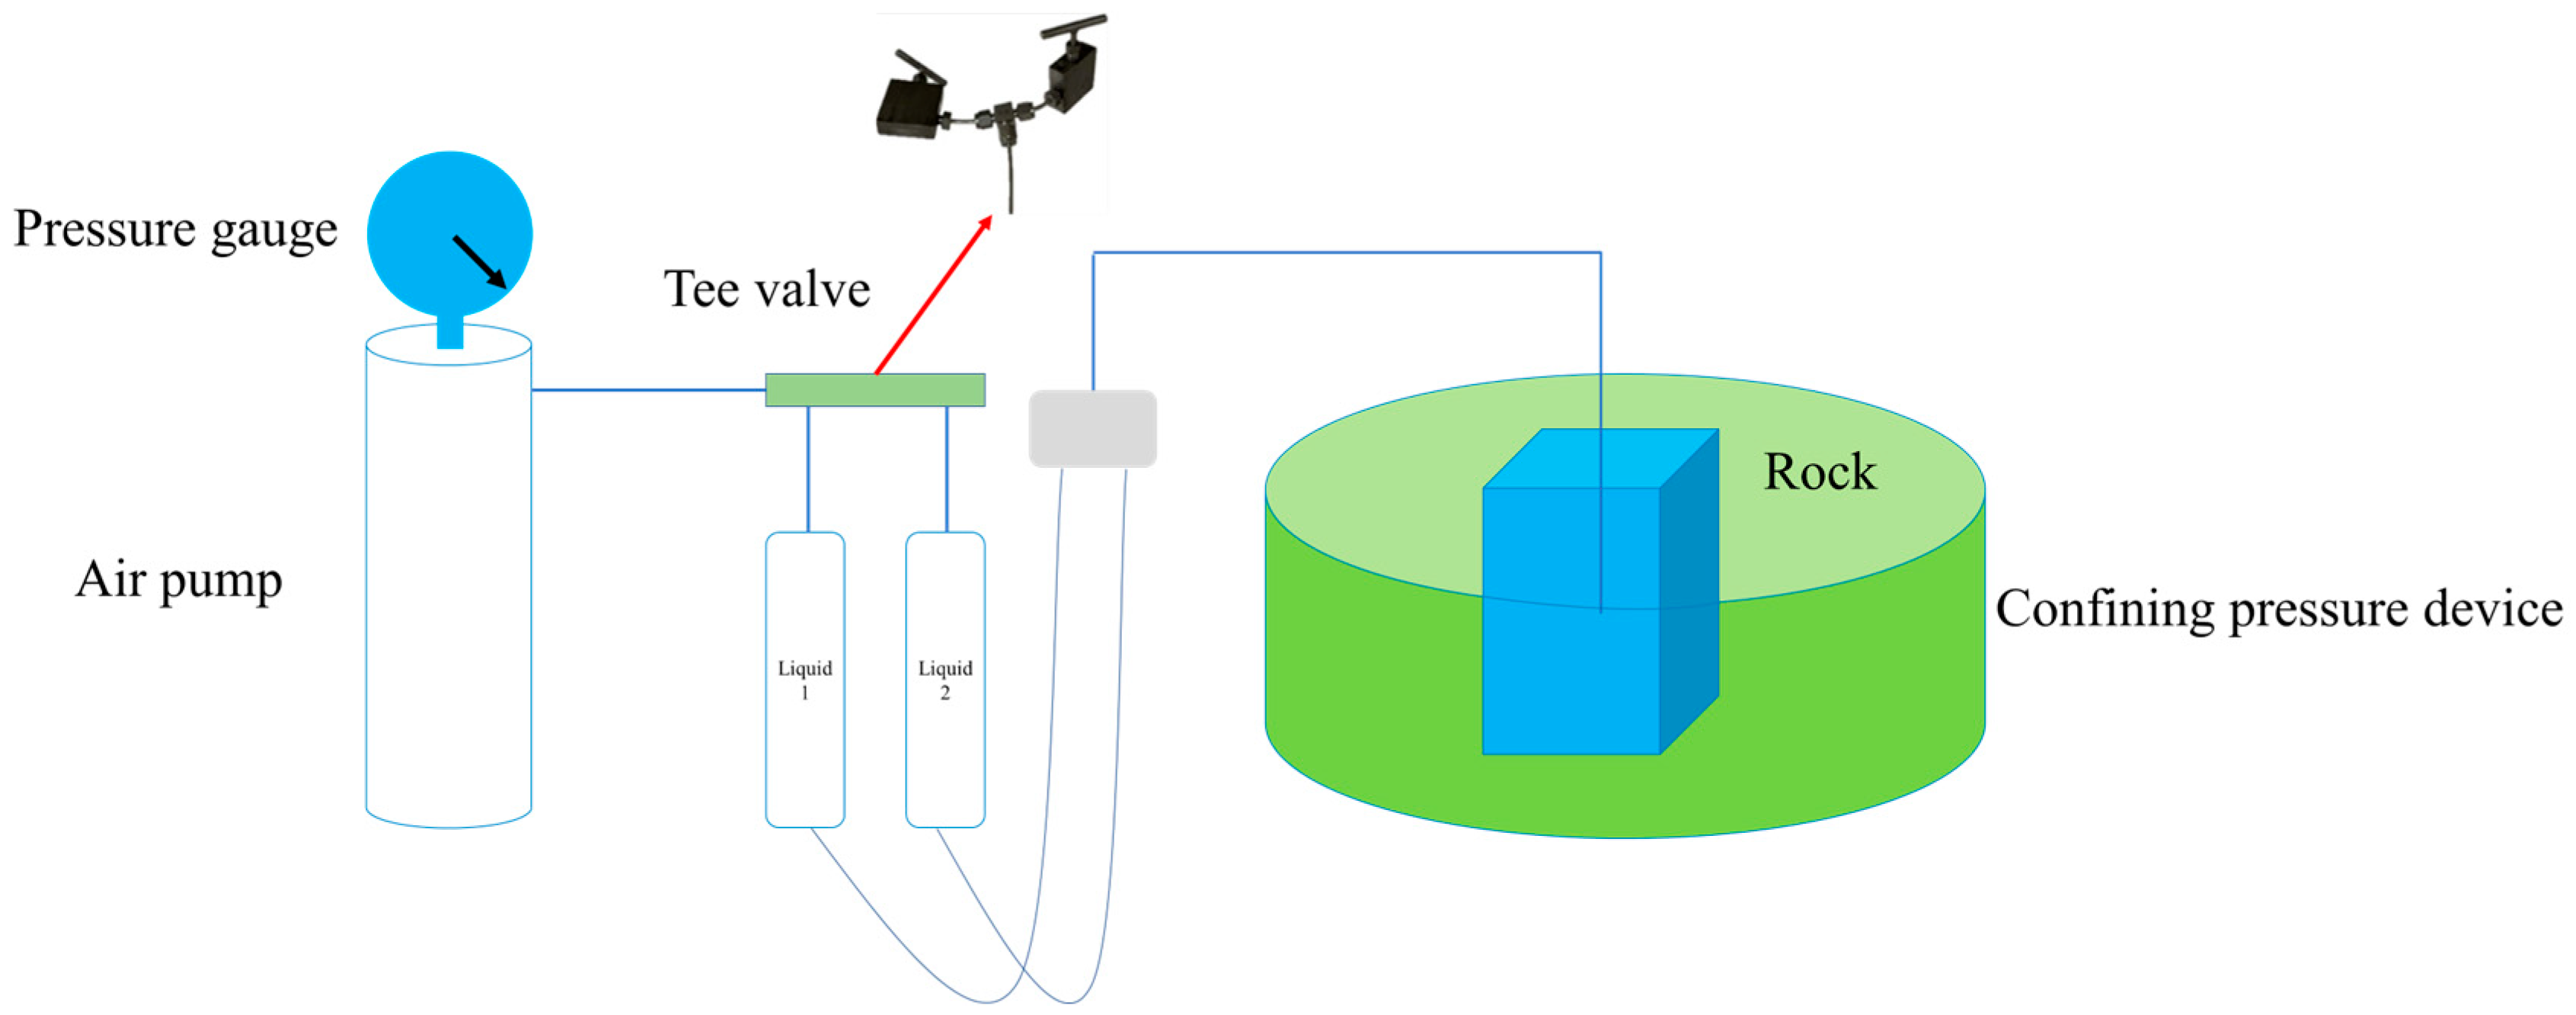
This device can achieve variable viscosity fracturing. By relying on the alternating injection system for fracturing fluids (as shown in Figure 4), this device can switch the viscosity of the fracturing fluid without stopping the pump, thereby realizing the alternating injection of the fracturing fluid. As shown in the figure, the alternating injection system for fracturing fluids consists of an air pump, a three-way valve and a liquid container.
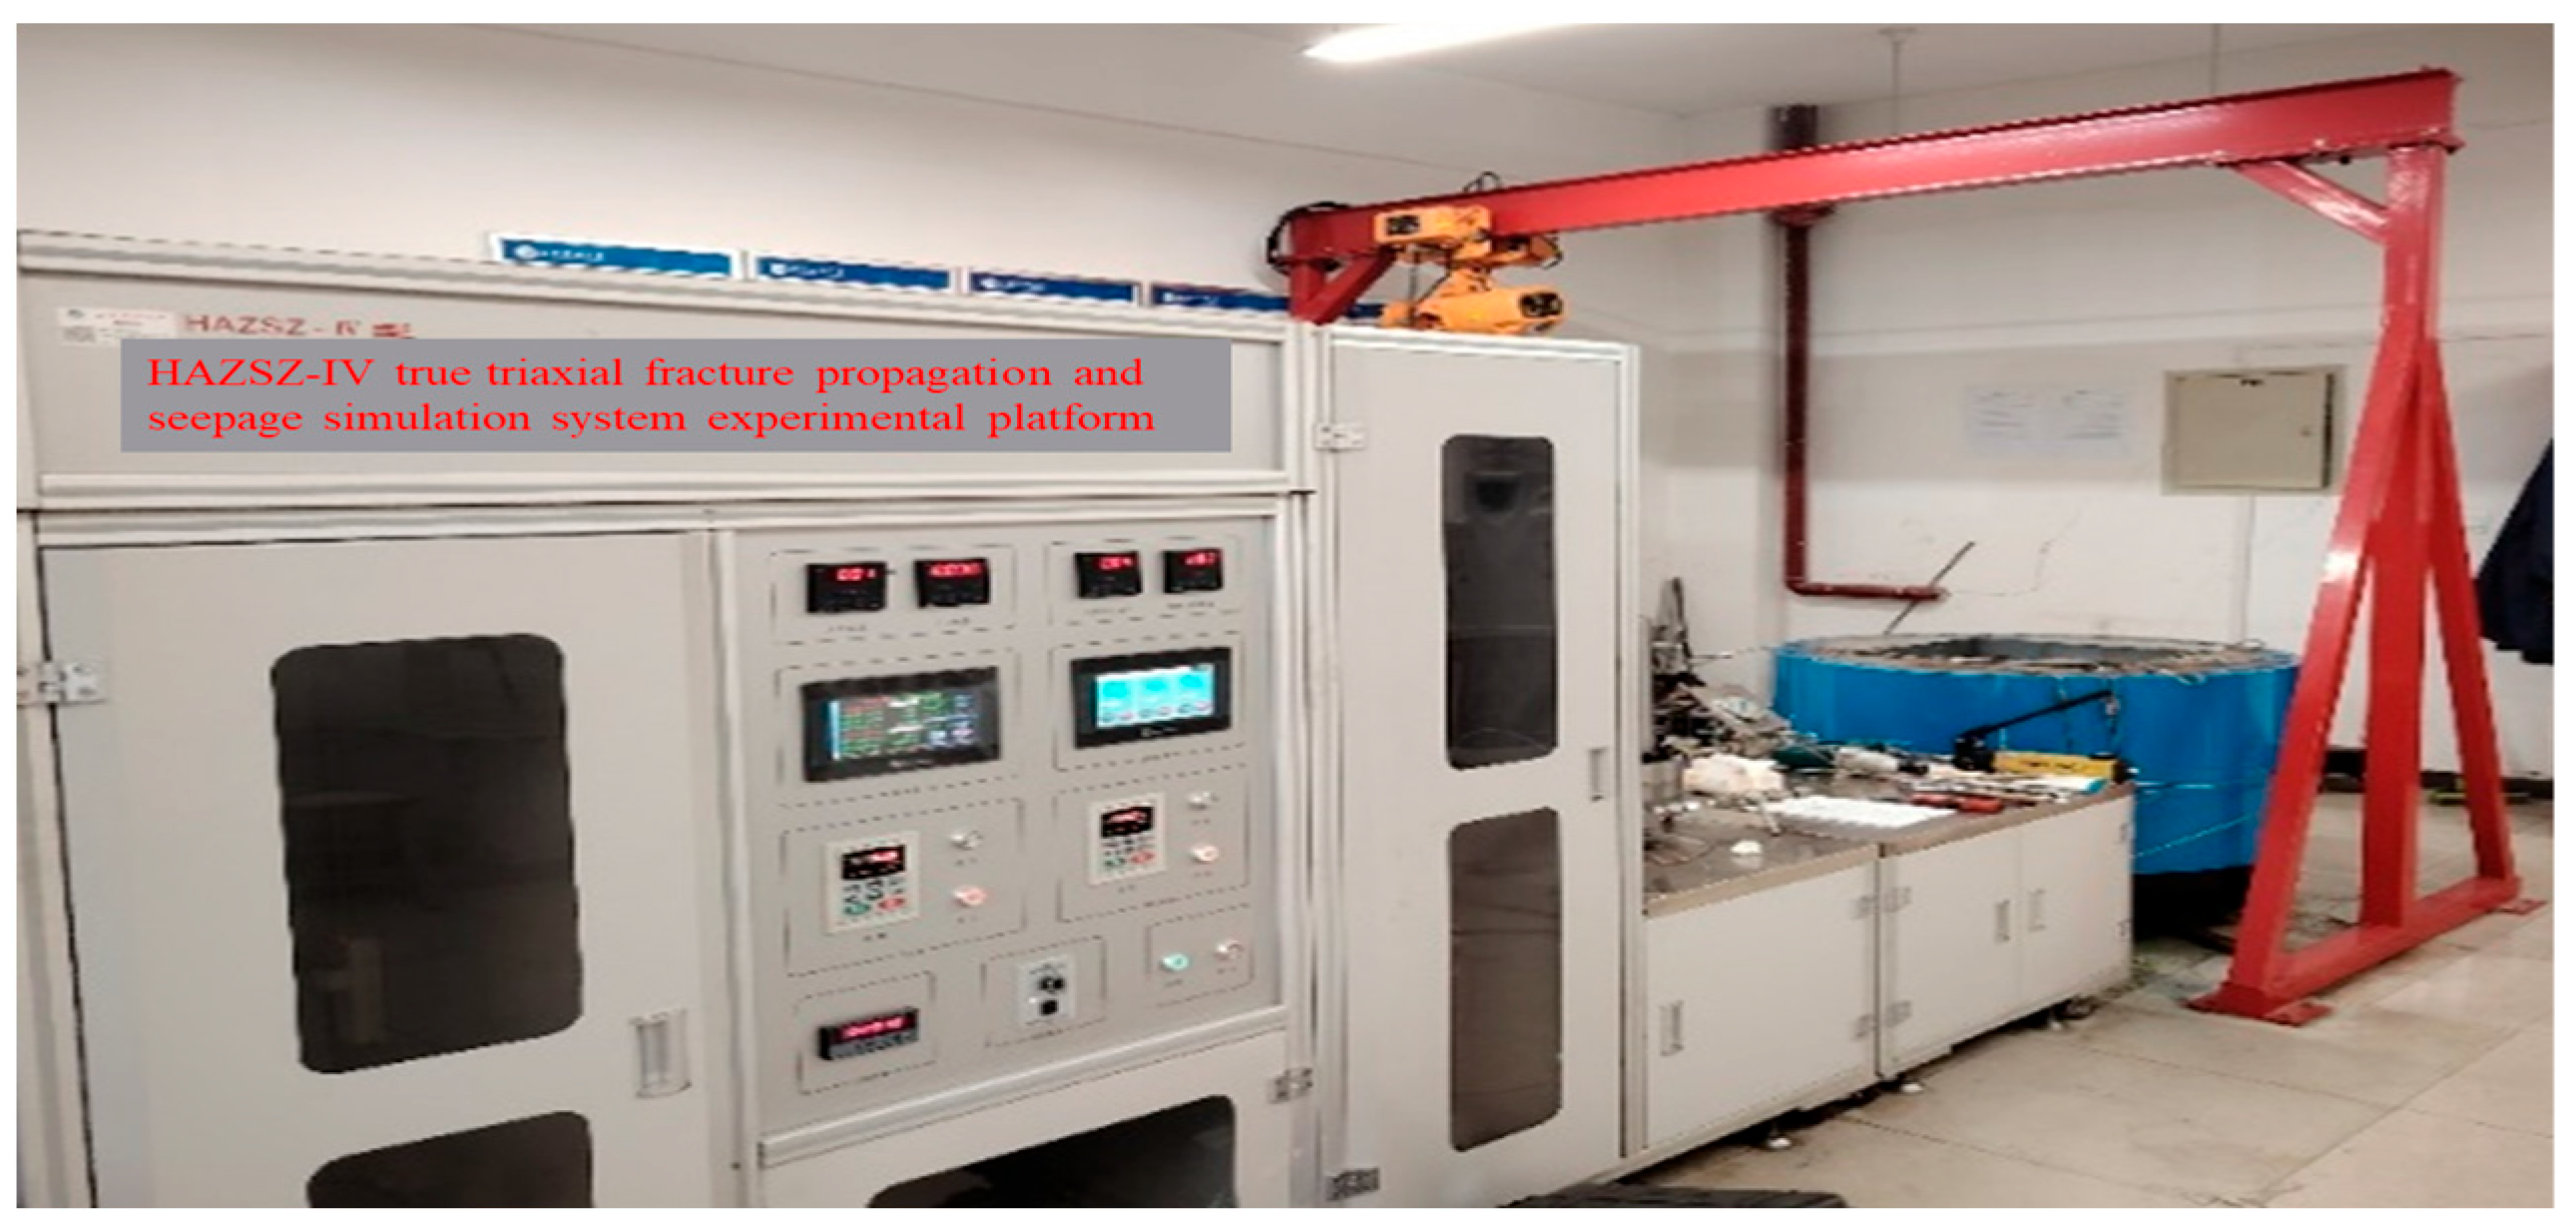
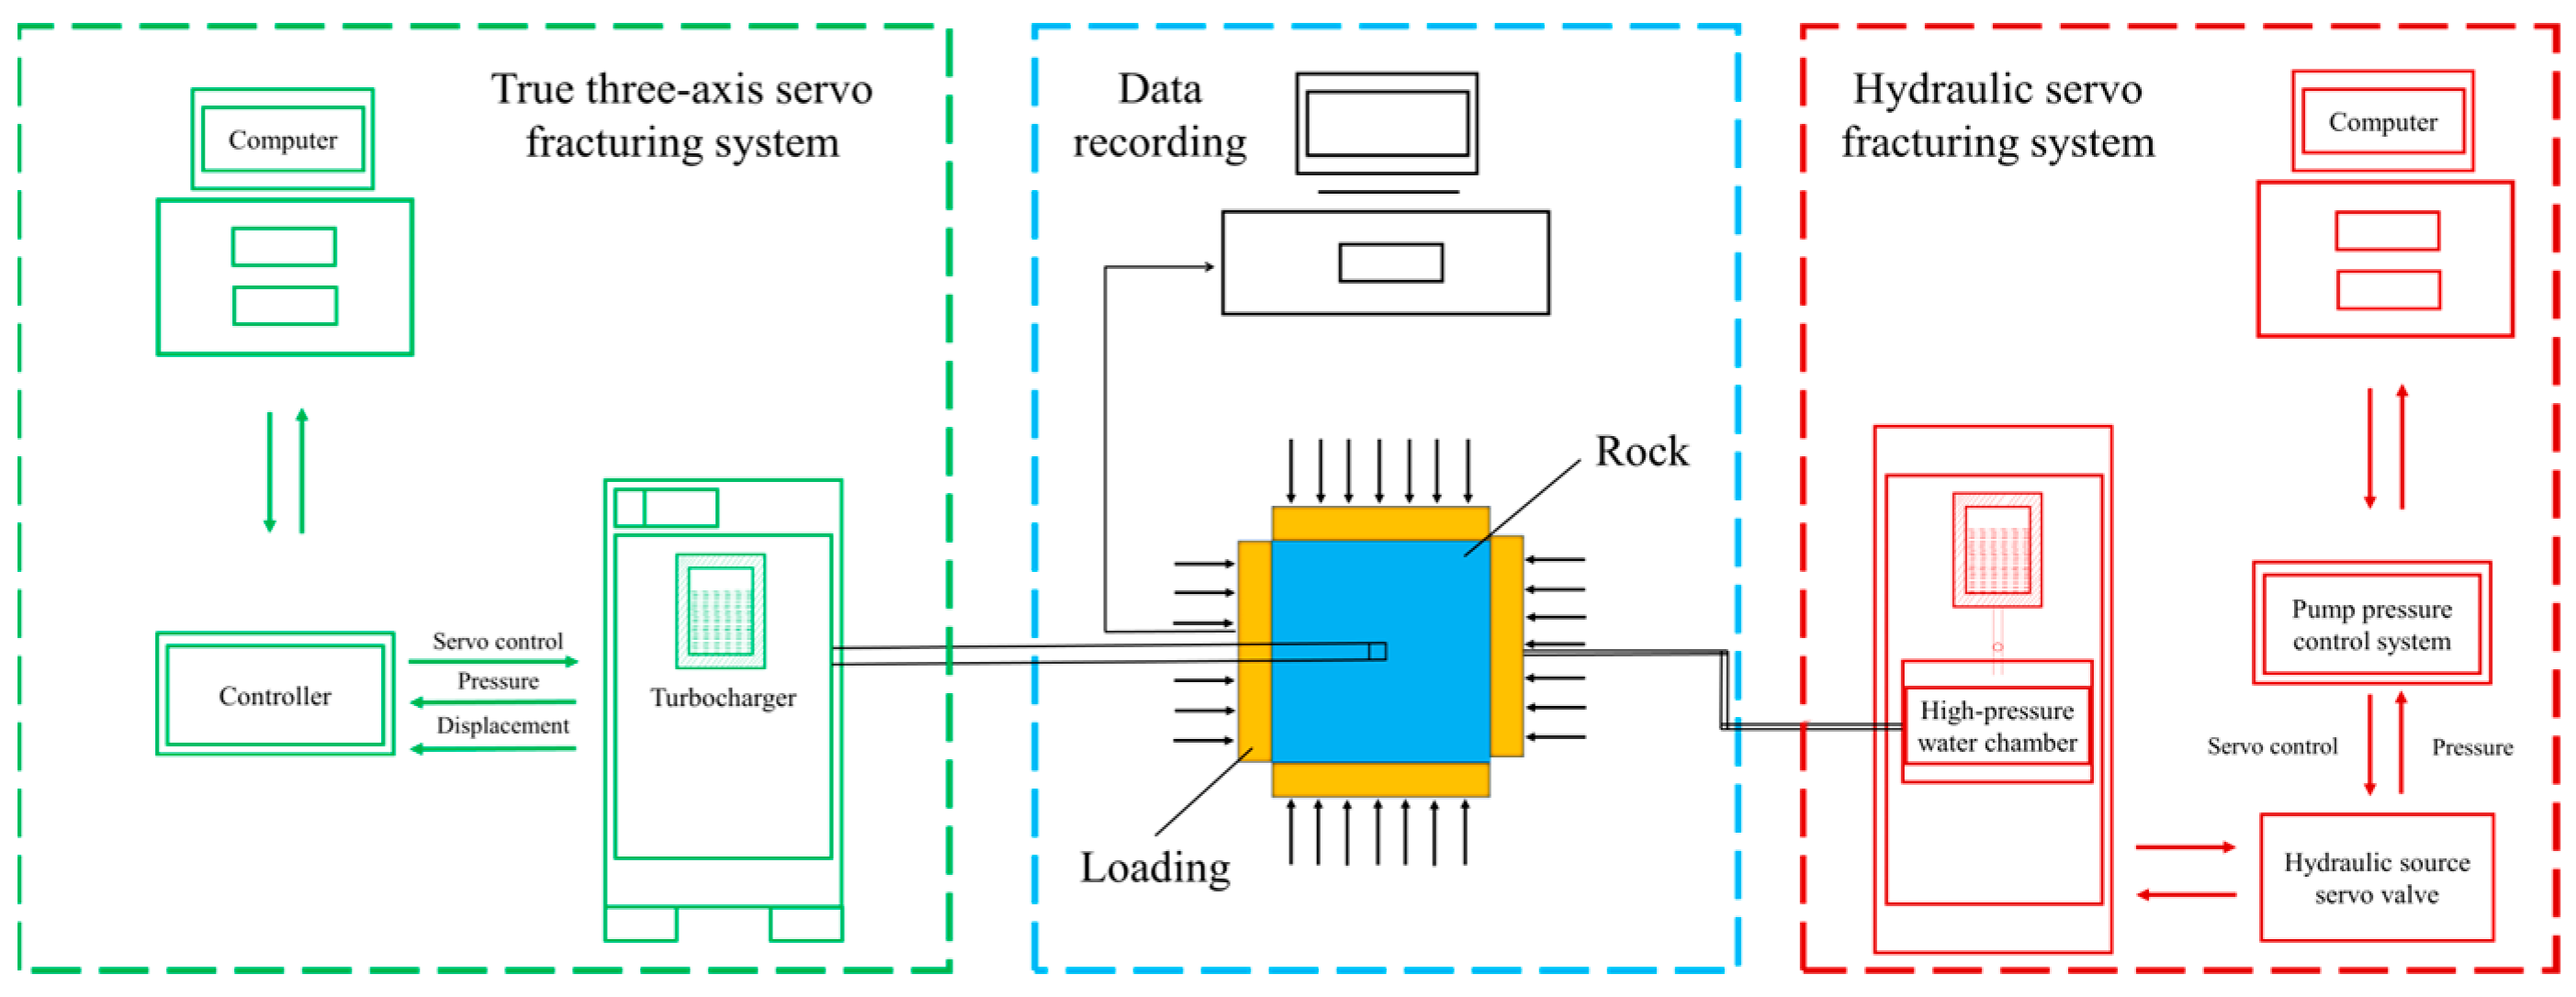
In addition, the hydraulic fracturing experiment was carried out based on the HAZSZ-IV type true triaxial fracture initiation, propagation and seepage simulation system experimental platform (Chengdu Haohan Completion Technology Co., Ltd., Chengdu, China). The system mainly consists of three parts: the true triaxial loading system, the pumping system and the acoustic emission data acquisition system. This platform can continuously pump fluid under true triaxial stress conditions, thereby causing coal and rock to fracture. By simulating the influence of true triaxial environments under different pressures on the propagation of internal fractures in coal and rock, the formation process and laws of hydraulic fractures were studied. The physical equipment is shown in Figure 5, and the schematic diagram is shown in Figure 6. The propagation direction and mechanical effects of hydraulic fractures were analyzed through scanning and detection of rock samples after compression.
The CT scanning equipment in this article is the ZXVoxel D-450 industrial CT system (Chengdu Tait Runbo Testing Technology Co., Ltd., Chengdu, China). The imaging area is 409.6 mm × 409.6 mm. The maximum weight of the inspected workpiece can reach 100 kg, and the resolution is 70 µm. The reconstruction method is that the rays pass through objects of different materials, densities and thicknesses, and the attenuation of the rays varies after passing through. During the 360-degree rotation of the sample, the two-dimensional image obtained is penetrated by the rays. The acquisition system imports two-dimensional images into the data reconstruction software, and then generates three-dimensional visual data through algorithm calculation from the two-dimensional data.

2.3. Experimental Procedure

This experiment prepared a total of 2 rock samples. Based on statistical data of the stress conditions in the Ordos Block, the ratio of horizontal stress differences is 0.78, and the differential coefficient of the vertical principal stress is 0.63. The triaxial stresses for the deep coal rock samples at the laboratory scale were determined as 7.5 MPa, 9.5 MPa, and 12 MPa. Within the triaxial stress chamber, computer control was used to independently apply the vertical stress, maximum horizontal principal stress, and minimum horizontal principal stress.
To match the displacement rate with the stress conditions, and considering the limitations of the HAZSZ-IV true triaxial apparatus, the experimental displacement rate was set to 10~20 mL/min, and the fracturing fluid viscosity was set to 20~40 mPa·s.
Sample 1 is a sand-coal composite rock sample, and sample 2 is a sand–coal–mud composite rock sample. To simplify the description, in the subsequent figures, Sample 1 and Sample 2 correspond respectively to 1# and 2#. The specific parameters are listed in Table 2. The experimental procedure for this test is illustrated in Figure 7.

3. Results

3.1. Pre-Fracture Fracture Distribution Pattern

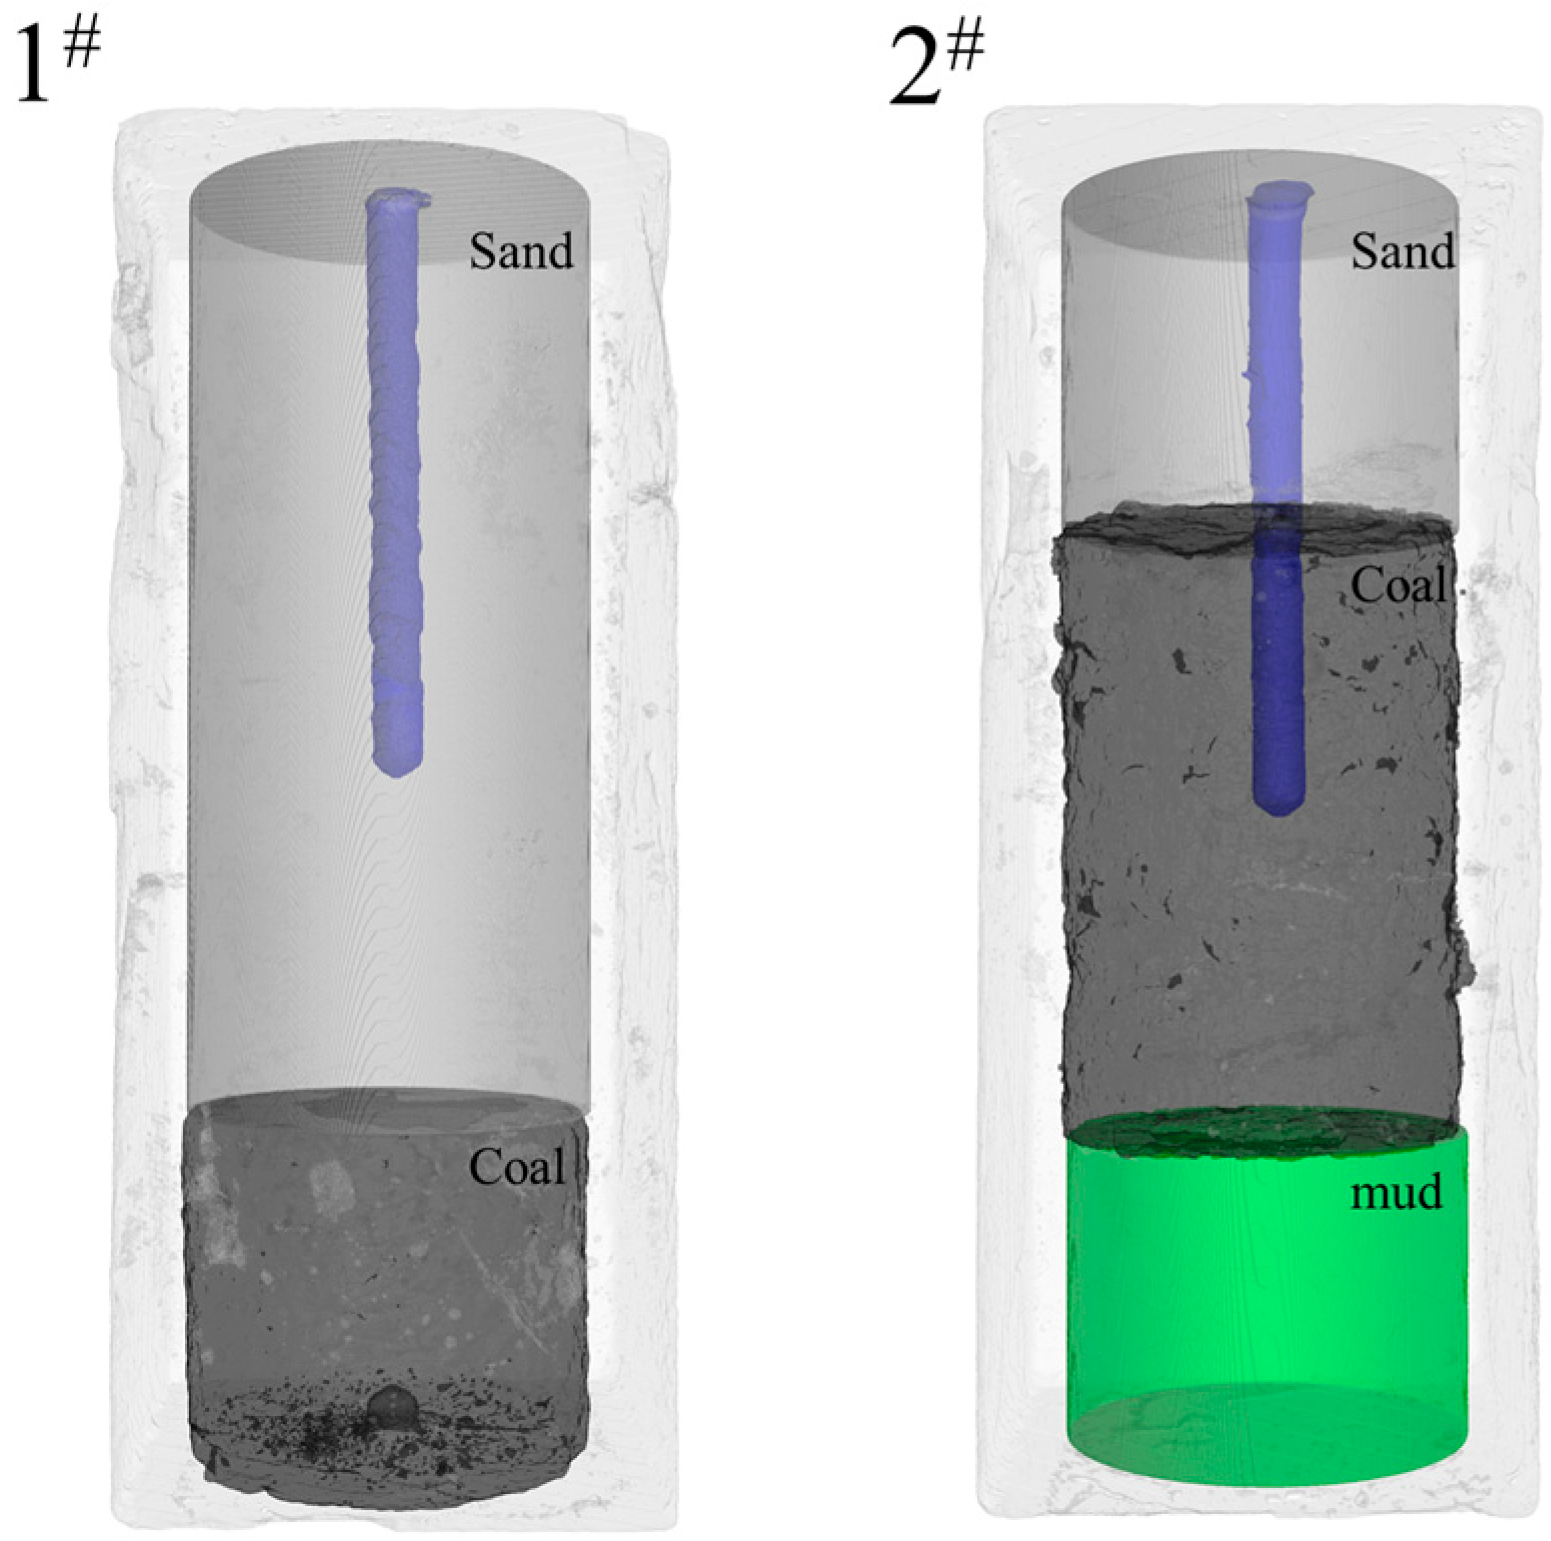
Before fracturing, it can be seen from the rock sample scanning images that large-scale fractures did not develop inside the rock samples. The wellbore is centrally located, with even interfaces between different rock layers, well-cemented bonds, no internal dislocation observed, and the poured cement providing effective stabilization. From top to bottom, Sample 1 was composed of sand-coal rock, and there were no obvious fracture distributions inside Sample 1. Sample 2 was composed of sand-coal and mudstone, and there were no obvious fracture distributions inside Sample 2. The results of the natural fracture scan for the sample are shown in Figure 8.

3.2. Pressure Curve Analysis

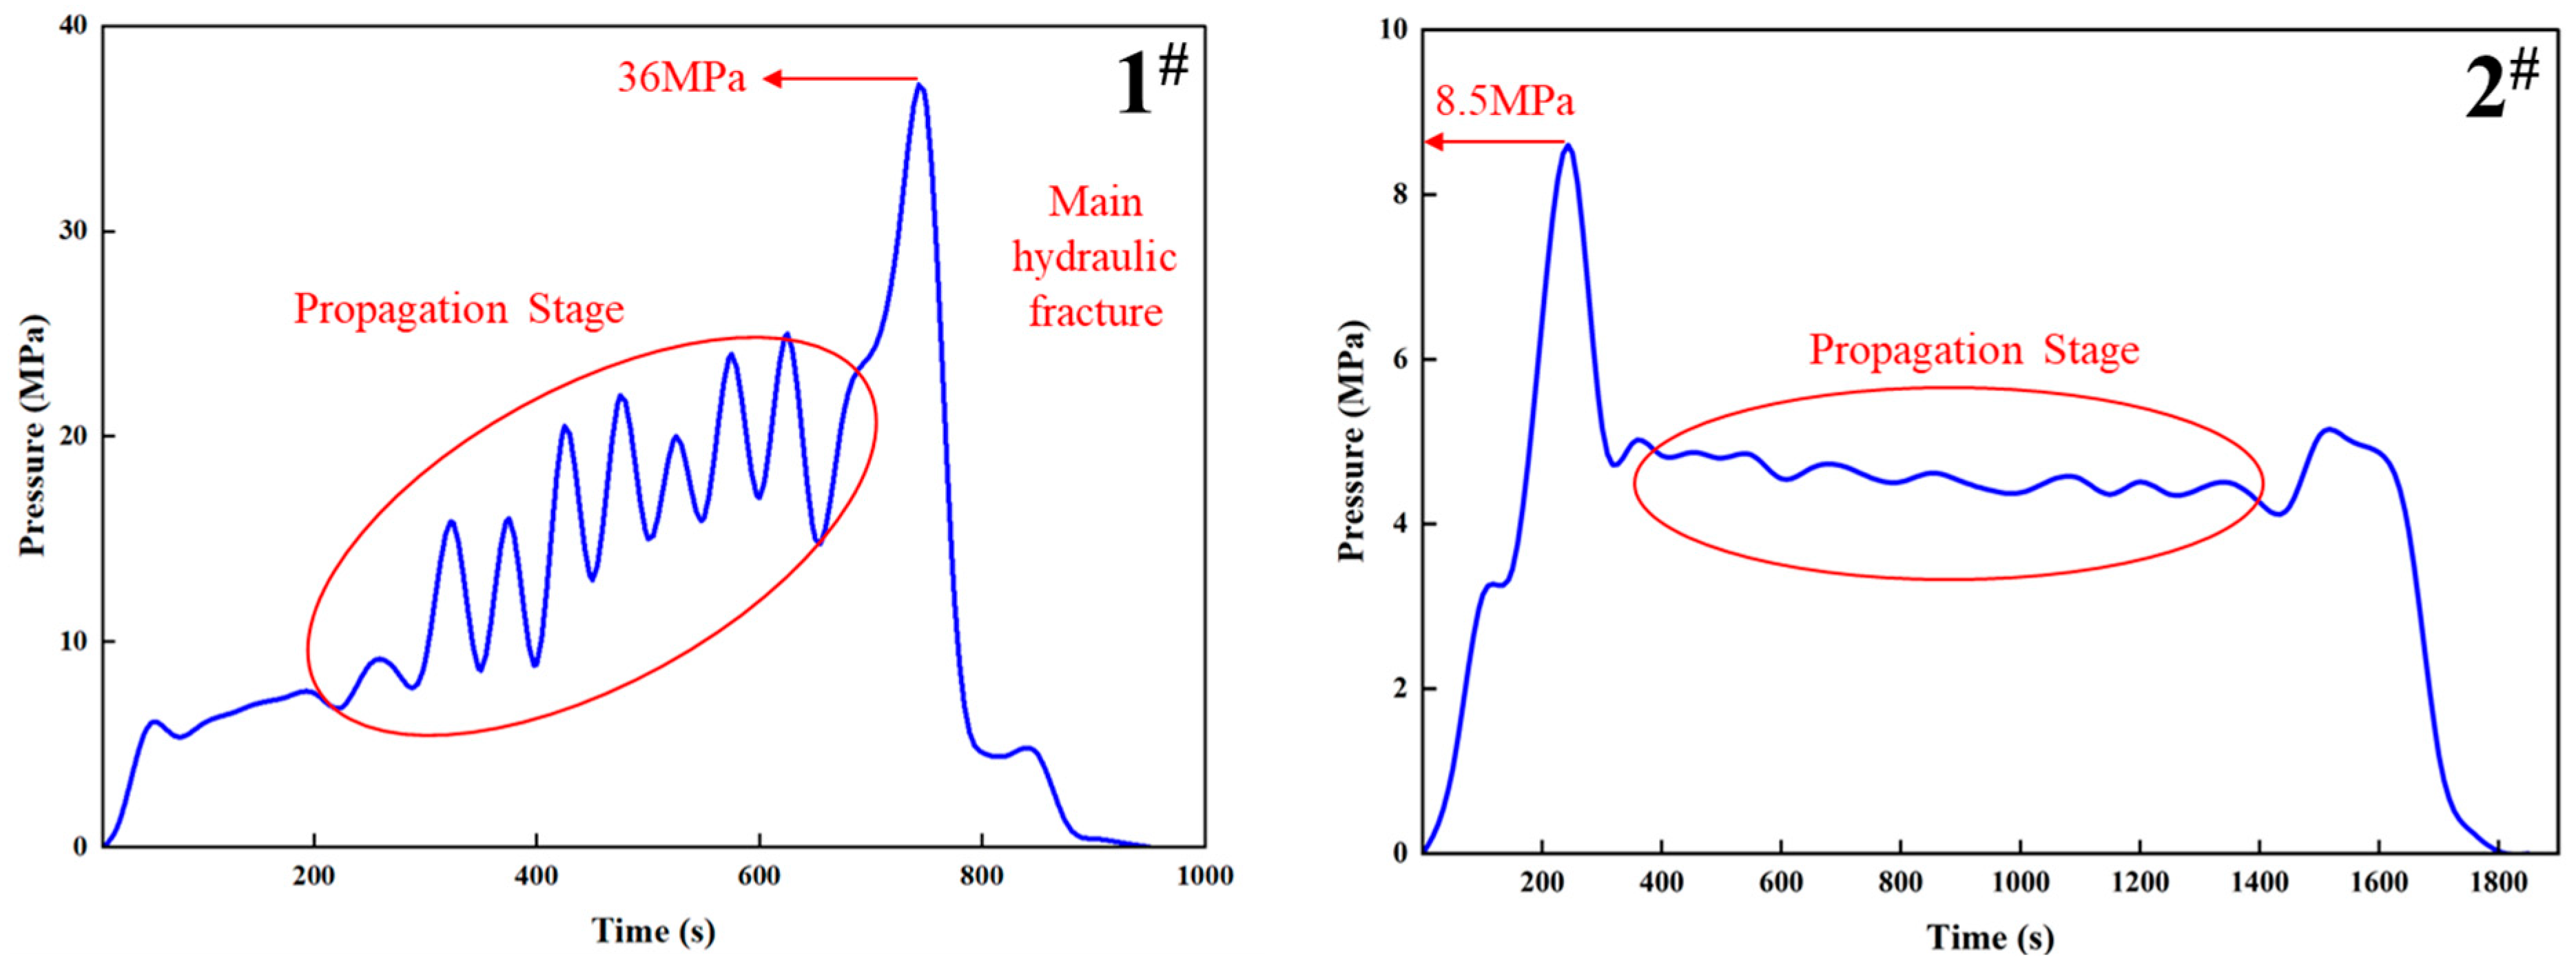
Observing the pressure curve for sample 1 in Figure 9, it can be seen that as the fracturing fluid was injected, the pressure curve rose rapidly and pressure buildup began. When the pressure reached 9.5 MPa, the fracture stage begins, indicating that the fracture is located near the wellbore. Following the rupture of the deep coal rock, the pressure dropped sharply. This was followed by repeated pressure buildup-rupture cycles, marking the fracture propagation phase. During this phase, the fluctuating pressure ranged between 8.50 and 24.50 MPa, with significant fluctuations. At 750 s, the pressure peaked at 36 MPa. Subsequently, the pressure began to decrease rapidly, indicating that a main hydraulic fracture had formed within the rock, the fluid broke through the sample boundary, the sample ruptured, and the experiment concluded.
Observing the pressure curve for sample 2 in Figure 9, it can be seen that as the fracturing fluid was injected, the pressure curve rose rapidly and pressure buildup began. At 250 s, a distinct rupture pressure point (8.5 MPa) appeared on the pressure curve of sample 2. The pressure then dropped by approximately 3.3 MPa, entering the fracture propagation phase. During this phase, the fluctuating pressure was relatively stable within a narrow range of 4.10 to 5.00 MPa. Pressure buildup then continued to 5.27 MPa, at which point a complex hydraulic fracture network formed within the rock, the fluid broke through the sample boundary, the sample ruptured, and the experiment concluded.
In summary, during the fracture propagation phase, the fluctuation amplitude was significantly larger for sample 1, with a fluctuation range reaching 16 MPa. In contrast, the pressure fluctuations for sample 2 were smaller, and its maximum rupture pressure was much lower than that of sample 1. The reason for this lies in the overall poorer mechanical properties of the deep coal rock in sample 2. Furthermore, due to the presence of a natural fracture system, perforation within the coal rock enabled the pressure inside the fracture to rapidly reach the level required to open these pre-existing natural fractures. Consequently, large-scale hydraulic fracturing did not occur extensively within the sample. Preferential opening of natural fractures and other dominant flow paths occurred. For sample 1, which was perforated in sandstone, the higher mechanical strength and the absence of internal weak planes resulted in a rupture mode primarily characterized by fracturing through the rock matrix rather than along weak planes. This explains why the overall pressure magnitudes were significantly higher for sample 1 compared to sample 2.

3.3. Failure Characteristics Analysis

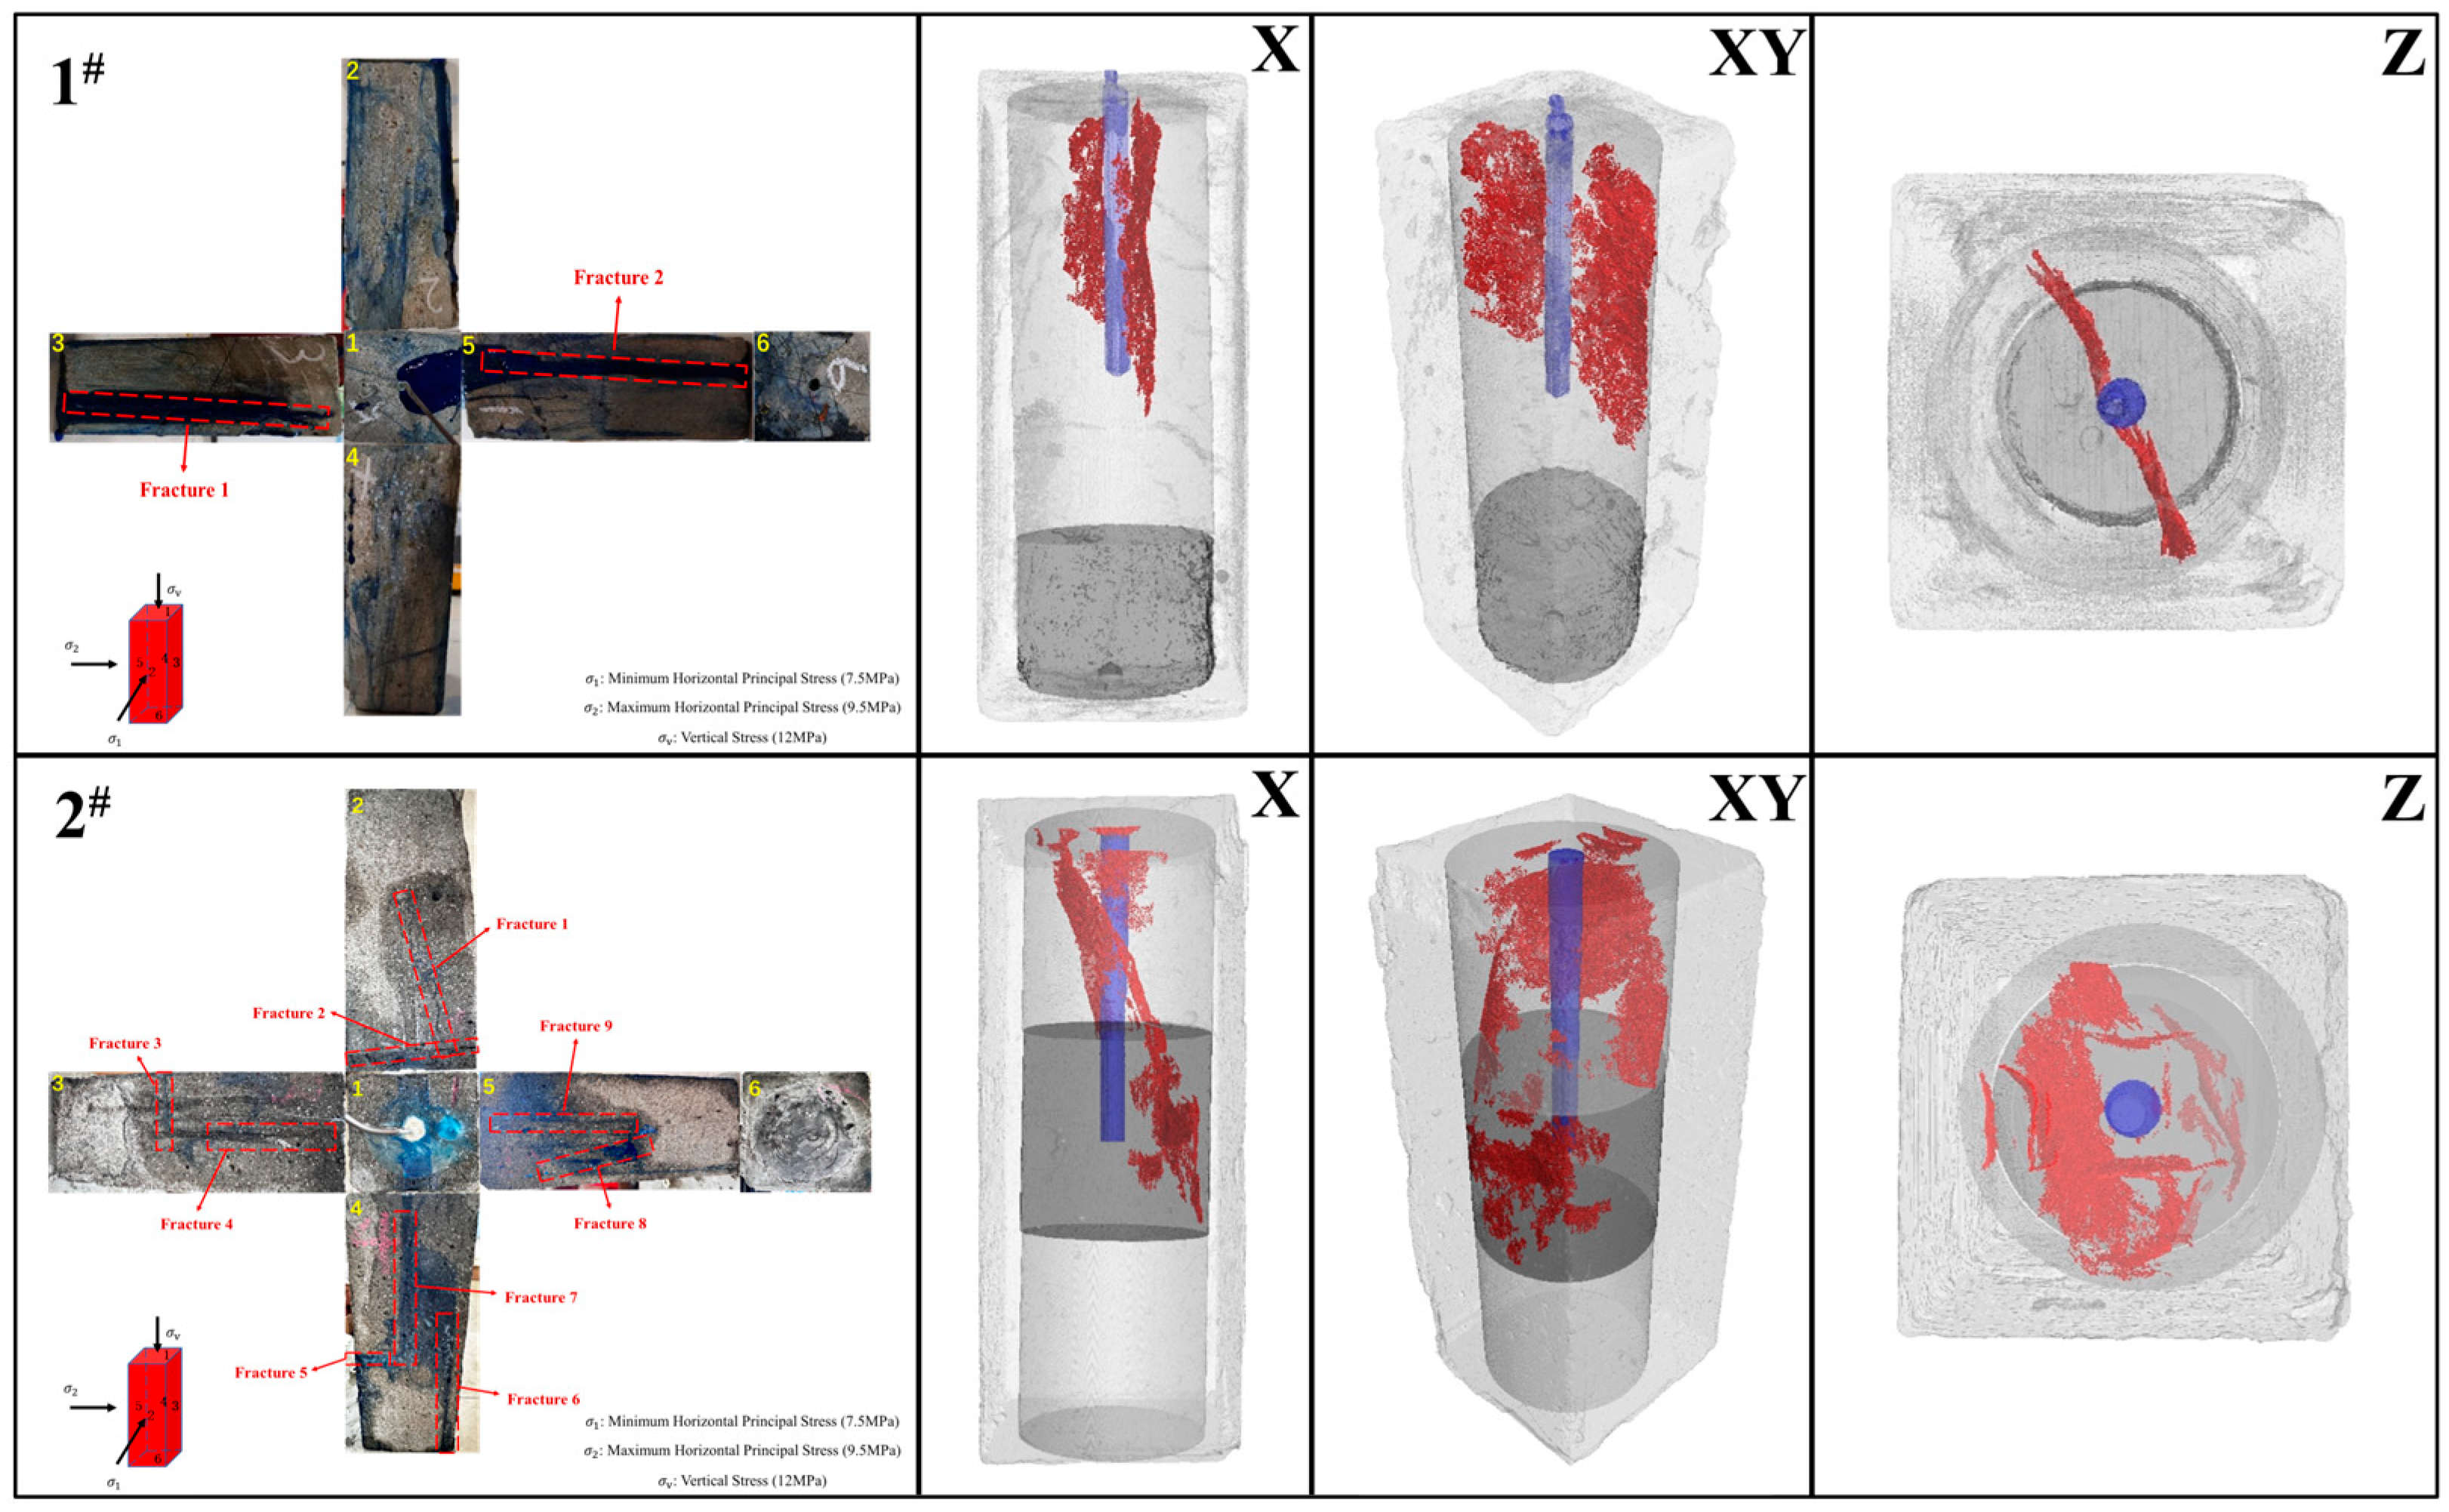
Observation of the post-fracture sample 1 and its fracture reconstruction pattern (Figure 10) reveals a relatively simple overall fracture network. Among them, the minimum horizontal principal stress is 7.5 MPa, the maximum horizontal principal stress is 9.5 MPa, and the vertical stress is 12 MPa, which act on each surface of the rock, respectively. The X direction aligns with the minimum horizontal principal stress direction, the XY direction lies between the directions of the minimum and maximum principal stresses, and the Z direction aligns with the vertical stress direction. Apart from the top and bottom surfaces, fracturing fluid egress occurred only from surface fractures on two side faces in the horizontal direction. This indicates that under the sandstone perforation scheme, the sandstone lacks complex structural weak planes and possesses high mechanical strength. Consequently, no significant external hydraulic fractures formed on the sample surfaces. Internally, the fracturing fluid created a single, vertically oriented main hydraulic fracture. Multi-angle observations confirm that fracturing in the deep coal rock sample 1 did not generate a complex fracture network. Fracture creation primarily resulted from failure through the sandstone matrix. Furthermore, perforation and fracturing within the sandstone failed to establish connectivity with the coal rock; fractures were confined solely to the sandstone layer.
Observation of the post-fracture sample 2 and its fracture reconstruction pattern (Figure 10) shows that the primary fluid egress zones are distributed across all four side faces, with numerous external fractures present. No fluid egress was observed on the top and bottom surfaces. This demonstrates that under the coal rock perforation scheme, the pre-existing natural weak planes facilitated the formation of a complex internal fracture network. Combined with the fracture reconstruction results, it is evident that under the coal rock perforation experimental conditions, the activation of these weak planes led to the development of a complex fracture network. The fractures are predominantly oriented vertically. Critically, fractures within the coal rock are connected with the adjacent sandstone layer, forming continuous fractures. Effective fracture creation was achieved within both the sandstone and coal rock layers.
Due to the well-developed natural fracture system in coal and rock, which is in a closed state under the original in-situ stress conditions, coal rock usually has a relatively low fracture toughness (KIC), which means that its natural fracture system is more easily activated. Under a lower net pressure within the fracture, the equivalent stress intensity factor is more likely to reach the critical fracture toughness value of coal rock. When the fracturing fluid is injected into the formation, because the natural fractures have a low friction coefficient and are easy to open, they will preferentially communicate with the natural fractures. The existence of the natural fracture system in coal and rock often leads to the expansion of natural fractures in coal and rock. A complex fracture network is formed in combination with the action of ground stress.
The above results indicate that when fracturing fractures encounter existing natural fractures and other discontinuous media, when the stress intensity factor within the fracture reaches the critical value and the fracture toughness is overcome, the hydraulic fractures will expand along the natural fractures, further enhancing the communication between the hydraulic fractures and the natural fractures. Meanwhile, perforation in coal rock can play a role in communicating with adjacent sandstone layers. Achieve the effect of multi-layer fracturing to form a complex fracture network.

4. Analysis of Fracturing Control Factors

4.1. Effect of Natural Fractures

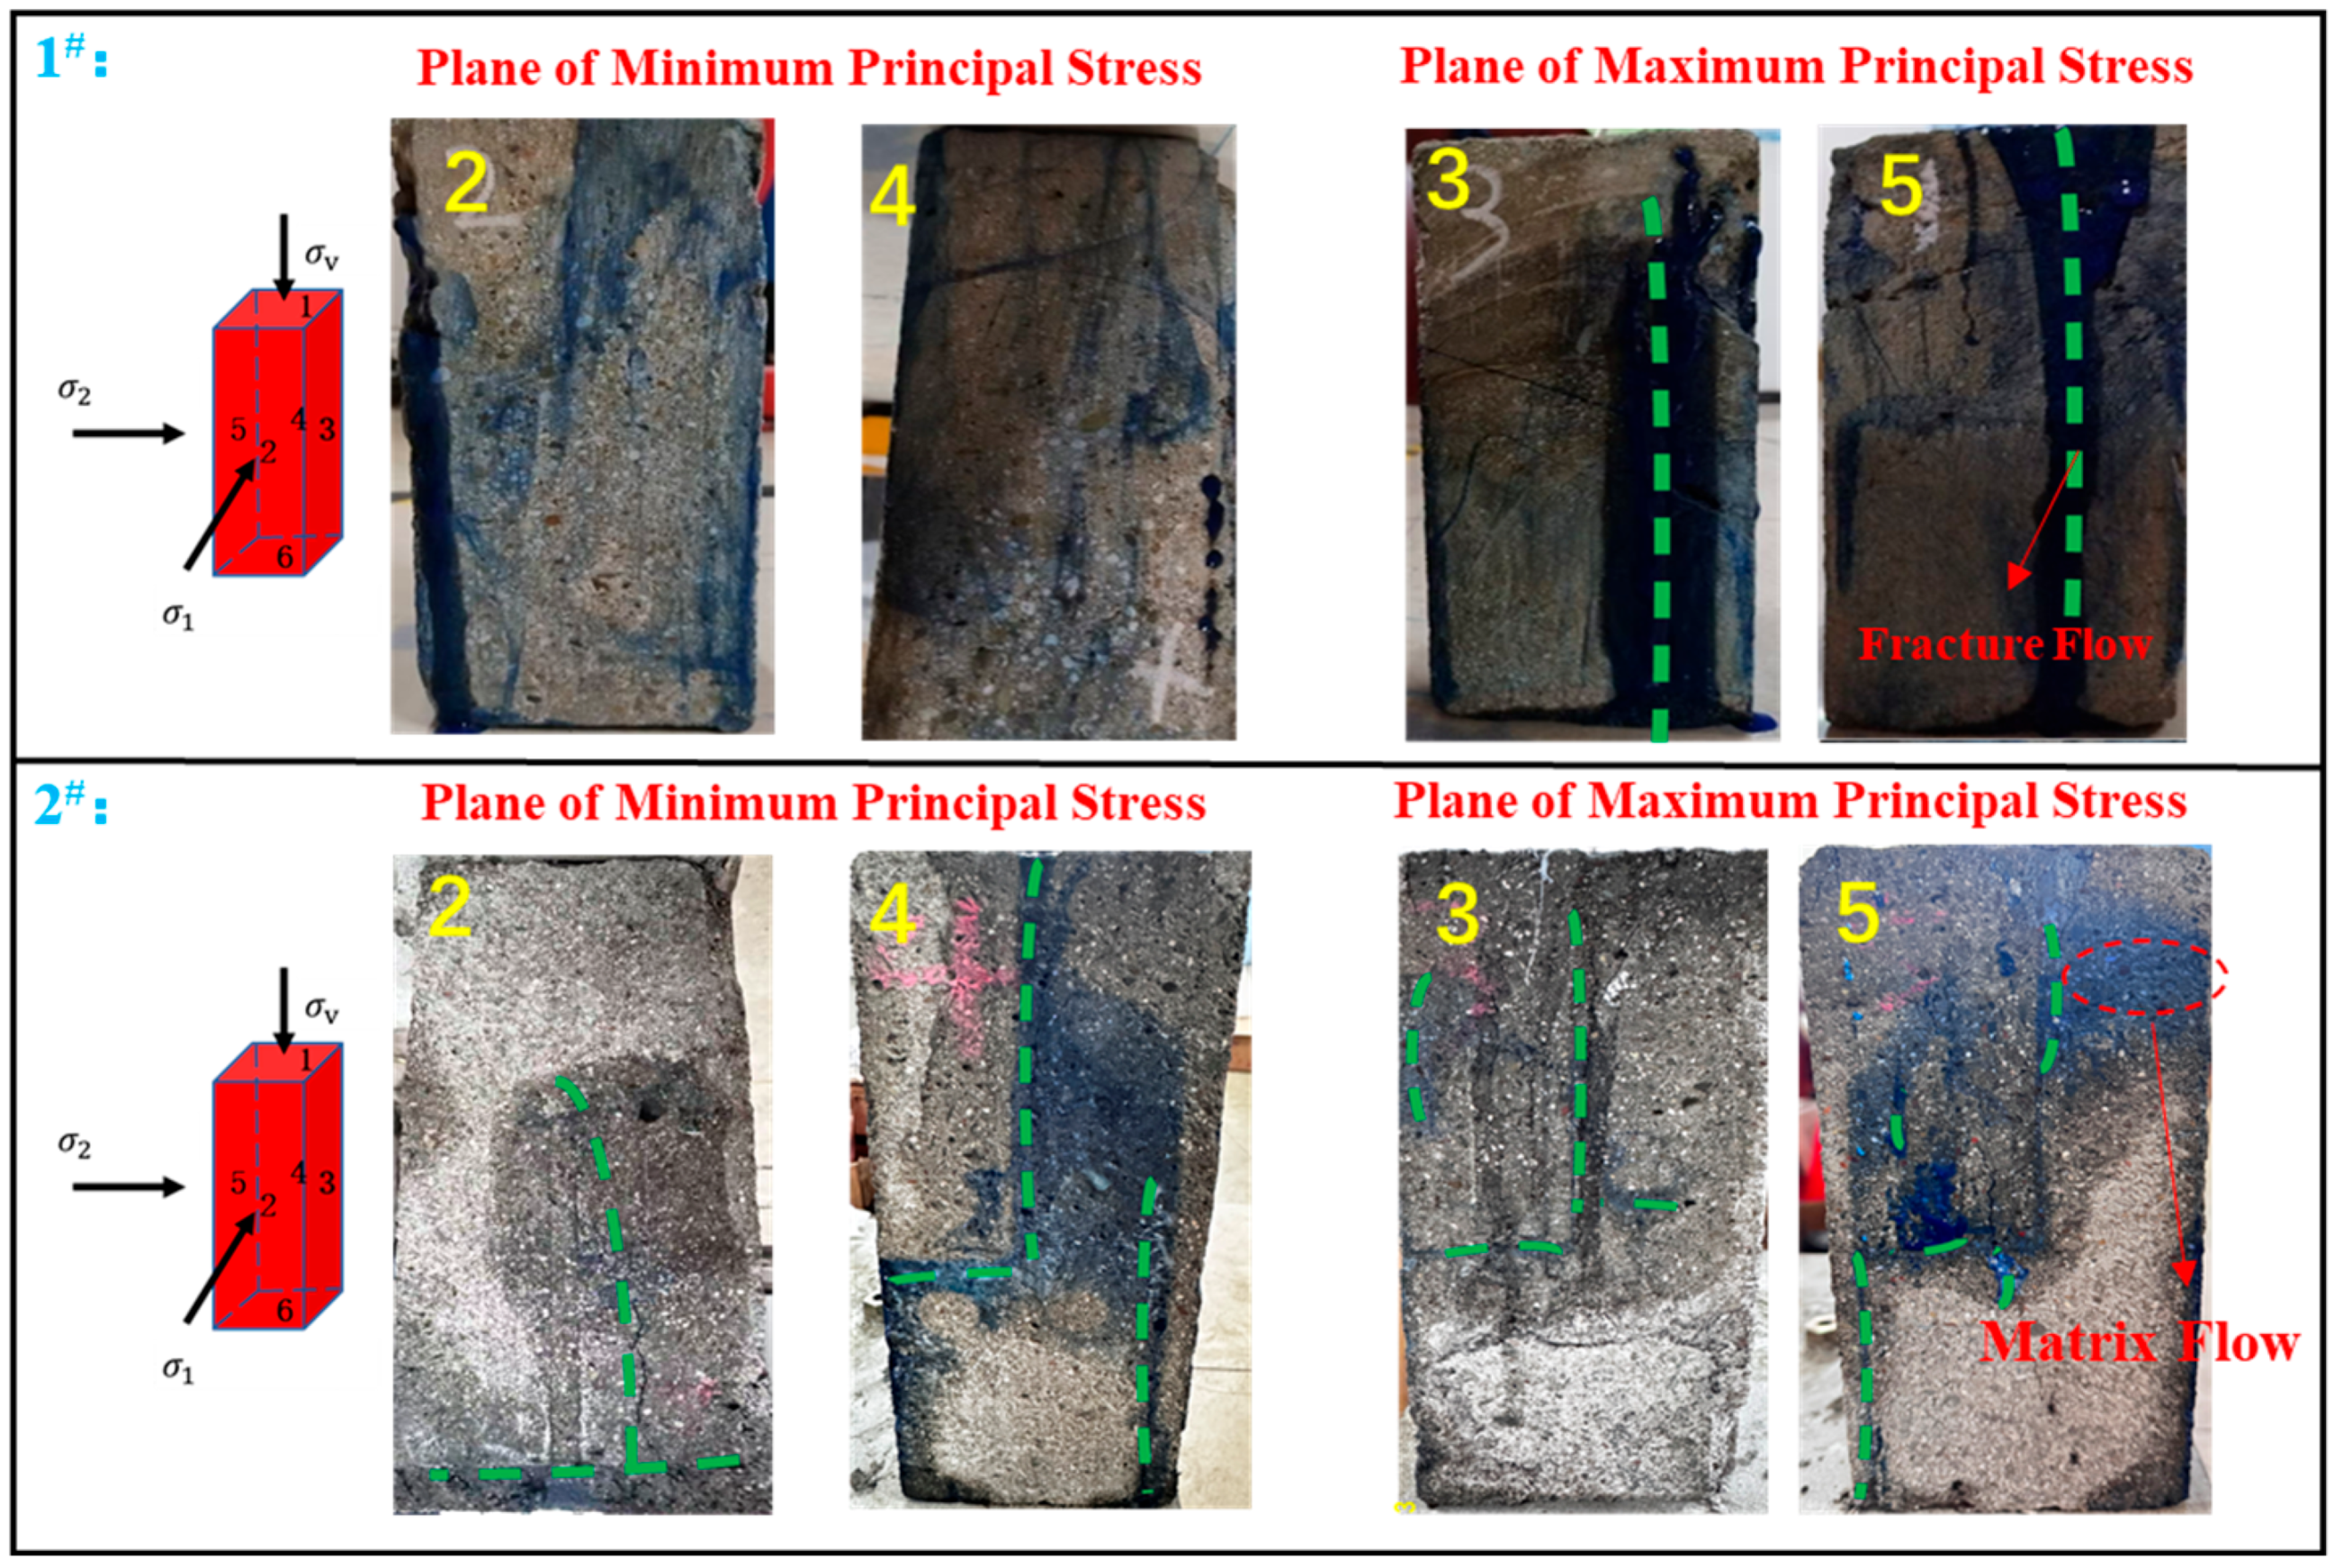
Deep coal seams are typically naturally fractured, and the presence of these natural fractures significantly influences the effectiveness of hydraulic fracturing. Figure 11 shows the fracture distribution after fracturing in sample 1 and sample 2. Among them, 2 and 4 are the minimum horizontal principal stress action surfaces, and 3 and 5 are the maximum horizontal principal stress action surfaces. The definitions of different surfaces are shown in the red schematic diagram on the left side of Figure 11. The green dashed lines represent fluid-producing fractures. It can be observed that the fractures primarily propagate along the direction of the maximum principal stress, with cleat opening being the dominant mode of propagation.
Due to the well-developed cleat system in coal, fractures tend to propagate along these planes of weakness under various fluid viscosities and injection rates. The plane of maximum principal stress exhibits the highest density of fluid-producing fractures, though some fracturing fluid also exudes through the matrix surface. The presence of natural fractures often leads to hydraulic fractures connecting and extending through these pre-existing discontinuities.
This behavior results in highly complex fracture propagation, forming an extensive fracture network. When a hydraulic fracture intersects a natural fracture, it may either continue propagating along its original direction or branch and extend along the natural fracture. This dual mechanism significantly enhances the stimulated reservoir volume.

4.2. Effect of Fracturing Fluid Injection Parameters

Through a comparative analysis of fracture after fracturing under different fracturing fluid viscosities (Figure 12), the results indicate a correlation between fracturing fluid viscosity and fracture. When a fracturing fluid with a viscosity of 40 mPa·s was used, the low-viscosity fluid more readily infiltrated the natural fracture system, activating a greater number of natural fractures and resulting in the formation of a complex fracture network. In contrast, when the viscosity was increased to 80 mPa·s, the propagation tended to form a single dominant fracture with limited communication with natural fractures such as cleats. Under low-viscosity conditions, the fracturing process was primarily controlled by the natural fracture system (e.g., cleats and bedding planes), leading to the development of a complex fracture network. As the viscosity of the fracturing fluid increased, the in-situ stress state and rock anisotropy exerted greater influence on fracture propagation, collectively guiding the propagation of fractures along the path of least resistance. Consequently, the fractures generated with high-viscosity fluid exhibited a simpler geometry and significantly lower complexity compared to those formed under low-viscosity conditions.
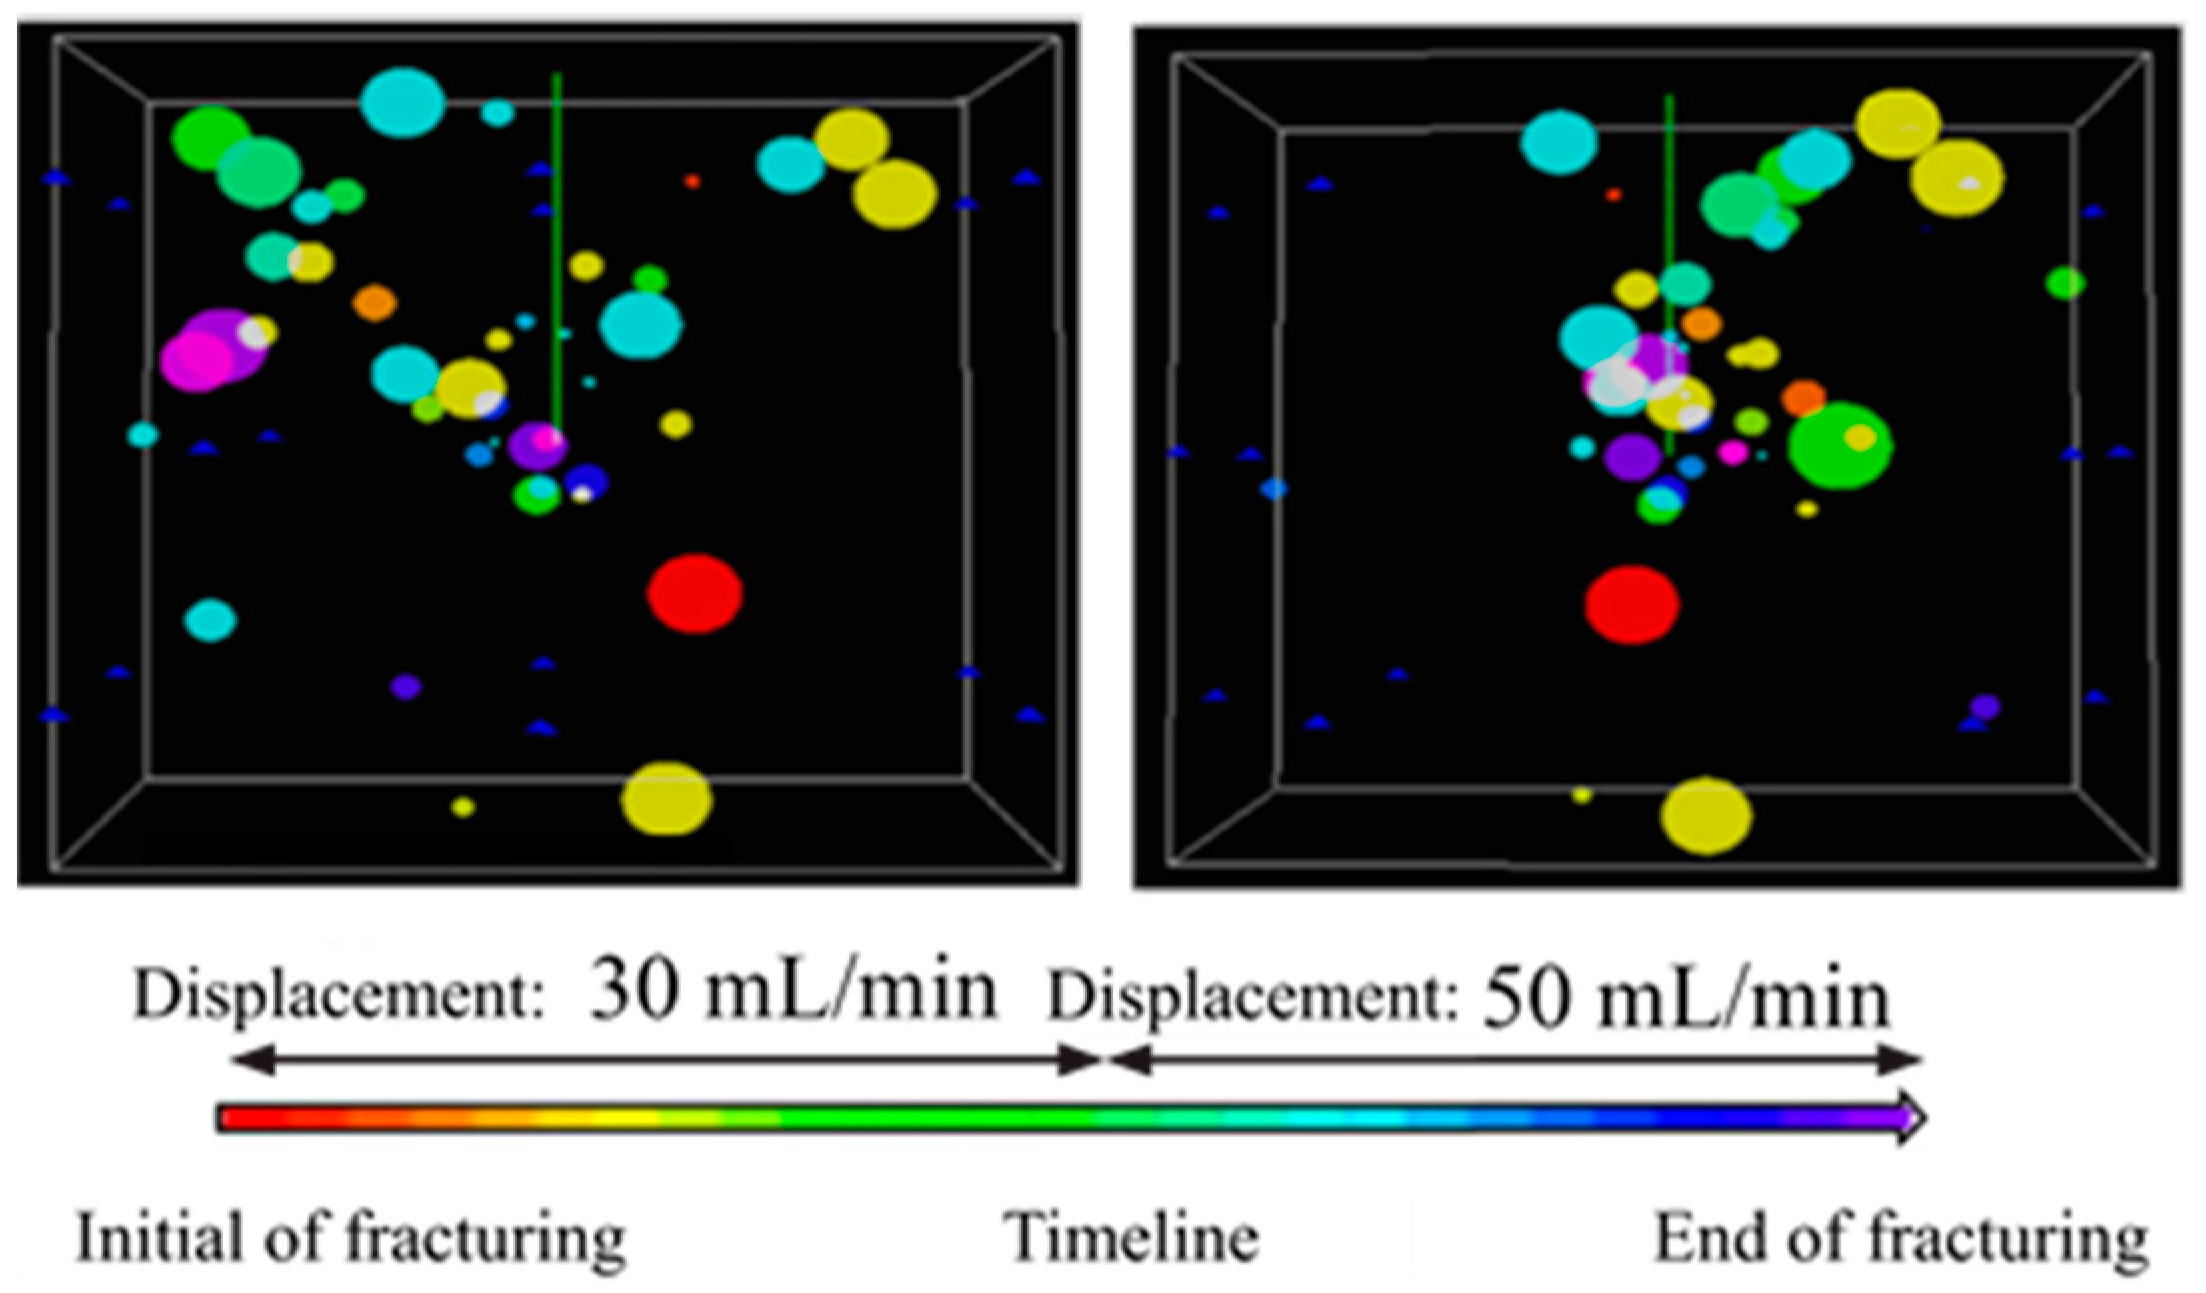
Injection displacement is one of the key technical parameters controlling the morphology of hydraulic fractures. To analyze its influence on fracture network formation, this study employed a two-stage displacement injection scheme under fixed triaxial stress and constant fracturing fluid viscosity, using rates of 30 mL/min followed by 50 mL/min. Acoustic emission (AE) signal intensity can characterize the scale and size of fractures, while the temporal sequence of AE events can indicate the initiation and propagation direction of fractures. Generally, primary fractures develop first, followed by branch fractures. On AE signal maps, this is represented by larger signal points tending toward red and green colors, whereas subsequent damage events are displayed as blue to purple signal points. Furthermore, smaller fracture scales correspond to smaller signal points on the AE diagram. Initially, fracturing fluid was injected at a displacement of 30 mL/min until the acoustic emission signals stabilized, after which the displacement was increased to 50 mL/min. Taking the spatiotemporal evolution results of the sample as an example (Figure 13): during the initial injection stage at 30 mL/min, ruptures primarily concentrated near the edge of the rock, and the sample exhibited characteristics of volumetric fracturing, indicating that the fracturing fluid rapidly migrated along the natural fracture system and reached the sample boundary. After the injection rate was increased to 50 mL/min at approximately 170 s, the acoustic emission ring-down count increased significantly, and more acoustic emission events were observed around the wellbore. The light blue dots in the figure illustrate the fracture distribution after the rate increase, showing a more concentrated dominant direction of rupture, which indicates that a higher injection rate is more conducive to the formation of dominant hydraulic fractures.

5. Fracture Complexity Analysis

At present, the complexity of fractures is characterized by methods such as fractal dimension and three-dimensional digital core. The research progress investigation is shown in Table 3.
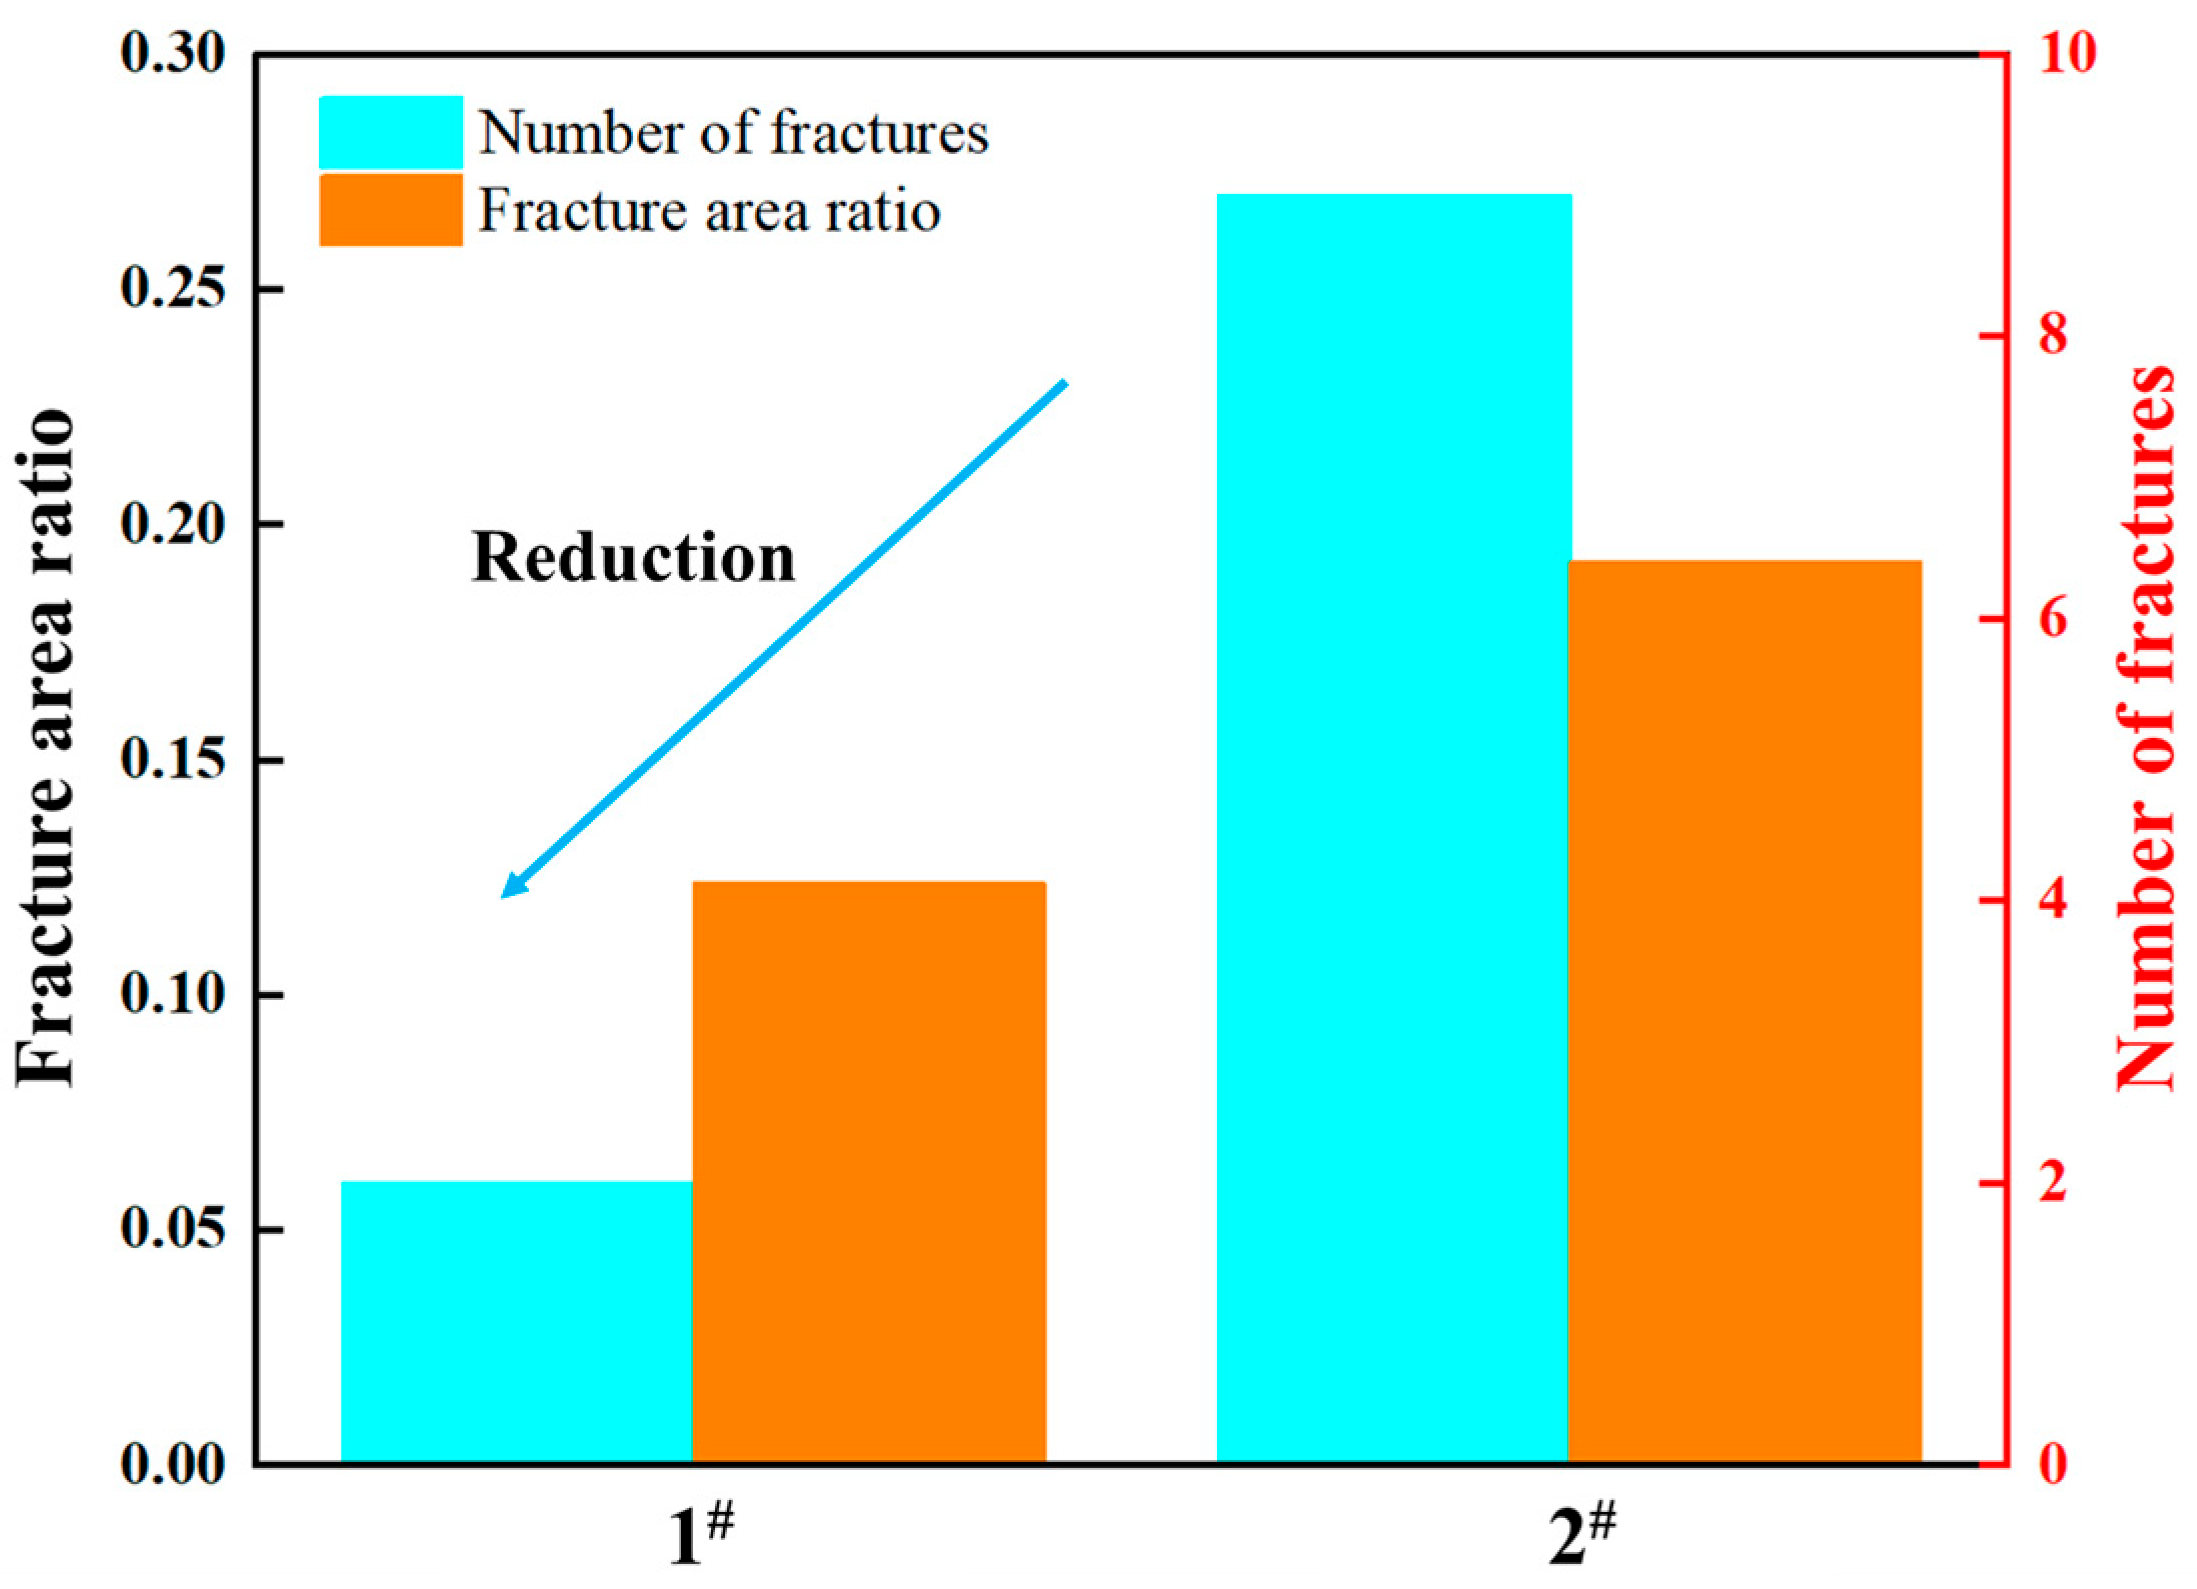
Under the same parameter conditions, the perforation results in coal rock and sandstone vary greatly. When fracturing in coal rock, not only can a complex fracture network be formed, but also the effect of cross-layer fracturing can be achieved. To quantitatively characterize the complexity of fractures, the number of fractures and the ratio of fracture area produced by samples under different perforation conditions are calculated, and the correlation between different perforation methods and the complexity of fractures is analyzed. The fracture area ratio is defined as the ratio of the fracture area activated by the fracturing fluid (obtained from post-fracturing 3D reconstruction) to the cross-sectional area of the coal rock. This metric quantitatively characterizes the complexity of the fracture network. the number of fractures refers to the count of individual activated fractures, which is determined by visually counting the fractures in the 3D reconstruction model. This count is directly comparable to the natural fracture count presented in Figure 10 of this paper. The fracture area ratio is defined as follows:
λ = F w F s
where F w is the area of the fracture area opened by the fracturing fluid, F s is the cross-sectional area of coal and rock, and λ is the ratio of fracture area and represents the complexity of fracture.
As evident from the figure above, perforating in the coal rock enables fractures to penetrate into the adjacent sandstone layer. Furthermore, due to the presence of natural fractures and other weak planes, the resulting fracture complexity (number and geometry) significantly exceeds that achieved by perforating solely in sandstone. The fracture area ratio is also superior to that of sandstone-only perforation. Through the comparison of samples 1# and 2# in Figure 14, the number of perforation fractures in coal rock fracturing reached 450% of that in sandstone, and the fracture area ratio reached 131.7%.
Consequently, perforating in coal rock outperforms sandstone perforation in terms of stimulated reservoir volume (SRV).

6. Conclusions

(1)
Due to the well-developed weak planes, such as natural fractures, in coal rock, perforating in coal rock significantly reduces the breakdown pressure compared to perforating in sandstone.
(2)
The fracture complexity achieved by perforating in thin coal rock far exceeds that from sandstone perforation. Furthermore, the pressure fluctuations during the fracture propagation phase are markedly lower in coal rock than in sandstone. This results in superior fracturing effectiveness.
(3)
In the quantitative characterization of fracture complexity, the number of perforation fractures in coal rock fracturing reached 450% of that in sandstone, and the fracture area ratio reached 131.7%.
(4)
Perforating in coal rock enables fractures to penetrate through layers to effectively connect the adjacent sandstone formation. Conversely, while perforating in sandstone forms a main hydraulic fracture, it fails to establish connectivity with the adjacent coal rock layer.

Author Contributions

Writing—original draft, R.X. and H.X.; writing—review and editing, X.L. and Y.D.; conceptualization, G.Y. and X.Q.; methodology, R.Z.; software, S.L.; validation, F.H. and Z.B. All authors have read and agreed to the published version of the manuscript.

Funding

This work was financially supported by the Open Fund of State Key Laboratory of Oil and Gas Reservoir Geology and Exploitation (PLN2020-1).

Data Availability Statement

The data that support the findings of this study are available from the corresponding author upon reasonable request.

Conflicts of Interest

Authors Ruiguo Xu, Haoyin Xu and Xinghua Qu were employed by Engineering Technology Research Institute, CNPC Bohai Drilling Engineering Co., Ltd. Authors Xudong Li, Guojun Yang and Zhao Bai were employed by Downhole Technical Service Branch, CNPC Bohai Drilling Engineering Co., Ltd. Authors Shuang Lv and Fuping Hu were employed by Oil and Gas Cooperative Development Branch, CNPC Bohai Drilling Engineering Co., Ltd. The remaining authors declare that the research was conducted in the absence of any commercial or financial relationships that could be construed as a potential conflict of interest.

References

  1. Feng, G.; Wang, G.F.; Xie, H.Q.; Hu, Y.Q.; Meng, T.; Li, G. A review of exploration and development technologies for coal, oil, and natural gas. Energies 2024, 17, 3600. [Google Scholar] [CrossRef]
  2. Liu, Z.Q.; Zhao, S.H.; Hu, Z.Q.; Shen, B.J.; Feng, D.J.; Zhang, J.Q.; Ye, J.C.; Ma, C.; Dong, Z.X. Characteristics and controlling factors of coal-measure unconventional reservoirs—A case study of the carboniferous-permian in the ordos basin. Unconv. Resour. 2025, 6, 100153. [Google Scholar] [CrossRef]
  3. Tong, T.; Wang, J.H. The pathway to the natural gas industry: Financial development, coal consumption, and carbon dioxide emissions in P.R. China. Sci. Prog. 2023, 106, 368504231160643. [Google Scholar] [CrossRef] [PubMed]
  4. Qiao, W.; Howard, K.W.F.; Li, W.; Zhang, S.; Zhang, X.; Niu, Y. Coordinated exploitation of both coal and deep groundwater resources. Environ. Earth Sci. 2020, 79, 186. [Google Scholar] [CrossRef]
  5. Kang, H.; Gao, F.Q.; Xu, G.; Ren, H.W. Mechanical behaviors of coal measures and ground control technologies for china’s deep coal mines -a review. J. Rock. Mech. Geotech. Eng. 2023, 15, 37–65. [Google Scholar] [CrossRef]
  6. Li, Q.G.; Deng, Y.Z.; Hu, Q.T.; Wu, X.B.; Wang, X.G.; Jiang, Z.Z.; Liu, L.; Qian, Y.N.; Song, M.Y. Review and prospect of coal rock hydraulic fracturing physical experimental research. Coal Sci. Technol. 2022, 50, 62–72. [Google Scholar]
  7. Li, X.G.; Tang, Z.; Zhu, J.Y.; Yang, Z.Z.; Li, Y.; Xie, P.; Liao, Y. Research progress and prospect of deep coalrock fracturing. Nat. Gas. Ind. 2024, 44, 126–139. [Google Scholar]
  8. Wen, H.T.; Yang, R.Y.; Jing, M.Y.; Huang, Z.W.; Hong, C.Y.; Chen, J.X.; Cong, R.C. Rock mechanical properties of coal in cryogenic condition. Pet. Sci. 2023, 20, 407–423. [Google Scholar] [CrossRef]
  9. Liang, W.; Wang, J.G.; Leung, C.F.; Goh, S.; Sang, S.X. Opportunities and challenges for gas coproduction from coal measure gas reservoirs with coal-shale-tight sandstone layers: A review. Deep Undergr. Sci. Eng. 2025, 4, 83–104. [Google Scholar] [CrossRef]
  10. Blunschi, J.; Wang, J.; Ertekin, T. Hydraulic fracturing mechanisms in coal: A review. Int. J. Oil Gas Coal Technol. 2017, 14, 247–263. [Google Scholar] [CrossRef]
  11. Huang, L.S.; Li, B.; Wu, B.; Li, C.; Wang, J.X.; Cai, H.W. Study on the extension mechanism of hydraulic fractures in bedding coal. Theor. Appl. Fract. Mec. 2024, 131, 104431. [Google Scholar] [CrossRef]
  12. Kang, H.; Xia, Y.X.; Feng, M.H.; Lu, C.; Gao, F.Q. Case study of hydraulic fracturing for coal burst risk mitigation. Int. J. Coal Sci. Technol. 2025, 12, 10. [Google Scholar] [CrossRef]
  13. Yadali, B. A critical review of common models in hydraulic-fracturing simulation: A practical guide for practitioners. Theor. Appl. Fract. Mec. 2021, 113, 102937. [Google Scholar] [CrossRef]
  14. Lu, Y.X.; Hu, S.Y.; Li, G.F.; Wu, X.; Lu, J.Q.; Yang, Y.T.; Zhang, C.; Su, Y. Experimental study and application of hydraulic fracturing in underlying coal seam. Coal Sci. Technol. 2024, 52, 231–242. [Google Scholar]
  15. Li, B.; He, Y.Z.; Shi, Z.; Jian, W.; Wang, N.N.; Zhang, Y.P. Mutual feedback and fracturing effect of hydraulic fractures in composite coal−rock reservoirs under different fracturing layer sequence conditions. Int. J. Rock. Mech. Min. 2024, 184, 105968. [Google Scholar] [CrossRef]
  16. Pang, T.; Jiang, Z.B.; Hui, J.T.; Jia, B.Y. Fracture propagation mechanism in directional perforation and hydraulic fracturing of coal seam horizontal wells. Coal Geol. Explor. 2024, 52, 68–75. [Google Scholar]
  17. Wu, L.D.; Zhang, Y.; Di, S.J.; Tao, Z.Z.; Liu, Z.B. Study of fracture propagation mechanism of horizontal well fracturing in roof of coal seams. J. Energy Eng. 2024, 150, 04024008. [Google Scholar] [CrossRef]
  18. Huang, D.B.; Kang, X.T.; Xu, Z.H.; Ren, C.; Long, Y.Y.; Cao, P. Influence of strength inhomogeneity on transboundary expansion characteristics of hydraulically fractured fractures in coal seams. Sci. Rep. 2024, 14, 29094. [Google Scholar] [CrossRef]
  19. Liu, Y.Y.; Ge, Z.L.; Yan, F.; Xia, B.W.; Tan, J.R. Progress on the hydraulic measures for grid slotting and fracking to enhance coal seam permeability. Int. J. Min. Sci. Technol. 2017, 27, 867–871. [Google Scholar] [CrossRef]
  20. Zhang, X.; Si, G.Y.; Bai, Q.S.; Xiang, Z.Z.; Li, X.; Oh, J.; Zhang, Z.Y. Numerical simulation of hydraulic fracturing and associated seismicity in lab-scale coal samples: A new insight into the stress and aperture evolution. Comput. Geotech. 2023, 161, 105507. [Google Scholar] [CrossRef]
  21. Ou, Y.J.; Liang, H. Study on the law of hydraulic fracture propagation in low permeability thin interbed reservoir. Engineering 2023, 25, 187–199. [Google Scholar] [CrossRef]
  22. Liu, Y.; Dai, F. A review of experimental and theoretical research on the deformation and failure behavior of rocks subjected to cyclic loading. J. Rock. Mech. Geotech. Eng. 2021, 13, 1203–1230. [Google Scholar] [CrossRef]
  23. Zhao, Y.; Zhang, Y.F.; Tian, G.D.; Wang, C.L.; Bi, J. A new model for predicting hydraulic fracture penetration or termination at an orthogonal interface between dissimilar formations. Pet. Sci. 2022, 19, 2810–2829. [Google Scholar] [CrossRef]
  24. Ma, Z.G.; Yan, P.F.; Cheng, S.X.; Gong, P.; Qi, F.Z.; Wang, J.G. Experimental study of the dynamic mechanical responses and failure characteristics of coal under true triaxial confinements. Int. J. Min. Sci. Technol. 2023, 33, 761–772. [Google Scholar] [CrossRef]
  25. Li, Q.; Li, T.; Cai, Y.D.; Liu, D.M.; Li, L.F.; Ru, Z.X.; Yin, T.T. Research progress on hydraulic fracture characteristics and controlling factors of coalbed methane reservoirs. J. China Coal Soc. 2023, 48, 4443–4460. [Google Scholar]
  26. Li, R.; Zhai, H.Y.; Jiang, C.S.; Zhu, W.; Li, X.Y.; Wang, Z.; Wang, Y.B. A review of laboratory hydraulic fracturing experiments on shales. Geoenergy Sci. Eng. 2025, 254, 214028. [Google Scholar] [CrossRef]
  27. Zhou, A.T.; He, Y.Z.; Wang, K.; Yang, Y.X.; Wang, Y.D.; Liu, Y.F. Optimization study on separate-layer fracturing of a coal–rock composite based on inter-fracture interference effect. Eng. Geol. 2025, 344, 107930. [Google Scholar] [CrossRef]
  28. Ma, J.Q.; Li, X.H.; Li, Y.H.; Wang, X.H.; Yao, Q.L. Numerical simulation of hydraulic fracture extension patterns at interfaces of coal-measure rock strata and a new theoretical prediction model. Simul. Model. Pract. Theory 2025, 138, 103063. [Google Scholar] [CrossRef]
  29. Xiong, D.; He, J.Y.; Ma, X.F.; Qu, Z.L.; Guo, T.K.; Ma, S.Y. Fracturing simulation with different perforation positions at deep coal seam and roof/floor rock—Case study at the no.8 deep coal seam of a gas field in the ordos basin. J. China Coal Soc. 2024, 49, 4897–4914. [Google Scholar]
  30. Al-Yaari, A.; Ching, D.L.C.; Sakidin, H.B.; Muthuvalu, M.S.; Zafar, M.; Alyousifi, Y.; Saeed, A.A.H.; Bilad, M.R. Thermophysical Properties of Nanofluid in Two-Phase Fluid Flow through a Porous Rectangular Medium for Enhanced Oil Recovery. Nanomaterials 2022, 12, 1011. [Google Scholar] [CrossRef] [PubMed]
  31. Yao, W.J.; Liu, X.W.; Liu, B.; Fan, Y.; Zhu, L.; Zheng, Z. Experimental and numerical simulation study on mechanical properties of coal-transition layer-rock composite structures. Chin. J. Rock. Mech. Eng. 2024, 43, 184–205. [Google Scholar]
  32. Lu, J.; Huang, G.; Gao, H.; Li, X.; Zhang, D.M.; Yin, G.Z. Mechanical properties of layered composite coal–rock subjected to true triaxial stress. Rock. Mech. Rock. Eng. 2020, 53, 4117–4138. [Google Scholar] [CrossRef]
  33. Lucca, A.; Balsamo, F.; De Risio, C.A.; Ogata, K.; Porta, F.; Tavani, S.; Storti, F. Facies and mechanical stratigraphy control fracture intensity, topology and fractal dimension in folded turbidite sandstones, Northern Apennines, Italy. J. Struct. Geol. 2025, 191, 105307. [Google Scholar] [CrossRef]
  34. Liu, J.; Regenauer-Lieb, K.; Hines, C.; Zhang, S.; Bourke, P.; Fusseis, F.; Yuen, D.A. Applications of microtomography to multiscale system dynamics: Visualisation, characterisation and high performance computation. In Advances in Geophysics, Tectonics and Petroleum Geosciences; Springer: Cham, Switzerland, 2013; pp. 653–674. [Google Scholar]
  35. Wang, B.; Liu, X.; Sima, L. Grading evaluation and prediction of fracture-cavity reservoirs in Cambrian Longwangmiao Formation of Moxi area, Sichuan Basin, SW China. Pet. Explor. Dev. 2019, 46, 301–313. [Google Scholar] [CrossRef]
  36. Li, T.; Li, Q.; Hu, Y.; Peng, X.; Feng, X.; Zhu, Z.; Zhao, Z. Quantitative characterization of irregular micro-fracture network and its effect on the permeability of porous media. Pet. Explor. Dev. 2021, 48, 368–378. [Google Scholar] [CrossRef]
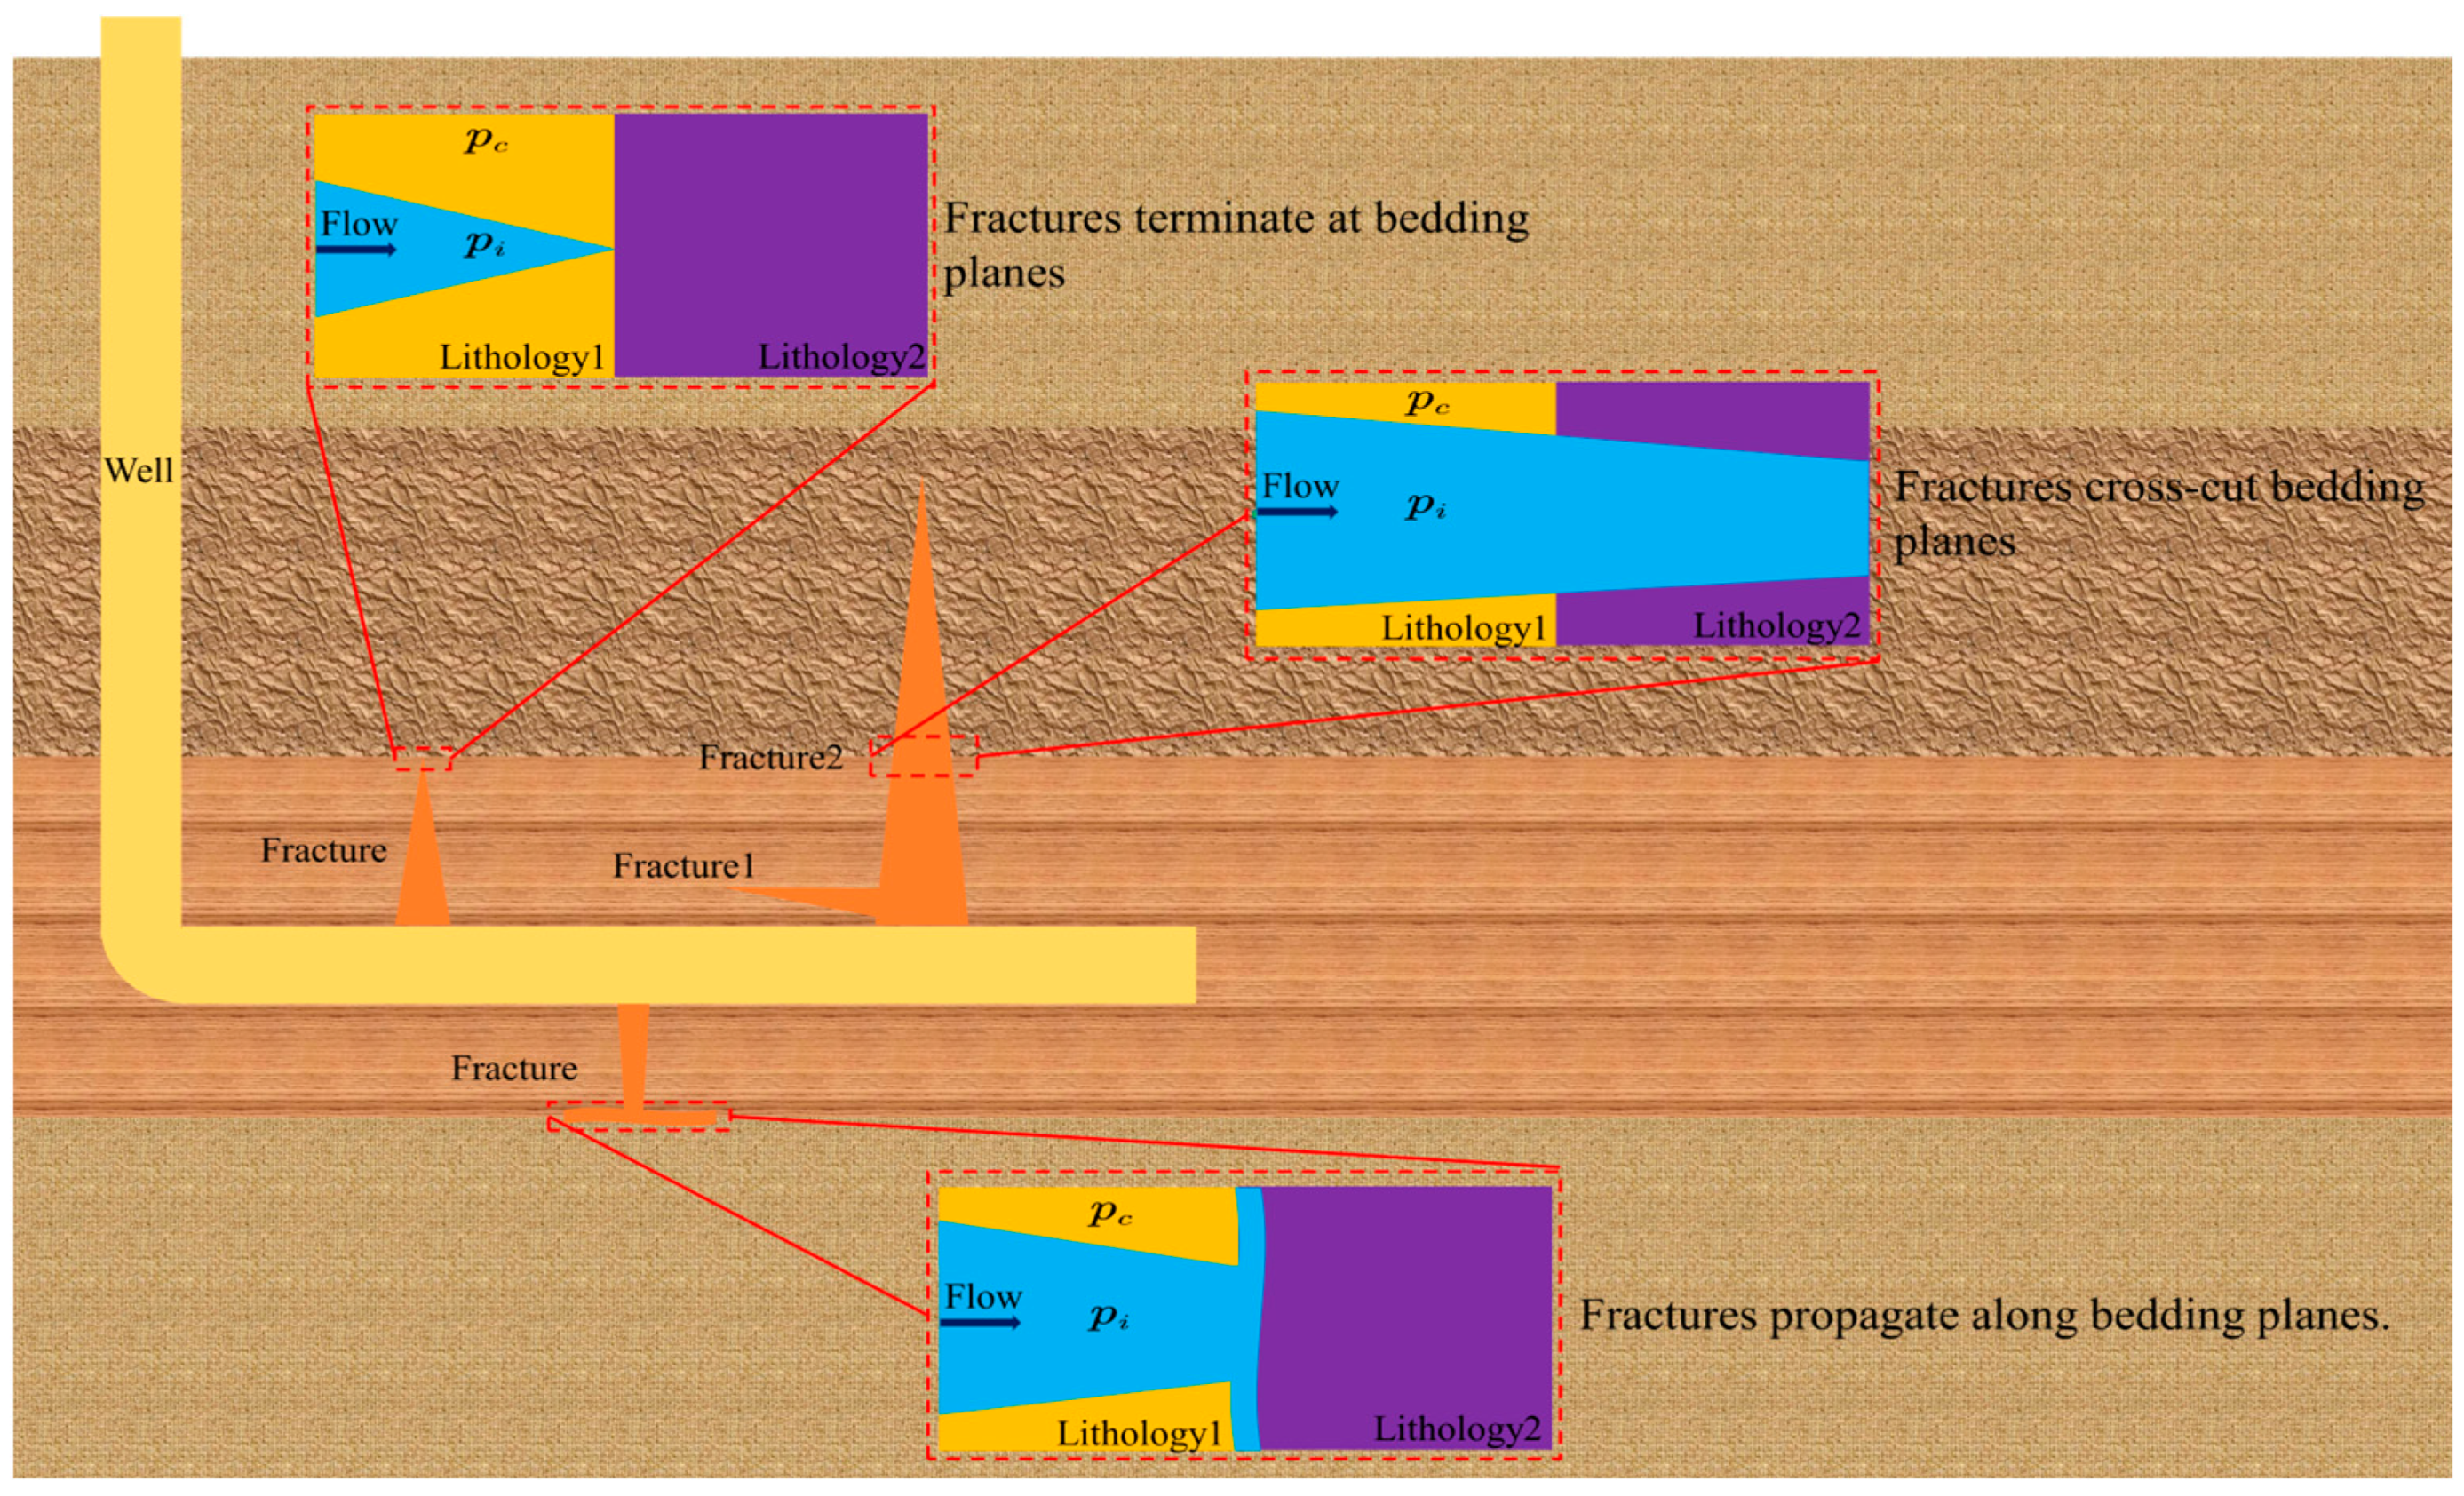
Figure 1. Schematic diagram of fracture propagation through layers.
Processes 13 03411 g001
Figure 2. Rock sample.
Processes 13 03411 g002
Figure 3. Sample preparation steps: (a) Rock preparation; (b) Assembly; (c) Finished Product.
Processes 13 03411 g003
Figure 4. Alternating injection system for fracturing fluids.
Processes 13 03411 g004
Figure 5. HAZSZ-IV true triaxial fracture propagation and seepage simulation system experimental platform.
Processes 13 03411 g005
Figure 6. Schematic diagram of the true triaxial fracture initiation, propagation and seepage simulation system.
Processes 13 03411 g006
Figure 7. Experimental procedure.
Processes 13 03411 g007
Figure 8. Pre-fracturing fracture scanning image of the rock sample.
Processes 13 03411 g008
Figure 9. True triaxial pressure curves.
Processes 13 03411 g009
Figure 10. Post-fracturing rock sample and fracture reconstruction image.
Processes 13 03411 g010
Figure 11. Fracture distribution on the principal stress surface after fracturing.
Processes 13 03411 g011
Figure 12. Fracture morphology diagrams under different viscosities of fracturing fluids: (a) Low viscosity; (b) High viscosity.
Processes 13 03411 g012
Figure 13. The spatiotemporal evolution results of variable displacement fracturing.
Processes 13 03411 g013
Figure 14. Fracture complexity analysis.
Processes 13 03411 g014
Table 1. Mechanical properties of coal and sandstone.
SampleLithologyDepth (m)Confining Pressure (MPa)Young’s Modulus (GPa)Poisson’s RatioUCS (MPa)
1Coal3231.34105.180.43 72.61
2Coal3236.16106.290.3645.70
3Sandstone3152.125035.640.25292.10
Table 2. Experimental parameters.
SampleVertical Stress (MPa)Maximum Horizontal Stress (MPa)Minimum Horizontal Stress (MPa)Horizontal Stress Difference (MPa)Viscosity (mPa·s)Displacement (mL/min)
1#129.57.5220~4010~20
2#129.57.5220~4010~20
Note: The symbol ‘#’ denotes the sample designation, ‘1#’ refers to Sample 1, and ‘2#’ refers to Sample 2. The same applies to the subsequent figures and tables.
Table 3. Advances in the characterization of fracture complexity.
Technique NameApplicationReferences
1Fractal dimensionQuantitatively describe the complexity and strength of the fracture Lucca et al. [33]
2Voxel-based characterizationDetailed quantification of 3D fracture complexity at the microscaleLiu et al. [34]
33D digital core analysisVisual reconstruction of internal micro-fracture network morphologyWang et al. [35]
4Fracture network orientation index and connectivity coefficientQuantitative characterization of irregular micro-fracture networksLi et al. [36]
Disclaimer/Publisher’s Note: The statements, opinions and data contained in all publications are solely those of the individual author(s) and contributor(s) and not of MDPI and/or the editor(s). MDPI and/or the editor(s) disclaim responsibility for any injury to people or property resulting from any ideas, methods, instructions or products referred to in the content.