1. Introduction
With the global shortage of energy resources, the development and utilization of renewable energy have become a top priority. Solar energy has attracted the attention of various countries due to its clean, safe and abundant resources. China has put forward the goal of ‘carbon peak, carbon neutrality’, and the realization of the double ‘carbon’ goal must rely on new energy development, among which the development of photovoltaic power generation is significant. In the design and performance improvement of photovoltaic power generation systems, system modeling, simulation and control optimization are crucial technical foundations [
1]. The development potential of photovoltaic power generation in China is expected to exceed 5 billion kW. The development of photovoltaic power generation is of great significance to China’s practice of energy security strategy. By the end of March 2024, the installed capacity of photovoltaic power generation in China reached 659 million kW, including 379 million kW of centralized photovoltaic and 280 million kW of distributed photovoltaic [
2].
A DC arc fault in a photovoltaic system has become the most significant hidden danger of this power generation technology. To prevent the harm of DC arc faults, it is increasingly important to prevent and control electrical fires, which are the primary cause and first fire hazard. To prevent the fire from ‘burning’, more attention is paid to the arc protection switch equipment that initially prevents the occurrence of electrical fire. With the continuous improvement of safety requirements for photovoltaic systems, traditional arc protection devices have been unable to meet the protection requirements of the line fully, and a new type of arc fault detection device is urgently needed.
In recent years, photovoltaic DC arc fault detection technology based on time-frequency domain electrical signal characteristics has continued to develop. Li Weijun et al. [
3] proposed a method for detecting photovoltaic grid-connected DC series arc faults using a random forest algorithm. They statistically analyzed DC series arc fault data and extracted characteristic features to construct the training set. These features were then used to train the random forest model and establish a diagnostic model for photovoltaic series arc faults. Wu Zhou et al. [
4] introduced a fault detection approach combining complementary ensemble empirical mode decomposition (CEEMD) with K-means clustering (Kmeans++). Through CEEMD, the DC-side current signal of the photovoltaic system is decomposed into several intrinsic mode functions (IMFs). The Pearson correlation coefficient is subsequently applied to select the most relevant components for signal reconstruction. Time-frequency domain features are then extracted from the reconstructed signal, and Kmeans++ is employed to identify faults. C. He et al. [
5] proposed a method to detect the parallel arc fault of the photovoltaic DC side. By monitoring the outlet current of the photovoltaic panel, the characteristic frequency band and the optimal wavelet basis were determined, and the hybrid judgment basis was constructed by combining the judgment criteria of the time domain and the frequency domain. A detection method combining adaptive local mean decomposition, multi-scale fuzzy entropy and support vector machine was developed for DC series arc fault of photovoltaic systems [
6]. The above two studies refer to the UL 1699B-2018 [
7] standard for building a photovoltaic DC arc fault detection platform, and the effectiveness of the respective methods is verified through experiments. Aiming at the problem of insufficient universality of existing detection methods, Zhang Qinkang et al. [
8] proposed to use the improved Hausdorff dimension to detect DC series arc faults. According to the standard of GB/T 39750 [
9], the experimental platform of DC series arc fault is built by using a constant-voltage power supply, which further promotes the development of detection technology.
In the field of photovoltaic DC arc fault detection, the method of manually selecting conditions to extract the characteristics of time-frequency domain electrical signals in the past has the problem of insufficient flexibility and applicability. With the wide application of neural networks in the direction of electrical intelligence, this technology has brought a new breakthrough for photovoltaic DC arc fault detection. Wang Zhaorui et al. [
10] developed a photovoltaic series arc fault detection algorithm based on a lightweight convolutional neural network and feature threshold and built an experimental platform according to the UL 1699B-2018 standard to produce a prototype of the detection device. The experimental results show that the method can meet the practical application requirements. A detection method combining an attention mechanism and a one-dimensional convolutional neural network is proposed [
11]. By optimizing the arc features, the detection accuracy and anti-interference ability are significantly improved. The research also builds an experimental platform to collect data based on the UL 1699B-2018 standard. The model based on the key feature frequency band training has an accuracy rate of 99.33%, which is better than similar deep learning models. Anshul Shekhar et al. [
12] proposed a photovoltaic array fault detection method based on ensemble learning. The method demonstrated excellent performance, achieving high detection accuracy, a low error rate, and minimal computational cost. It effectively enhanced the accuracy and robustness of photovoltaic system fault diagnosis. A detection device based on an STM32 embedded platform is designed, and the fault arc is identified by an ELM neural network. By dividing the data into a training set and a test set for model training, the correct rate of the final test set reaches 99.5%, and the fast and real-time detection of arc faults is realized [
13].
At present, there is still a key bottleneck in the research of this field, that is, the standards for building experimental platforms are too monotonous. Most studies have only conducted experiments under specific simulated loads of a single standard, fixed photovoltaic array scales or idealized environmental conditions, resulting in the lack of a unified performance verification benchmark for the detection technologies developed by different teams. This directly leads to the difficulty in making horizontal comparisons among technological achievements, making it impossible to objectively assess the adaptability and reliability of different algorithms under complex working conditions, and seriously restricting the screening and promotion of high-quality technologies. Formulating a complete set of technical guidelines for DC arc protection in photovoltaic power generation systems has become an urgent need to regulate and promote the development of this field.
At present, there are four sets of international standards for photovoltaic DC arc fault detection, including UL 1699B-2018, GB/T 39750, IEC 63027 [
14] and CGC/GF 175 [
15]. In August 2018, the UL1699B-2018 standard was developed to help manufacturers develop and promote photovoltaic DC arc fault detection devices (AFDDs) to reduce the fire risk in photovoltaic DC systems. In 2021, China issued a national standard, ‘GB/T 39750-2021 technical requirements for DC arc protection of photovoltaic power generation system’. This standard stipulates the terms and definitions, technical requirements, test methods, inspection rules, signs, packaging, transportation and storage of technical requirements for DC arc protection of photovoltaic power generation systems, aiming at standardizing the detection and protection measures of DC arcs in photovoltaic power generation systems. Germany’s Fraunhofer ISE announced a new international test standard for photovoltaic inverters for integrated arc fault detection systems in 2023, IEC 63027, which takes into account the special needs and characteristics of photovoltaic systems and the unique aspects of photovoltaic DC power supply (distributed power supply group, current behavior, dependence on irradiance, system impedance, etc.), and provides requirements and test procedures for arc fault protection devices in photovoltaic systems to reduce the risk of electrical fires. According to ‘IEC 63027: 2023 DC arc detection and breaking of photovoltaic power generation system’ and ‘UL 1699B PV DC arc fault circuit protection safety standard’ [
16], ‘CGC/GF 175: 2023 arc detection and breaking evaluation technical specification’ was introduced by Beijing Certification Center Co., Ltd. (Beijing, China). It stipulates the basic requirements, performance indexes, grade evaluation and test methods of arc detection and breaking in photovoltaic systems and is suitable for the detection and evaluation of DC series arc detection and breaking function of photovoltaic systems. There are various international and domestic mainstream standards, and the technical differences in photovoltaic DC arc detection are significant. However, the construction of the photovoltaic DC arc fault experimental platform cannot take into account all the standards.
In summary, it is proposed to carry out research on DC arc fault detection technology of photovoltaic power generation systems. The main contributions of this paper are as follows: 1. The four standards of IEC 63027, UL 1699 B, GBT 39750 and CGC/GF 175 are studied, and the differences among the four standards are focused on, including decoupling, impedance parameters, experimental circuit topology types, and multi-standard comparative analysis. 2. Based on multi-standard fusion, an experimental platform is constructed for the performance detection and rating of DC arc circuit breakers in photovoltaic power generation systems. 3. Using this platform to carry out arc fault-related experiments and collect relevant arcing experimental data to verify the effectiveness of the developed arc fault detection device.
This paper is organized as follows.
Section 2 presents the results of the photovoltaic DC arc test system and compares the decoupling and impedance network parameters defined in the four standards.
Section 3 outlines their respective scopes of application, protection device requirements, arc test operating conditions, and criteria for evaluating test results.
Section 4 describes the construction of the photovoltaic DC arc fault test platform, including its structural components and control methods.
Section 5 verifies the platform’s performance and analyzes the fault characteristics. Finally,
Section 6 concludes the paper.
3. Photovoltaic DC Arc Standard Content Analysis
Based on the four standards of IEC 63027, UL 1699 B, GBT 39750, and CGC/GF 175, the application scope, protection device requirements, arc test conditions, and test results are compared in detail.
3.1. Standard Scope of Application and Protection Device Requirements
In terms of application scope, the UL 1699 B standard covers a wide range of equipment types, and its application scenarios are clearly limited to solar photovoltaic electrical systems with rated voltage below 1500 V DC, but this standard is not applicable to the detection of light-emitting connections, which reflects its specificity in the scope of application. The IEC 63027 standard is suitable for DC arc detection and optional interrupt devices in photovoltaic (PV) system circuits. The maximum photovoltaic source circuit voltage does not exceed 1500 V DC, and it is clearly not suitable for parallel circuit arc detection and non-photovoltaic DC power supply or applications. In terms of application scenario examples, it covers different types of inverters, and the setting of specific application scenarios has certain flexibility and scalability. The application scope of the GBT 39750 standard focuses on the arc protection of the DC side of the photovoltaic power generation system combined with the building. This standard clearly aims at the DC arc protection problem in a building-integrated photovoltaic system, which reflects its pertinence in specific application fields. The scope of application of the CGC/GF 175 standard focuses on the detection and evaluation of DC series arc, emphasizing professionalism in this specific function detection.
In comparison, the UL 1699 B standard and the IEC 63027 standard have certain overlaps in device types and application scenarios, but the UL 1699 B standard focuses more on the type of coverage of devices, while the IEC 63027 standard emphasizes the specification of specific arc detection and interruption devices. The GBT 39750 standard is specifically designed for building-integrated photovoltaic systems and has strong relevance to the scene. The CGC/GF 175 standard focuses on the DC series arc detection and breaking function, forming a clear distinction with other standards in terms of scope of application.
In terms of protection device requirements, all standards take 2.5 s as the reference time for arc interruption and strictly limit the arc energy. UL 1699B, IEC 63027, and CGC/GF 175 require action time and energy limits as shown in
Figure 4. Zone A requires interrupting arcing events within 2.5 s and limiting energy to no more than 200 J for all tests; The arcing event also needs to be interrupted within 2.5 s in the B region, but the energy is limited to 750 J; The C zone stipulates that in any test, when the arc time is equal to or greater than 2.5 s, or the energy is greater than 750 J, the device is judged not to meet the standard [
23]. This zoning regulation provides more detailed and stringent performance requirements for the protection device under various arc energy conditions. GBT 39750 only makes relevant requirements that the action time should be less than 2.5 s, and the arc energy should be less than 750 J, which is consistent with other standards in the action time limit, emphasizing the rapid response ability of the protection device to the arc fault within the specified time [
24].
On the other hand, all standards require the equipment to have self-test capability to ensure the reliability of the detection circuit. IEC 63027, GBT 39750, and CGC/GF 175 stipulate an automatic reset waiting time and a forced manual reset after the fifth break within 24 h. GBT 39750: The waiting time for automatic reset is the shortest (3 min), but a manual reset is forced after the fifth break within 24 h. CGC/GF 175: The waiting time is extended to 5 min, and the sixth reset requires manual/remote operation, and the security redundancy is higher. IEC 63027: Only the minimum interrupt time is specified, and the specific reset time interval is not specified, which depends on the equipment manufacturer.
Compared with the protection device requirements of the four standards, the UL 1699 B standard is the earliest distribution standard, and the basic standard requirements still have a very authoritative reference. The IEC 63027 standard is detailed and comprehensive in structure, operation, reconnection and self-test function. The GBT 39750 standard focuses on the detailed provisions of the treatment after the action of the protection device, the overcurrent breaking capacity and the multiple reset modes; the CGC/GF 175 standard has its characteristics in breaking and alarm, reset mode and self-test function, and is different from other standards in specific requirements and emphases.
3.2. Arc Test Condition Standard Requirements and Result Determination
3.2.1. Arc Test Conditions
- (1)
UL 1699B standard
Multiple parameters, specified in detail by the test parameters, are listed under different test numbers in
Table 3. The clear provisions of these parameters provide a specific operational basis for the test to ensure the repeatability and comparability of the test.
- (2)
IEC 63027 standard and GBT 39750 standard
The arc test conditions are shown in
Table 4, and the test items are the same as the UL 1699 B standard. The test conditions are classified according to the level of the equipment under test. For example, test 1 should apply to all the equipment under test, mainly for the arc that may occur in the small current state; test 2 is suitable for the maximum input current of the device under test is more than 8 A; test 3 is suitable for the maximum input current of more than 16 A; test 4 is suitable for the maximum input voltage above 810 V (maximum system voltage 1500 V); and test 5 is suitable for the maximum input current of a single signal channel of the device under test is more than 24 A. This classification method makes the test more targeted and can better adapt to the test requirements of different levels of equipment. At the same time, the relevant exceptional circumstances are stipulated, and the above test should be repeated three times.
- (3)
CGC/GF 175 standard
The basic condition test is presented in the form of a table (
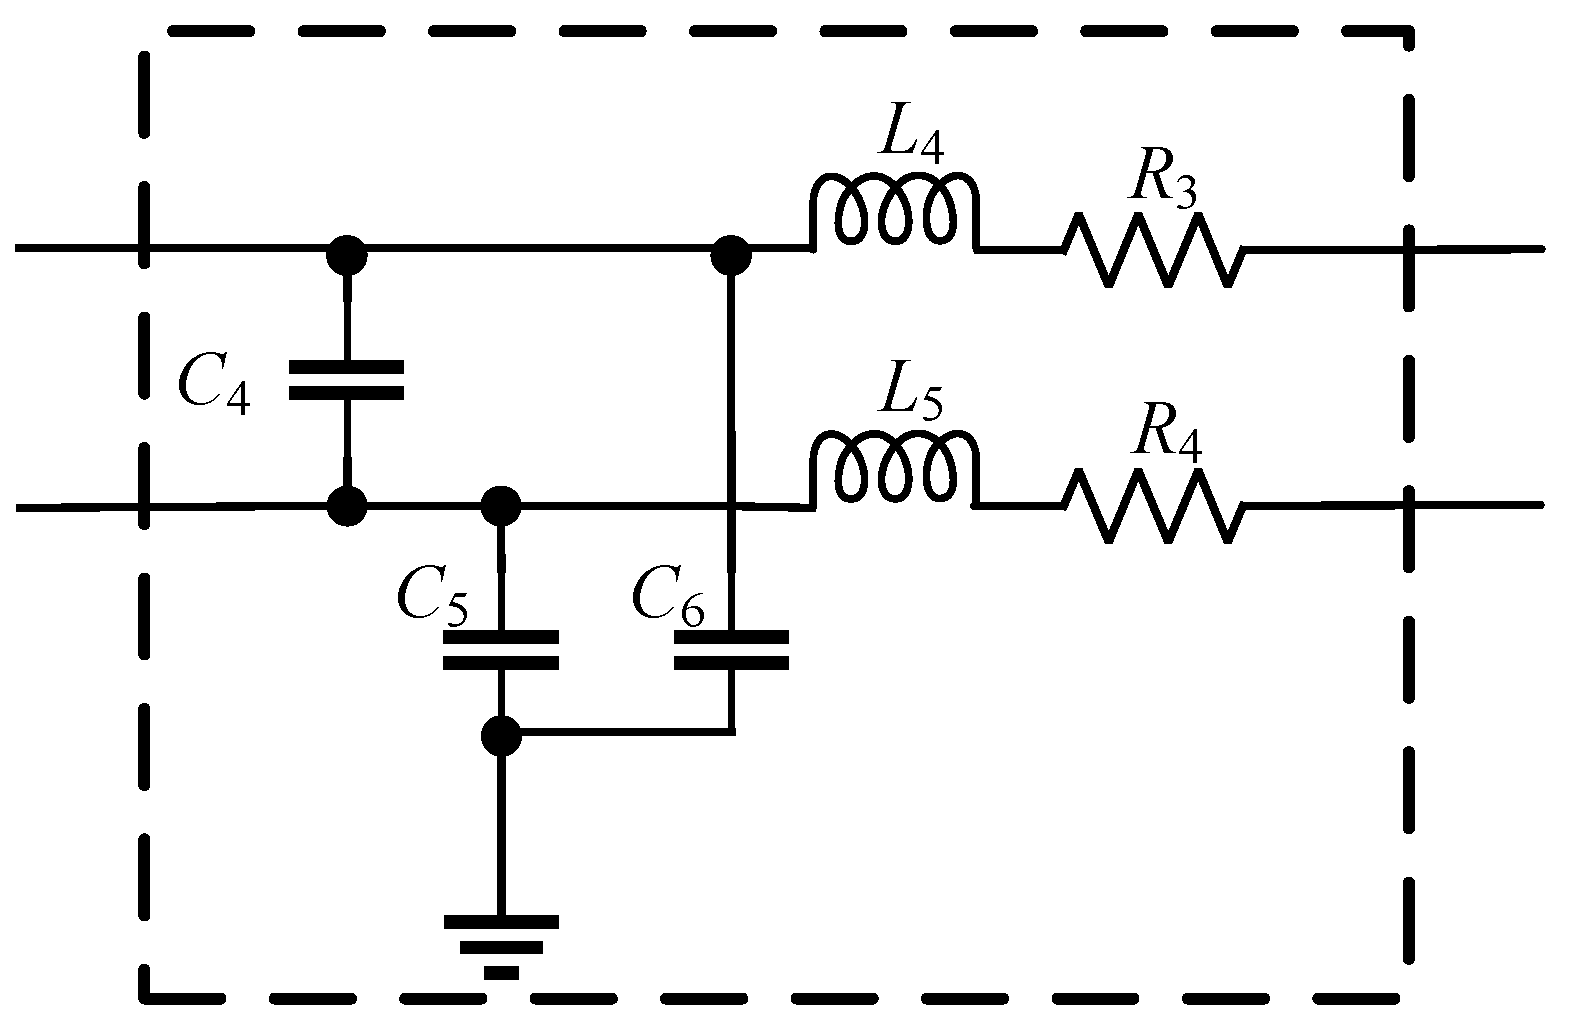
Table 5), which is quite different from the UL 1699 B, IEC 63027, and GBT 39750 standards. The test conditions of the CGC/GF 175 standard are more diverse. Under each condition, intermediate position and start/end position tests are required, and different test times are specified according to different DC input power supplies (photovoltaic array or DC power supply). When the DC input is a photovoltaic array, each working condition at each position is tested at least 3 times; when the DC input is a DC power supply, each working condition at each position is tested at least twice under each capacitor (see capacitor C4 in
Table 3). This detailed test requirement for different power inputs and locations helps to comprehensively evaluate the performance of the equipment under different operating conditions. For the parameter values and special case processing regulations, the various complex situations in the actual equipment operation are fully considered, so that the test conditions are closer to the actual application scenarios.
Comparing the arc test conditions of the four standards, the UL 1699 B standard focuses on the representativeness and versatility of the parameters; the IEC 63027 standard is detailed and flexible in terms of test parameters, conditions, and application. The GBT 39750 standard classifies test conditions according to equipment grade and considers special voltage conditions. The CGC/GF 175 standard is tested in detail for different power inputs and positions, and the parameter values and exceptional cases are handled carefully. Each standard is designed to ensure that the test can accurately reflect the performance of the equipment in actual operation, but the specific provisions are different due to the different emphasis of the standard.
3.2.2. Determination of Test Results
This paper summarizes the test result determination methods of UL 1699 B, IEC 63027, GBT 39750, and CGC/GF 175 standards. Although the UL 1699 B standard does not explicitly mention the test result determination method, it is speculated from its requirements for the protection device that it may be related to whether the device meets the interruption time and energy limits under different arc conditions. For example, in the A-zone test, if the device fails to interrupt the arcing event within 2.5 s or the energy exceeds 200 J, it is judged to be unqualified. The IEC 63027 standard does not directly give the determination of the content of test results. From the aspects of operational requirements, structure, and self-test of series arc fault, the determination should focus on a comprehensive evaluation of the equipment’s performance in arc detection, interruption, structure, and self-test. If the AFD fails to detect the arc before the specified time, or the arc energy exceeds 750 J, or the AFPE fails to interrupt the arc correctly, the test results may be unqualified. The GBT 39750 standard stipulates that the arc protection device should be able to realize the arc extinguishing function, the arc extinguishing time is less than 2.5 s, and the arc energy is less than 750 J. If the device fails to meet this requirement, it needs to be improved, and the series arc-related performance is emphasized. The CGC/GF 175 standard adopts a comprehensive rating method, and a detailed rating standard is formulated according to the types of arcs that can be detected, protection range, detection distance, maximum working current, arc energy, breaking time, accuracy, and other items. For example, different levels of equipment have different requirements in terms of detection distance, breaking time, etc., and the accuracy rate is 100%. CGC/GF 175 grading standards are shown in
Table 6.
In general, the GBT 39750 standard is intuitive and simple, and the CGC/GF 175 standard is comprehensive and detailed. Although the UL 1699 B and IEC 63027 standards do not have a clear determination method, they need to comprehensively consider the performance of the equipment. These standards reflect different ideas and emphases on ensuring the performance of DC arc protection equipment in photovoltaic power generation systems.
4. Photovoltaic DC Arc Fault Test Platform
In summary, the standards in the industry are diversified. There are differences in the criteria and test procedures for DC arc faults in different regions and different enterprises, which makes it difficult to achieve wide compatibility in the design and application of test devices, and cannot meet the diversified market demand; on the other hand, the traditional test device is not intelligent enough. Relying on manual operation and experience judgment, it is not only inefficient, but also difficult to guarantee the accuracy and reliability of the test results, and it is impossible to identify potential DC arc faults in a timely and accurate manner.
In view of the above problems, a photovoltaic DC arc fault test platform with high compatibility and a high intelligence level is developed. The platform can not only flexibly adapt to various industry standards, but also quickly and accurately identify DC arc faults through intelligent detection systems, providing a strong technical guarantee for the safe and stable operation of photovoltaic systems.
4.1. The Structure of the Photovoltaic DC Arc Fault Test Platform Is Introduced
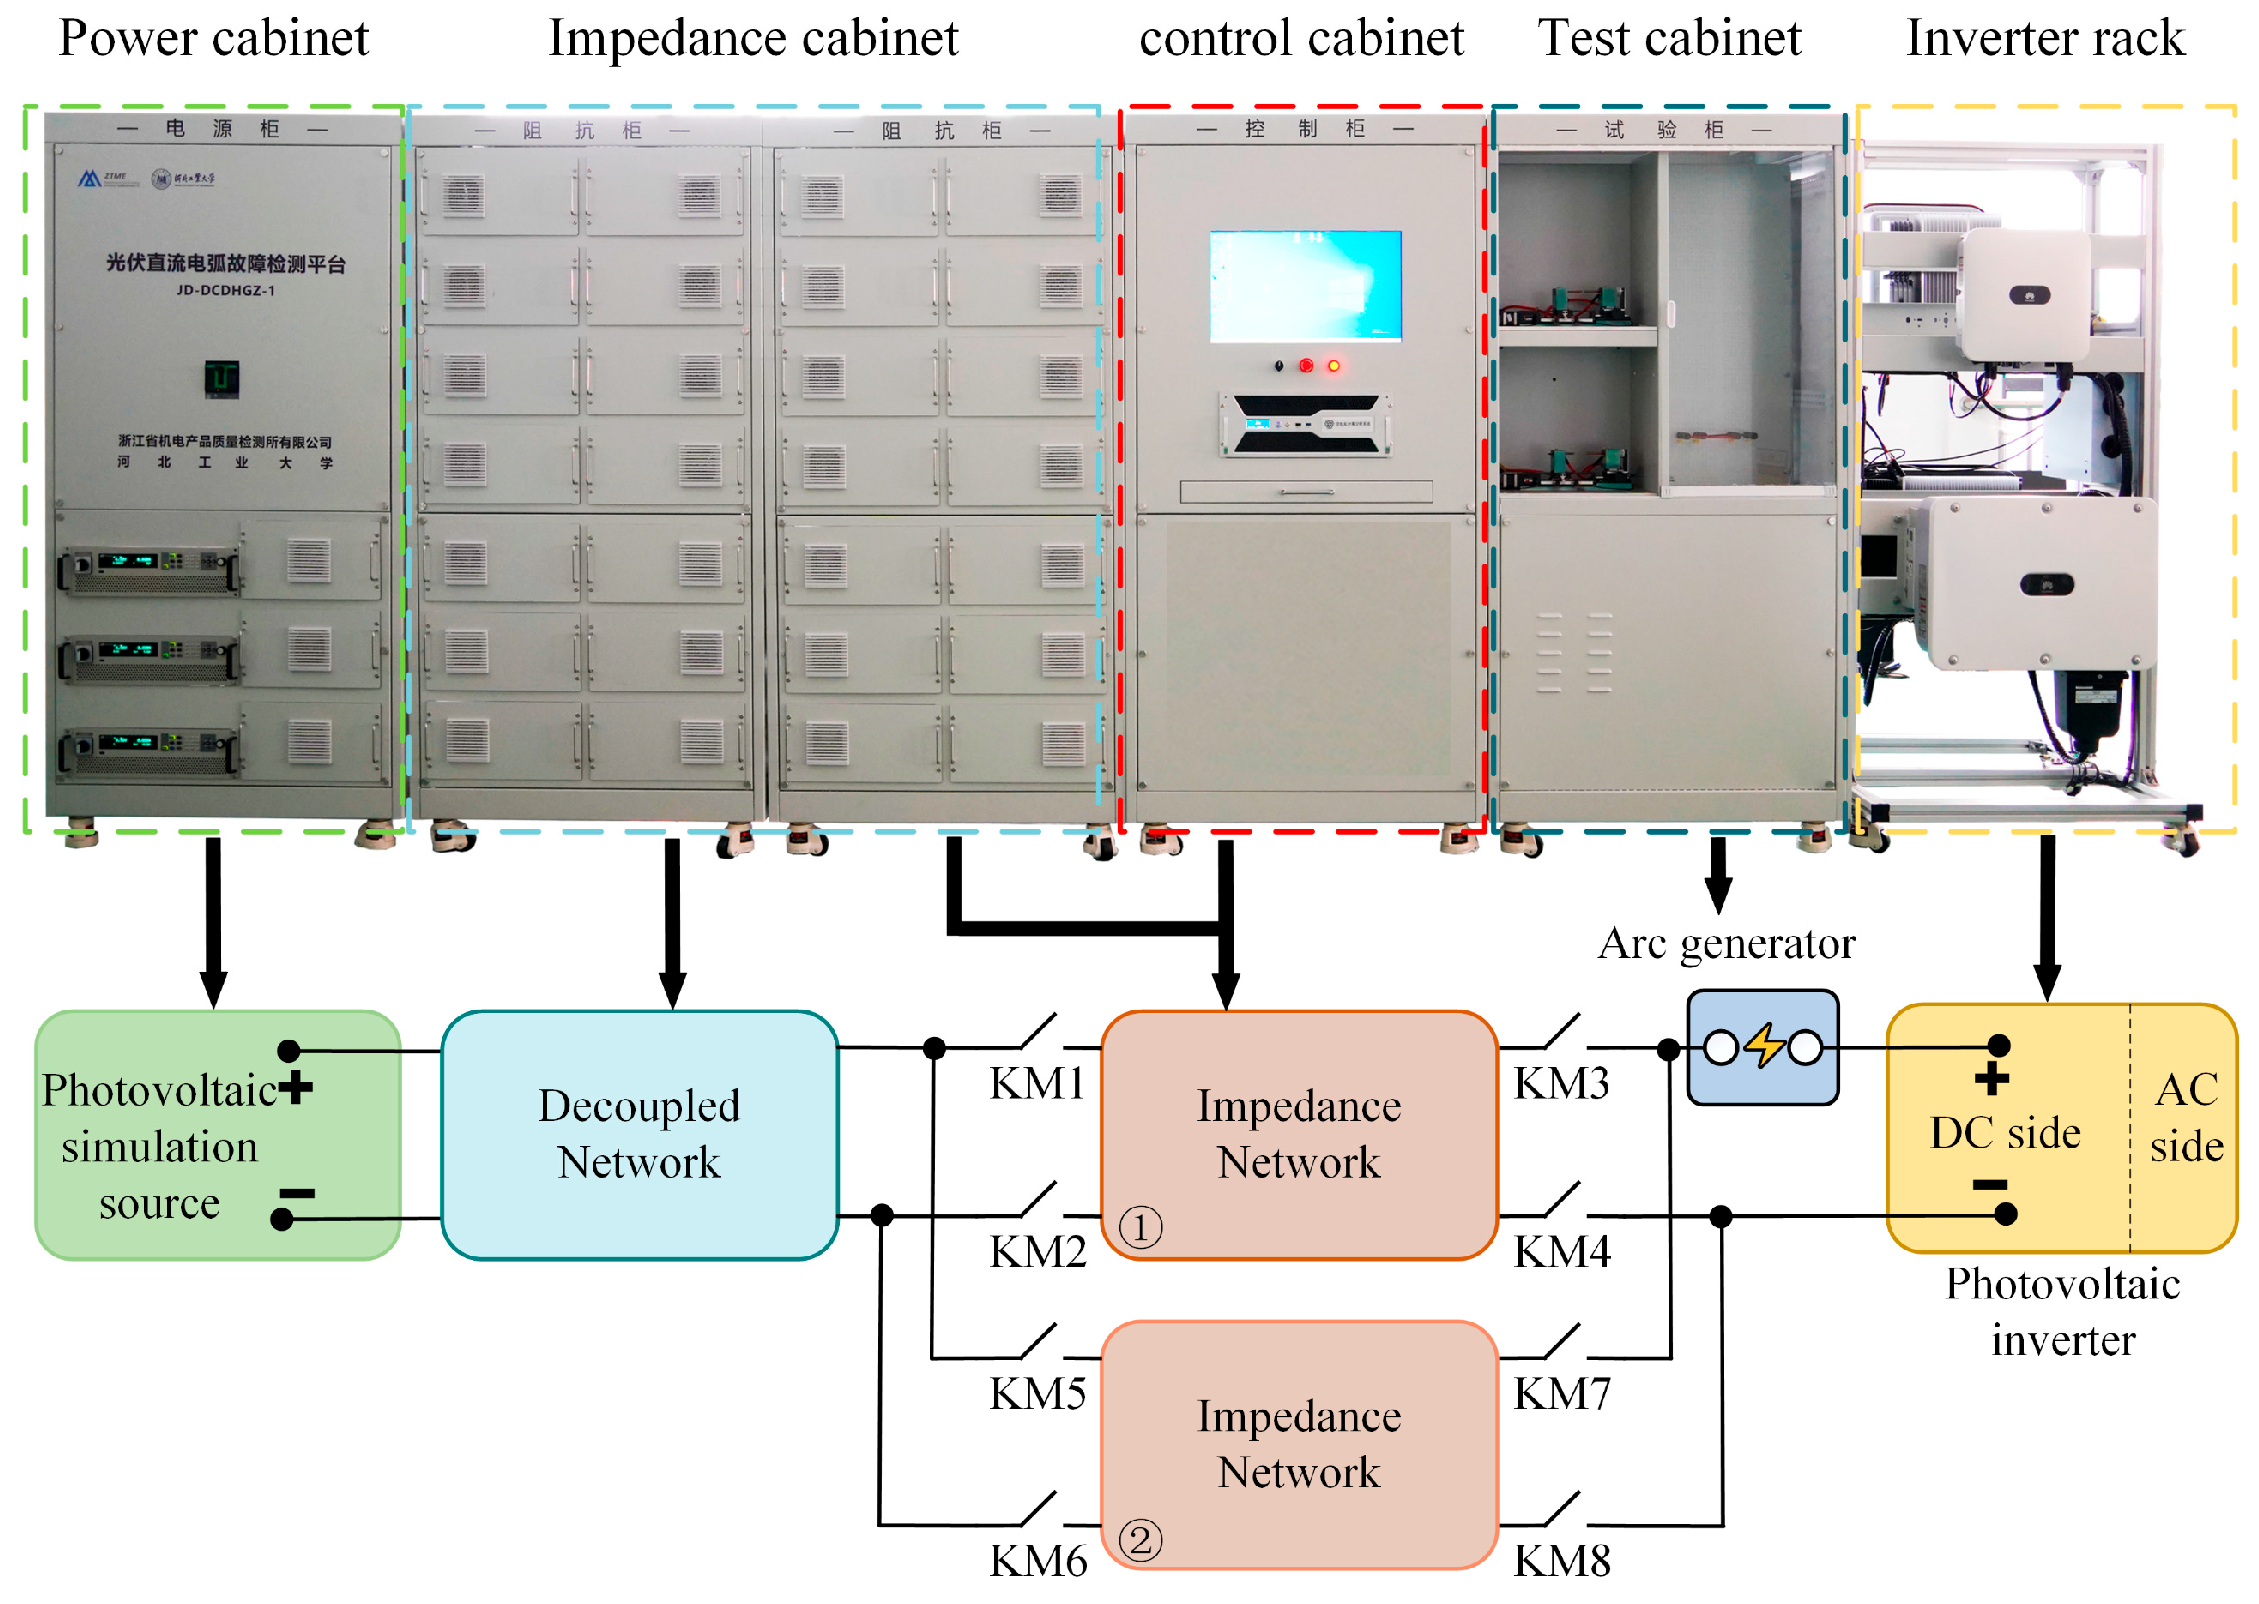
Figure 5 shows the composition of the photovoltaic DC arc fault test platform. From left to right, it can be divided into five parts: power supply, impedance, host computer, arcing device, and inverter.
As the energy source of the whole system, the power supply part is responsible for providing stable and qualified power input. Its performance directly affects the stability and reliability of the system. It needs to have a good voltage adjustment rate and load adjustment rate to ensure that it can output stable voltage and current under different working conditions.
The impedance part plays the role of adjusting the parameters such as resistance, inductance, and capacitance in the circuit. Through the precise control of the impedance, the electrical performance of the system can be optimized, the efficient transmission and conversion of energy can be realized, and the loss and interference in the signal transmission process can be reduced. The upper computer host is the control core of the whole system. It monitors and controls each part in real time and accurately through software programs. The operator can set parameters and issue instructions through the host computer and obtain the running status information of the system in real time, so as to realize the automatic control of the system.
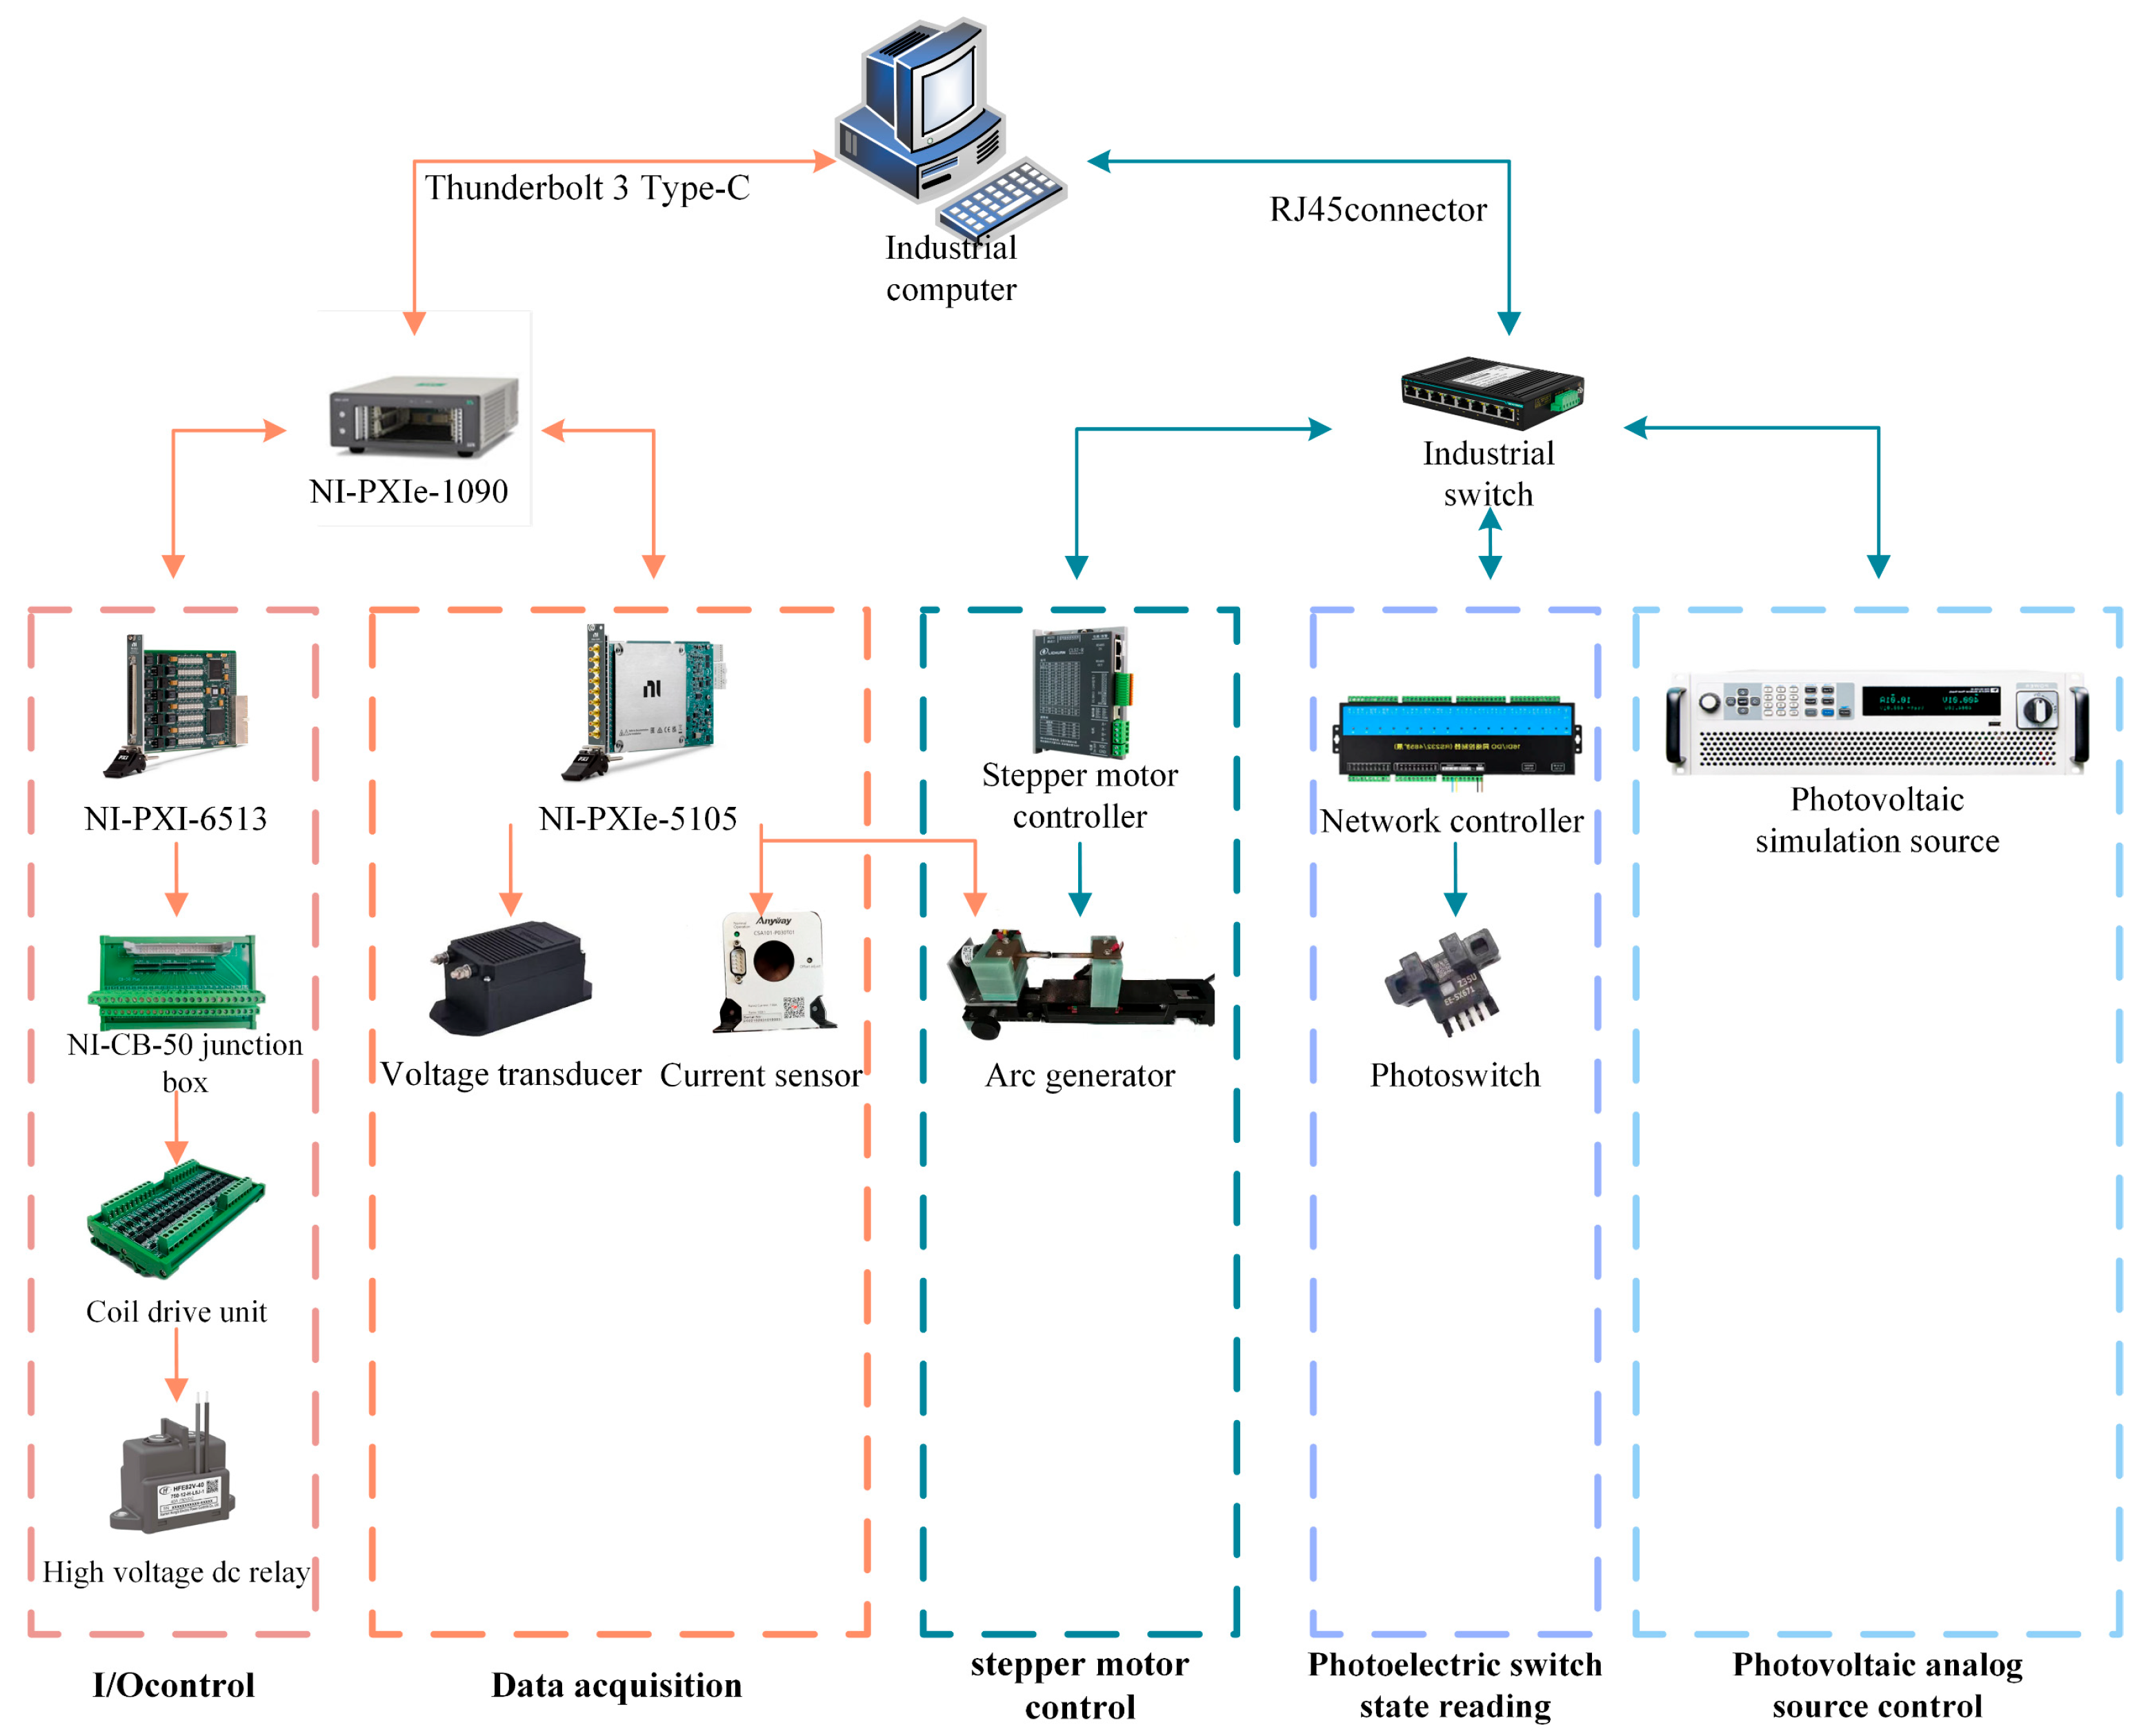
Figure 6 shows the main components of the photovoltaic DC arc fault test platform, involving multiple devices and their connection relationships. NI-S105.6513 (National Instruments Corporation, Austin, USA) is a data acquisition device. Its main function is to collect voltage and current data and provide real-time electrical parameter information for the system. CX-5216 E (FANUC Corporation, Yamanashi, Japan)is a device for relay control and processing trip switch signal input, which can realize the control operation of various relays, so as to control the on–off of the circuit. MAX-Gate300-8D485 is responsible for stepper motor control. The IT6018C-1500-40 is a power supply capable of outputting voltage and current, providing stable power to other devices in the system. Its detailed specifications include a voltage of 1500 V, a current of 40 A, a power of 18 kW, a resolution of 0.1 V/0.001 A, an accuracy of ≤0.02% + 0.02%FS/ ≤ 0.1% + 0.1%FS, and interfaces including USB, CAN, LAN, and digital I/O, with optional GPIB, analog, and RS232 ports. It comes in a 3 U form factor. The host computer is the core control equipment of the whole system. It is connected with NI-S105.6513 through the lightning port to realize the data processing and the overall control of the system. The RJ45 interface network cable is used for network connections between devices and provides data transmission channels. The MIEN2208 (Mitsubishi Electric Corporation, Tokyo, Japan) industrial switch is responsible for the exchange and transmission of network data and connects with other devices through the RJ45 interface network cable to realize communication between devices.
These devices constitute a complete photovoltaic DC arc fault test platform through a specific connection method to realize the functions of voltage and current data acquisition, control signal input and output, and communication between devices.
4.2. Photovoltaic DC Arc Fault Test Platform Control Introduction
4.2.1. Control Design
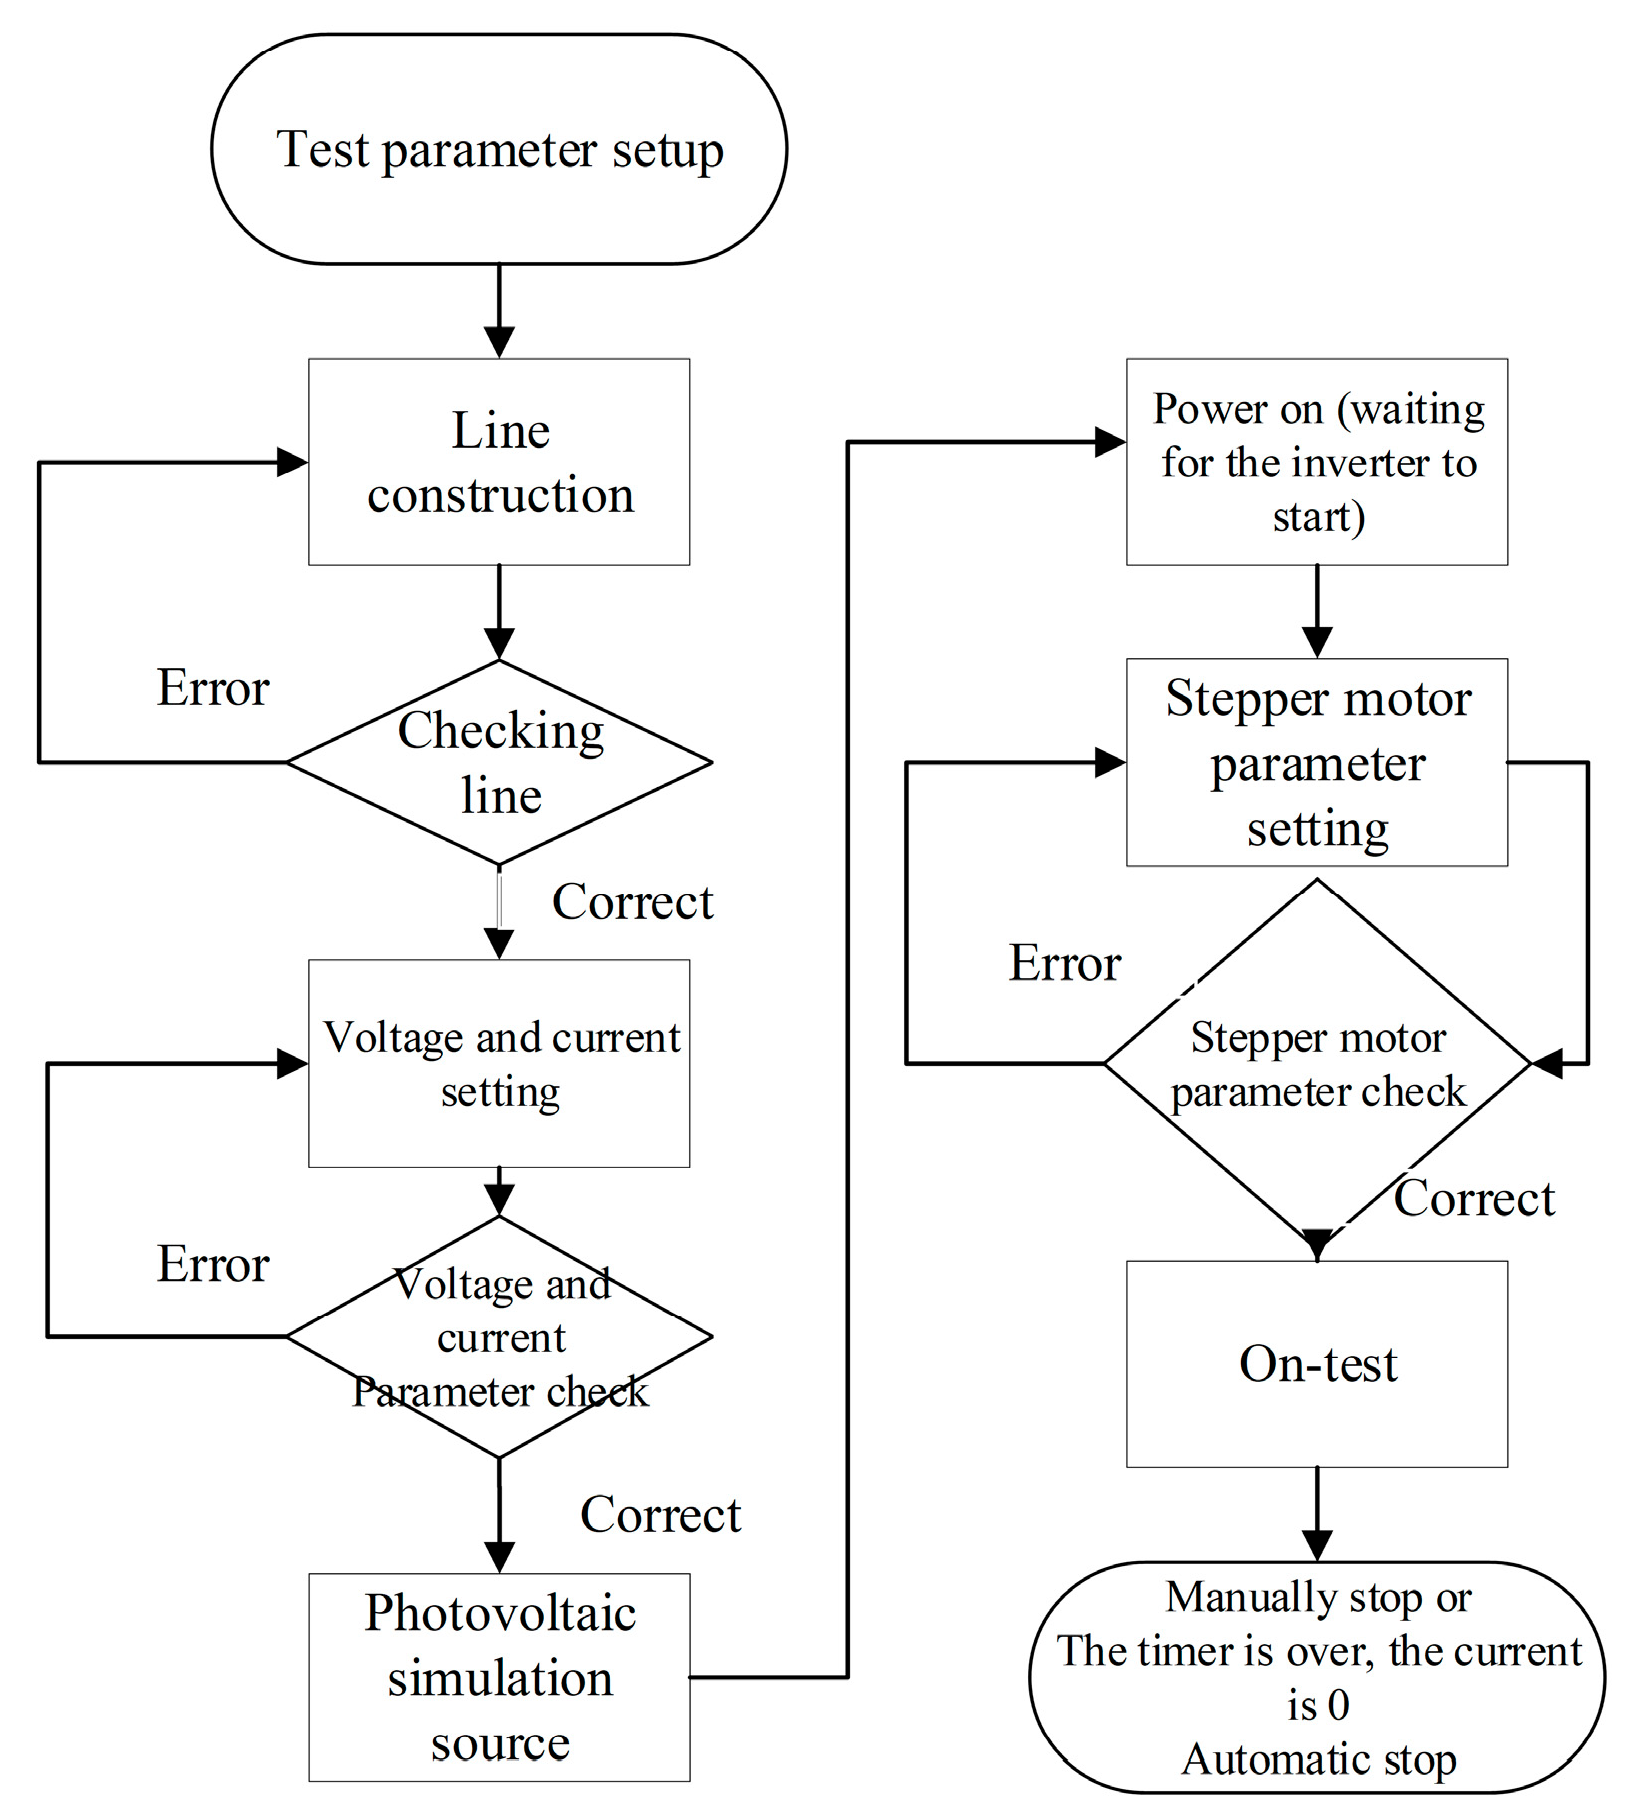
The main program flow of the host computer of the photovoltaic DC arc fault test platform is shown in
Figure 7.
When determining the test parameters, the system compares the four relevant standards and combines the test conditions and the classification rules of the applicable working conditions to accurately obtain the specific parameters. Through the form of options, the classification of each standard under different working conditions is listed in detail, covering key parameters such as maximum working current, maximum working voltage, and total resistance. At the same time, according to the difference in electrical performance and rated parameters of the tested equipment, the test conditions are classified in detail, which lays a foundation for the accurate detection of arc faults.
Based on the above rigorous classification, in the actual setting of test parameters, the most suitable test conditions and parameters can be quickly selected from the preset table according to the specific grade and characteristics of the tested equipment. This method makes the test process more suitable for the actual operational state of the equipment, greatly improves the reliability and effectiveness of the test results, meets the diversified test requirements of different levels of equipment, and effectively guarantees the accuracy and practicality of the photovoltaic DC arc fault test platform.
After the test parameters are set, the next step is to enter the test operation. First of all, according to the four standards of line construction requirements, the host computer sends electrical signals, and the photovoltaic DC arc fault test platform will automatically build the line according to the wiring diagram, and after the completion of the construction, check whether the line connection is correct to avoid short circuit, open circuit and other problems. Then, according to the selected test parameters, the voltage and current are set reasonably and checked again. After ensuring that the line and parameters are correct, the output of the photovoltaic analog source is turned on to supply power to the detection device, and the inverter is also started and initialized. Then, set the stepper motor parameters and check them. When all the preparations are ready and the parameters are accurate, the test is officially started. During the test, the device will continuously monitor the arc fault in the photovoltaic DC line. Once the manual stop operation, timing end, or detection of current is 0, the device will automatically stop the test.
4.2.2. PC Software Design
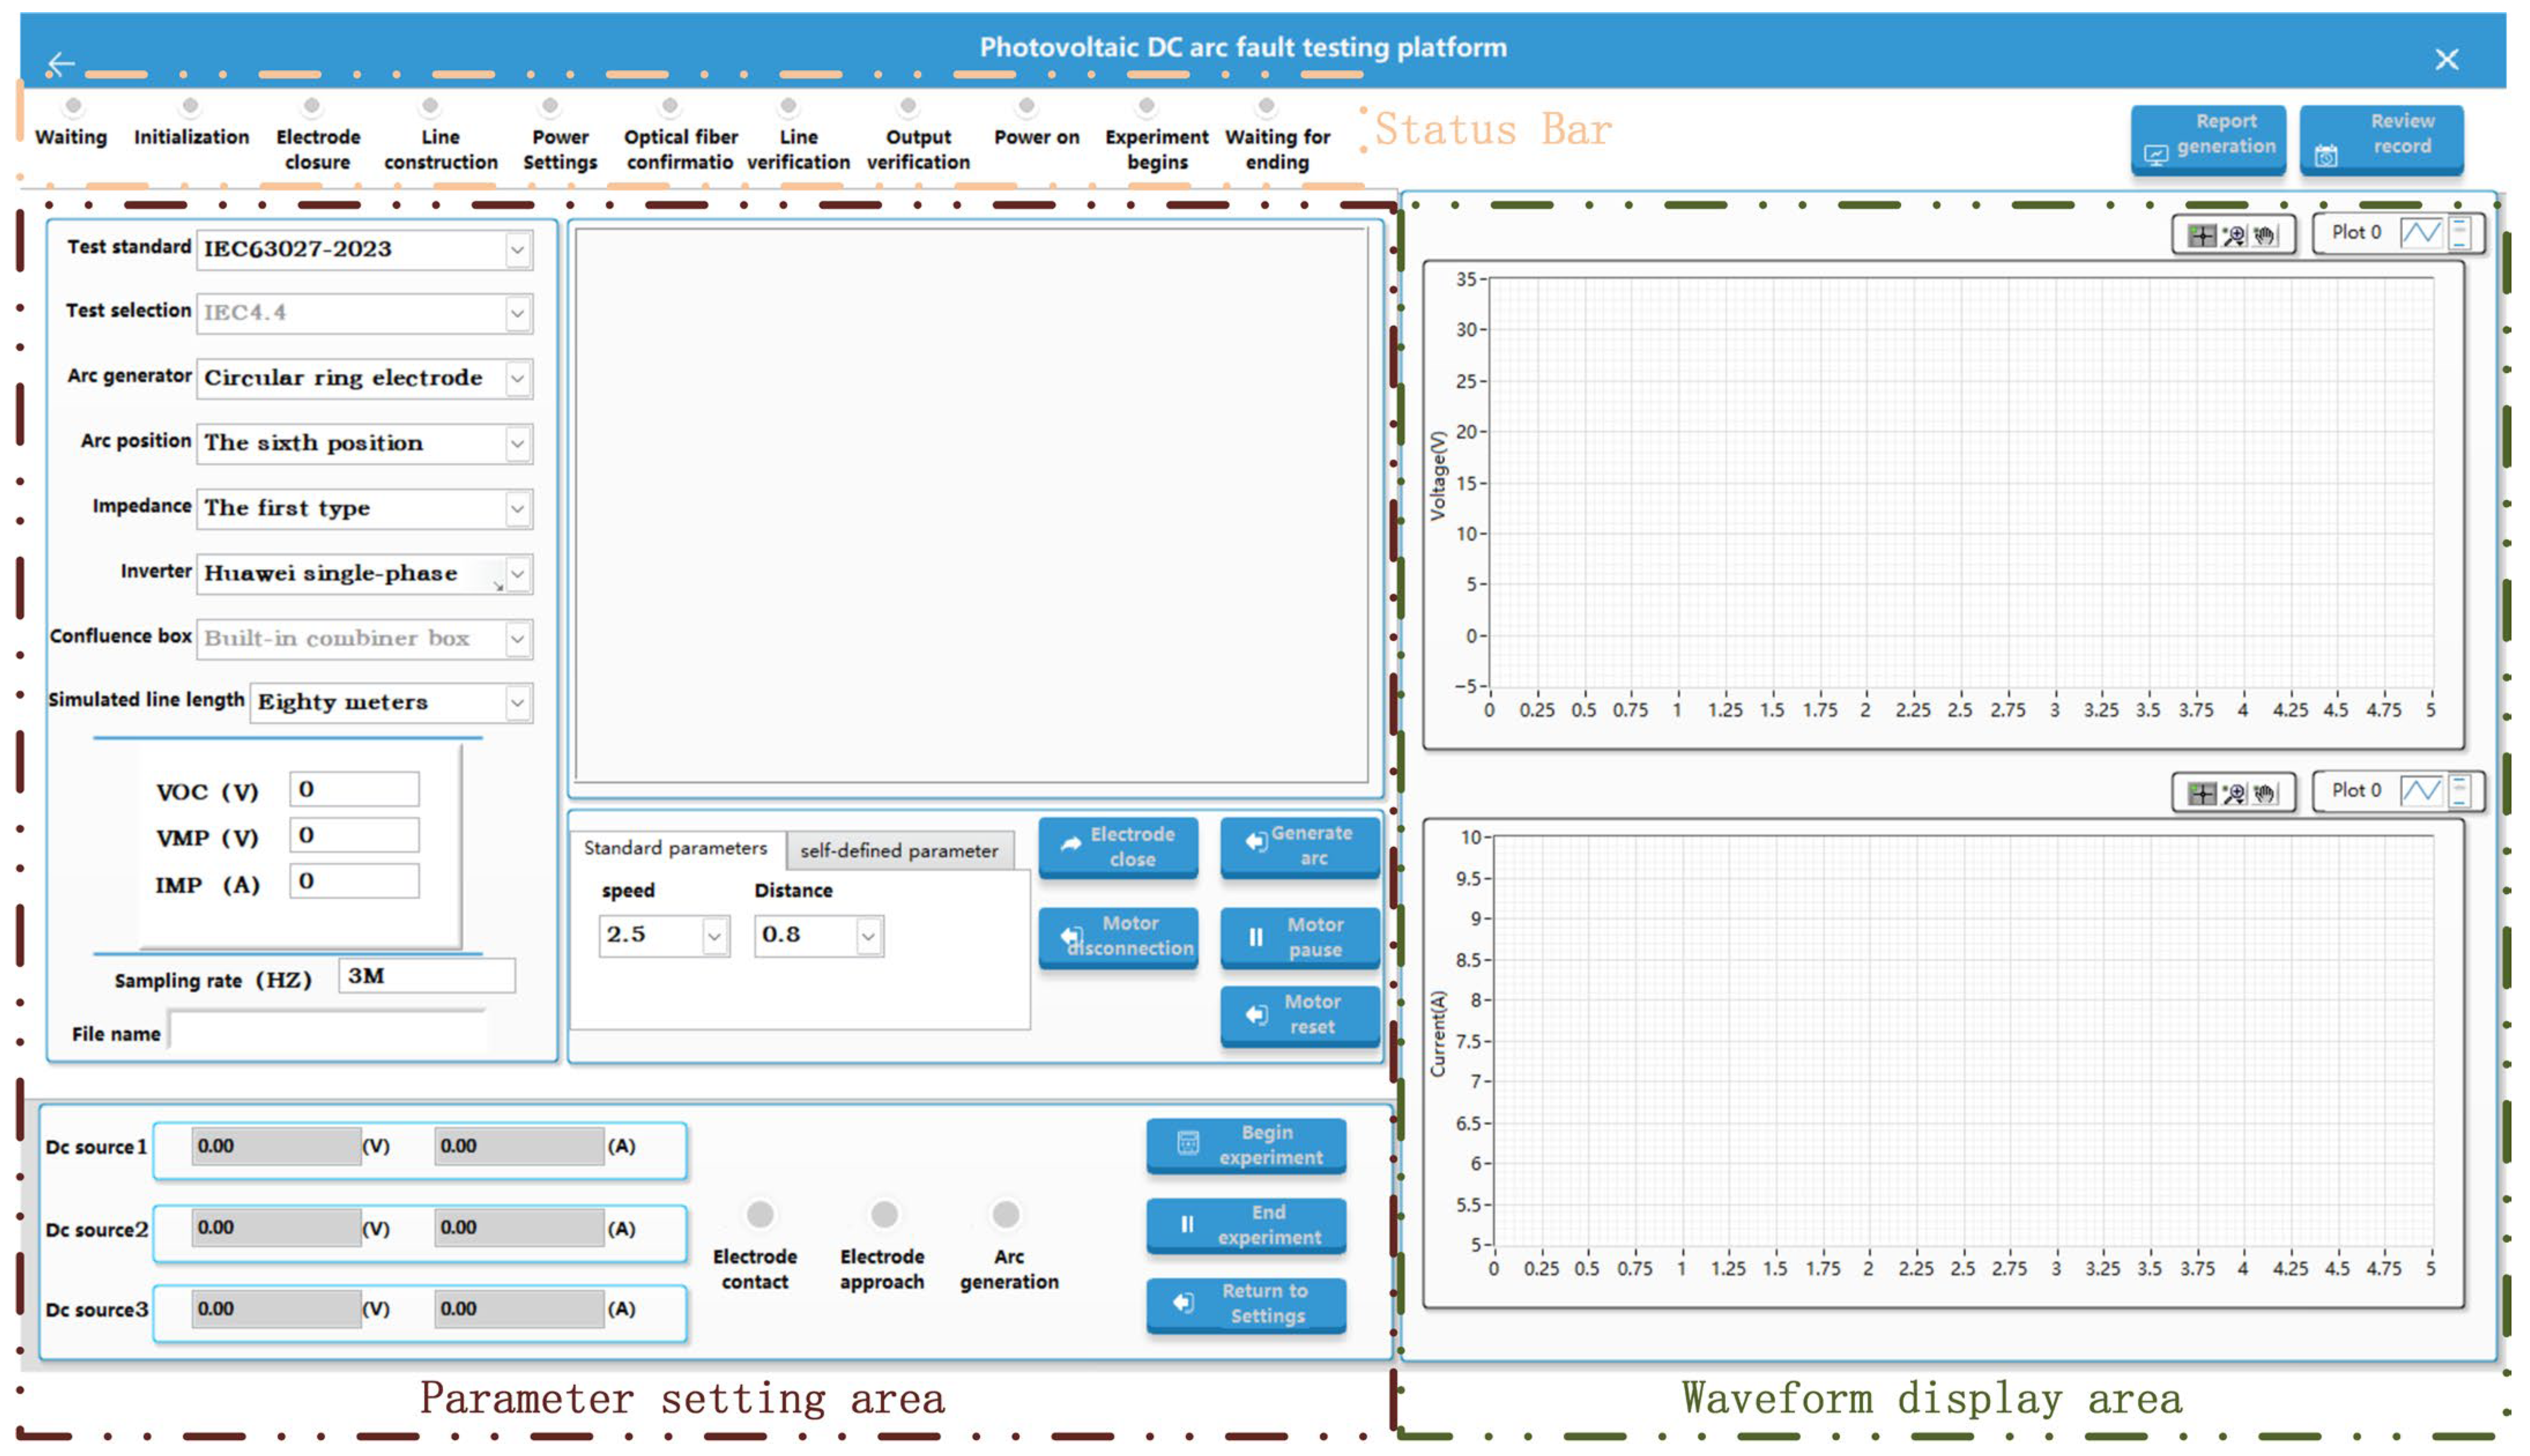
As a professional test tool, the interface design and functional layout of the ‘photovoltaic DC arc fault test platform’ are very important for testers to carry out test work efficiently and accurately. The interface of the platform will be analyzed in detail below. The interface diagram of the photovoltaic DC arc fault test platform is shown in
Figure 8.
The interface design of the test platform is clear and intuitive, and the division of labor in each functional area is clear. The slender status bar at the top of the interface will display the working status of the platform in real time. From ‘waiting’ and ‘initialization’, to ‘line construction’, ‘power supply setting’ and a series of steps, until ‘waiting for the end’, the state changes of each link are clear at a glance, providing clear operational guidance for testers to ensure the orderly advancement of the test process.
The left side of the interface is the parameter setting area, which is one of the core parts of the platform. At the top of the area, there are two drop-down menus: ‘test standard‘ and ‘test selection’. The ‘Test Standard’ menu provides a variety of options that users can choose on demand; the ‘Test Selection’ menu includes test standards such as ‘UL 1699B’, which is convenient for users to carry out standardized tests.
Below the menu is the simulation environment parameter setting module for different working conditions. Users can choose different types of ‘arcing devices’ such as ‘ring electrode’ and accurately control the arcing at different positions of the line through multiple options such as ‘arcing position 1’. The ‘impedance selection’ will provide the corresponding scheme according to the selected standard parameters. ‘Inverter selection’ lists ‘Huawei SUN2000-50KTL-L1’ and other models to meet the test requirements of different equipment. In addition, the ‘analog line length‘ input box can simulate the actual photovoltaic line, and the parameters such as ‘voltage (V)’, ‘current (A)’, and ‘sampling rate (HZ)’ can be adjusted on demand. The ‘file name’ input box is convenient for data naming and storage.
The middle of the parameter setting area is the motor control and arc control button area, which is divided into two tabs: ‘standard parameters’ and ‘custom parameters’. On the ‘Standard Parameters’ tab, users can quickly set parameters such as ‘arcing speed’ and ‘arcing distance’ and achieve accurate control of the arcing process through buttons such as ‘motor lock’ and ‘manual arcing’. The ‘custom parameters’ tab allows users to freely adjust relevant parameters according to special needs.
The data display area on the right side of the interface is composed of two waveform chart boxes. After the test is started, the program will automatically identify the arcing data. The upper chart box displays the voltage change curve during arcing in real time, and the lower chart box presents the arc current change curve to realize automatic data display.
In the lower right corner of the interface, there is a test control button area. The ‘Start Test’ button starts the test, the ‘Stop Data’ button suspends the data collection, and the ‘Clear Data’ button clears the current test data for subsequent testing. The ‘Start Test’ button starts the test, the ‘Stop Data’ button suspends the data collection, and the ‘Clear Data’ button clears the current test data for subsequent testing.
5. Function Verification and Fault Feature Analysis of Test Platform
The photovoltaic DC arc fault test platform has many hardware equipment, and the loop voltage is high during the test, which poses certain safety risks. After completing the hardware and software design and platform construction, in order to ensure the safe and reliable operation of the platform and achieve the expected design indicators, it is necessary to carry out system testing and performance verification. In order to ensure that the test is comprehensive and reliable, two principles are followed: First, a rigorous test plan is formulated to test the function realization module, sub-VI, subsystem and even the total system in an all-round way, covering all working conditions, troubleshooting logical and accidental faults; secondly, simulate the daily operation process of testers, carry out tests in an environment close to actual use, and discover potential problems in advance. The following assumptions are made in this study: the tests were conducted under stable atmospheric conditions without significant electromagnetic interference, and the power network was assumed not to introduce interference into the test circuits. The power quality of both the power supply and the array simulator complied with relevant standards, with output harmonic distortion not exceeding 2.5%. In addition, the arc generator electrodes met the required dimensional specifications and were capable of producing a stable arc. The boundary conditions for the tests were established based on the arc test requirements specified in the standards referenced in
Section 3.2.1.—UL 1699B, IEC 63027, GBT 39750, and CGC/GF 175. These standards define key parameters, including minimum arc current, maximum operating current, arc rate, maximum operating voltage, open-circuit voltage, total resistance, and arc separation distance. Each standard categorizes and specifies these parameters for different equipment levels and operating conditions, providing corresponding test combinations. All experiments were conducted within clearly defined electrical and mechanical parameter ranges, ensuring repeatable conditions, comparable results, and consistent boundary constraints for reliable arc fault simulation. After rigorous testing, the series arc fault detection [
25,
26,
27] has reached the expected design standard, and the platform is safe and reliable.
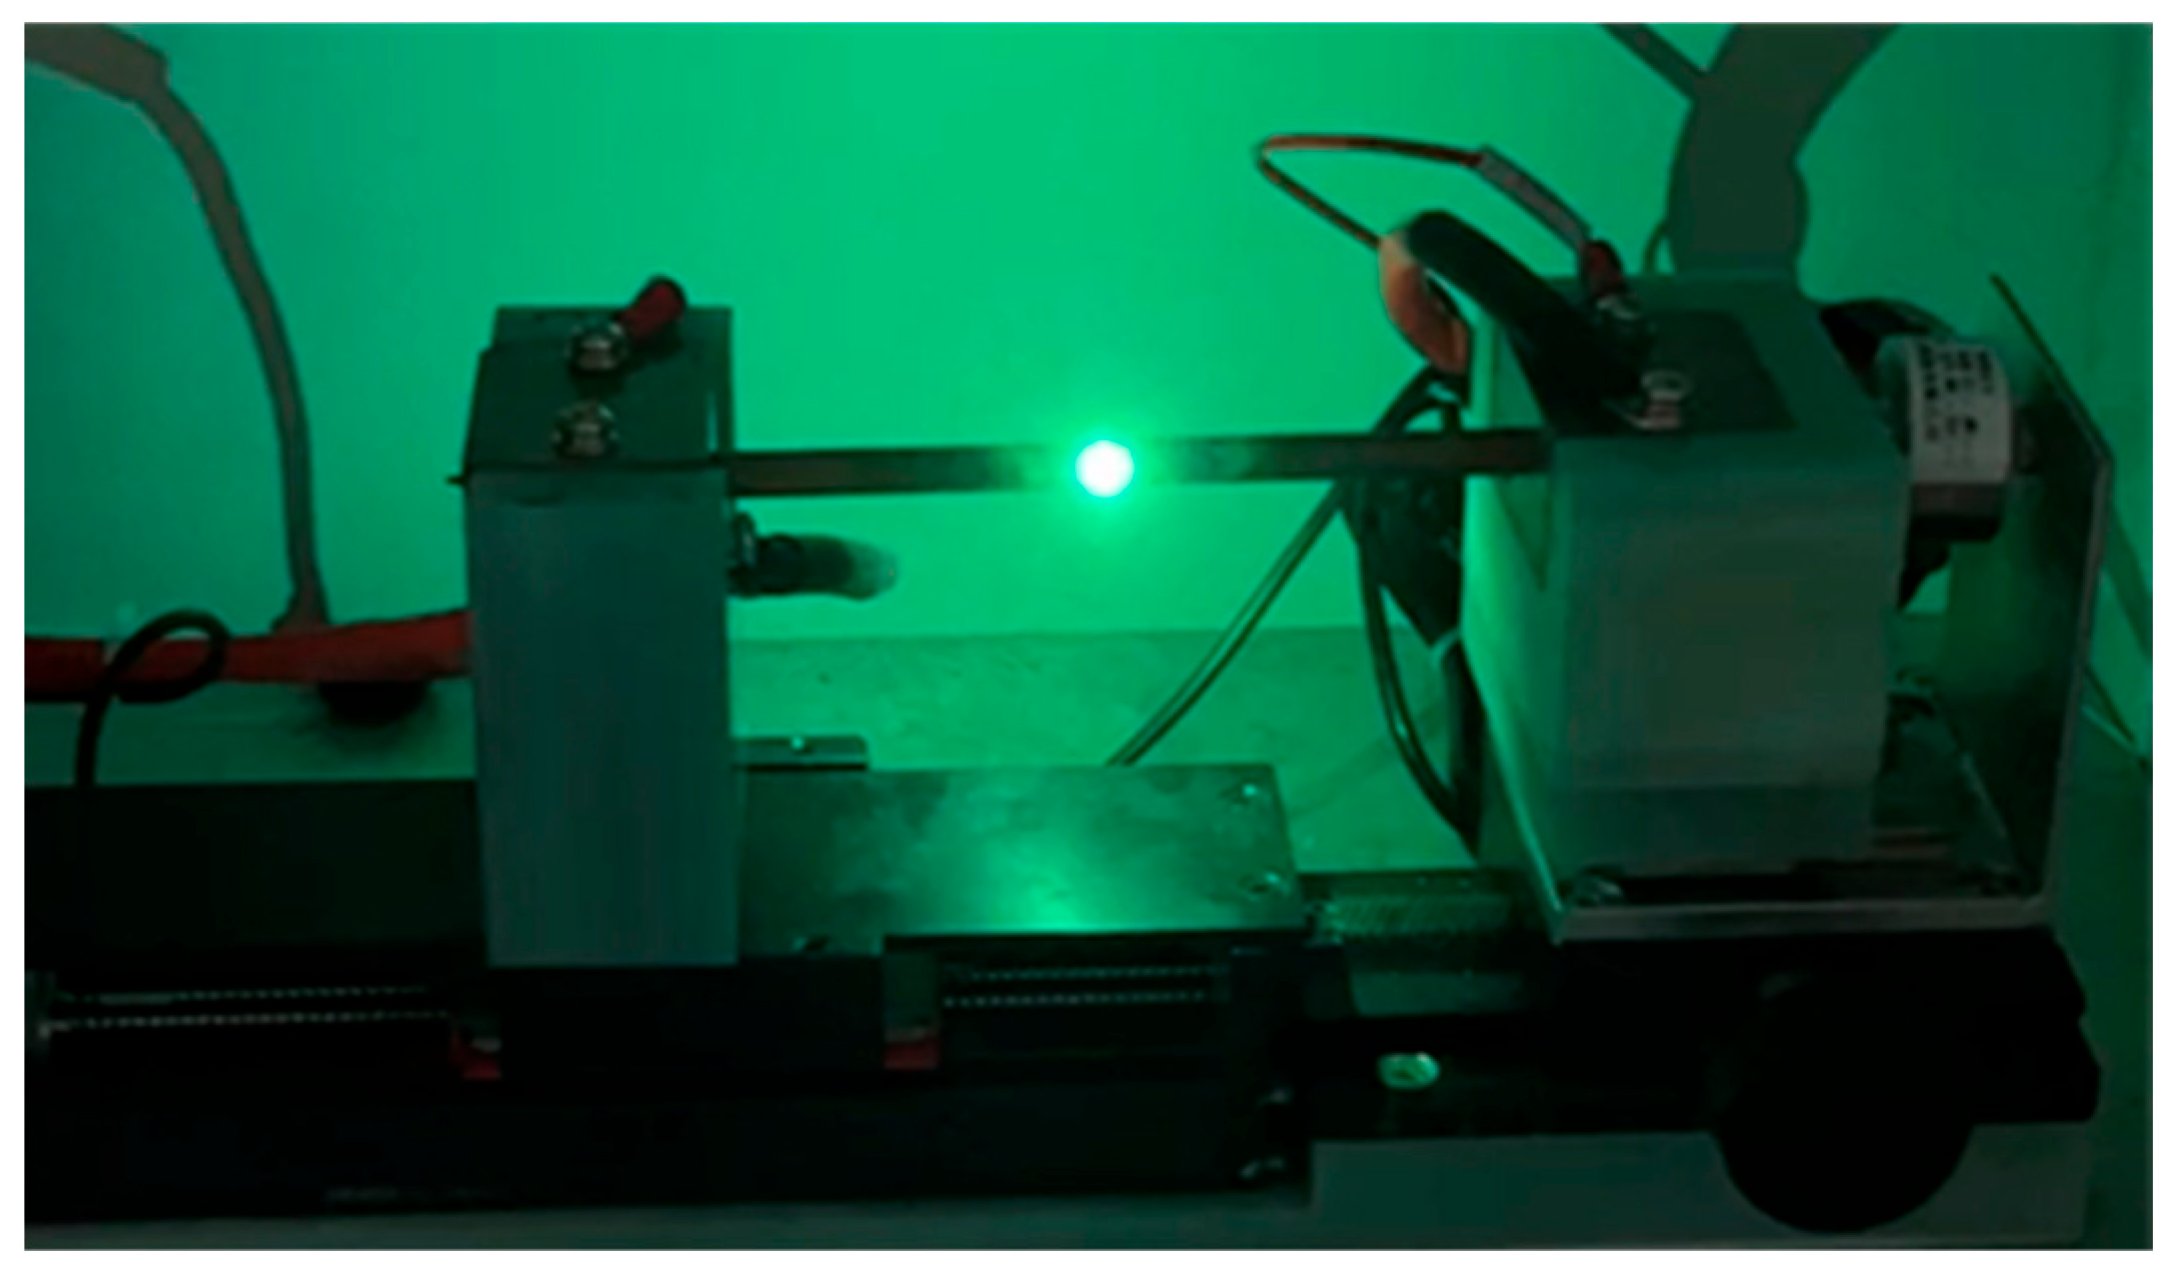
Figure 9 shows the state when the arc generator generates a series of fault arcs. The four-standard arc test of the same sinker is shown in
Figure 10.
Figure 10a–d present the arc test waveforms obtained under identical operating conditions for the IEC 63027, UL 1699B, GBT 39750, and CGC/GF 175 standards, respectively. Overall, these four standards exhibit a high degree of consistency in their requirements for decoupling networks. Their core technical indicators, performance verification methods, and application specifications are largely harmonized, providing clear industry guidance for decoupling network design and testing. Consequently, users can design, manufacture, and test in accordance with any of these standards without encountering conflicts among them.
However, a unified industry standard for linear impedance networks has yet to be established. Different standards define key parameters—such as network impedance—differently, creating challenges for universal design. Nevertheless, despite these variations, arc test results obtained under identical conditions (e.g., uniform voltage level, current intensity, and load type) show no significant differences among the four standards, offering flexibility in test implementation for specific applications.
In order to further analyze the influence of different experimental conditions such as arc location and line length on arc fault characteristics, the influence factors of arc characteristics were analyzed.
5.1. Analysis of the Influence of Arc Location on Arc Characteristics
In arc fault detection, the location of the arc will significantly affect the characteristics of the current signal in terms of time and frequency [
28,
29]. Generally speaking, the arc fault protection device often only collects the current signal from a certain DC bus, usually the DC positive bus, in order to identify the arc fault. When the fault arc appears at the starting position of the series line, the fault point is close to the sensor collecting the current signal, the resistance and obstruction of the line are small, and the signal does not pass through the power electronic device, so the characteristics of the current signal are very obvious and easy to detect. However, when the fault arc occurs at the end of the series line, the fault point is far away from the sensor, the line resistance and obstruction become larger, and the signal also passes through the power electronic device, which weakens the characteristics of the current signal and increases the difficulty of fault identification.
When exploring the influence of the arc position on the current signal characteristics, the test condition is 8 A, the module level series string line is used, the flat electrode is used, the length of the 80 m analog line is 80 m, and the C4 in the impedance network is 1.5 μF.
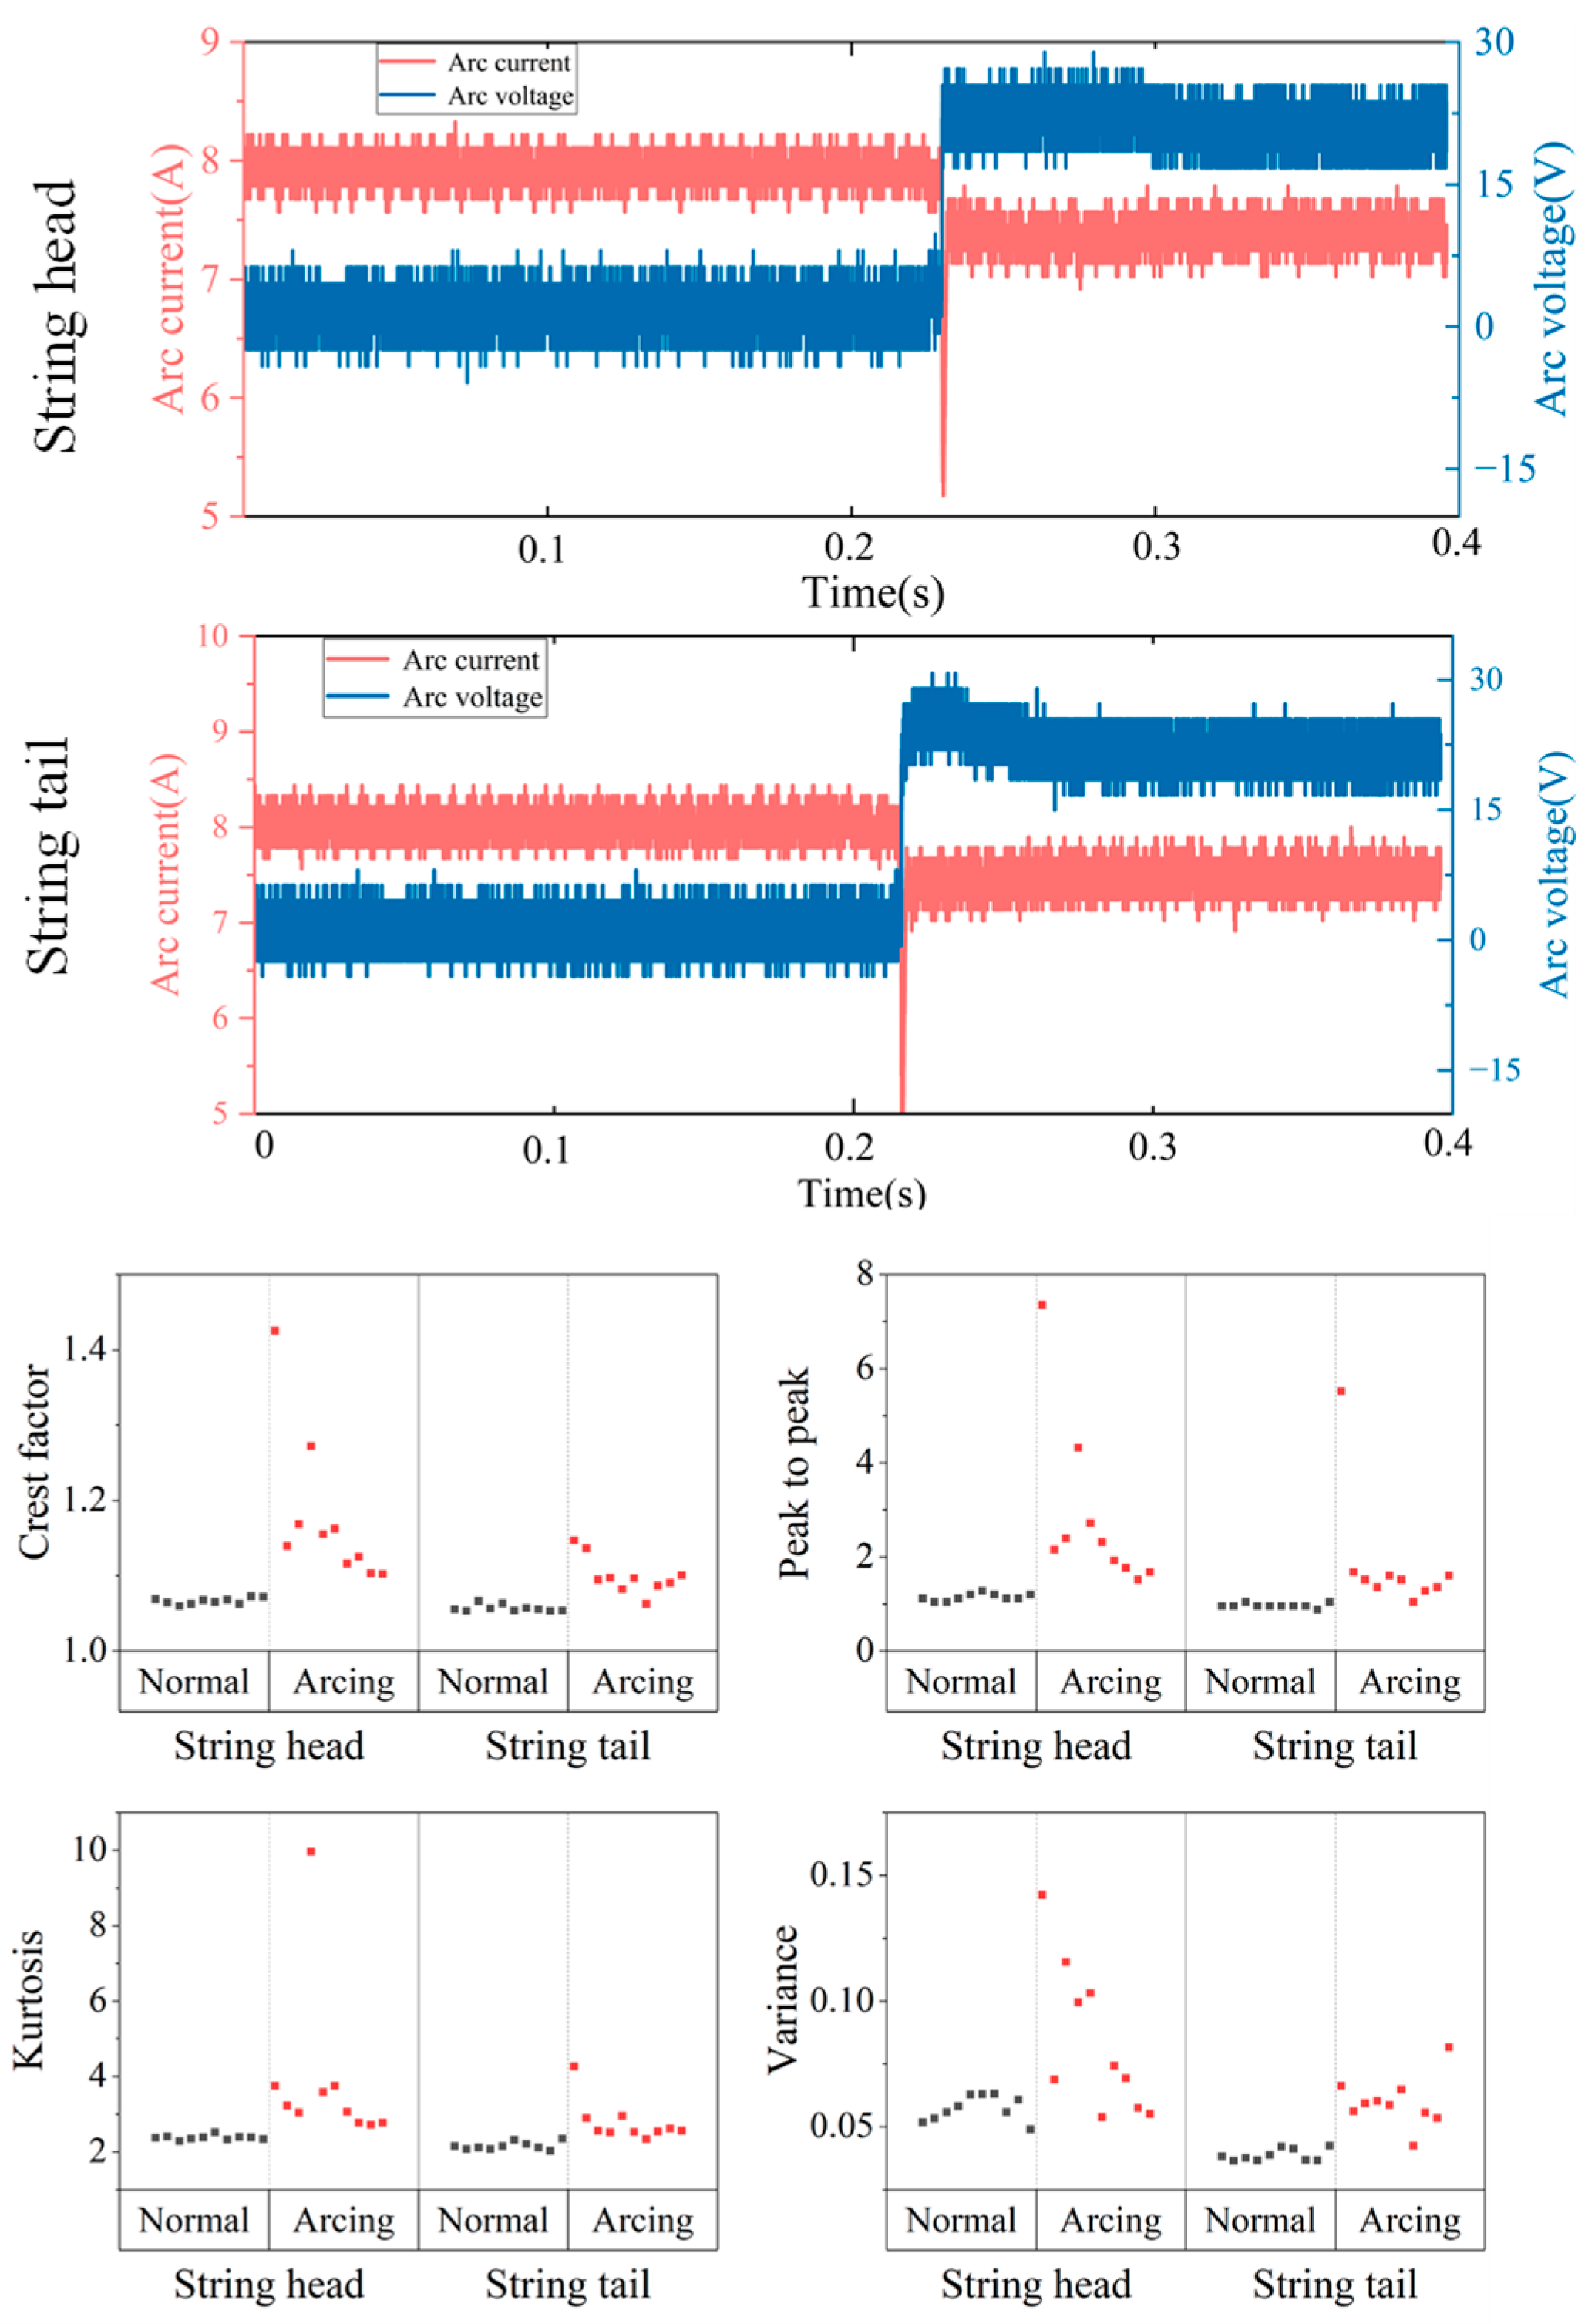
Figure 11 shows the characteristics of the current signal in the time domain when the arc fault occurs at different positions. Time domain feature analysis refers to the extraction of indicators that can characterize the characteristics of the signal by analyzing the changes in the signal on the time axis [
30]. In this paper, the time domain characteristics of the current signal mainly include peak factor, peak-to-peak value, kurtosis, and variance. Under normal conditions, the time domain characteristics of the current signal at the starting position (string head) and the end position (string tail) of the series line are the same. But when the fault arc occurs, the situation changes. Since the air has not been completely broken down, a stable conductive channel has not yet been formed, and the current will fluctuate violently. At this time, a large number of spikes and burrs will appear in the current signal, which makes the time domain characteristics of the fault arc state significantly stronger than the normal state. Further comparison of the time-domain characteristics of the arc fault at the head of the string and the tail of the string shows that the time-domain characteristics of the arc fault at the head of the string are significantly stronger. The larger peak factor and variance mean that the fluctuation of the signal peak is greater, and the larger peak-to-peak value means that the fluctuation of the signal is greater. A higher kurtosis indicates that the signal has more extreme values or spikes. This is because when the arc fault occurs at the series tail position, the current signal needs to go through a long line. The resistance and obstruction of the line itself will weaken the signal strength, and the signal will also be interfered with by power electronic devices. These factors are superimposed together, resulting in the time domain characteristics of the fault arc at the tail position of the string not being as obvious as those at the head position of the string.
As shown in
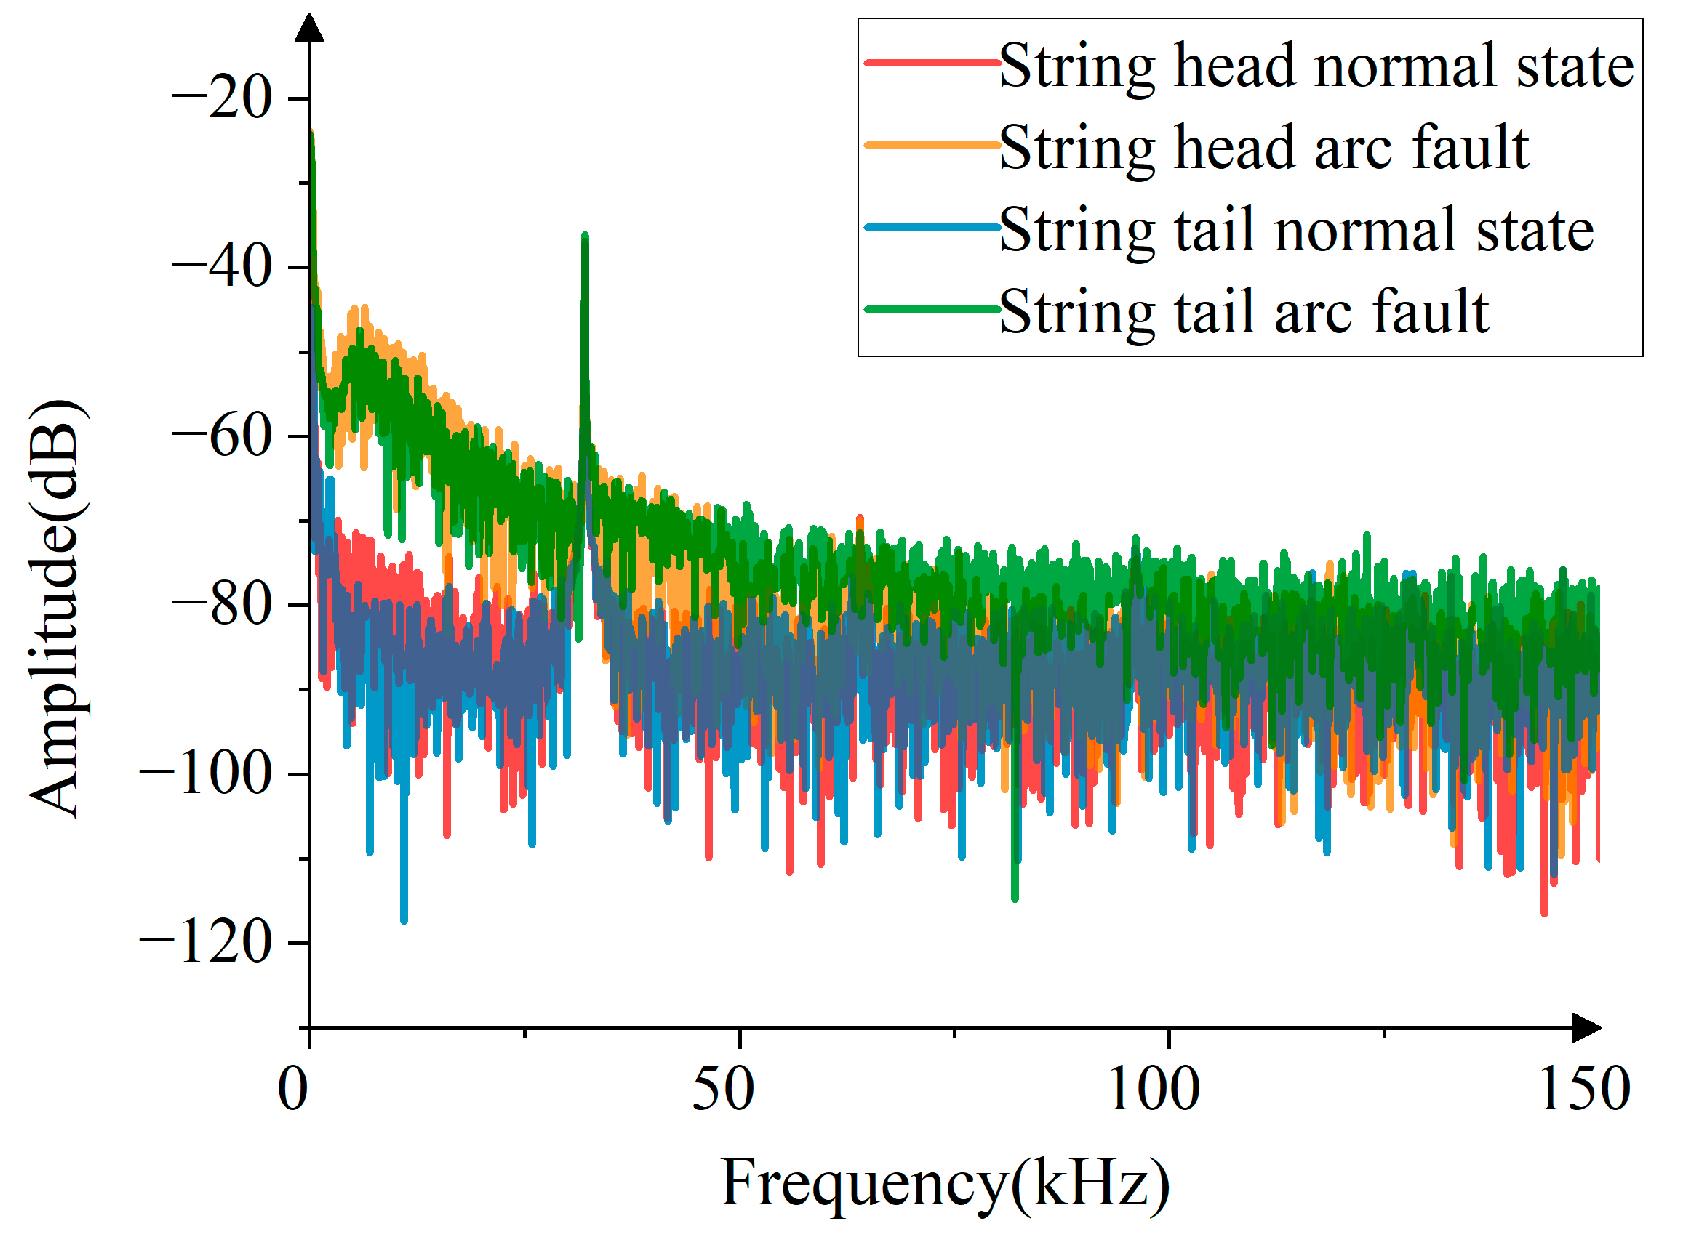
Figure 12, the signal frequency domain characteristics of different fault arc locations [
31], in which the red line is the frequency spectrum characteristic under the normal state of the string head position, the yellow line is the frequency spectrum characteristic under the fault arc state of the string head position, the blue line is the frequency spectrum characteristic under the normal state of the string tail position, and the green line is the frequency spectrum characteristic under the fault arc state of the string tail position. It can be seen from
Figure 12 that the current signal shows the maximum spectral amplitude at the frequency of 32 kHz in all states, because the switching frequency of the inverter used is 32 kHz. The spectrum amplitude of the fault arc state below 150 kHz is greater than that of the normal state, especially below 32 kHz, where the spectrum amplitude of the fault arc state is significantly higher than that of the normal state.
5.2. Analysis of the Influence of Line Length on Arc Characteristics
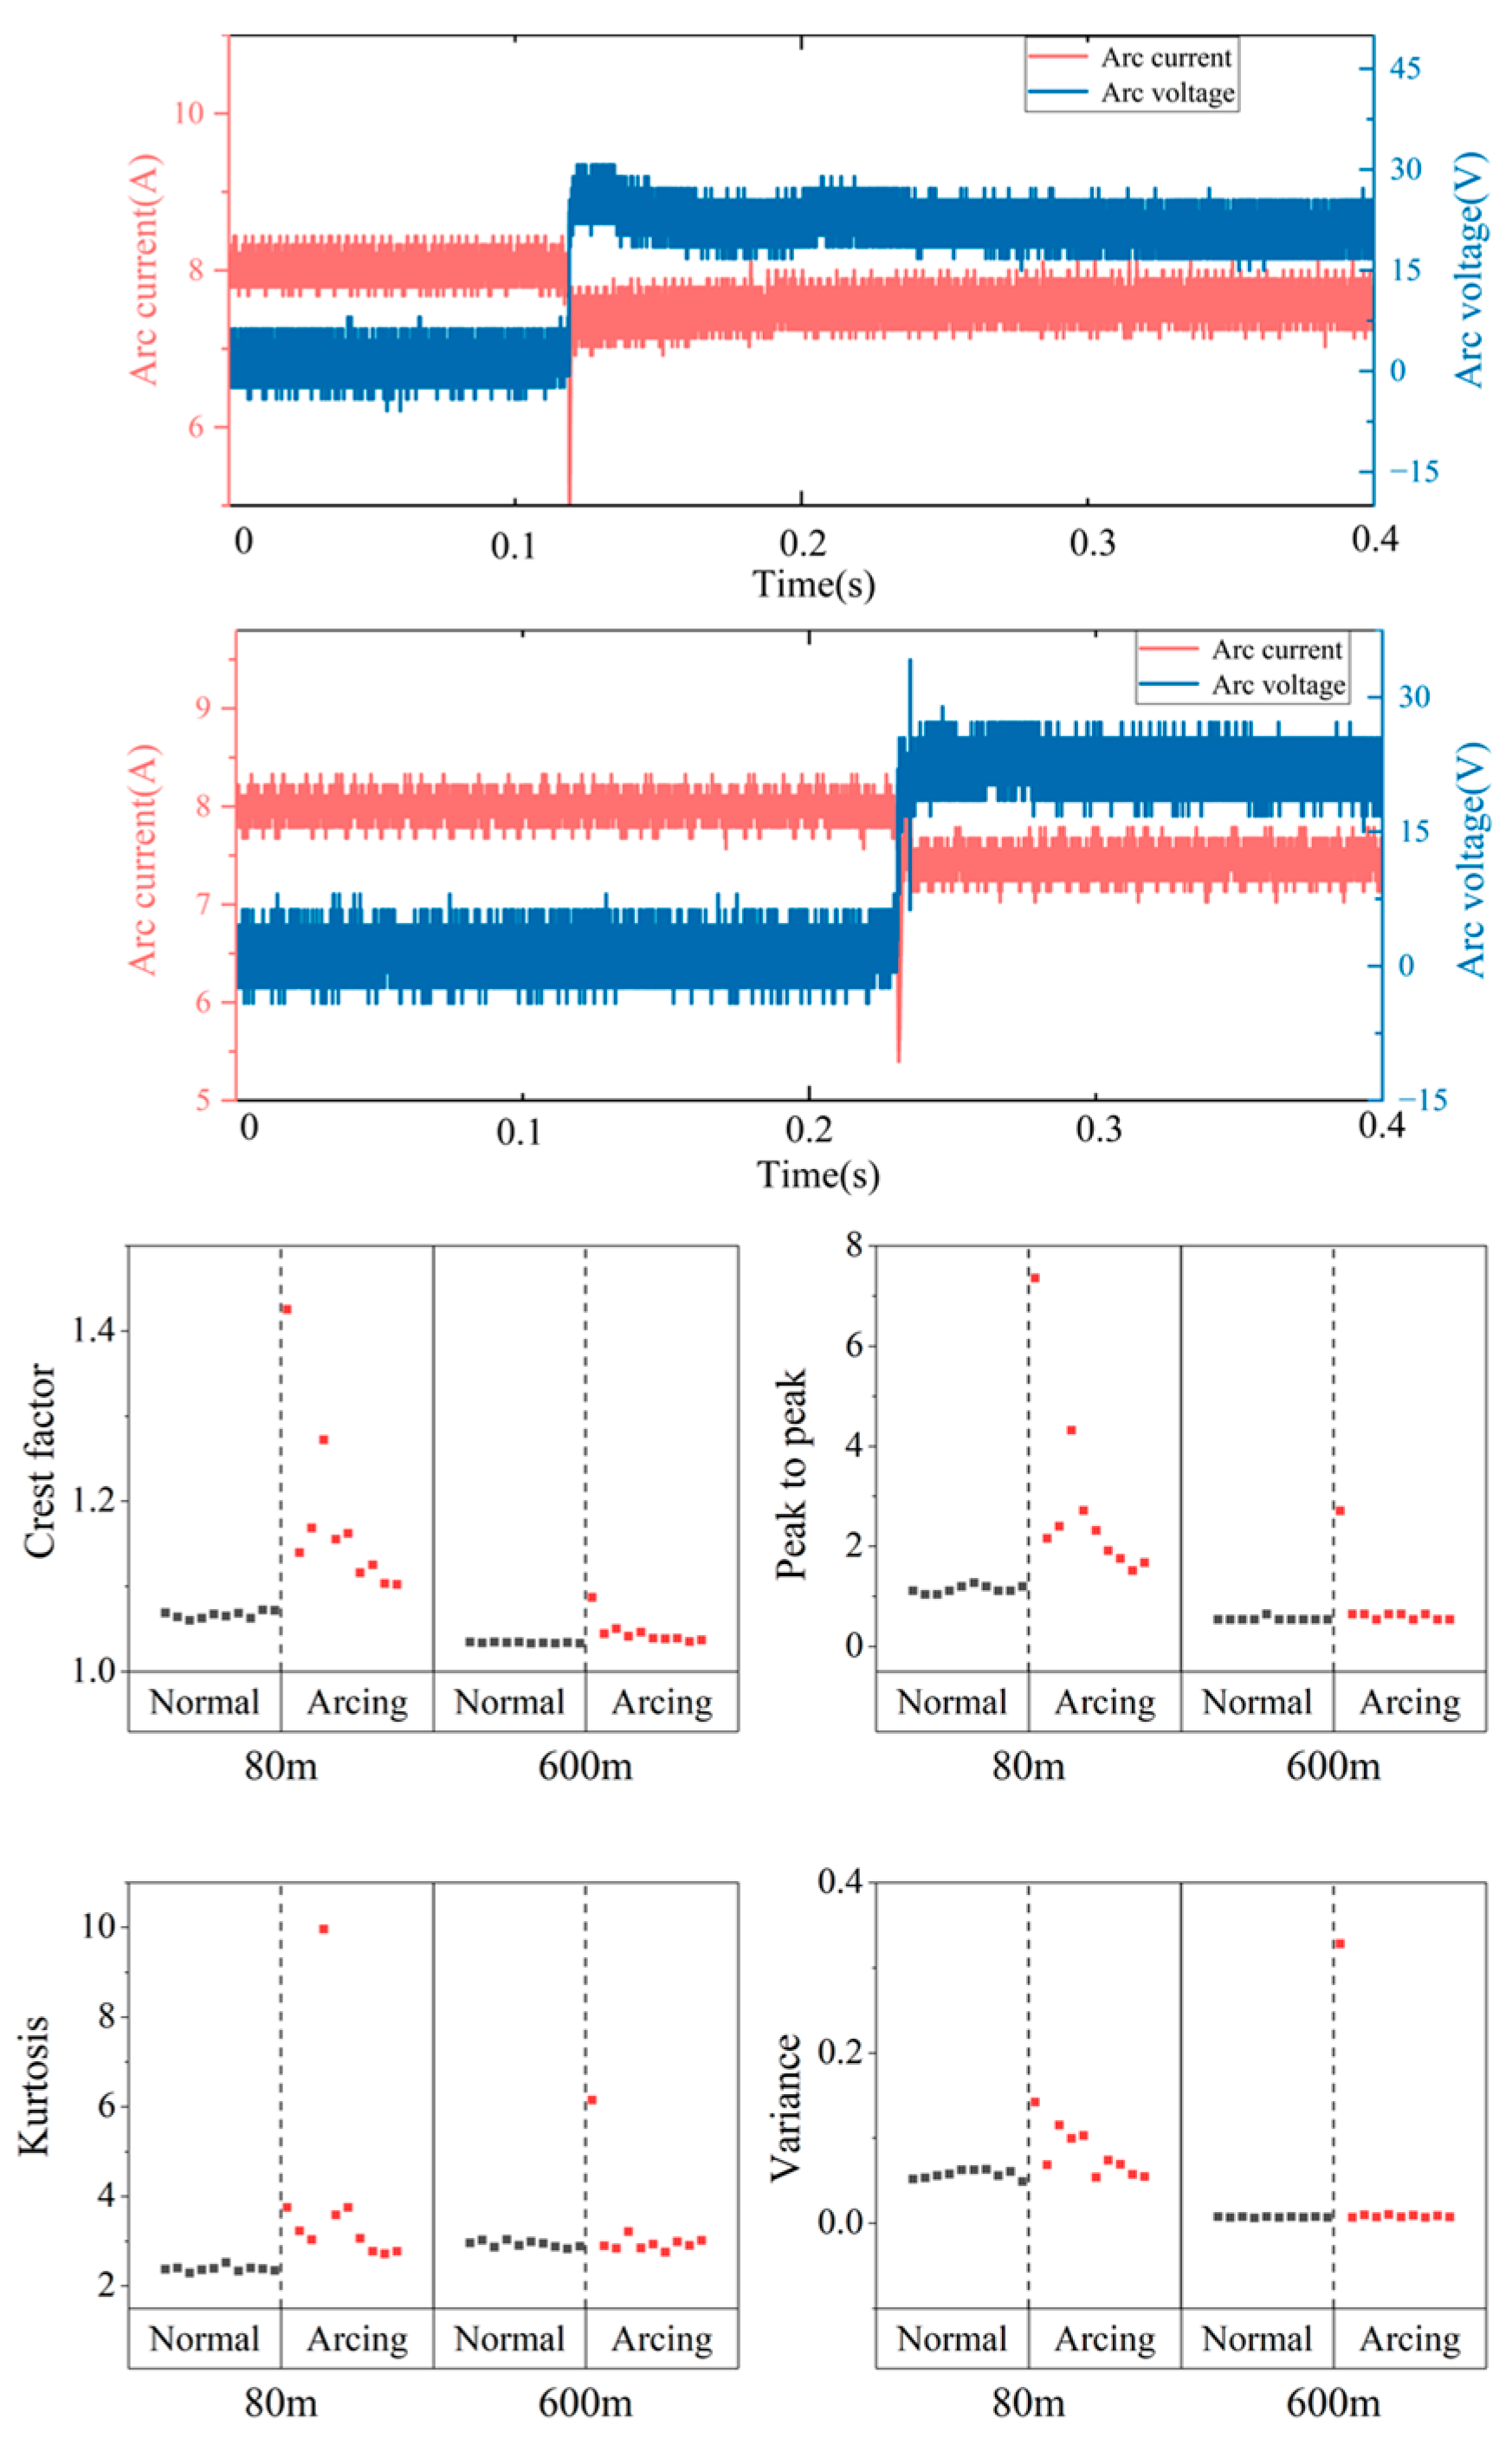
In the test process of arc fault detection, the length of the simulated line in the test circuit will have a significant impact on the characteristics of the current signal in terms of time and frequency. In the actual photovoltaic power generation system, as the circuit line becomes longer, the resistance and obstruction of the line will also increase. Among them, the change in line inductance value has the most prominent influence on the characteristics of the arc fault current signal. Since the identification of an arc fault mainly depends on its high-frequency characteristics, the inductance will greatly weaken these high-frequency characteristics. That is to say, the longer the line, the stronger the weakening effect of inductance on the high-frequency characteristics of arc fault, which undoubtedly increases the difficulty of arc fault identification. At present, the relevant standards usually stipulate the length of the simulated line as 80 m, but in some industry and enterprise standards, this length has been extended to 600 m, and there are obvious differences between different standards. When exploring the influence of arc occurrence position on the characteristics of current signal, the test condition is 8 A, and the module level series is used to group the series line, the flat electrode, the fault arc occurrence position is the series head position, and the C4 in the impedance network is 1.5 μF.
Figure 13 illustrates the time-domain characteristics of signals corresponding to different simulated line lengths. The transition in the waveform indicates the occurrence of arcing: the voltage and current before the transition represent the connection period, while those after the transition represent the arcing period. In the figure, the black and red points, corresponding to line lengths of 80 m and 600 m, respectively, denote the normal connection data and arcing data. Compared with the length of 80 m simulated line, the length of 600 m simulated line is more stable in both normal state and arc fault state, and the extreme value is rare. The length of 600 m simulated line seriously affects the time-domain characteristics of the arc fault. The eigenvalues of the normal state and arc fault state are basically the same, and the fault identification is more difficult.
As shown in
Figure 14, the signal frequency domain characteristics of different simulated line lengths are shown. Among them, the black line is the spectrum characteristic under the normal state of 80 m, the red line is the spectrum characteristic under the arc fault state of 80 m, the blue line is the spectrum characteristic under the normal state of 600 m, and the green line is the spectrum characteristic under the arc fault state of 600 m. It can be seen from
Figure 14 that the inductance in the test circuit increases with the length of the simulated line, which significantly weakens the high-frequency characteristics in the test circuit. Compared with the length of the 80 m simulated line, the spectrum characteristics of the normal state and the fault arc state of the 600 m simulated line length are less different, and the fault identification is more difficult.
5.3. Functional Verification Results of the Test Platform
Current research and practice in arc fault detection face a major limitation: experimental validation typically relies on a single standard to construct test platforms. This approach has two primary drawbacks. First, a single standard usually defines experimental conditions for specific scenarios and arc fault types (e.g., series arcs under designated loads or parallel arcs in controlled environments). As a result, detection methods validated on such platforms perform effectively only within those predefined scenarios, lacking generality and adapting poorly to the diverse and complex operating conditions found in actual power systems. Second, the limited scope of experimental conditions in a single standard prevents accurate simulation of complex interference, boundary effects, and fault coupling phenomena that may occur in real-world applications. This constrains the comprehensive verification of key performance metrics such as anti-interference capability, boundary detection accuracy, and fault identification stability. Consequently, the resulting validation is often incomplete and lacks objectivity, hindering the practical deployment of detection technologies in engineering applications.
The Multi-Standard Integration Experimental Platform, proposed in
Section 5 of this paper, addresses these challenges. By integrating multiple key international and domestic standards, the platform encompasses a broader range of fault simulations, more diverse operating conditions, and more rigorous verification criteria. This multi-standard integration ensures comprehensive and representative test environments, effectively overcoming the scenario limitations inherent to single-standard platforms. Furthermore, it enables systematic verification of core performance indicators—such as detection accuracy, adaptability, and reliability—from a perspective that closely reflects real-world operation. Ultimately, this approach provides a scientifically rigorous and practically convincing validation framework for assessing the engineering applicability and effectiveness of arc fault detection devices.
6. Conclusions
This paper presents a detailed comparison and in-depth analysis of four industry standards: IEC 63027, UL 1699B, GBT 39750, and CGC/GF 175. The main findings are summarized as follows:
- (1)
By examining the composition and operating principles of key components—such as decoupling and impedance networks—the study clarifies the applicable scope of each standard, as well as their protection device requirements, test line topology, test conditions, and parameter settings for other system components.
- (2)
Based on the practical requirements of photovoltaic DC series arc fault testing, the overall design of the test platform was developed with reference to the provisions of the four standards. At the hardware level, the platform’s architecture design, component selection, and circuit layout were sequentially implemented according to the overall plan. At the software level, a host-computer program was developed in LabVIEW (version 2025 Q3) to enable automatic platform control and precise data acquisition.
- (3)
A photovoltaic DC arc fault test platform was constructed, and comprehensive performance testing was conducted. The results demonstrate that the platform exhibits high reliability, with all performance indicators meeting the design requirements. Furthermore, the effects of arc occurrence location and simulated line length on the time-frequency domain characteristics of the current signal were analyzed, providing a foundational experimental basis for future studies on fault arc hazards.
Future research on arc fault recognition will emphasize technological innovation and a deeper understanding of underlying mechanisms, with ongoing optimization of existing arc recognition algorithms. We will develop an adaptive model based on deep learning algorithms to enhance recognition accuracy of arc faults in complex environments. Additionally, we aim to explore multi-source information fusion technology to establish a comprehensive arc fault identification system, overcoming the limitations of single-signal detection. Utilizing the developed photovoltaic DC arc fault test platform, we will investigate the relationship between arc physical characteristics and electrical parameters. This will reveal the formation and development patterns of arc faults, thereby providing robust theoretical and empirical support for the formulation of arc fault early warning and protection strategies, ultimately ensuring the safe and stable operation of photovoltaic systems.
Although this paper constructs a multi-standard compatible test platform, the authenticity of the arc fault data obtained by the test platform and the universality of its training model need further verification. Therefore, relevant experimental verification is still needed in photovoltaic systems in the future.


