Article

Numerical Simulation of Shallow Coalbed Methane Based on Geology–Engineering Integration

1
Research Institute of Engineering Technology, PetroChina Coalbed Methane Company Limited, Xi’an 710082, China
2
School of Petroleum and Natural Gas Engineering, Southwest Petroleum University, Chengdu 610500, China
3
School of Science, Southwest Petroleum University, Chengdu 610500, China
*
Author to whom correspondence should be addressed.
Processes 2025, 13(11), 3381; https://doi.org/10.3390/pr13113381
Submission received: 12 September 2025 / Revised: 3 October 2025 / Accepted: 20 October 2025 / Published: 22 October 2025
(This article belongs to the Special Issue Advances in Enhancing Unconventional Oil/Gas Recovery, 2nd Edition)

Abstract

Coalbed-methane (CBM) extraction involves complex processes such as desorption, diffusion, and seepage, significantly increasing the difficulty of numerical simulation. To enable efficient CBM development, this study establishes an integrated simulation workflow for CBM, encompassing geological modeling, geomechanical modeling, hydraulic fracture simulation, and production dynamic simulation. Specifically, the unconventional fracture model (UFM), integrated within the Petrel commercial software, is applied for fracture simulation, with an unstructured grid constructing the CBM production model. Subsequently, based on the case study of well pad A in the Daning–Jixian block, the effects of well spacing and hydraulic fractures on gas production were analyzed. The results indicate that the significant stress difference between the coal seam and the top/bottom strata constrains fracture height, with simulated hydraulic fractures ranging from 169.79 to 215.84 m in length, 8.91 to 10.45 m in height, and 121.92 to 248.71 mD·m in conductivity. Due to the low matrix permeability, pressure drop and desorption primarily occur in the stimulated reservoir volume (SRV) region. The calibrated model predicts a 10-year cumulative gas production of 616 × 104 m3 for the well group, with a recovery rate of 10.17%, indicating significant potential for enhancing recovery rates. Maximum cumulative gas production occurs when well spacing slightly exceeds fracture length. Beyond 200 mD·m, fracture conductivity has diminishing returns on production. Fracture length increases from 100 to 250 m show near-linear growth in production, but further increases yield smaller gains. These findings provide valuable insights for evaluating development performance and exploiting remaining gas resources for CBM.

1. Introduction

China is a significant country regarding coalbed methane (CBM) resources [1,2]. Statistics indicate that China possesses CBM reserves of 36.81 trillion m3 at depths shallower than 2000 m, ranking third globally [3]. CBM is also a clean and low-carbon fossil energy source with promising prospects for development [4]. CBM is primarily adsorbed onto the surfaces of micro-pores within the coal matrix [5]. Therefore, the flow mechanism in its production is more complex [6,7]. During production, when reservoir pressure drops to the critical desorption pressure, the gas desorbs from the coal matrix [8,9], diffuses through the matrix into coal fractures, and then flows from these fractures into production wells [10,11,12]. Unlike other unconventional oil and gas reservoirs, coal reservoirs exhibit significant heterogeneity, primarily manifested as non-uniform variations in reservoir properties including porosity, permeability, gas content, adsorption time, adsorption capacity, and mechanical properties [13]. Therefore, while numerical simulation models for other unconventional reservoirs only describe fluid flow within the reservoir [14,15], CBM models must account for gas desorption from the coal matrix, diffusion into coal fractures, flow between fractures, and ultimately into production wells, making the simulation significantly more challenging [16]. Currently, dual-medium models (dual-porosity or dual-permeability) are widely used for CBM simulations, especially in reservoirs with well-developed pores and fractures. While the embedded discrete fracture model (EDFM) can flexibly model hydraulic and natural fractures, it faces higher challenges in fracture-mesh generation and computational costs in CBM reservoirs with complex fracture developments [17].
Geology–engineering integration is optimal for profitable unconventional oil and gas development [18]. Cao et al. established a geology–engineering integrated model for the Gulong shale gas reservoir in the Songliao Basin to characterize vertical and lateral heterogeneity accurately, providing differentiated decision-making for fracture reconstruction [19]. Qin et al. developed a 3D hydraulic-fracturing model based on a geology–engineering integration approach to investigate the effects of cluster spacing, fracturing sequence, fracture location, well spacing, horizontal stress difference, and natural fractures on hydraulic-fracture propagation and cumulative gas production during multilateral fracturing [20]. Wang et al. developed a geology–engineering integration workflow for tight sandstone gas reservoirs, performing numerical simulations of acidizing and fracturing operations in the Daniel gas field of the Ordos Basin to analyze pressure-wave propagation and production dynamics post-fracturing [21]. Liu et al. developed a geomechanical model incorporating weak structural surfaces and a spatial distribution model for natural fractures using an integrated geology–engineering approach. They simulated hydraulic-fracture morphology under various fracturing parameter combinations and optimized fracturing parameters [22]. Yang et al. established a 3D multiscale three-phase flow–fracture network model incorporating radial horizontal wells, hydraulic fractures, and surface/bottom fractures using a geology–engineering integration approach. They applied the EDFM to handle complex fracture networks, investigated the impact of natural fracture non-uniform distribution, and achieved high-efficiency coalbed-methane development [23].
However, the geology–engineering-integrated simulation for shallow CBM remains scarce. In particular, for low-permeability or ultra-low-permeability CBM that requires hydraulic fracturing, there is a lack of production numerical simulations coupled with fracture propagation [24,25,26]. Therefore, based on the reservoir properties and development characteristics of the shallow CBM in the Daning–Jixian Block, this study established a comprehensive CBM simulation workflow integrating geological modeling, geomechanical modeling, fracture simulation, and production dynamic simulation. First, a fine geological model and an in situ stress model of well group A in the Daning–Jixian Block were constructed. Subsequently, the UFM was employed to simulate multi-well hydraulic fracturing. Finally, using unstructured grid partitioning technology, a numerical simulation model that accounts for stress sensitivity and non-Darcy flow was developed to enable accurate prediction of gas-well productivity. In addition, this workflow is also applicable to other CBM reservoirs developed through hydraulic fracturing.

2. Geology–Engineering-Integrated Simulation for CBM

2.1. Overview of the Study Area

The Daning–Jixian area is located within Shanxi Province, China, structurally situated in the southern segment of the Jinxi Fold Belt in the eastern part of the Ordos Basin. It extends from Xixian in the north to Xiangning in the south, adjoining the Lüliang Mountains to the east and bordering the Yellow River to the west. The primary coal seams in this area are the 8# coal seam of the Upper Carboniferous Taiyuan Formation and the 5# coal seam of the Lower Permian Shanxi Formation. These coal seams are buried at depths ranging from 300 to 1500 m, covering a coal-bearing area of approximately 3259 km2. The predicted coalbed methane resources amount to 6501 × 108 m3 [27,28]. The coal in this area exhibit moderate metamorphism, making it one of China’s favorable regions for coalbed-methane accumulation in the medium-coal rank [29]. The primary development area, the Ji4–Ji10 well area, has proven coalbed methane reserves of 222.31 × 10⁸ m3 and a gas-bearing area of 101.6 km2. Longitudinally, the detailed parameters of the main coal seams 5# and 8# are shown in Table 1.
Currently, the area comprises 172 wells, primarily exploiting the 5# and 8# coal seams in combination. When mining the 5# seam alone, daily water production is generally low (average 1.32 m3), with maximum daily gas production ranging from 300 to 1800 m3. When mining the 8# seam alone, daily water production ranges from 2 to 24 m3, and daily gas production from 50 to 500 m3, with poor gas-production efficiency. When mining the 5# and 8# coal seams jointly, daily water production varies significantly (1.18~142 m3), with maximum daily gas production ranging from 0 to 2300 m3. Stable daily gas production is approximately 400~600 m3. Among them, the production curve of a typical well jointly mining the 5# and 8# coal seams is shown in Figure 1. Overall, the 5# coal seam is the primary gas-producing layer, while the 8# coal seam carries a higher risk of water production.
An analysis of the current development status shows that multiple measures have been taken, including well-network optimization, layer-specific fracturing, repeat fracturing, sealing of the 8# coal seam, and various debottlenecking trials. Among these, well-network optimization and layer-specific fracturing are the most effective, boosting average daily gas production per well by 600~700 m3. However, this still fails to meet the design requirements of the development plan, making profitable exploitation challenging. Therefore, it is imperative to establish numerical simulation methods that couple fracture networks with complex CBM flow mechanisms based on the geological and engineering conditions of the well area. This will provide an accurate foundation for evaluating CBM production capacity, laying the groundwork for subsequent adjustments to development technology policies and approaches.

2.2. Geology–Engineering-Integrated Simulation

The geology–engineering-integrated workflow primarily encompasses geological modeling, in situ stress modeling, fracturing simulation, and reservoir-production dynamics numerical simulation [30,31]. Among these, fracturing simulation is the cornerstone of the process. Hydraulic-fracture propagation is a complex physical process controlled by multiple mechanisms, including rock failure, fluid–solid coupling, and proppant migration [32,33]. Considering the complexity of hydraulic fractures in unconventional reservoirs, researchers have proposed the unconventional fracture model (UFM) based on the boundary element method [34]. The UFM has similar assumptions and governing equations to conventional pseudo-3D fracture models [35]. When a single-plane hydraulic fracture is opened under finite net fluid pressure, it induces a stress field in the surrounding rock that is proportional to the net pressure. To accurately simulate the propagation of multiple fractures, the UFM incorporates the interaction between adjacent hydraulic fractures, a phenomenon known as the “stress shadow” effect. Using a new crossover model that considers fluid properties, UFMs can simulate the interaction behavior between hydraulic fractures and natural fractures [36]. Overall, the UFM employs the OpenT intersection criterion, a 3D fracture height equation, and a proppant settlement equation to accurately predict fracture geometry and proppant distribution [37].
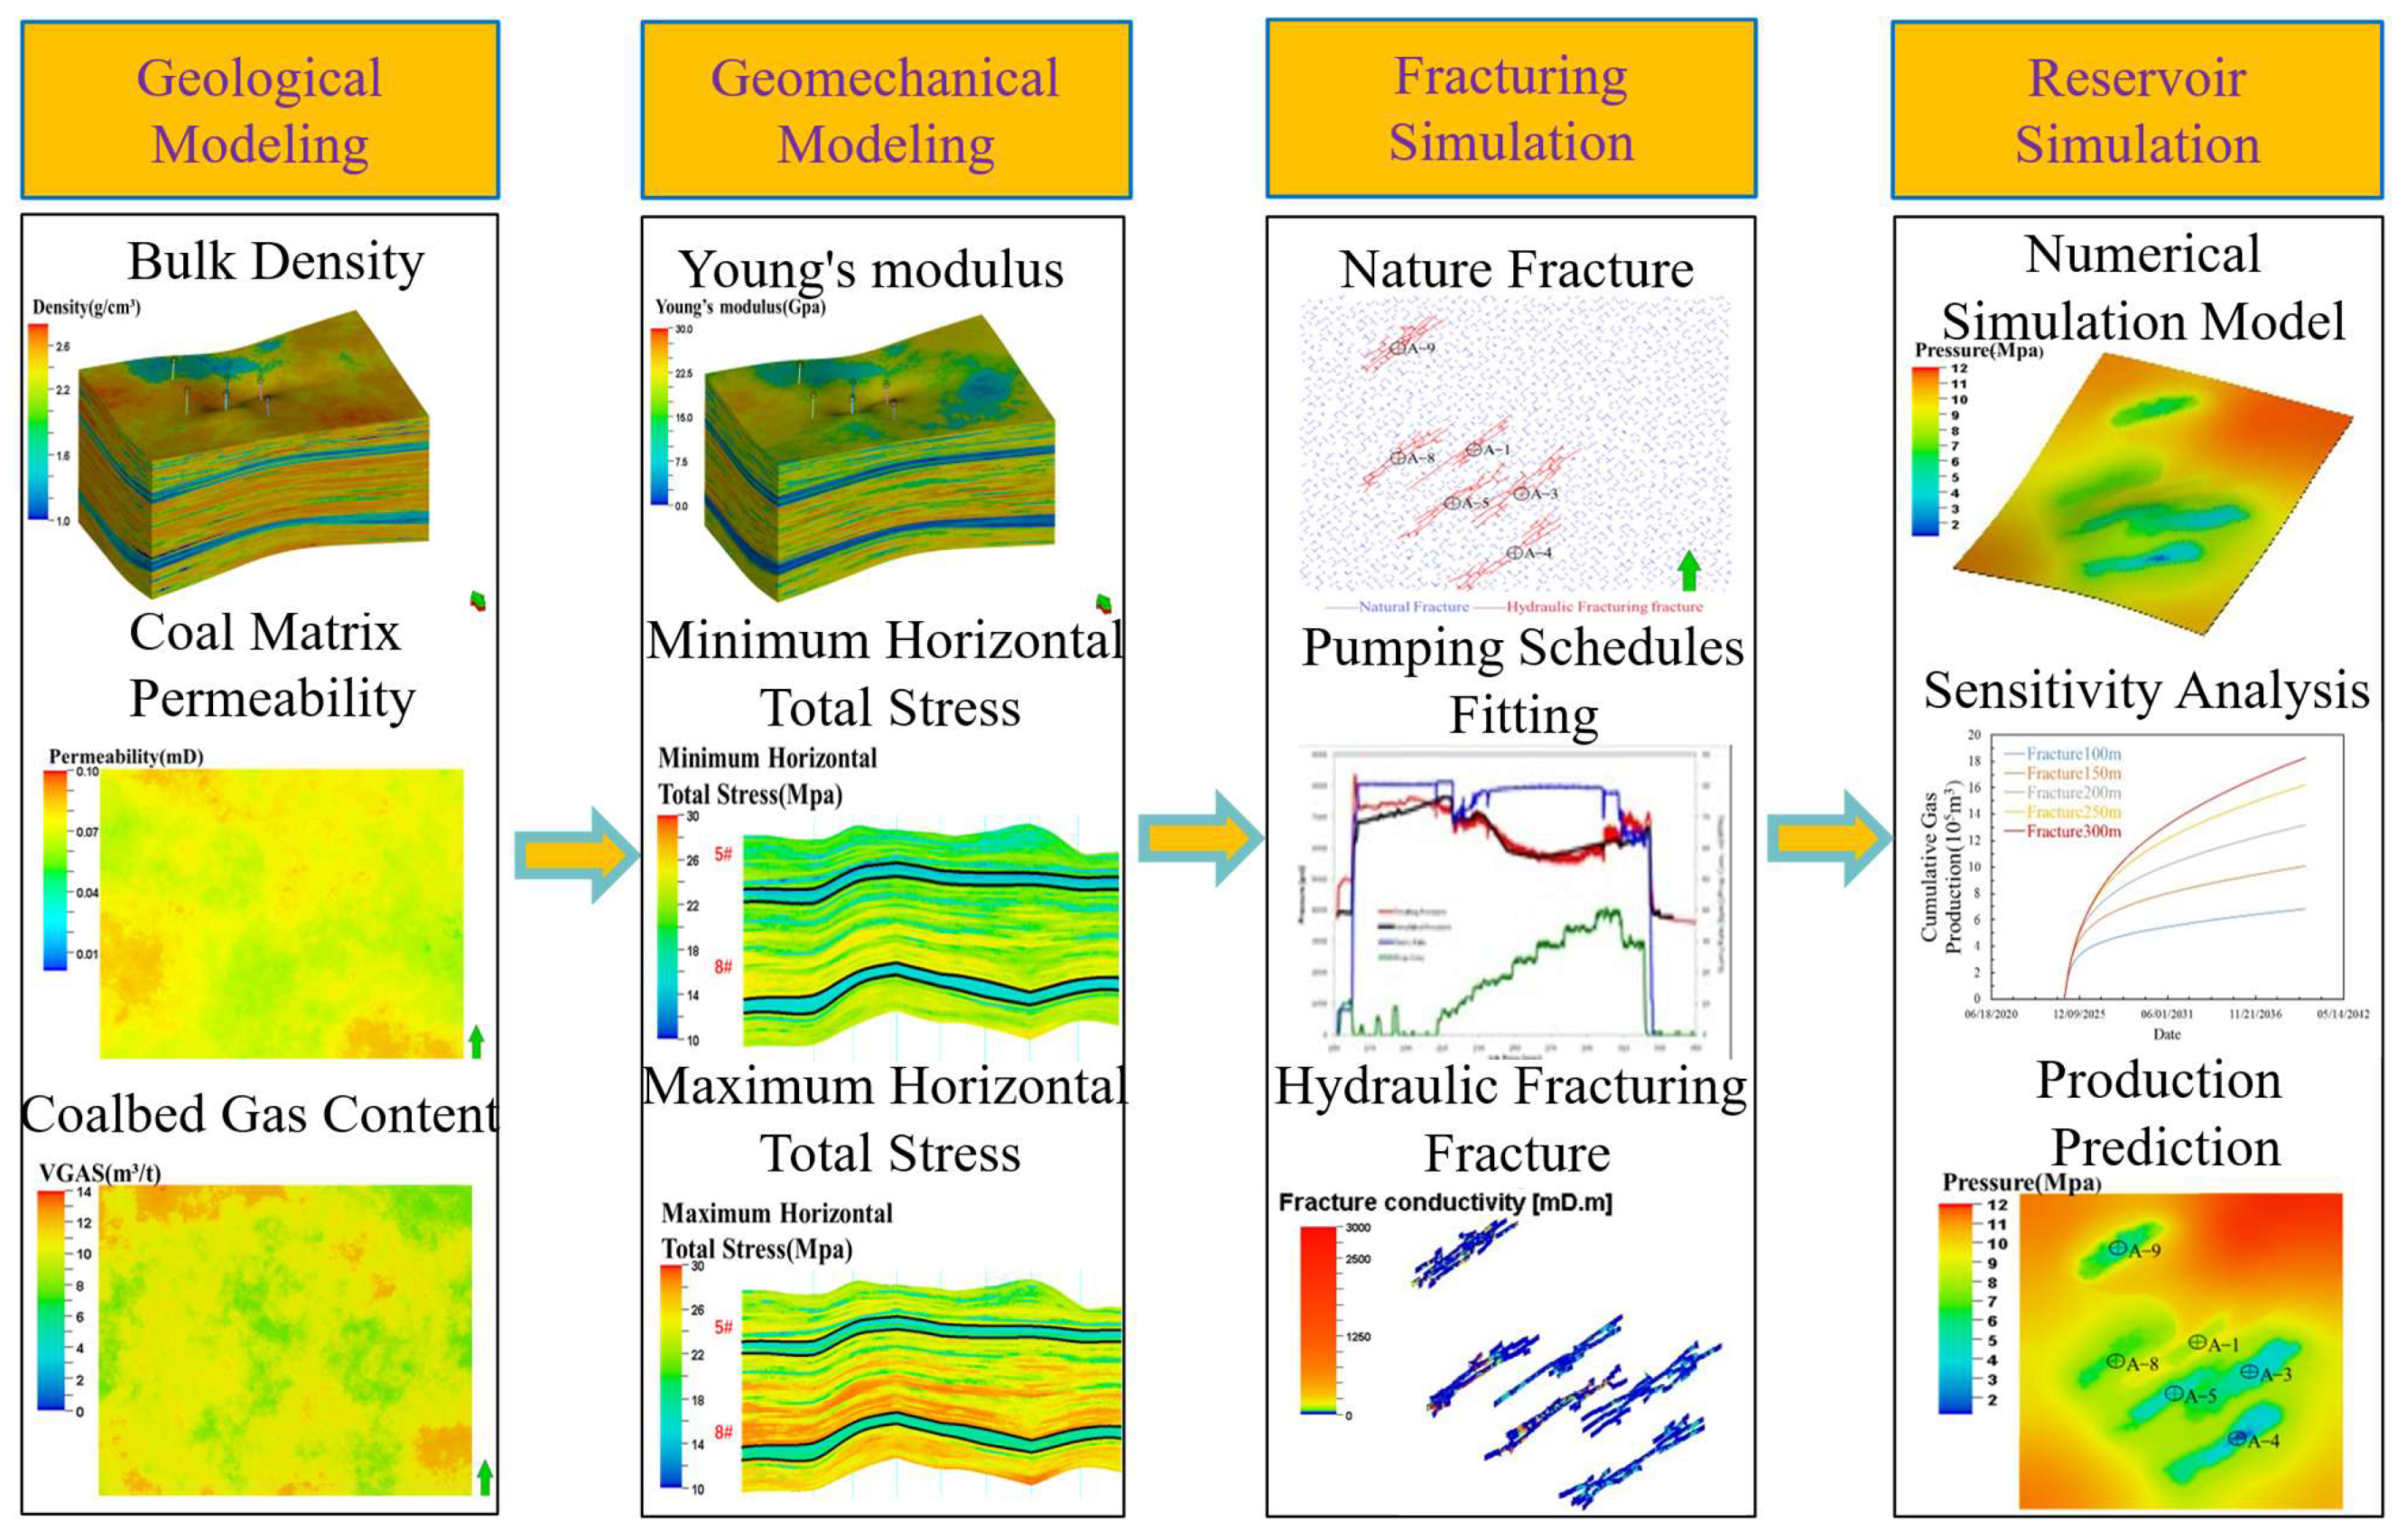
Building upon the concept above, this study proposes a technical roadmap for integrated numerical simulations of CBM (Figure 2). The process begins with 3D geological modeling, 3D in situ stress modeling, fracturing simulation, and, finally, coupled production simulation of the fractured network. Based on this foundation, simulation studies for development-parameter optimization can also be conducted. Currently, mature integrated platforms include Petrel, JewelSuite, Landmark, FrSmart, and Hifrac [38,39]. This paper employs Schlumberger’s Petrel software 2024 version, internally embedded with the UFM fracturing simulation module, to perform integrated simulation for CBM. All simulations are completed on a computer equipped with an Intel Xeon Platinum 8370C CPU (64 cores), 128 GB RAM, and an NVIDIA GeForce RTX 4080 GPU.

3. The Geological and Geomechanical Models of CBM

3.1. Construction of Geological Model

This paper details the integrated geological–engineering modeling process using well group A in the Ji4–Ji10 well area of the Daning–Jixian block as an example. Well group A comprises nine vertical wells, with A-2, A-3, and A-4 located in the #8 coal seam and the remaining wells in the #5 coal seam.
Based on stratigraphic data from nine wells in well group A, a 3D structural model was established encompassing the coal seam roof, floor, 5# coal seam, 8# coal seam, and intermediate layer. The roof thickness ranges from 1.4 to 6.1 m, 5# coal seam thickness from 5.7 to 8.1 m, 8# coal seam thickness from 7.3 to 10.1 m, and floor thickness from 2.1 to 5.7 m. Subsequently, a refined property model for well group A was developed using well-logging data and sequential Gaussian simulation. The coal seam bulk density ranged from 1.31 to 1.56 t/m3, porosity from 2.73 to 3.42%, matrix permeability from 0.0235 to 0.0499 mD, and gas content from 10.28 to 12.05 m3/t (Figure 3).

3.2. Construction of Geomechanical Model

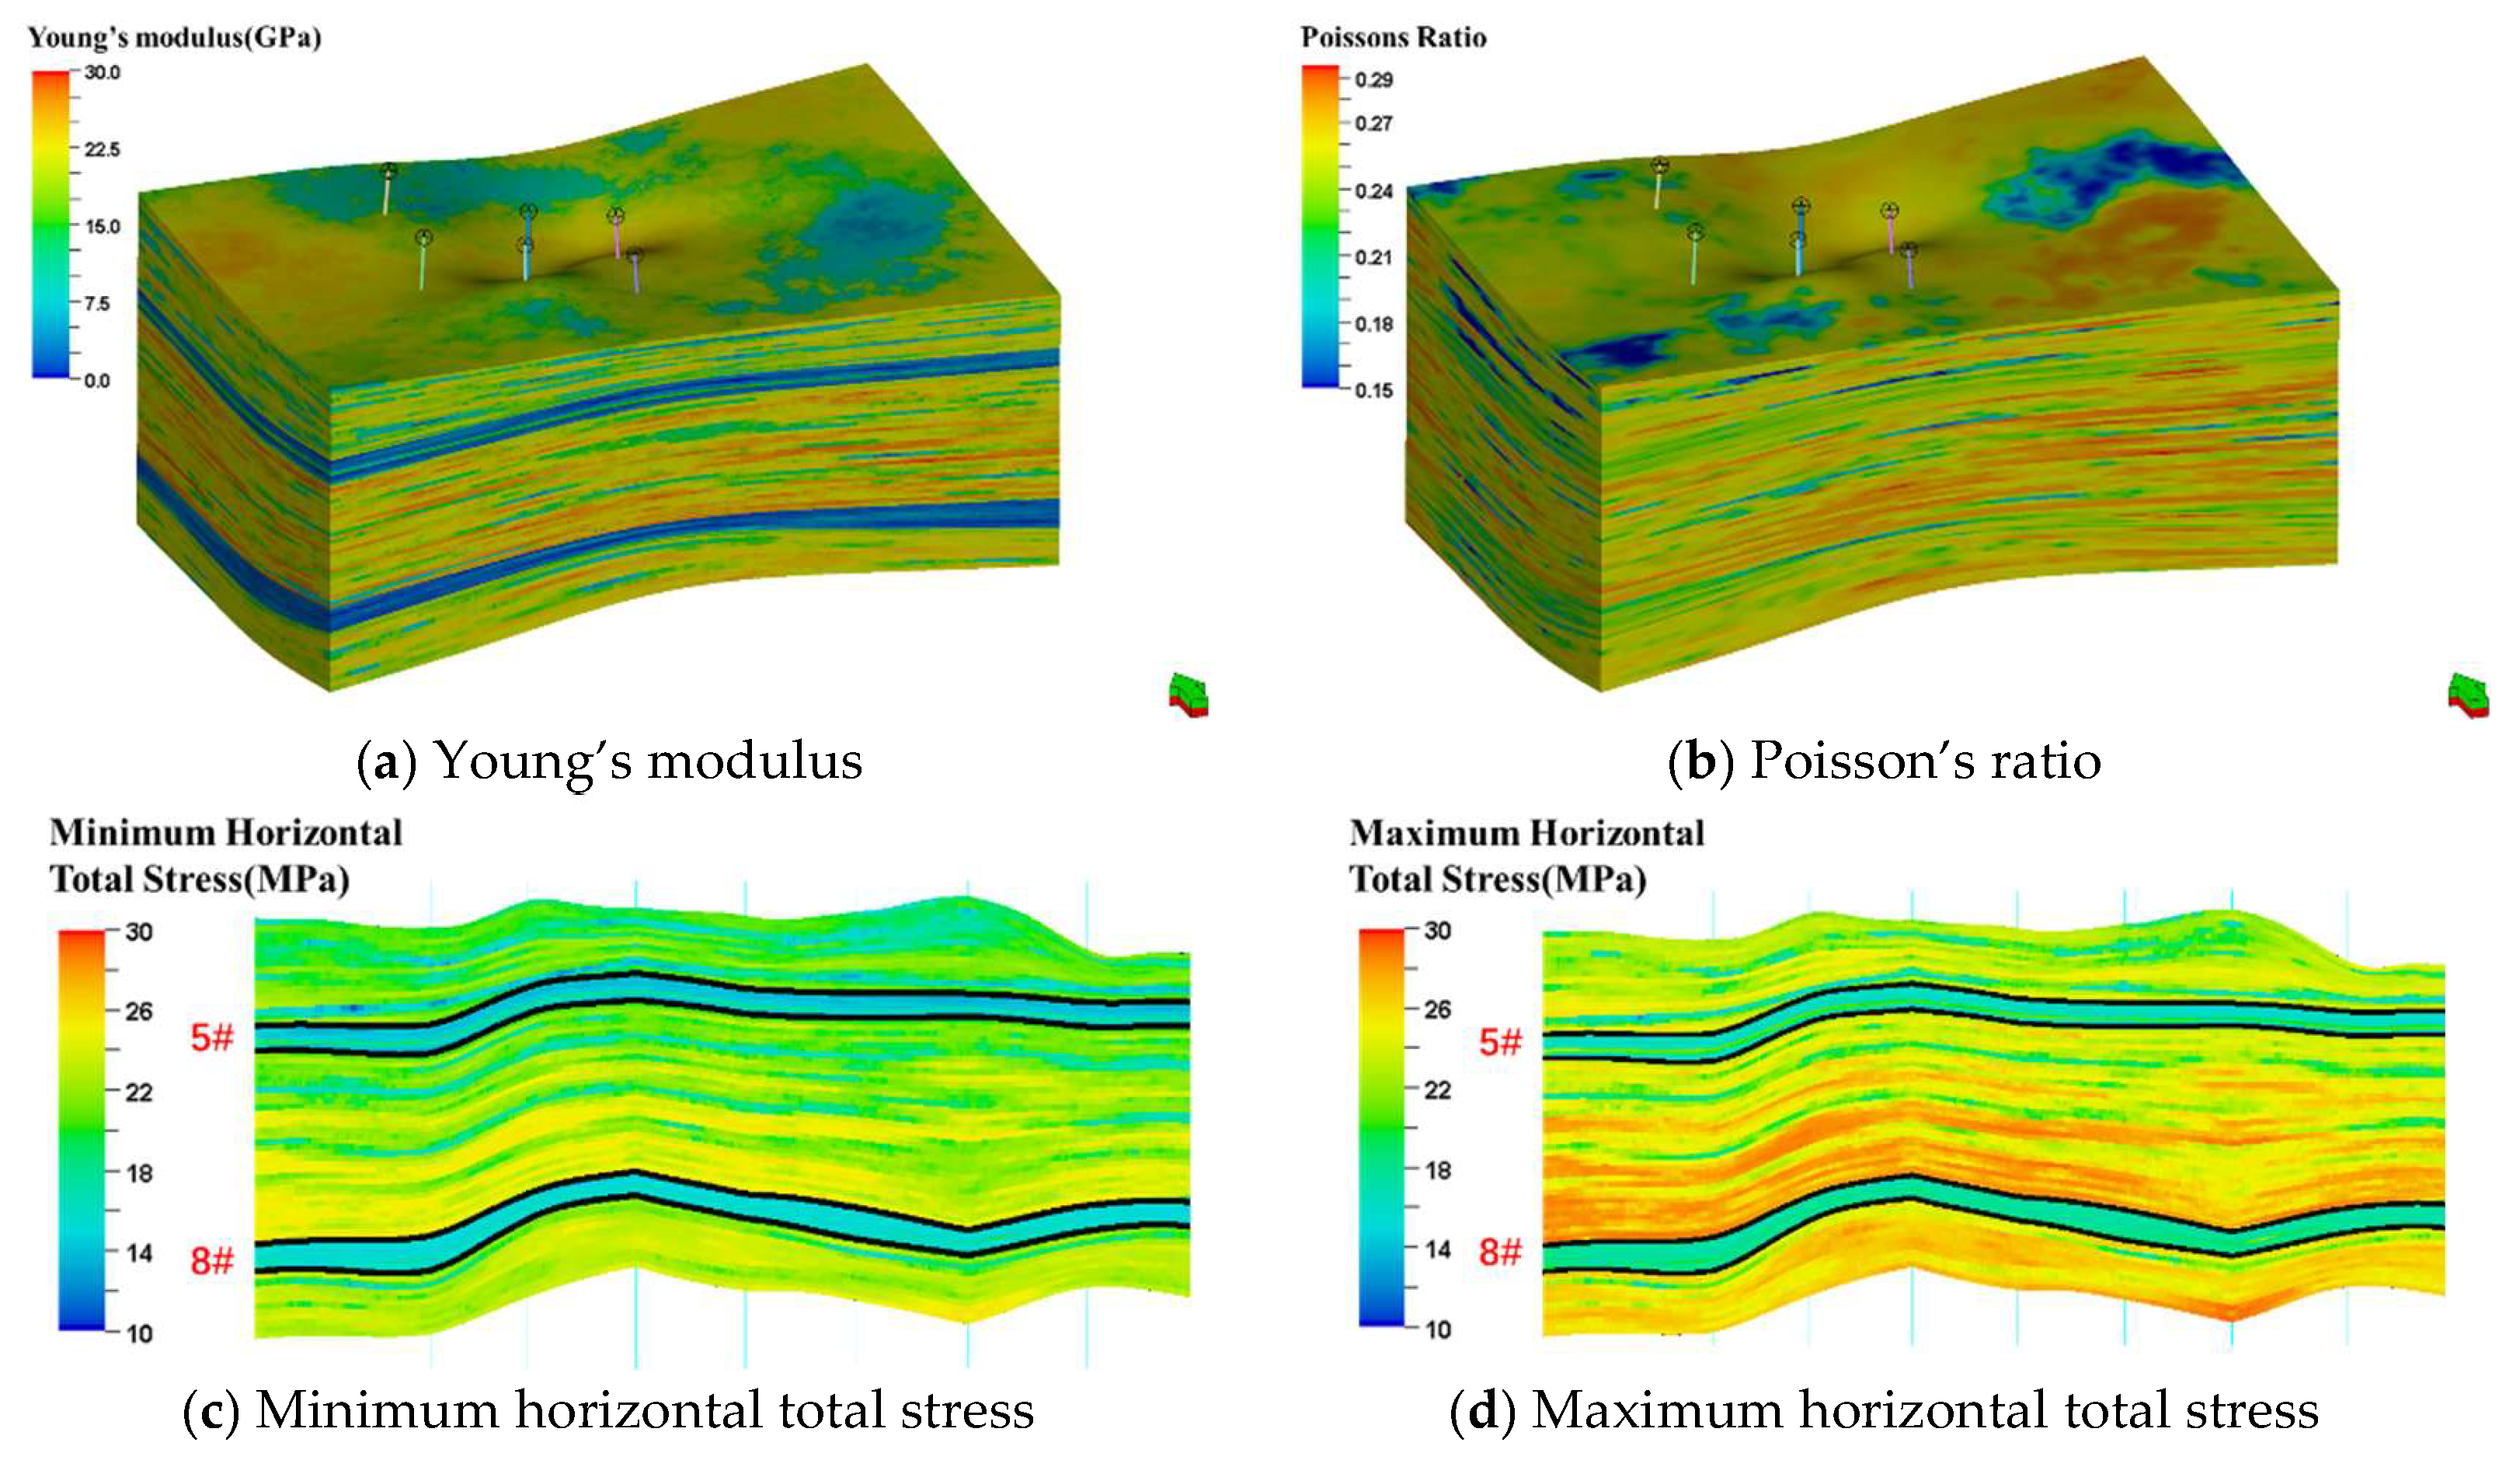
Based on well-logging data and the aforementioned geological model, a 3D geomechanical model was established using the Visage simulator, which is a finite element-based geomechanics simulator embedded in Petrel. Following geomechanical-grid discretization, rock-mechanical parameter modeling, pore-pressure calculation, and strain-boundary condition setup, a single Visage calculation takes approximately 40 min. To achieve a fit for 3D and 1D stress states, approximately five iterations of parameter adjustment and Visage calculations are typically required. The modeling results (Figure 4) indicate that coal seam 5# in well group A exhibits an average Young’s modulus of 5.36 GPa, an average Poisson’s ratio of 0.237, an average pore pressure of 11.48 MPa, an average overburden stress of 27.42 MPa, an average minimum horizontal principal stress of 17.91 MPa, and an average maximum horizontal stress of 18.89 MPa. Comparative analysis reveals that the coal seam’s Young’s modulus, Poisson’s ratio, and horizontal principal stress values are all lower than the corresponding roof and floor strata values (Table 2). The difference between the coal seam’s minimum horizontal principal stress value and that of the roof and floor strata ranges from 3.41 to 5.90 MPa (All green arrows in the following figures indicate the north direction).

4. Fracturing-Production Coupling Simulation for CBM

4.1. Well-Group Fracturing Simulation

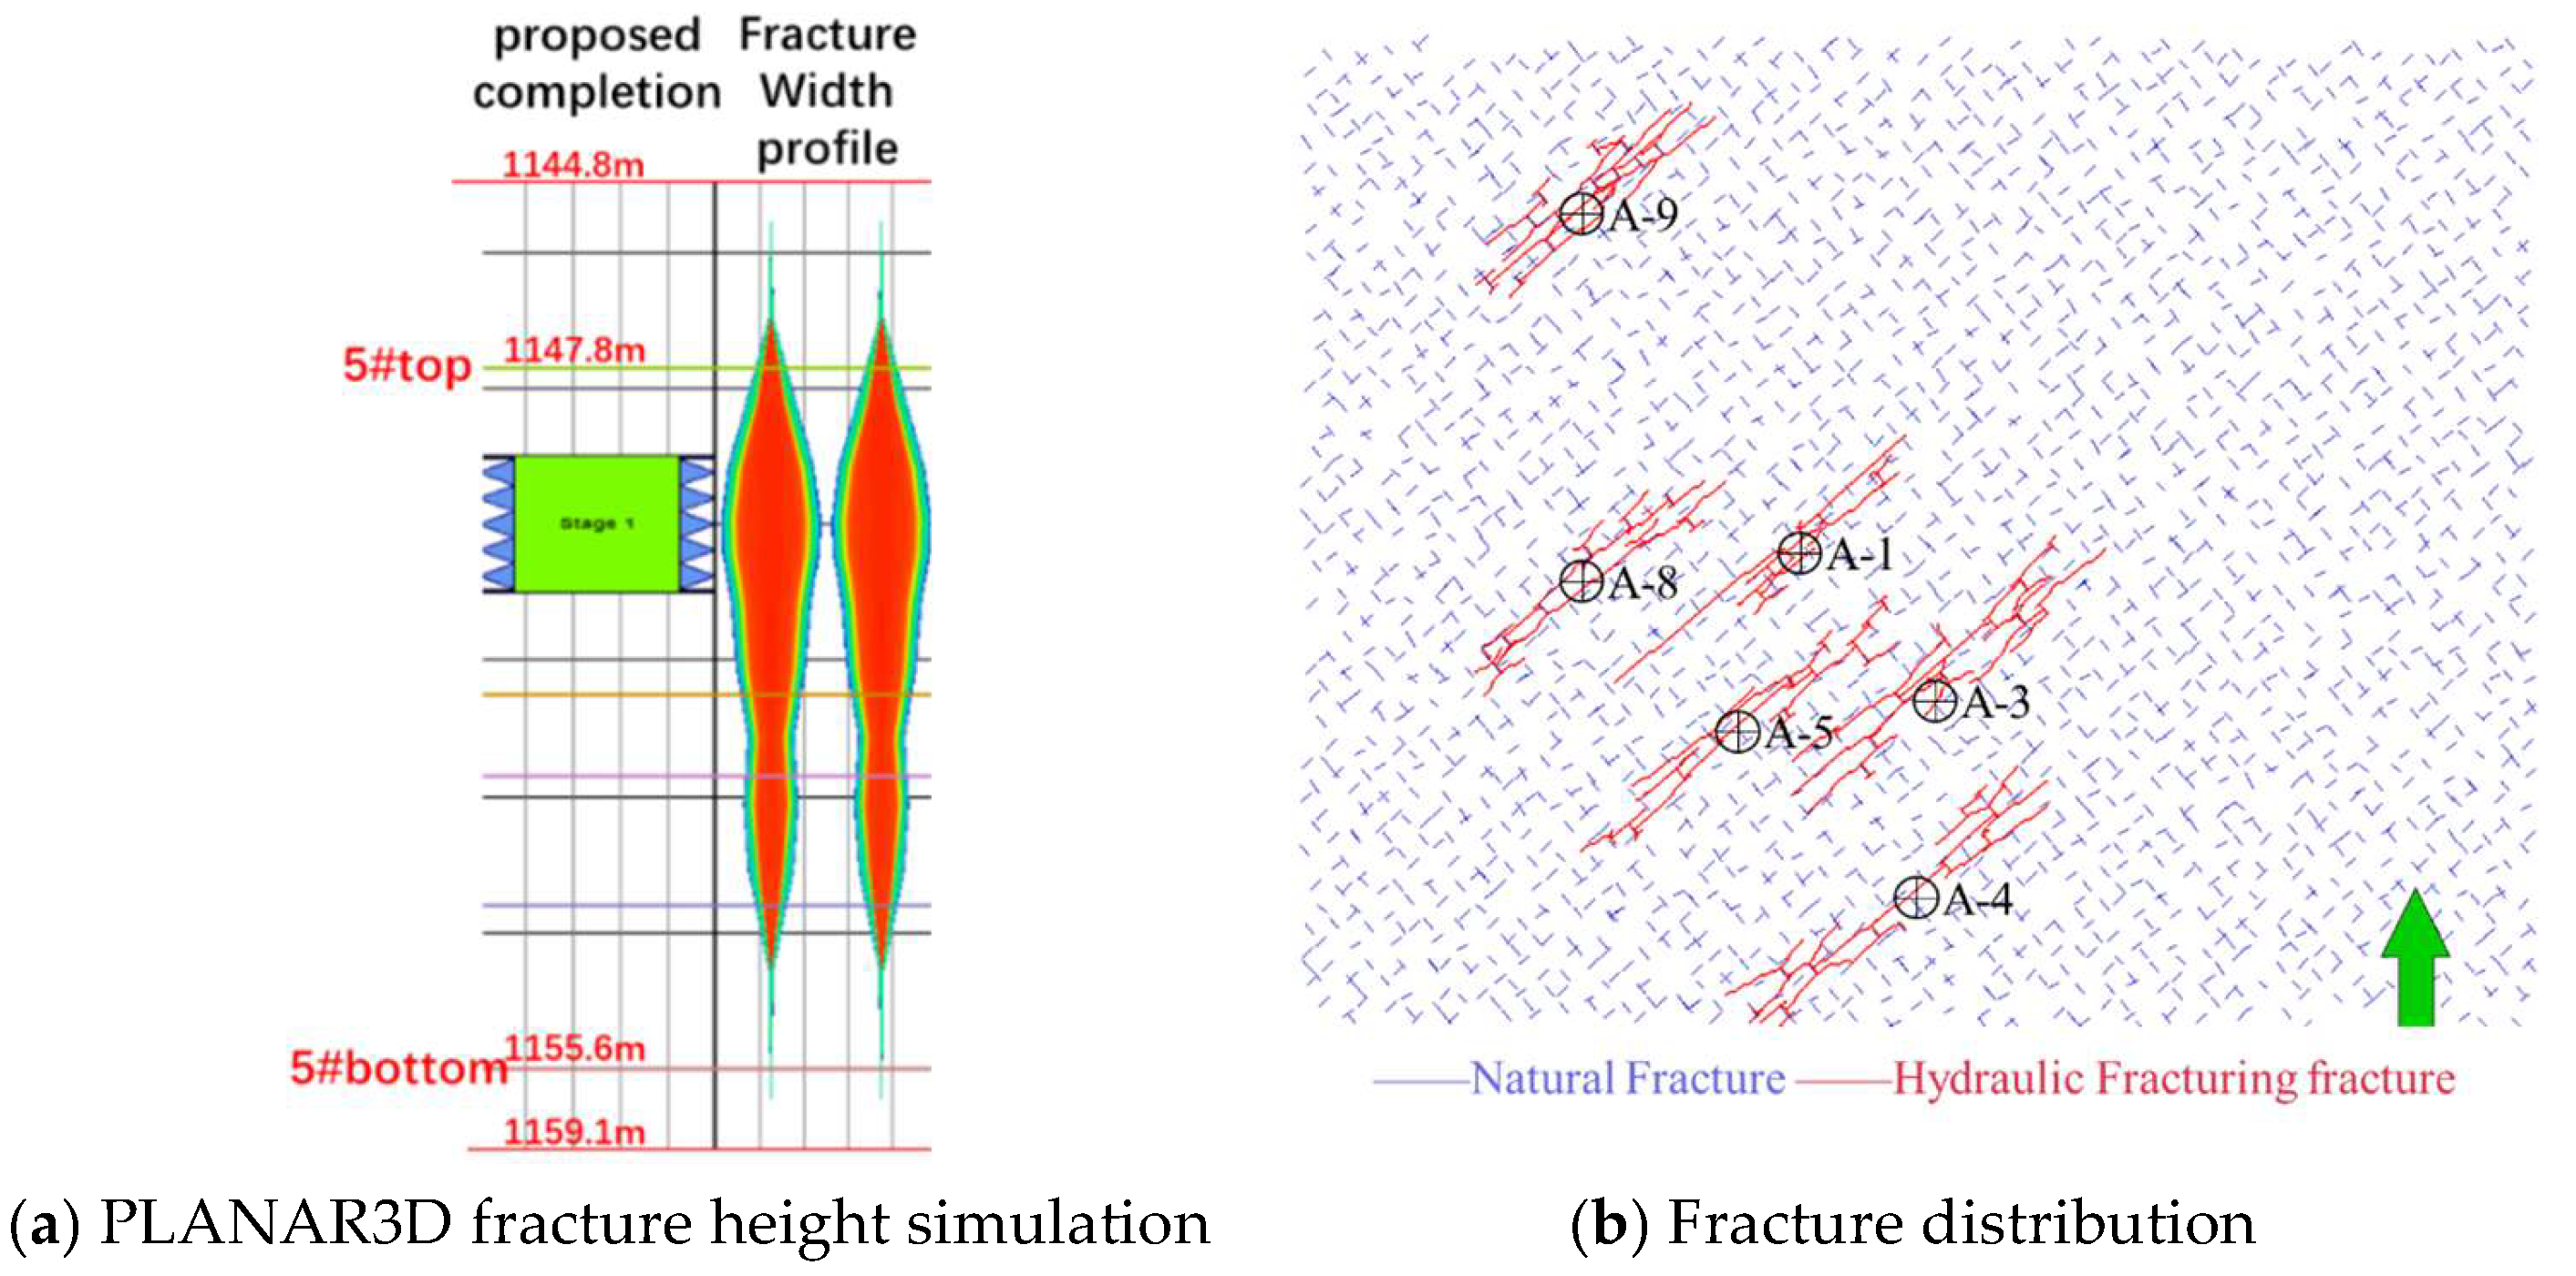
According to the fracture-monitoring data from the study area, large-scale natural fractures are poorly developed. However, field observations reveal the presence of joint structures within the coal seam. Therefore, two sets of orthogonal natural fractures were introduced to simulate the joint structure of the coal seam. Based on the preceding stress analysis, the stress difference between the coal seam and the overlying and underlying strata is significant, suggesting that fractures should be confined within the coal seam. To validate this concept, the precise fracture-height-mechanism model (PLANAR3D) was employed to simulate fracture height. Results indicate that the fracture height is slightly greater than the coal seam thickness (Figure 5a), confirming that the fractures are generally well constrained by the overlying and underlying strata. Subsequently, based on the actual fracturing-pump-injection data and perforation information, the fracturing simulations for six wells in 5# coal seam were completed using the UFM. Among them, the fracturing simulation for a single well took approximately 2 min. As shown in Figure 5b, the average hydraulic fracture lengths for the six wells ranged from 169.79 to 215.84 m, the average supported fracture lengths ranged from 142.11 to 200 m, with hydraulic fracture heights ranging from 8.91 to 10.45 m and supported fracture heights averaging between 2.81 and 5.80 m. The average fracture conductivity was between 121.92 and 248.71 mD·m. The hydraulic-fracture propagation patterns under current geological and engineering conditions for well group A were clarified through fracture simulation. Parameters such as the fracture geometry and fracture conductivity were obtained, providing an accurate fracture-network model and property parameters for subsequent production dynamic simulation.

4.2. Well-Group Production History Fitting

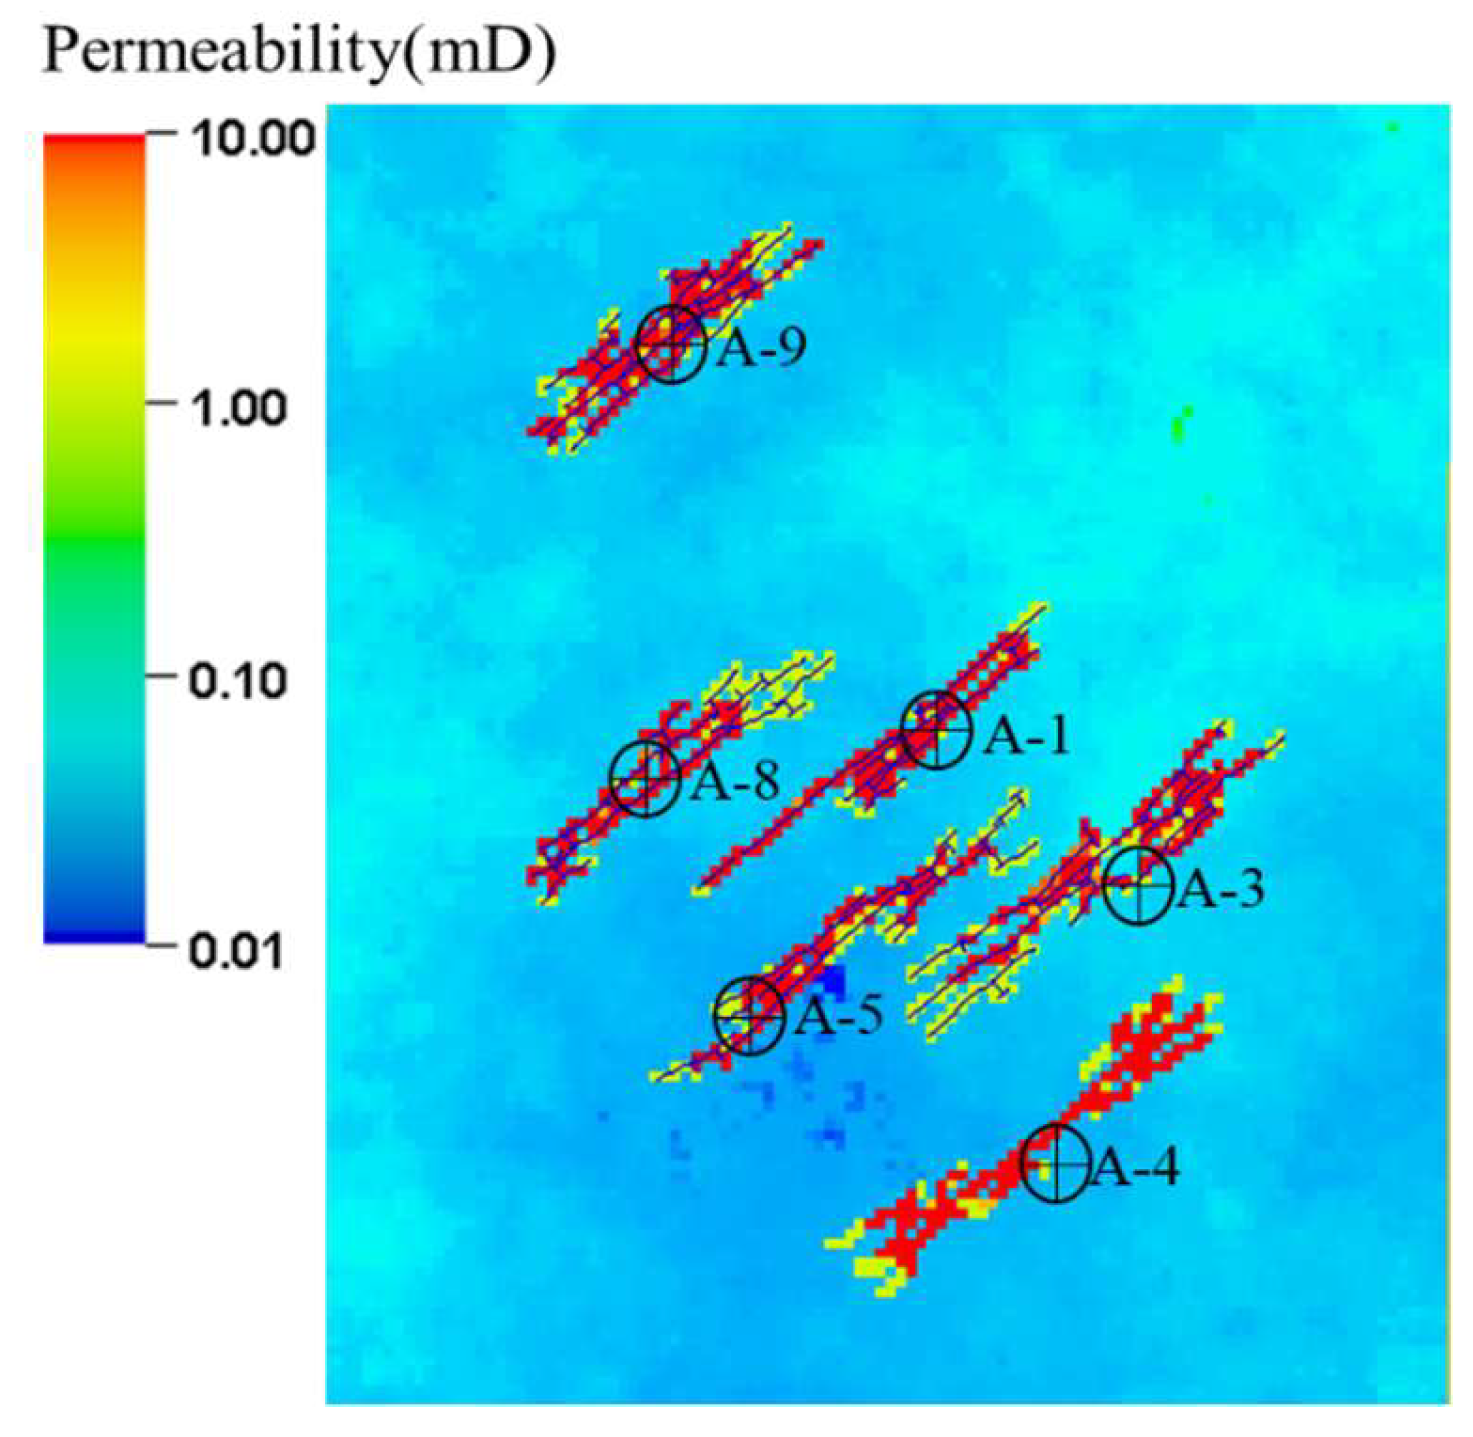
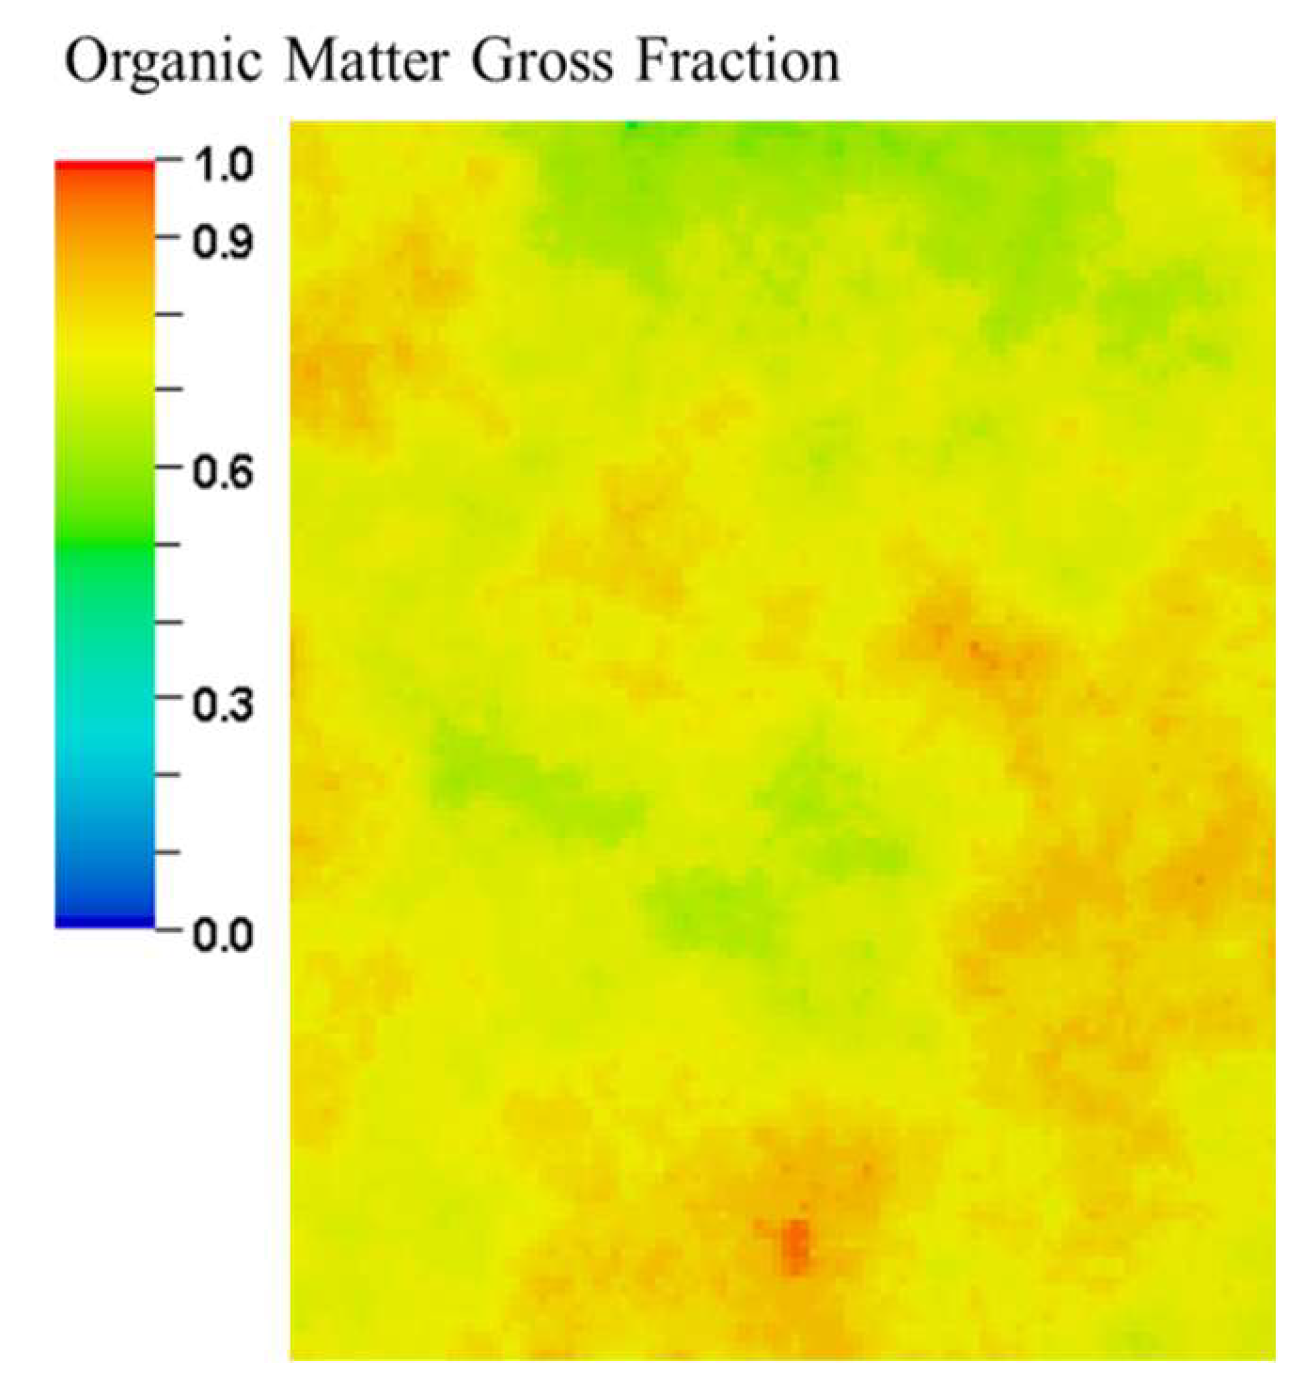
Based on the fracture network parameters and geological models, the production numerical simulation model for well group A of the 5# coal seam was established using the INTERSECT simulator (also embedded in Petrel) (Figure 6). Additionally, this model incorporates mechanisms specific to CBM, such as stress sensitivity, diffusion, and desorption. CBM simulation using INTERSECT can employ a traditional single-porosity medium model, where organic matter content is set as a grid property and adsorbed components are represented as solution variables. This implies that the same number of grid cells simultaneously possess dual definitions for both pore space and organic matter. By explicitly defining organic matter through new property values, this approach provides a clearer and more consistent mechanism for defining simulation cases. To define organic matter, two property parameters must be input: “Organic matter gross fraction” and “Organic matter porosity coupling.” The former represents the percentage of coal matrix within the overall grid and can be calculated based on the gas-content property described in Section 3.1 (Figure 7). The latter represents the coupling factor between organic matter and porous media, influencing gas diffusion. Additionally, the Langmuir isotherm adsorption model is employed to simulate coalbed-methane desorption. Based on laboratory experimental data, the Langmuir volume (VL) is set to 25.93 m3/t, the Langmuir pressure (PL) to 2.02 MPa, and the methane diffusion coefficient to 0.026 m2/d.
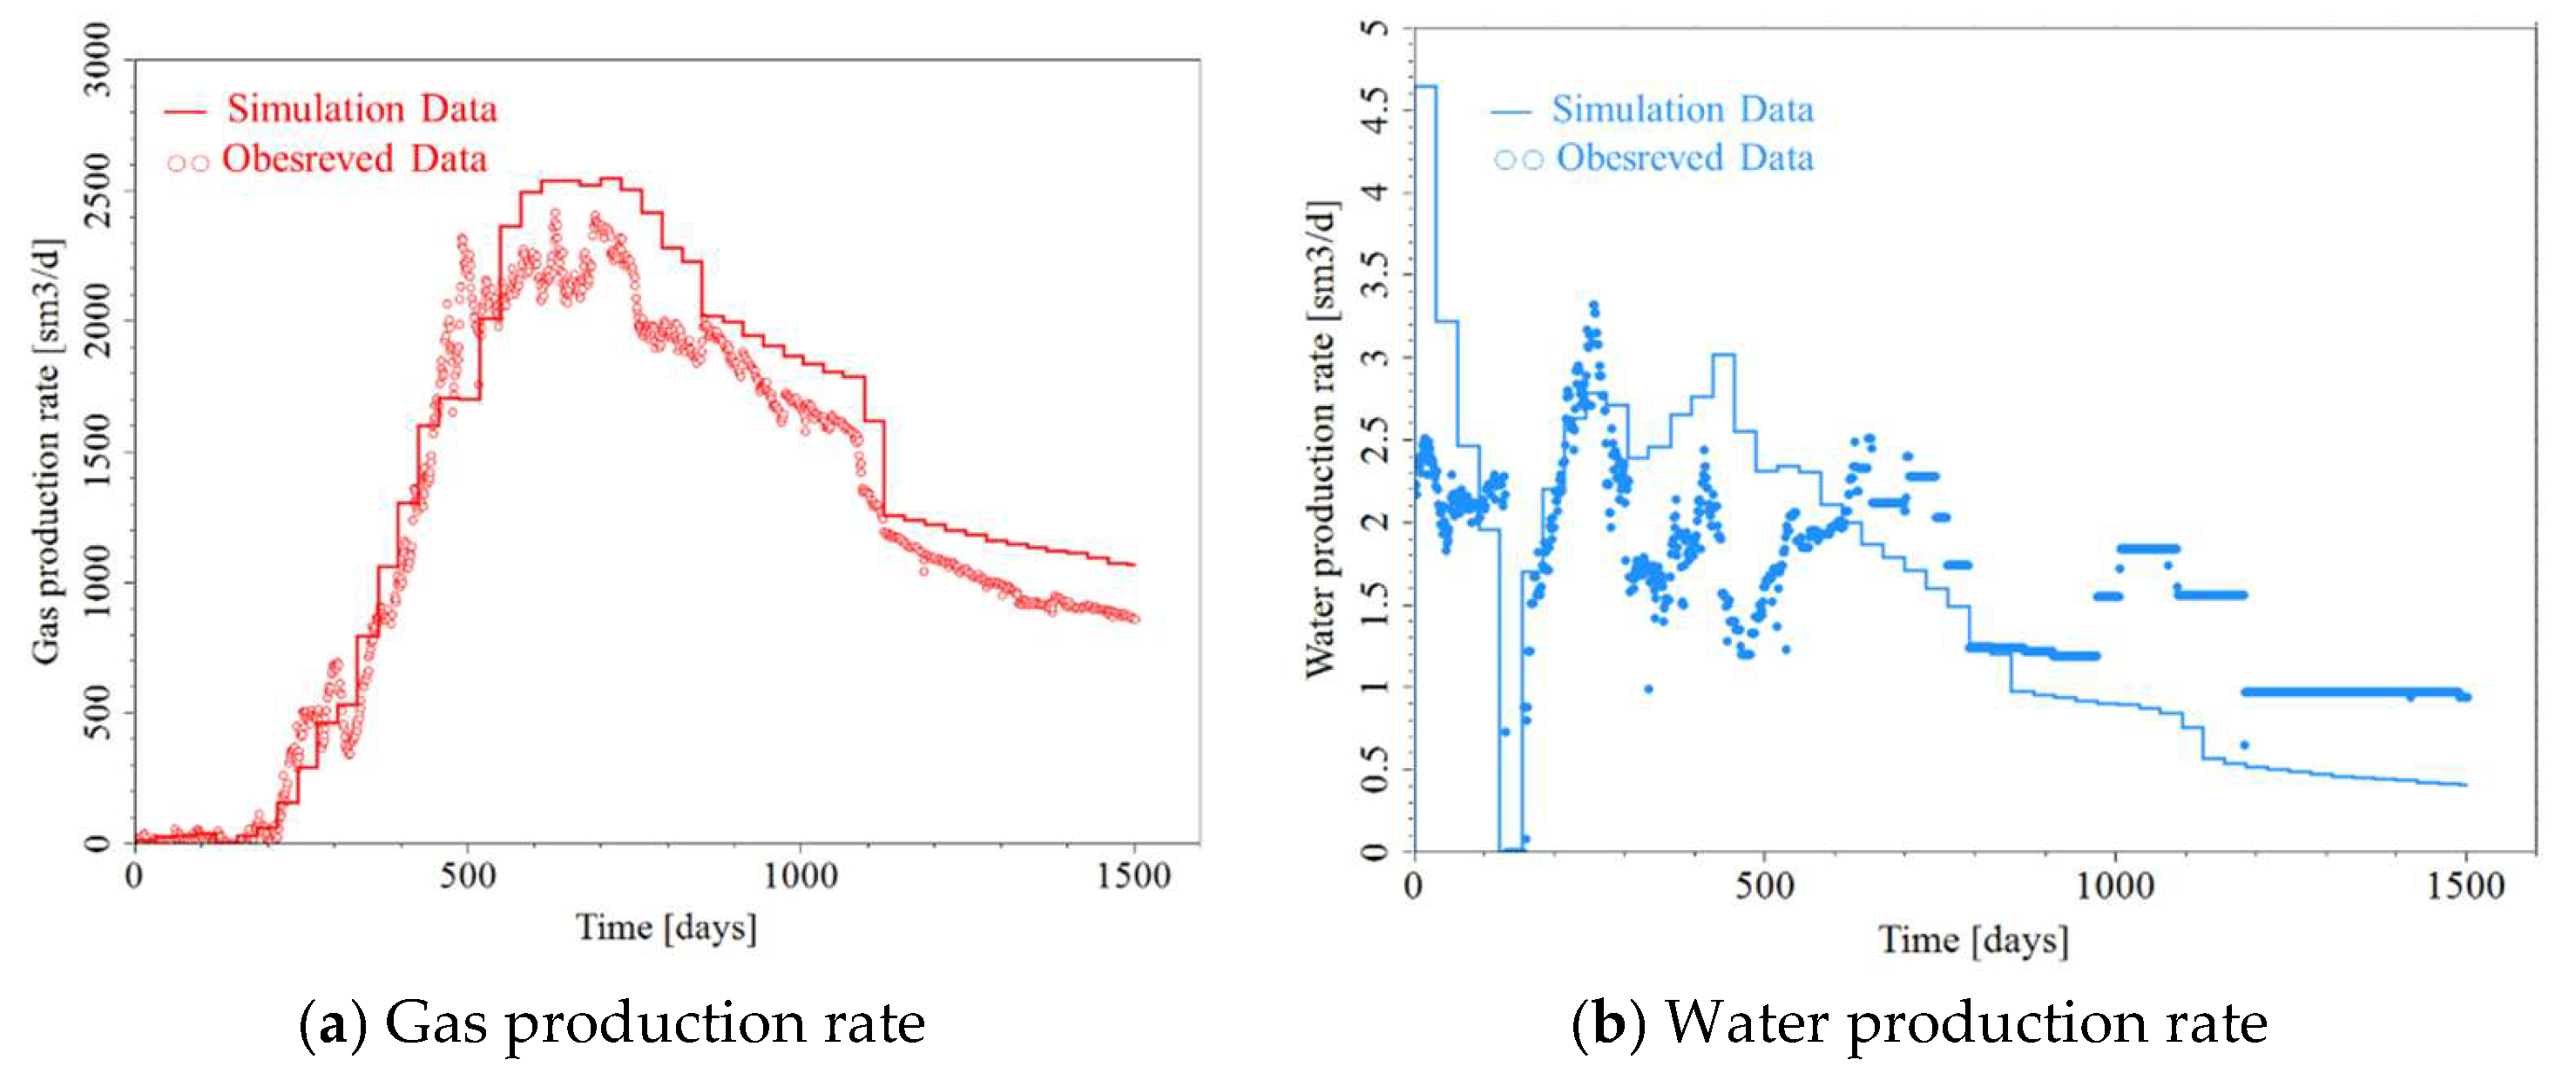
Following model initialization, the total adsorbed gas volume was 0.61 × 10⁸ m3, with 0.21 × 10⁸ m3 adsorbed within the fracture-controlled zone. By adjusting fracture permeability, matrix permeability, and parameters governing desorption and diffusion, the daily gas and water production for all six wells in the well group were fitted using the fixed bottomhole pressure (Figure 8). When calling the INTERSECT simulator, the model requires approximately 10 min per computation. For the well group, the absolute average relative deviation percent (AARD %) of daily gas production and daily water production are 16.38% and 30.38%, respectively. Additionally, the relative errors for the cumulative gas production and cumulative water production are 9% and 2.8%, respectively. At the conclusion of the history fitting, the average reservoir pressure in the fracture-controlled zone had decreased to 6 MPa. Although free gas was absent during initial production, pressure decline gradually desorbed adsorbed gas, increasing the average free gas saturation in the fracture-controlled zone to 0.075 by the end of the history fitting. Concurrently, it was observed that due to the low matrix permeability, pressure drop and desorption primarily occurred within the stimulated reservoir volume (SRV) zone (Figure 9).

4.3. Production Dynamics Prediction

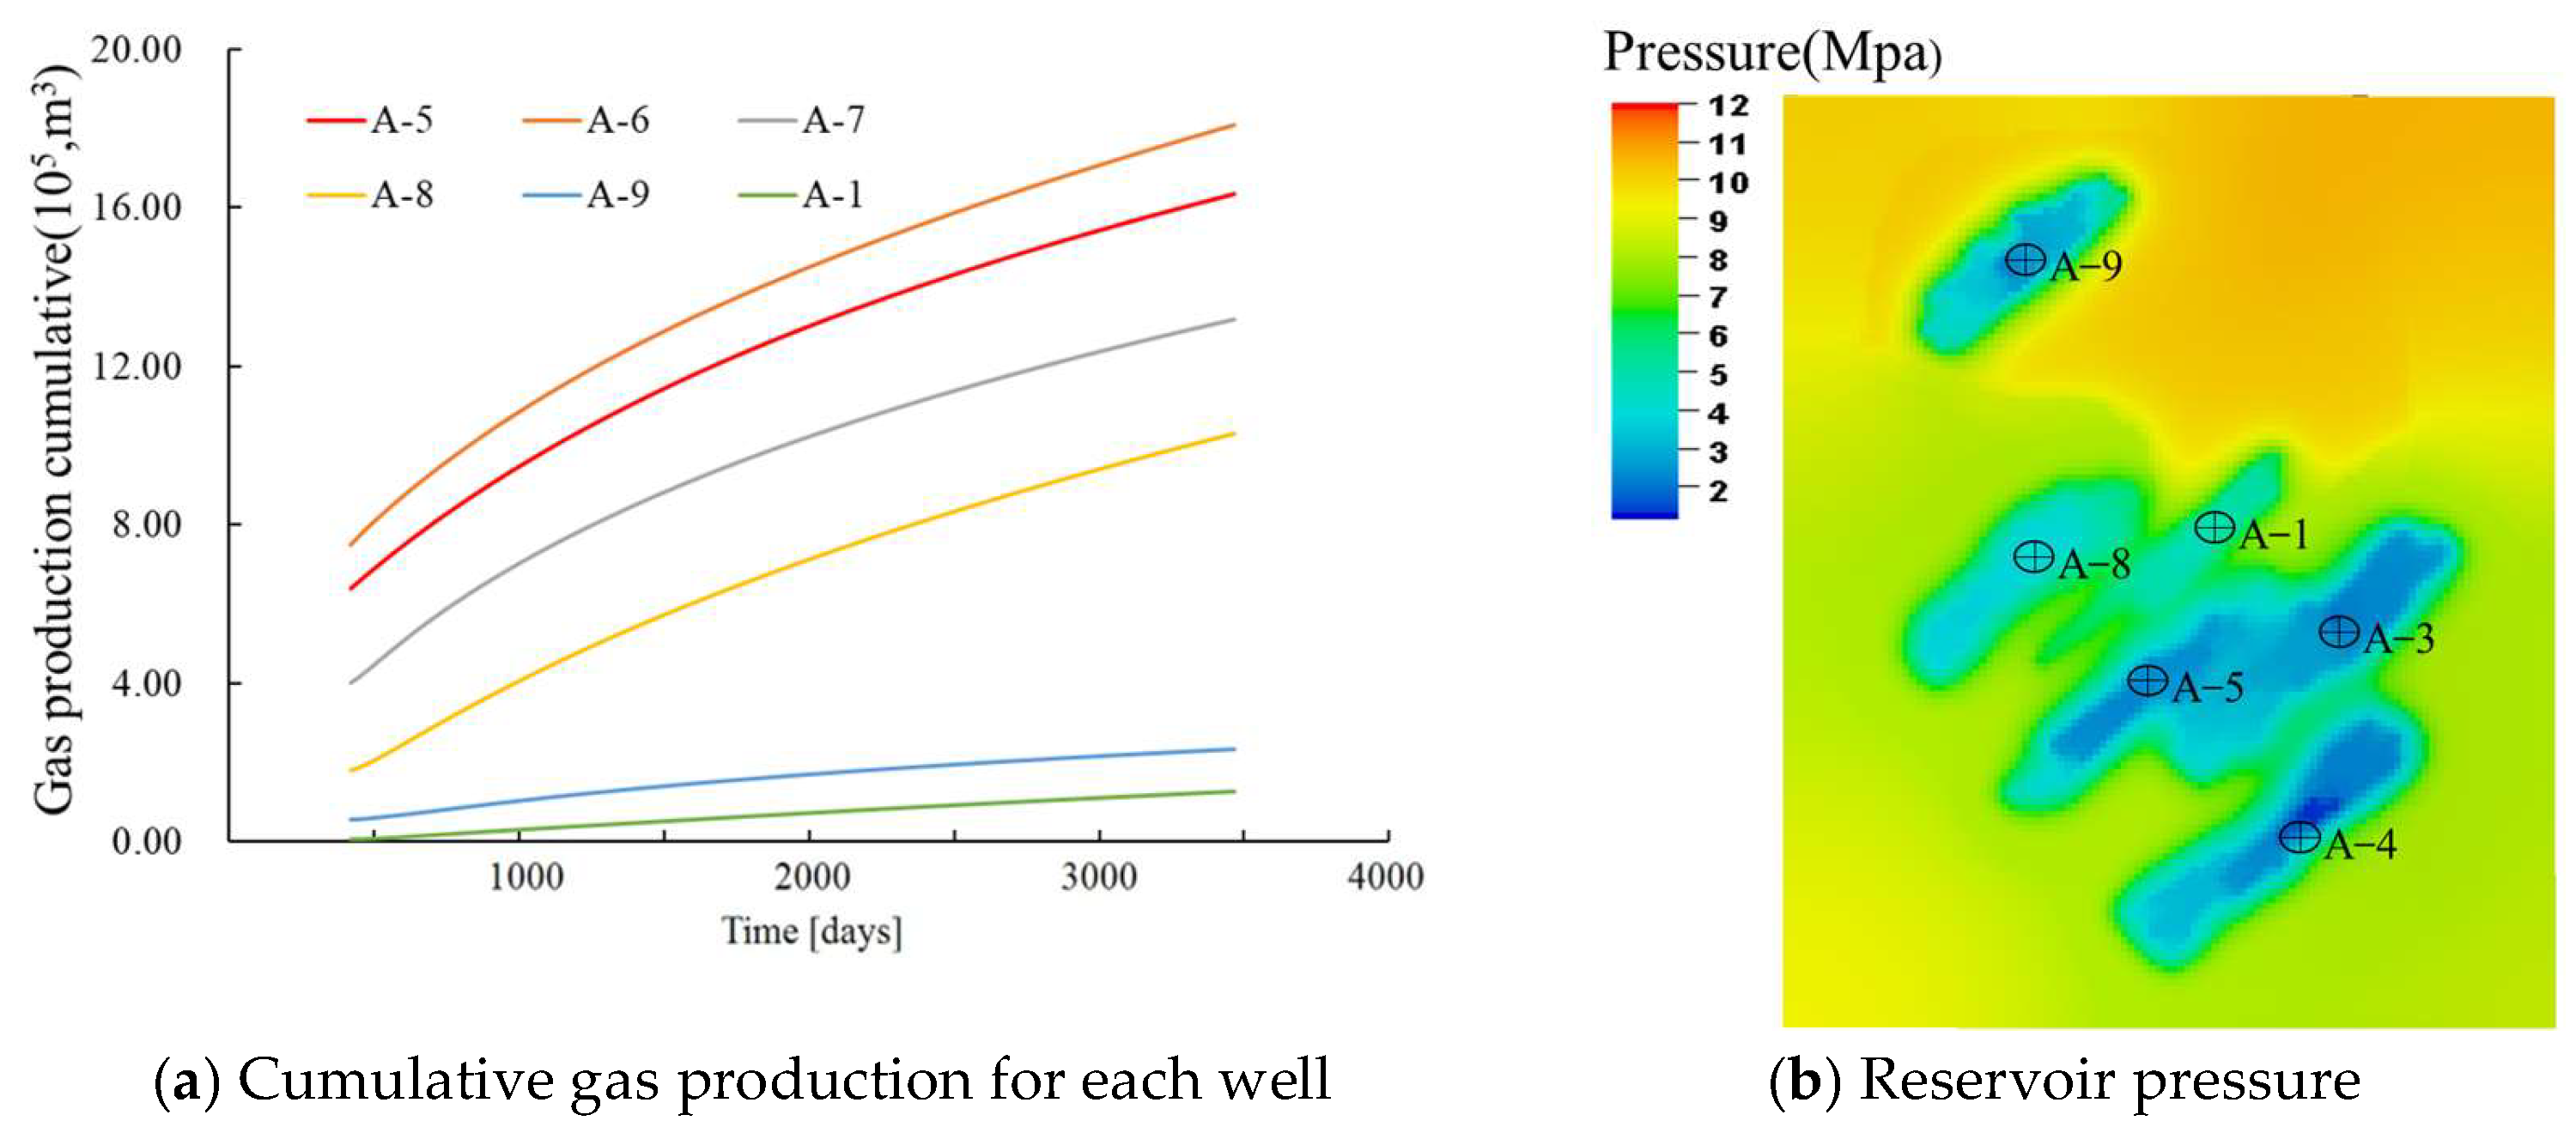
Based on the model fitted to production history, a further ten-year production forecast indicates a cumulative gas production for the well group of 616 × 104 m3, with a total recovery rate of 10.17% (Figure 10a). The simulated cumulative gas production for well A-6 was 181 × 104 m3, exhibiting an error of only 6.1% compared to TOPAZE’s forecast for A-6, indicating the established model’s high accuracy. As shown in Figure 10b, significant areas of under-utilized reservoirs remain between wells during the final prediction phase, with relatively high residual gas content. This indicates substantial potential for enhanced recovery operations in this area following the conclusion of conventional depletion development.

5. Sensitivity Analysis

5.1. Well-Spacing Analysis

In this section, after correcting the model parameters through history fitting, the well A-7 model is selected for parameter sensitivity analysis. The properties of the extracted model remain heterogeneous.
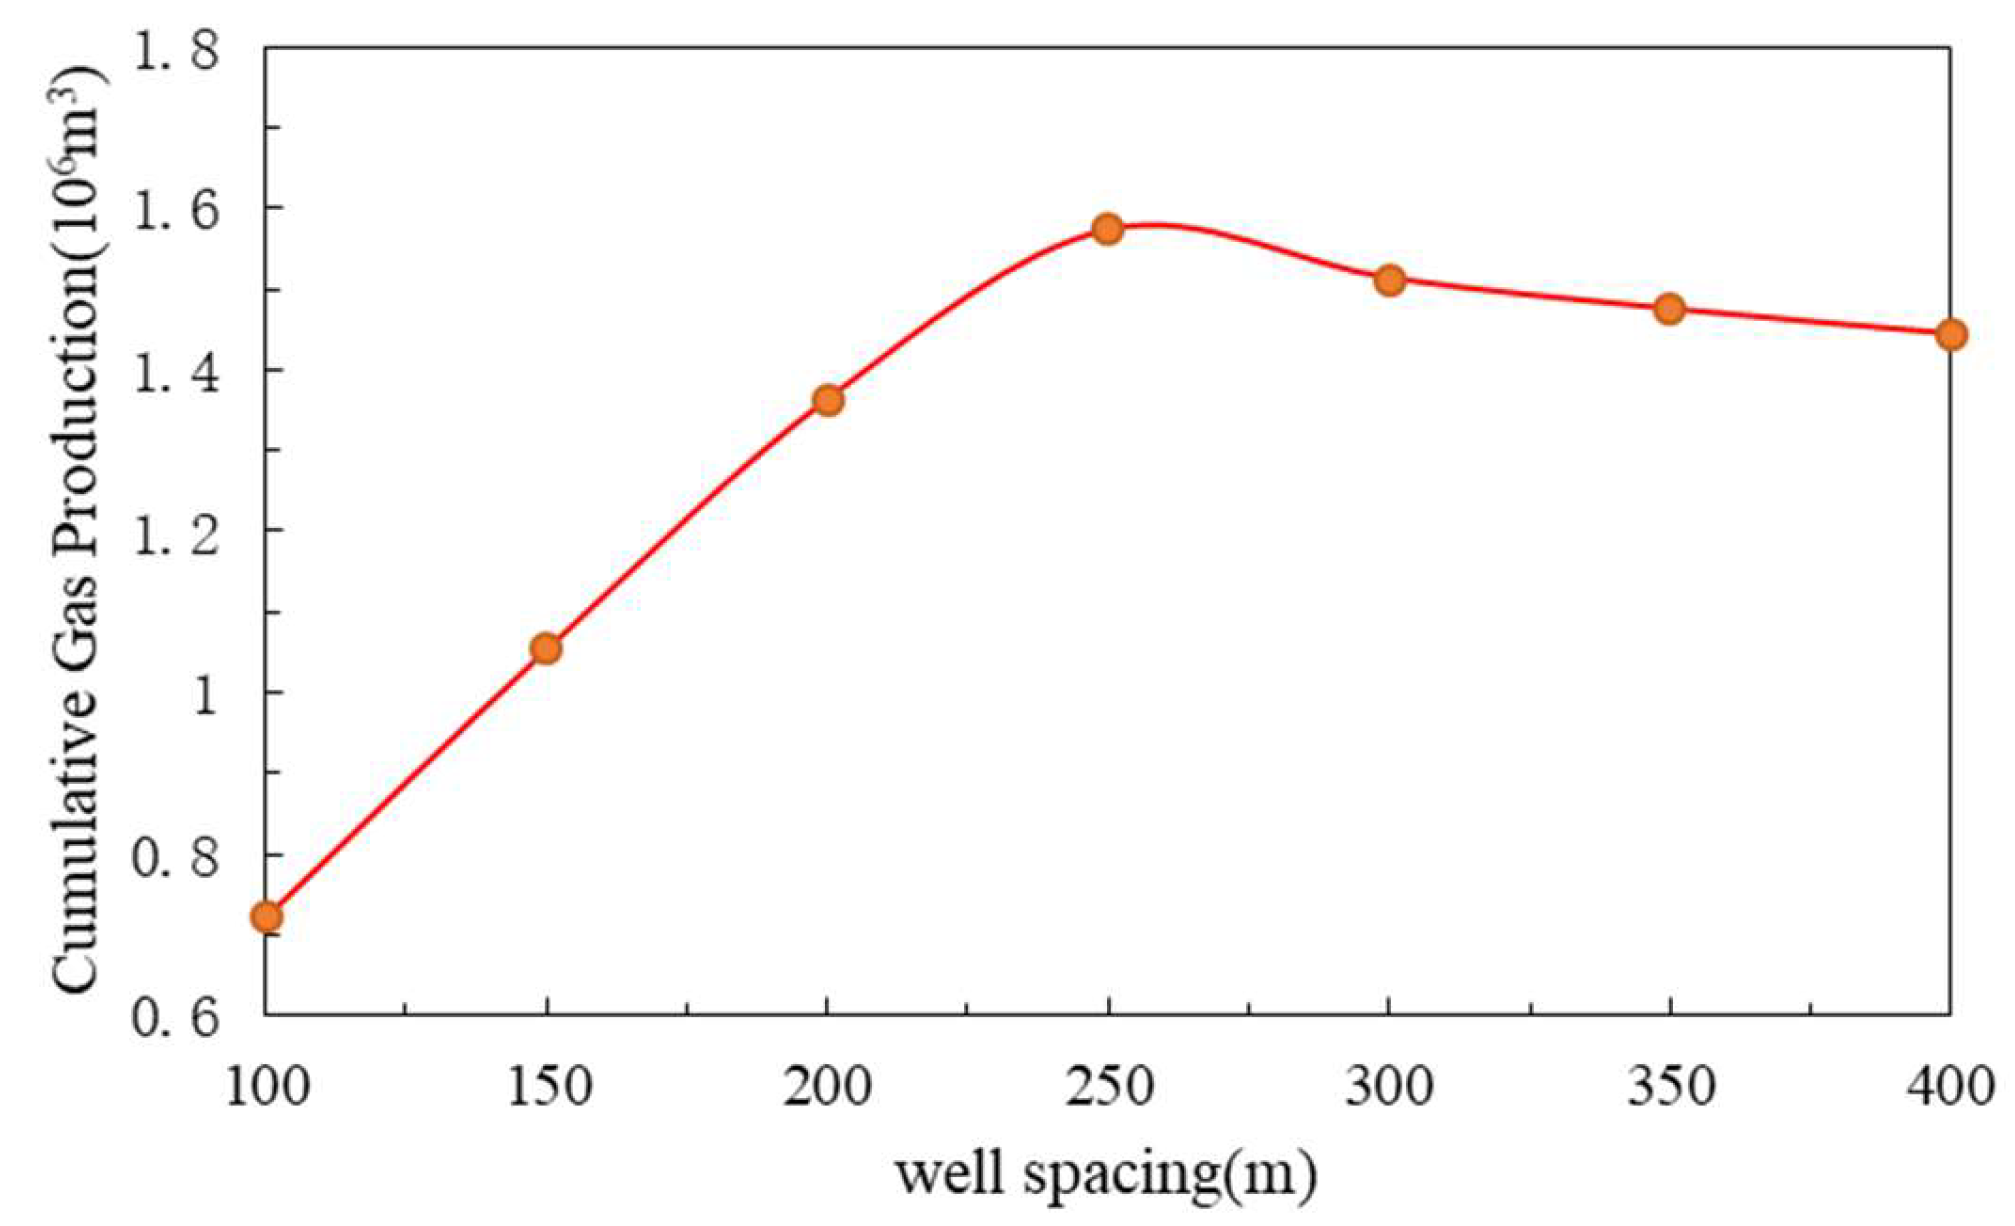
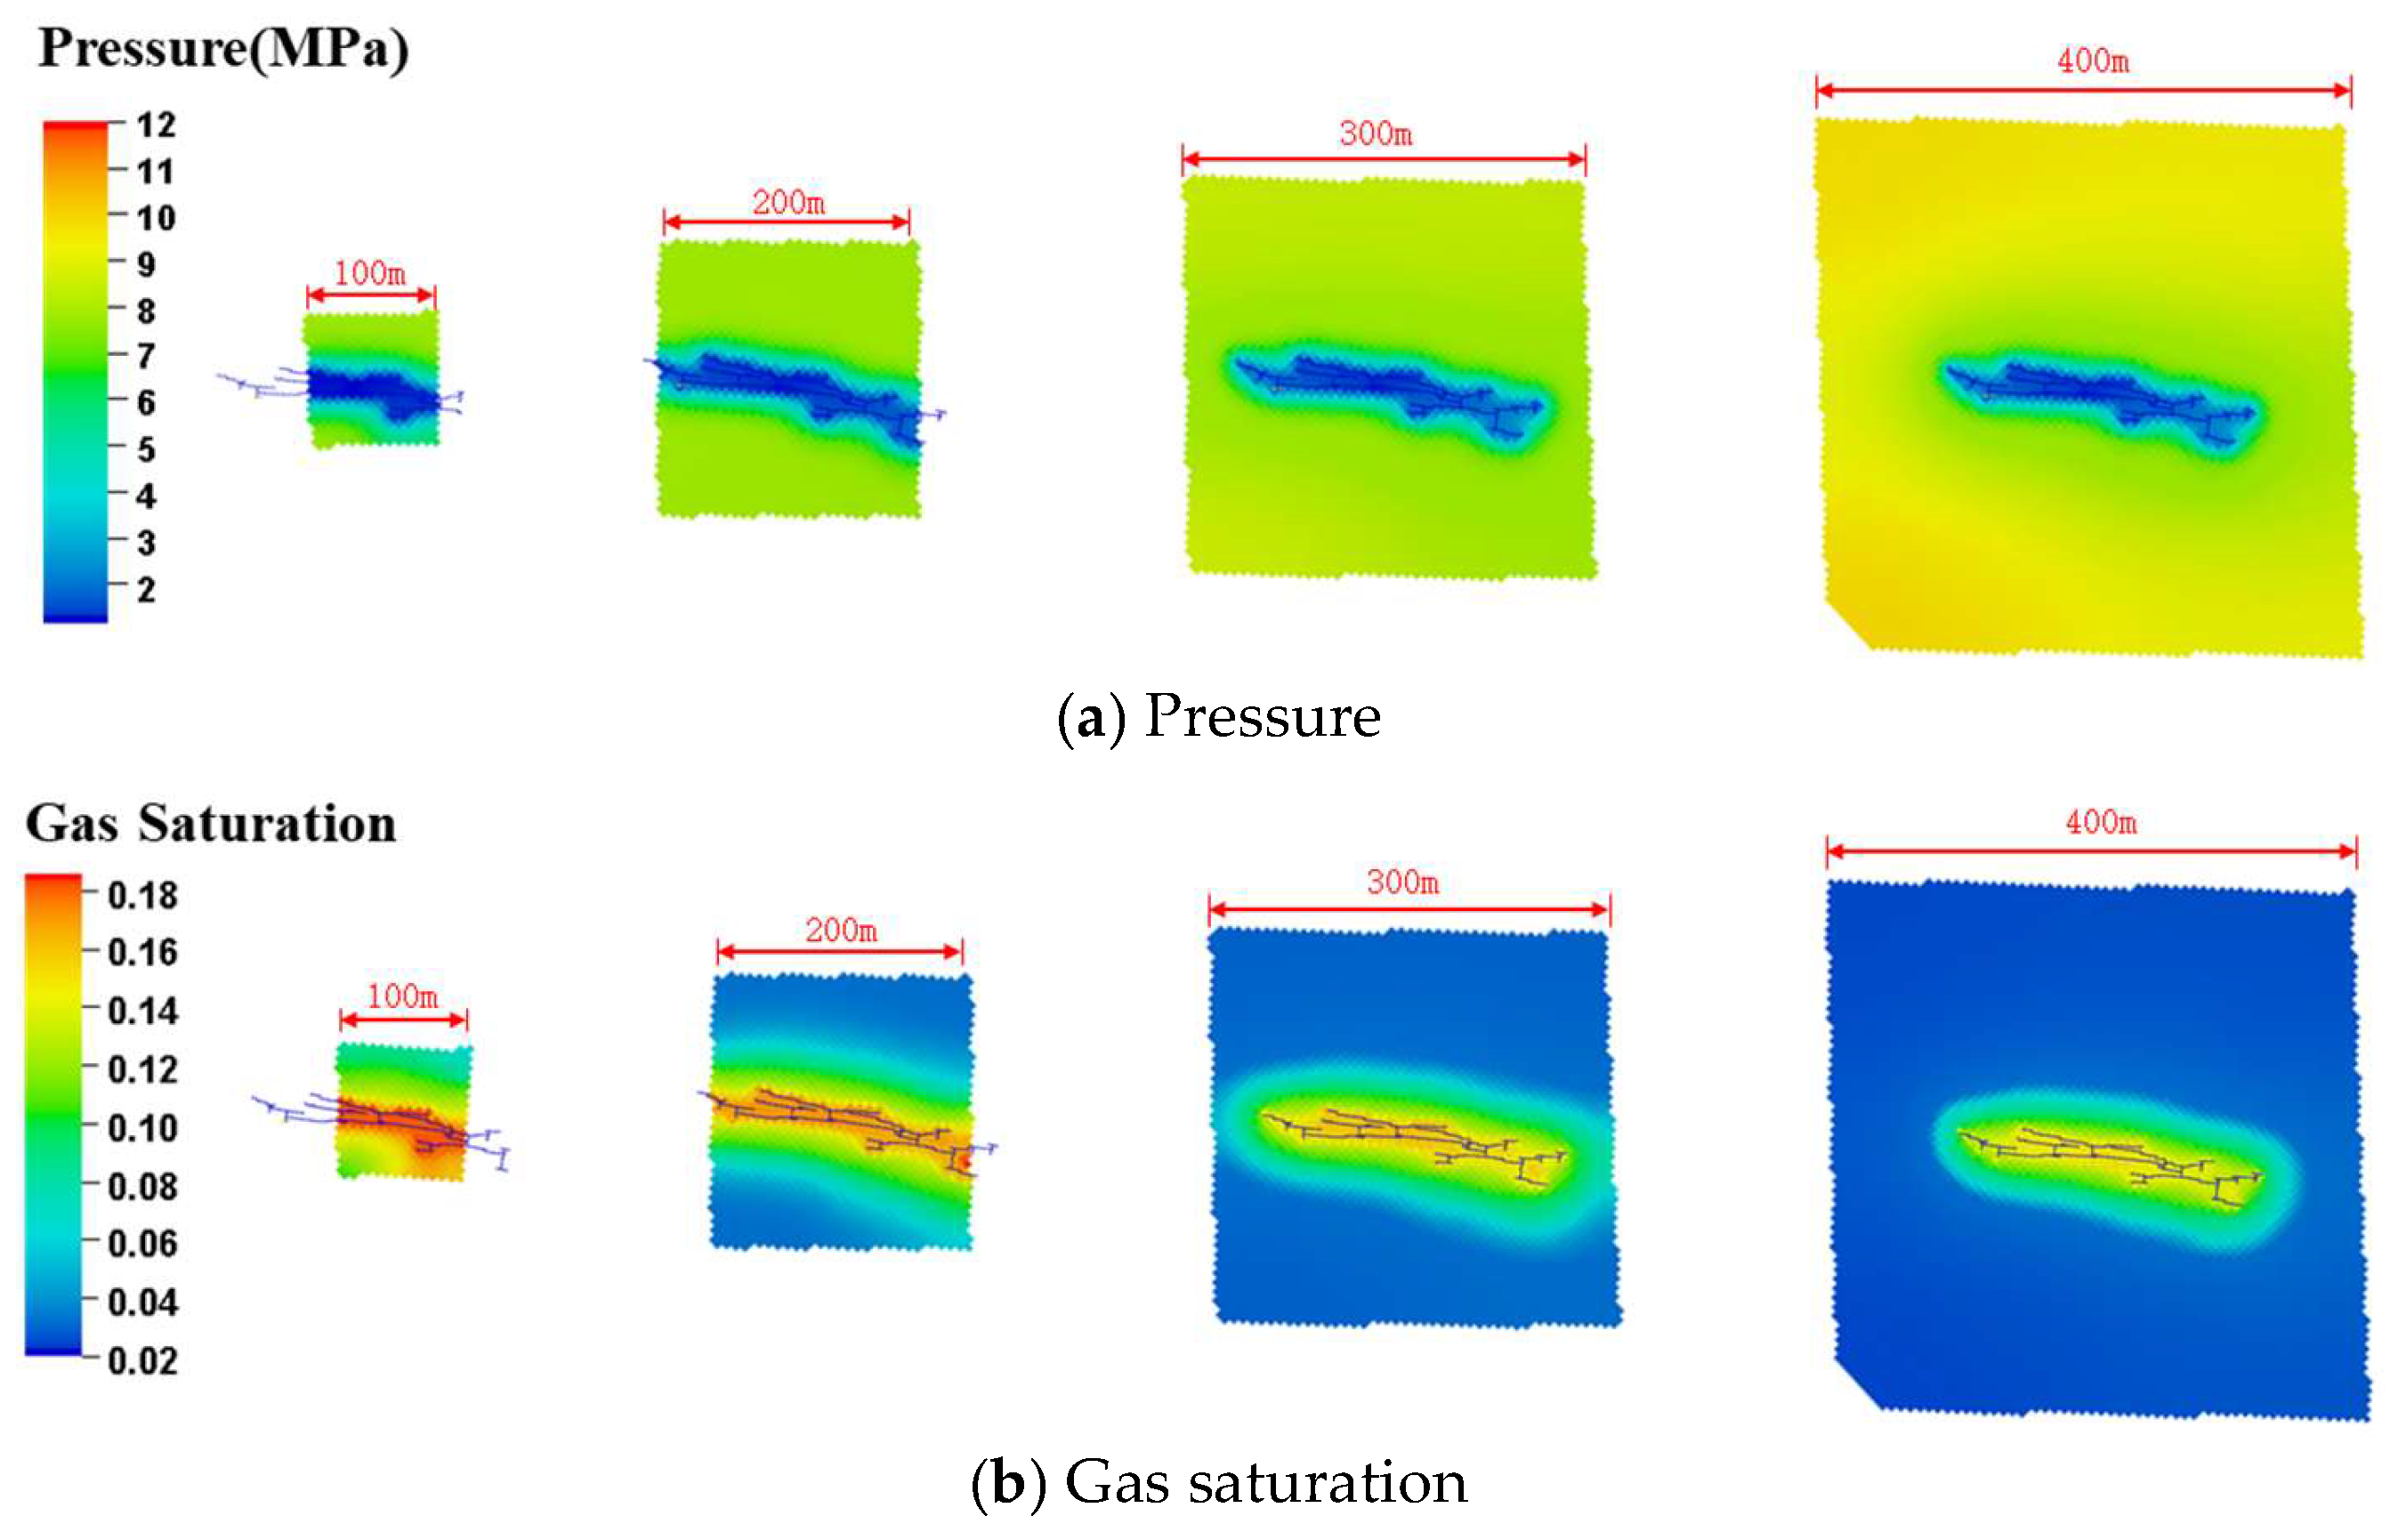
First, maintaining the fracture length of 231.88 m and the fracture conductivity of 250 mD·m for well A-7 constant, simulations were run for 15 years with well spacings ranging from 100 to 400 m. As illustrated in Figure 11, cumulative gas production initially increases then decreases with increasing well spacing, peaking at 250 m. This behavior stems primarily from the following factors: (1) greater pressure decline induces higher desorption of adsorbed gas. When well spacing is less than fracture length, expanding pressure-decline zones increase desorption coverage, boosting cumulative gas yield; and (2) when the well spacing exceeds the fracture length, further increases in spacing expand the supply range but paradoxically reduce the pressure drop. This diminishes the desorbed free-gas saturation near fractures, thereby decreasing gas production. Consequently, optimal desorption occurs when the well spacing is marginally greater than the fracture length, resulting in maximum cumulative gas production at 250 m spacing (Figure 12).

5.2. Analysis of Conductivity

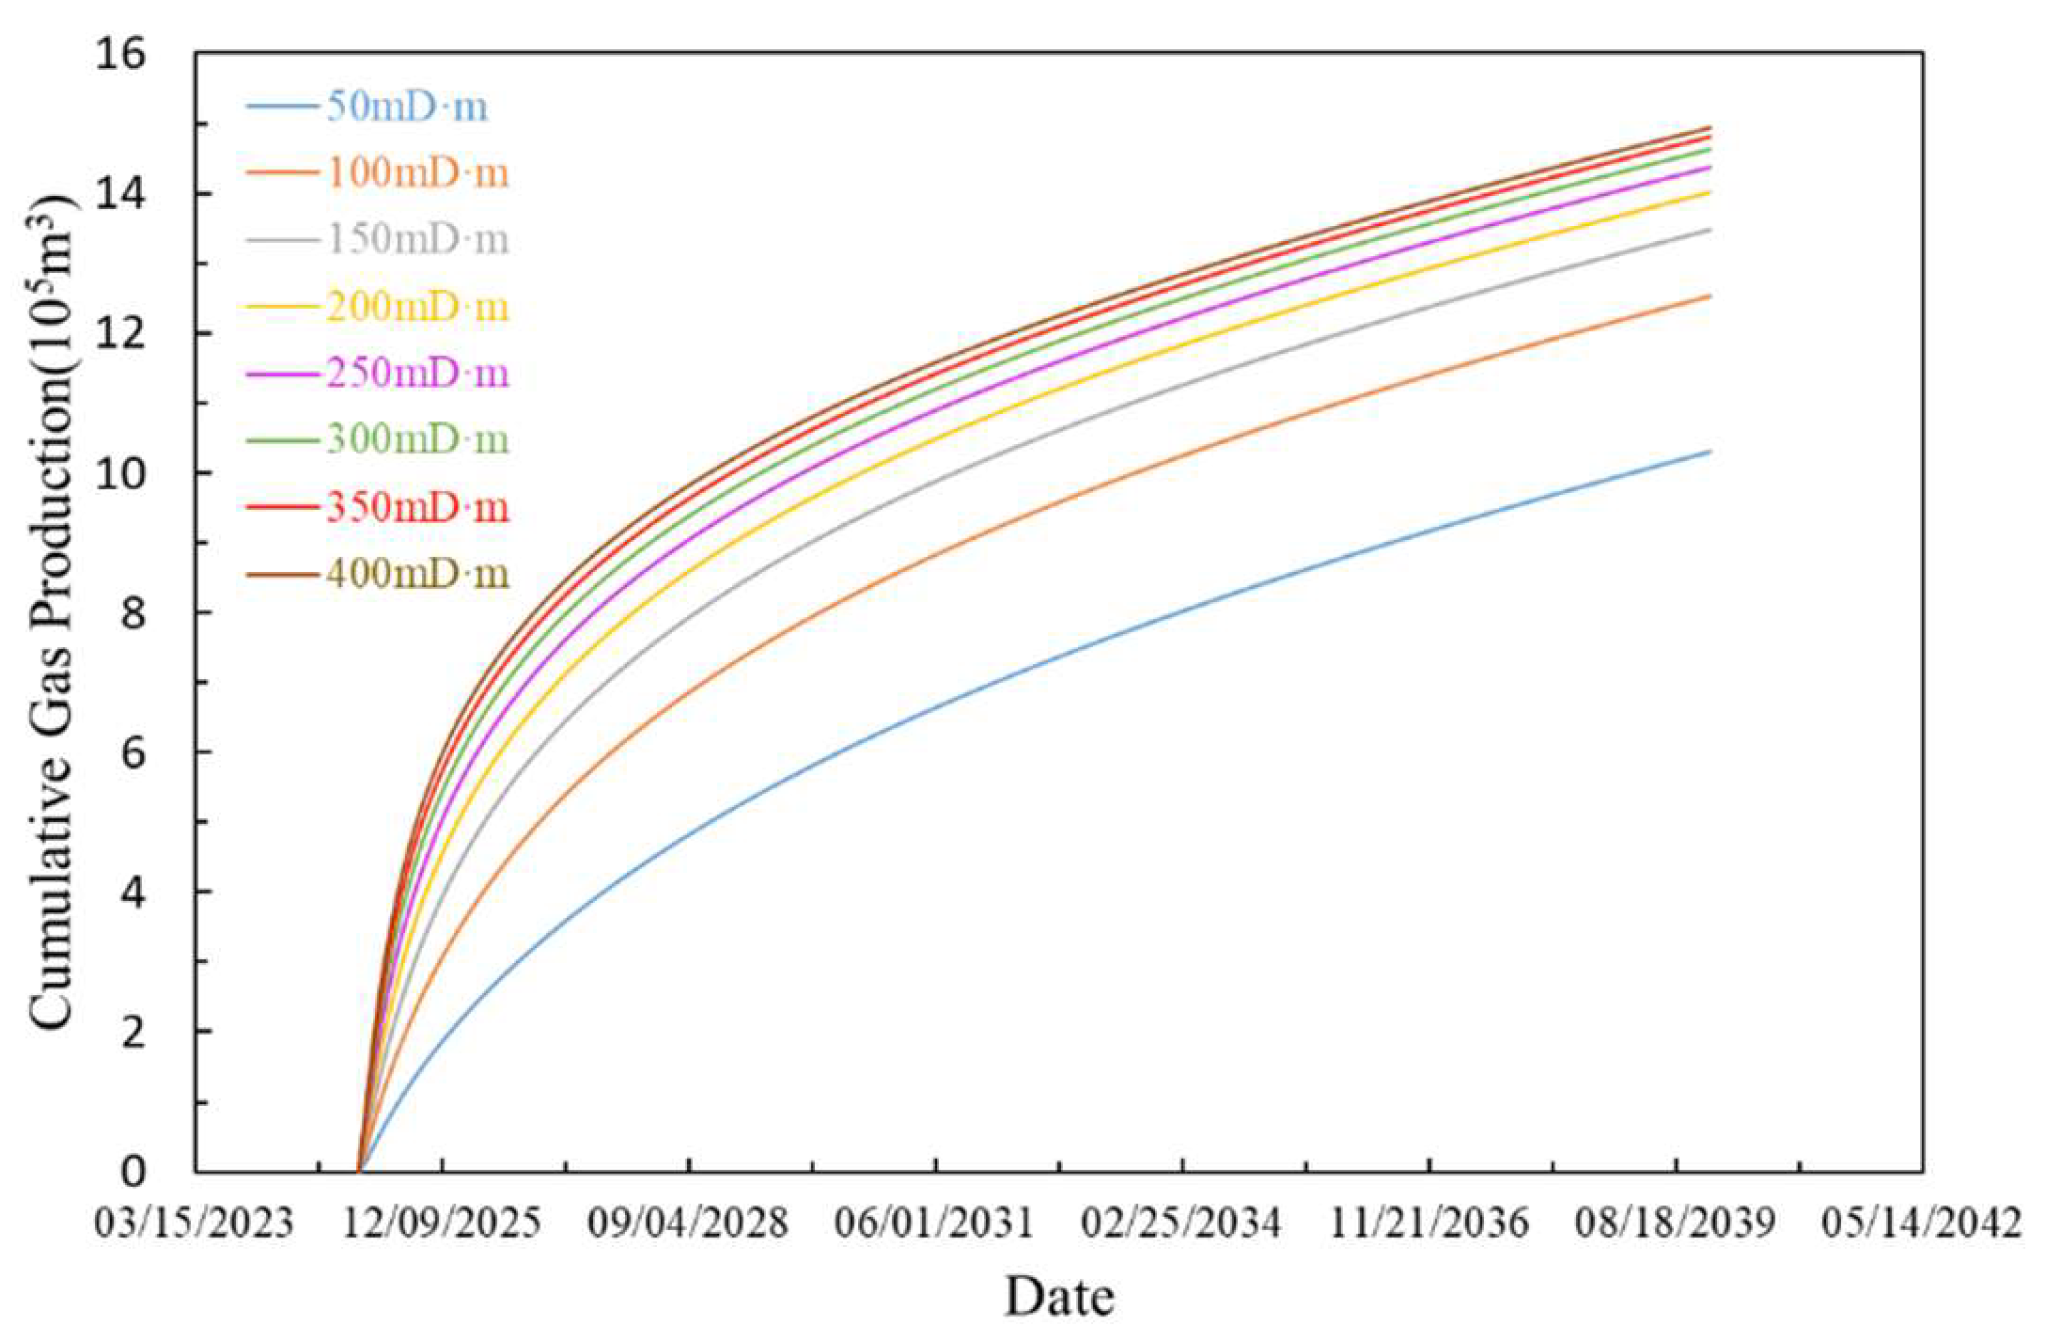
Maintaining the well A-7 fracture length at 231.88 m, production forecasts were conducted for 15 years with fracture conductivity ranging from 50 mD·m to 400 mD·m. As shown in Figure 13, cumulative gas production gradually increases with rising fracture conductivity, though the rate of increase progressively slows. Beyond a fracture conductivity of 200 mD·m, the growth in cumulative gas production diminishes significantly. This occurs because, at higher fracture conductivities, the matrix permeability becomes the primary factor limiting further increases in cumulative gas production. In other words, under the coalbed properties of the study area, it is recommended that the designed fracture conductivity does not exceed 200 mD·m.

5.3. Fracture-Length Analysis

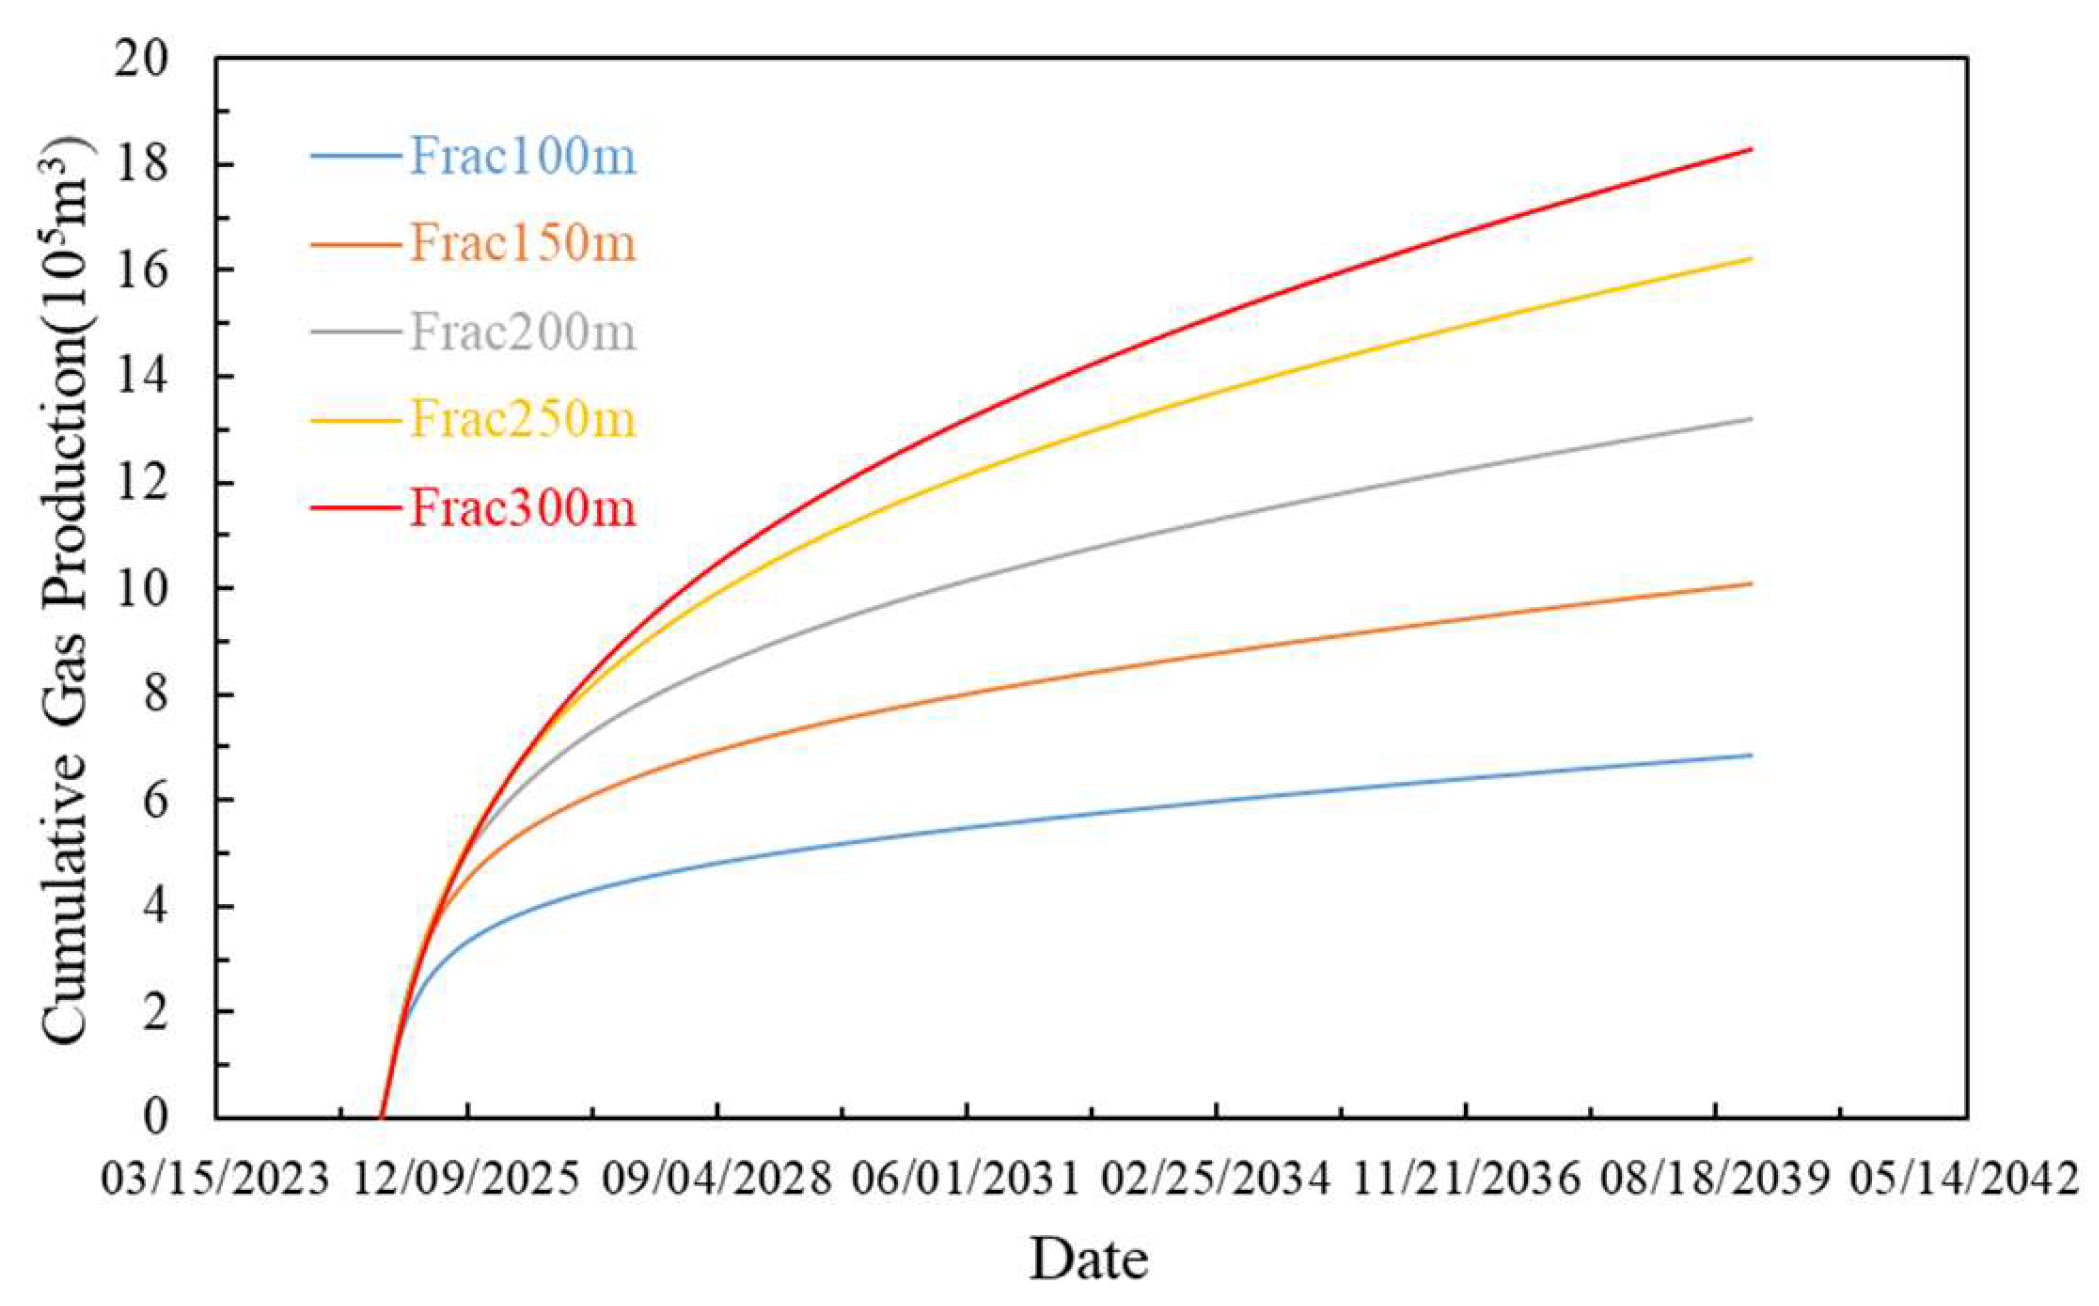
Maintaining the fracture conductivity of well A-7 at 250 mD·m, production forecasts were conducted for 15 years with fracture lengths ranging from 100 m to 300 m. As shown in Figure 14, cumulative gas production exhibited near-linear growth when fracture length increased from 100 m to 250 m. Further increases in fracture length yield markedly diminished incremental cumulative gas production. This indicates that, under the geological conditions of the study area, fracture lengths exceeding 250 m are not recommended.

6. Conclusions

This study establishes an integrated simulation workflow for CBM, including geological modeling, geomechanics, fracturing simulation, and production simulation. Based on the actual well-group simulation of shallow CBM in the Daning–Jixian block, the effects of well spacing and hydraulic fractures on gas-well production are analyzed The main conclusions are as follows:
(1)
Coalbed methane’s roof and floor properties have a significant impact on the height of hydraulic fractures. The minimum horizontal principal stress difference between the coal seam and its roof and floor in the study area ranges from 3.41 to 5.90 MPa, and the fracture height is almost entirely constrained within the coal seam. The simulated hydraulic fracture length averages 169.79–215.84 m, the fracture height is 8.91–10.45 m, and the fracture conductivity is 121.92–248.71 mD·m.
(2)
By adjusting uncertain parameters (fracture permeability, isothermal adsorption curves, matrix permeability, etc.), a reliable model for CBM production dynamics and residual gas prediction is established. Due to the low matrix permeability, pressure drop and desorption primarily occur in the SRV region. The cumulative gas production predicted for the well group is 616 × 104 m3, with a recovery rate of only 10.17%. This indicates that the study area has good potential for enhanced recovery.
(3)
As well spacing increases, the cumulative gas production first rises and then declines. Desorption efficiency peaks when well spacing is slightly greater than fracture length, yielding maximum cumulative production. As fracture conductivity increases, cumulative production gradually increases. When fracture conductivity exceeds 200 mD·m, its influence on cumulative gas production diminishes. Cumulative gas production shows approximate linearity as fracture length increases from 100 m to 250 m, but the increase slows significantly when fracture length exceeds 250 m.

Author Contributions

Conceptualization, T.G.; methodology, T.G.; software, J.W.; validation, J.W. and D.Y.; investigation, Q.G. and D.Y.; resources, B.P.; data curation, Q.G.; writing—original draft, S.L.; writing—review and editing, S.L.; visualization, Y.L.; supervision, B.P.; project administration, Y.L. All authors have read and agreed to the published version of the manuscript.

Funding

This research received no external funding.

Data Availability Statement

The original contributions presented in this study are included in the article. Further inquiries can be directed to the corresponding author.

Conflicts of Interest

Authors Bin Pang, Tengze Ge, Jianjun Wu, Yinhua Liu and Decai Yin were employed by the PetroChina Coalbed Methane Company Limited. The authors declare that the research was conducted in the absence of any commercial or financial relationships that could be construed as a potential conflict of interest.

References

  1. Xu, F.Y.; Hou, W.; Xiong, X.Y.; Xu, B.R.; Wu, P.; Wang, H.Y.; Feng, K.; Yun, J.; Li, S.G.; Zhang, L.; et al. The status and development strategy of coalbed methane industry in China. Pet. Explor. Dev. 2023, 50, 765–783. [Google Scholar] [CrossRef]
  2. Li, S.; Qin, Y.; Tang, D.; Shen, J.; Wang, J.; Chen, S. A comprehensive review of deep coalbed methane and recent developments in China. Int. J. Coal Geol. 2023, 279, 104369. [Google Scholar] [CrossRef]
  3. Wang, L.; Sun, Y.; Zheng, S.; Shu, L.; Zhang, X. How efficient coal mine methane control can benefit carbon-neutral target: Evidence from China. J. Clean. Prod. 2023, 424, 138895. [Google Scholar] [CrossRef]
  4. Jia, X.Y.; Xia, Y.; Yan, Z.M.; Gao, H.J.; Qiu, D.W.; Guerrero, J.M.; Li, Z.M. Coordinated operation of multi-energy microgrids considering green hydrogen and congestion management via a safe policy learning approach. Appl. Energy 2025, 401, 126611. [Google Scholar] [CrossRef]
  5. Xu, A.; Han, S.; Wei, Y.; Zhou, P.; Zhang, J.; Guo, Z. Methane adsorption during pore evolution and its microscale impact on coalbed methane recovery: A case study of middle- and high-rank coals in the Western Guizhou. ACS Omega 2025, 10, 14. [Google Scholar] [CrossRef] [PubMed]
  6. Song, J.; Liu, C.; Liu, Y. Mechanism of coalbed methane migration and production based on micro-pore overpressure environment. Pet. Sci. Technol. 2022, 40, 2971–2987. [Google Scholar] [CrossRef]
  7. Yang, L.; Fan, C.; Luo, M.; Wen, H.; Zhou, L.; Zou, Q.; Sun, H.; Wang, D. Permeability-driven optimization of carbon dioxide injection timing in enhanced coalbed methane recovery. Int. J. Coal Sci. Technol. 2025, 12, 90. [Google Scholar] [CrossRef]
  8. Wang, Y.; Yang, W.; Liu, X.; Wen, Y.; Li, Y. Research on the adsorption characteristics and mechanisms of surfactants for coalbed methane. Powder Technol. 2025, 466, 121410. [Google Scholar] [CrossRef]
  9. Li, W.; Yang, K.; Cheng, Y.P. Kinetic model of methane marbon isotope fractionation during coalbed gas desorption and diffusion. J. China Coal Soc. 2022, 47, 849–859. [Google Scholar] [CrossRef]
  10. Liu, Y.; Sun, X.; Yao, Y.; Liu, D.; Qiu, Y. CO2-enhanced methane recovery in deep coalbeds: Displacement and diffusion/pressure-driven behaviors. Gas Sci. Eng. 2025, 143, 205730. [Google Scholar] [CrossRef]
  11. Xu, H.; Tang, D.; Zhao, J.; Li, S.; Tao, S. A new laboratory method for accurate measurement of the methane diffusion coefficient and its influencing factors in the coal matrix. Fuel 2015, 158, 239–247. [Google Scholar] [CrossRef]
  12. Lu, B.; Yang, Z.; Hou, Y.; Li, C.; Wang, J.; Liu, C.; Yao, Y. Desorption-diffusion specificity of deep coalbed methane under high-temperature effects: Implications for development. Int. J. Min. Sci. Technol. 2025; in press, corrected proof. [Google Scholar] [CrossRef]
  13. Cheng, Y.; Pan, Z. Reservoir properties of Chinese tectonic coal: A review. Fuel 2020, 260, 116350. [Google Scholar] [CrossRef]
  14. Akilu, S.; Padmanabhan, E.; Sun, Z. A review of transport mechanisms and models for unconventional tight shale gas reservoir systems. Int. J. Heat Mass Transf. 2021, 175, 121125. [Google Scholar] [CrossRef]
  15. Al-Rbeawi, S.; Al-Kaabi, M.H.H. A hybrid model for the combined impact of non-Darcy flow, stimulated matrix permeability, and anomalous diffusion flow in the unconventional reservoirs. Upstream Oil Gas Technol. 2020, 5, 100020. [Google Scholar] [CrossRef]
  16. Liu, W.; Xu, H.; Qin, Y.; Chu, X.; Liu, J.; Wu, D.; Zhao, W. Theoretical model and numerical solution of gas desorption and flow mechanism in coal matrix based on free gas density gradient. J. Nat. Gas Sci. Eng. 2021, 90, 103932. [Google Scholar] [CrossRef]
  17. Sepehrnoori, K.; Xu, Y.; Yu, W. Embedded Discrete Fracture Modeling and Application in Reservoir Simulation; Elsevier: Amsterdam, The Netherlands, 2020. [Google Scholar]
  18. Luo, S.G.; Zhao, Y.L.; Zhang, L.H.; Chen, Z.X.; Zhang, X.Y. Integrated Simulation for Hydraulic Fracturing, Productivity Prediction, and Optimization in Tight Conglomerate Reservoirs. Energy Fuels 2021, 35, 18. [Google Scholar] [CrossRef]
  19. Cao, J.; Cai, M.; Li, J.; Guo, Z.; Jiang, X.; Dong, G. Optimization of volumetric fracturing stages and clusters in continental shale oil reservoirs based on geology-engineering integration. Energies 2025, 18, 3066. [Google Scholar] [CrossRef]
  20. Qin, Y.; Guo, T.; Ding, H.; Liu, T.; Chen, M.; Zhang, M.; Feng, Y. Mechanism of inter-well hydraulic fracture interference in the primary horizontal well pattern. Geoenergy Sci. Eng. 2024, 241, 213165. [Google Scholar] [CrossRef]
  21. Wang, X.; He, J.; Qiu, X.; Li, L.; Zhang, L. An Improved acid fracturing design through RoqSCAN technology: A case study from Daniudi Gas Field in Ordos Basin, China. Processes 2023, 11, 1475. [Google Scholar] [CrossRef]
  22. Liu, H.; Liu, J.; Feng, J.; Huang, L.; Qin, S.; Kang, K.; Lian, L.; Yang, H. Fracturing design and field application of tight sandstone reservoir with ripple lamination and natural fractures. Chem. Technol. Fuels Oils 2022, 58, 707–716. [Google Scholar] [CrossRef]
  23. Yang, R.-Y.; Li, G.-S.; Qin, X.-Z.; Huang, Z.-W.; Li, J.-B.; Sheng, M.; Wang, B. Productivity enhancement in multilayered coalbed methane reservoirs by radial borehole fracturing. Pet. Sci. 2022, 19, 2844–2866. [Google Scholar] [CrossRef]
  24. Lü, Q.; Lü, J.; Cheng, Z.; Song, Y.; Hou, J. Four-dimensional in-situ stress evolution law of shale reservoirs based on mechanical time-varying characteristics. Pet. Geol. Recovery Effic. 2024, 31, 56–65. [Google Scholar] [CrossRef]
  25. Zhang, J.; Feng, Q.; Zhang, X.; Bai, J.; Karacan, C.Ö.; Wang, Y.; Elsworth, D. A two-stage step-wise framework for fast optimization of well placement in coalbed methane reservoirs. Int. J. Coal Geol. 2020, 225, 103479. [Google Scholar] [CrossRef]
  26. Li, P.; Liu, Q. A dual porous and fractures medium CBM numerical model development and analysis. J. Pet. Sci. Eng. 2022, 214, 110511. [Google Scholar] [CrossRef]
  27. Chen, G.; Zhao, Q.B.; Li, W.Z. Control of in-situ stress field on high-permeability zones in Daning-Jixian Area. China Coalbed Methane 2009, 6, 15–20. [Google Scholar] [CrossRef]
  28. Sun, B.; Zhao, Q.B.; Li, W.Z. Coalbed methane resources and exploration strategies in China. Nat. Gas Geosci. 1998, 9, 1–10. [Google Scholar]
  29. Sun, B.; Wang, X.H.; Chen, C.H. Distribution characteristics of coalbed methane in Daning-Jixian area of Ordos Basin. Nat. Gas Ind. 2004, 24, 17–20. [Google Scholar] [CrossRef]
  30. Fan, Y. Key Technologies and insights of geology-engineering integration for efficient and fast drilling of deep coalbed methane in Sichuan Basin. Drill. Prod. Technol. 2025, 48, 56–61. [Google Scholar] [CrossRef]
  31. Ren, Z.K.; Wang, S.C.; Liu, H. Research, Development and application of geology-engineering integration platform for oil and gas exploration and development. Mud Logging Eng. 2024, 35, 1–10. [Google Scholar] [CrossRef]
  32. Ren, Q.Q.; Li, L.F.; Wang, J.; Jiang, R.T.; Li, M.-P.; Feng, J.W. Dynamic evolution mechanism of the fracturing fracture system—Enlightenments from hydraulic fracturing physical experiments and finite element numerical simulation. Pet. Sci. 2024, 21, 3839–3866. [Google Scholar] [CrossRef]
  33. Zou, L.; Su, Y.; Xu, X.; Li, W.; Zhao, H.; Zhang, M.; Jiao, S. Study on the propagation law of hydraulic fractures in heterogeneous permeability reservoirs. PLoS ONE 2025, 20, e0328689. [Google Scholar] [CrossRef] [PubMed]
  34. Zhang, H.; Chen, J.; Zhao, Z.; Qiang, J. Hydraulic fracture network propagation in a naturally fractured shale reservoir based on the “well factory” model. Comput. Geotech. 2023, 153, 105103. [Google Scholar] [CrossRef]
  35. Kresse, O.; Weng, X.; Gu, H.; Wu, R. Numerical Modeling of Hydraulic Fractures Interaction in Complex Naturally Fractured Formations. Rock Mech. Rock Eng. 2013, 46, 555–568. [Google Scholar] [CrossRef]
  36. Chuprakov, D.; Melchaeva, O.; Prioul, R. Hydraulic fracture propagation across a weak discontinuity controlled by fluid injection. In Proceedings of the ISRM International Conference for Effective and Sustainable Hydraulic Fracturing, Brisbane, QLD, Australia, 20–22 May 2013. [Google Scholar]
  37. Wu, R.; Kresse, O.; Weng, X. Modeling of interaction of hydraulic fractures in complex fracture networks. In Proceedings of the SPE Hydraulic Fracturing Technology Conference, The Woodlands, TX, USA, 6–8 February 2012. [Google Scholar]
  38. Chang, C.; Tao, S.P.; Wang, X.C.; Liu, C.X.; Yu, W.; Miao, J.J. Post-frac evaluation of deep shale gas wells based on a new geology-engineering integrated workflow. Geoenergy Sci. Eng. 2023, 231, 212228. [Google Scholar] [CrossRef]
  39. Chen, H.; Liu, H.; Shen, C.; Xie, W.; Liu, T.; Zhang, J.; Lu, J.; Li, Z.; Peng, Y. Research on geological-engineering integration numerical simulation based on EUR maximization objective. Energies 2024, 17, 3644. [Google Scholar] [CrossRef]
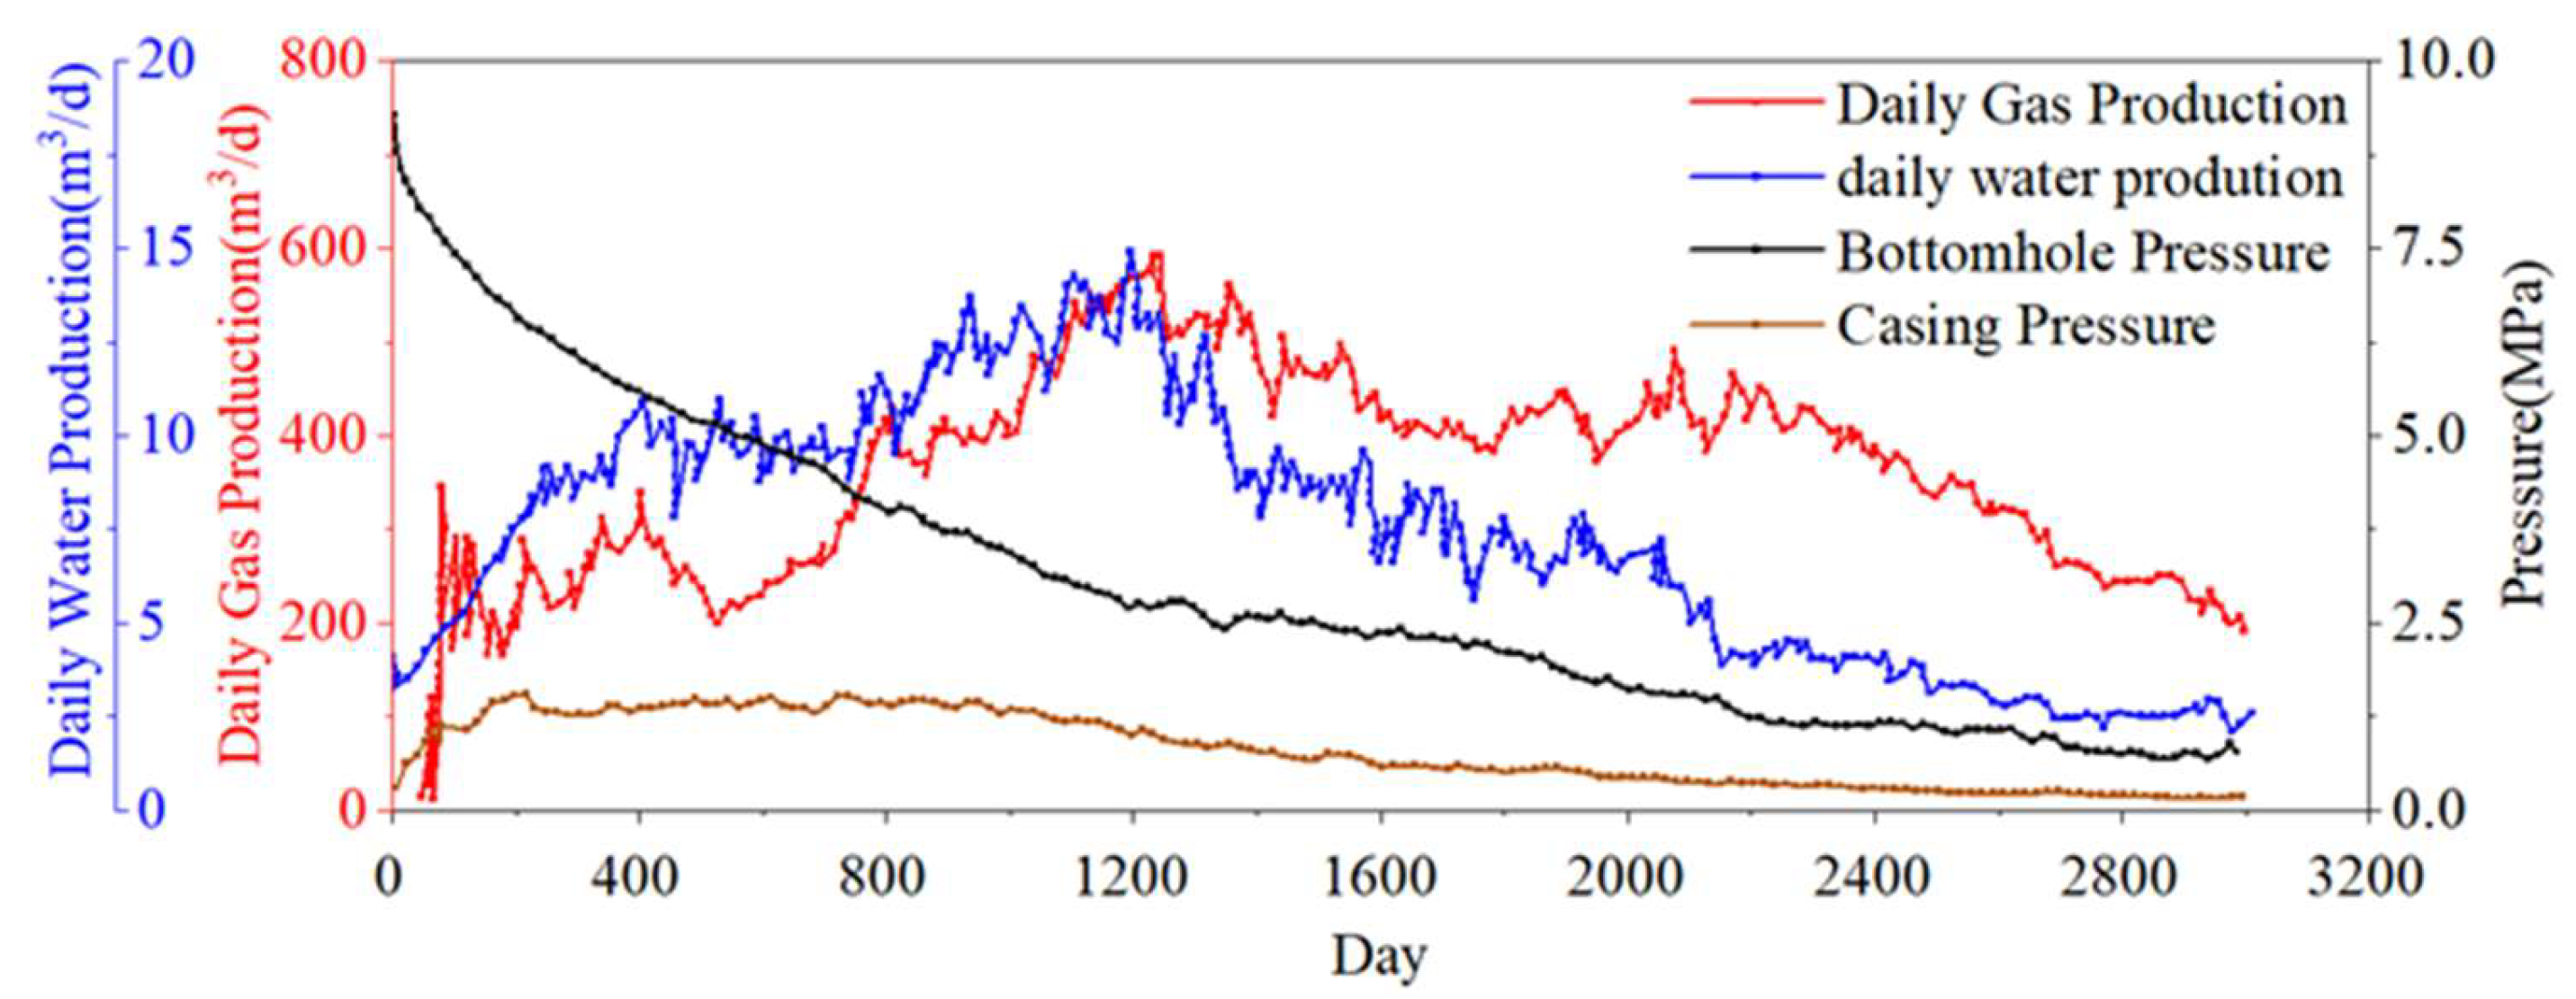
Figure 1. Production curve of a typical well during joint mining of the 5# and 8# coal seams.
Processes 13 03381 g001
Figure 2. Technical route of geology–engineering-integrated simulation for CBM.
Processes 13 03381 g002
Figure 3. Geological model of the well group.
Processes 13 03381 g003aProcesses 13 03381 g003b
Figure 4. Geomechanical model of the well group.
Processes 13 03381 g004
Figure 5. Fracturing simulation results.
Processes 13 03381 g005
Figure 6. Numerical simulation model including fracture networks.
Processes 13 03381 g006
Figure 7. Distribution of organic matter gross fraction.
Processes 13 03381 g007
Figure 8. Well-group historical fitting curve.
Processes 13 03381 g008
Figure 9. Distribution of parameters at the end of the historical fitting.
Processes 13 03381 g009
Figure 10. Results of production dynamics prediction.
Processes 13 03381 g010
Figure 11. Cumulative gas production at different well spacings.
Processes 13 03381 g011
Figure 12. Production simulation diagram of different well spacings.
Processes 13 03381 g012
Figure 13. Cumulative gas production at different conductivities.
Processes 13 03381 g013
Figure 14. Cumulative gas production at different fracture lengths.
Processes 13 03381 g014
Table 1. Parameters of coal seams 5# and 8#.
NameNet Coal
Thickness (m)
Coal
Density (t/m3)
Gas Content
(m3/t)
Geological
Reserves
(108 m3)
Technically Recoverable Reserves
(108 m3)
5#6.11.4412.7113.3456.67
8#6.01.4312.5108.9754.48
Table 2. Statistics of average values for the geomechanical parameters of each layer.
Layer NamePoisson’s RatioYoung’s Modulus
(GPa)
Vertical
Stress
(MPa)
Minimum Horizontal Total Stress
(MPa)
Maximum Horizontal Total Stress
(MPa)
Minimum
Horizontal Total Stress Difference
(MPa)
5# Roof0.24517.5927.3021.3223.02/
5# Coal0.2395.28527.4317.9118.433.41
5# Floor0.25319.0027.5122.1223.944.19
8# Roof0.27322.5929.0024.7926.91/
8# Coal0.2415.2429.1118.8919.395.90
8# Floor0.24518.3129.2222.6424.403.75
Disclaimer/Publisher’s Note: The statements, opinions and data contained in all publications are solely those of the individual author(s) and contributor(s) and not of MDPI and/or the editor(s). MDPI and/or the editor(s) disclaim responsibility for any injury to people or property resulting from any ideas, methods, instructions or products referred to in the content.