Abstract
To address the limitations of one-dimensional vibration signals in convolutional neural networks and the insufficient feature extraction capability of traditional single data processing methods under complex operating conditions, this paper proposes a novel fault diagnosis method that integrates dual-graph transformation and an improved residual network. Firstly, the one-dimensional vibration signals are converted into time–frequency representations using the short-time Fourier transform (STFT) and the synchrosqueezed wavelet transform (SWT). Subsequently, these dual-domain representations are fed in parallel into a customized parallel two-dimensional residual network (P2D-Sk-ResNet), which incorporates the selective kernel network (SKNet) mechanism into a ResNet architecture. This design enables adaptive multi-scale feature extraction. Finally, the features from the fully connected layer are classified using the extreme gradient boosting (XGBoost) algorithm to complete the fault diagnosis task. Comparative experiments demonstrate that the proposed STFT-SWT-P2D-Sk-ResNet-XGBoost achieves a diagnostic accuracy of 98.51% under constant load conditions, significantly outperforming several baseline models. Furthermore, the model exhibits superior generalization capability under varying load conditions and strong robustness in noisy environments. The proposed method provides a valuable and practical reference for intelligent fault diagnosis in industrial applications.
1. Introduction
Rolling bearings are among the most widely used mechanical components in industrial applications, playing a critical role in maintaining the normal operation of machinery. Once a bearing fails, it can potentially lead to severe safety incidents. Therefore, accurate diagnosis of rolling bearings is of great importance [1]. Conventional techniques for bearing fault diagnosis typically utilize model-driven, experience-based, or machine learning-based strategies. Model-driven approaches rely on mathematical formulations to predict bearing behavior, while experience-based techniques require expert interpretation [2,3]. However, as modern mechanical systems become increasingly complex, developing precise models and relying solely on human judgment has become more challenging. They also demand extensive manual feature engineering, which is labor-intensive and susceptible to subjective bias. To address these shortcomings, data-centric approaches have made remarkable progress due to the capacity to automatically extract intricate patterns from raw inputs [4,5].
In the realm of fault diagnosis, various machine learning algorithms have been extensively applied [6,7]. However, the traditional algorithms often rely on manually engineered features, which limit their adaptability and efficiency. To overcome these limitations, deep learning approaches have increasingly been recognized as effective alternatives [8,9,10]. Among them, the convolutional neural network (CNN) has found the most extensive applications and yielded promising outcomes in the field of fault diagnosis [11,12]. A multitude of CNN-based fault diagnosis methods exist, which can be categorized into two groups according to the input dimension [13,14].
The first category of methods utilizes one-dimensional vibration signals as the input for CNN. For example, Qu et al. [15] put forward an end-to-end adaptive one-dimensional convolutional neural network for fault diagnosis. In this approach, the original one-dimensional data are partitioned into “time steps” and then fed as input. Chen et al. [16] proposed an adaptive neural network model for gearbox fault diagnosis, thereby validating the superiority of the network. Huang et al. [17] introduced a multi-scale convolutional network, and experimental results demonstrated its robust feature extraction capabilities in bearing fault diagnosis tasks. Qin et al. [18] presented a dynamic wide-convolutional residual network for bearing fault diagnosis. By extracting feature information at various scales, they successfully achieved effective fault identification. Notwithstanding the substantial research achievements of these studies, the original signals often fail to adequately represent fault features. Moreover, most established CNN models are more proficient in extracting feature information from high-dimensional data. Consequently, enhancing the accuracy of time-series classification through image recognition models has emerged as a prominent research focus in the domain of rolling bearing fault diagnosis.
The second category of methods involves converting one-dimensional signals into two-dimensional images and subsequently leveraging two-dimensional convolutional neural networks for fault diagnosis. For instance, Yuan et al. [19] employed continuous wavelet transform on vibration signals and then used the resulting time—frequency maps as input for a CNN classifier model. Wen et al. [20] proposed a method of transforming one—dimensional vibration signals into two-dimensional grayscale images prior to feeding them into a CNN, achieving satisfactory diagnostic results. Tong et al. [21] transformed one—dimensional signals into gramian angular difference fields and then input these into a CNN to accomplish the extraction and classification of rolling bearing fault features. Zhao et al. [22] encoded the acquired vibration signals using Markov transition fields (MTF) and input them into a CNN model for fault classification. Duan et al. [23] adopted the MTF encoding method to convert the original one-dimensional vibration signals into two-dimensional feature images, followed by adaptive feature extraction and fault diagnosis using CNN.
Although existing research has achieved good results in fault diagnosis tasks, in practical industrial application scenarios, fault diagnosis still faces many challenges:
- (1)
- The single two-dimensional mapping methods have limitations in representation and are difficult to fully exploit the potential of CNN in high-dimensional feature extraction;
- (2)
- When dealing with complex signals, to capture deep-level features, deep network structures need to be constructed, but as the model depth increases, problems such as gradient vanishing or gradient explosion are prone to occur.
To address these challenges, this paper proposes a coordinated optimization of the data input form and feature extraction mechanism. We introduce a novel fault diagnosis method that integrates dual-modal image transformation and an improved residual network for rolling bearing fault data. The main contributions of this study are threefold:
- (1)
- We propose a dual-graph transformation strategy using both STFT and SWT to convert one-dimensional signals into complementary time–frequency images. This approach comprehensively preserves signal information in both time and frequency domains, providing a richer feature foundation for the subsequent model.
- (2)
- We design and construct a parallel two-dimensional selective kernel residual network (P2D-Sk-ResNet). This network extracts features from the two types of time–frequency images in parallel and enhances feature representation through a fusion mechanism. By embedding the SKNet module into the ResNet architecture, the model not only alleviates gradient issues associated with deep networks but also adaptively adjusts receptive fields, improving sensitivity to key features and the ability to capture weak fault characteristics.
- (3)
- We replace the traditional softmax classifier with XGBoost for the final fault classification. This combination leverages the powerful non-linear modeling capability of XGBoost, leading to more accurate and robust diagnosis.
The proposed method is validated using data from the Case Western Reserve University (CWRU) bearing fault test platform. To assess effectiveness and generalization, data under different load conditions are used for training and testing. Ablation studies and comparisons with baseline models are conducted. Performance is evaluated using classification accuracy, precision, recall, F1-score, and robustness under different noise conditions. Computational efficiency is also analyzed in terms of parameter count and training time.
The remainder of this paper is organized as follows: Section 2 provides an overview of the theoretical principles underlying STFT, SWT, P2D-Sk-ResNet, and XGBoost. Section 3 details the overall architecture of the STFT-SWT-P2D-Sk-ResNet-XGBoost framework. Section 4 reports the experimental outcomes and evaluates the performance using data obtained from the Case Western Reserve University. Section 5 offers the conclusion and highlights the main contributions of the study.
2. Principle and Modeling
2.1. Short-Time Fourier Transform
STFT is designed to tackle the analysis of non-stationary signals that are commonly encountered in mechanical equipment. Specifically, this transformation is capable of converting one-dimensional signals into time–frequency representations [24].
STFT is theoretically grounded in the characteristics of Fourier transforms and windowing functions. Since the Fourier transform cannot provide time-domain resolution for non-stationary signals, window functions are employed to constrain the temporal extent of the signal. These functions divide a long-duration signal into multiple short-time segments. Following this, the Fourier transform is performed to produce the frequency-domain description for each time interval. This procedure results in the signal’s time–frequency distribution.
The STFT expression is presented below:
where denotes the frequency, represents the starting instant of the current window, and signifies the contribution of the signal.
2.2. Synchrosqueezed Wavelet Transform
SWT leverages the property that the phase in the frequency domain of a signal remains invariant under scale transformation after wavelet transform, enabling the computation of the frequency corresponding to each scale. Subsequently, all scales associated with the same frequency are aggregated, which involves reallocating and compressing the wavelet coefficients obtained from the wavelet transform. This process concentrates values at similar frequencies into the corresponding frequency bin, thereby reducing ambiguity in the scale direction and improving time–frequency resolution [25]. It mainly includes the following steps.
- (1)
- Wavelet transformation.
Apply the continuous wavelet transform to the signal x(t), defined as:
The family of functions is generated from the basic wavelet functions by translation and scaling as follows:
where is the scale parameterr, is the positioning parameter. is the normalization constant, ensuring energy conservation in the transformation process.
In the process of wavelet transform, choosing the scale factor as 32 or 64 is the optimal strategy. During the actual acquisition of engineering signals, the obtained signals often contain various types of noise and some other interfering factors. When the coefficient obtained from the wavelet transform , the corresponding calculation will be relatively unstable. Generally speaking, a threshold γ needs to be set to filter out this part of data, that is, by setting , the optimal threshold can be adaptively estimated.
where represents the total count of sampling points in the vibration signal; is the noise variance.
- (2)
- Synchronous compression.
The instantaneous frequency is determined by means of the wavelet coefficients obtained via wavelet transform.
Upon calculation using Equation (5), the time–scale plane can be transformed into the time–frequency plane . At this stage, the values within the interval surrounding any frequency can be compressed onto In this way, the value of the synchrosqueezing transform can be obtained, thereby serving the purpose of enhancing the time–frequency resolution. The synchrosqueezing transform can be formulated as:
where denotes the discrete scale, and represents the number of scales. When the signal is in a discrete state, the scale coordinate is defined as:
The frequency coordinate is defined as:
The synchrosqueezing wavelet transform is invertible, and its inverse transform can be formulated as:
where is a finite value, and is the conjugate Fourier transform of the fundamental wavelet function. The signal can be reconstructed without loss by means of Equation (9).
2.3. P2D-Sk-ResNet
The one-dimensional vibration signal of faulty bearings is simultaneously transformed into time–frequency domain representation and then input into a dual-path parallel residual network framework. In the standard convolutional neural network, the size of the convolutional kernel in each layer remains fixed. By contrast, the selective kernel network (SKNet) features a dynamic convolutional kernel selection mechanism [26]. This mechanism dynamically adjusts the receptive field size based on the multi-scale features of input data for each neuron. The cornerstone of the selective kernel network is the selective kernel convolution module. This module integrates information from multiple branches with different kernel sizes by leveraging softmax attention. It also employs an adaptive selection mechanism to make an adaptive choice regarding the size of the convolutional kernel.
In this study, the SKNet is incorporated to construct the SK-ResNet for the purpose of extracting features from time–frequency images. SK-ResNet can adaptively select convolution kernels of different scales for feature extraction. This not only expands the receptive field but also allows the model to acquire multi-scale feature information. As depicted in Figure 1, the SKNet principally encompasses three modules: Split, Fuse, and Select.
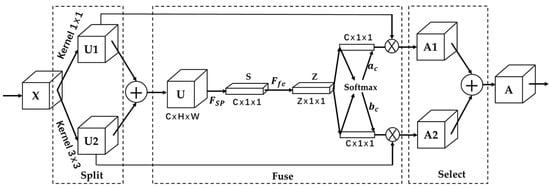
Figure 1.
Structure of SKNet.
(1) Separation operation. Feature extraction is carried out on the input STFT and SWT graph using convolution kernels of different sizes. To minimize the consumption of computing resources, this study selects two convolution kernels ( and ) to expand the receptive field. The features from the two parts are added and fused to obtain the feature , as specifically shown in Equation (11):
(2) Fusion operation. A global average pooling operation is performed on the fused feature to generate channel statistical information . The dimension is . represents the element of the channel , as specifically shown in Equation (12):
After operation , a compact feature is generated via a fully connected layer. The dimension of vector is , as explicitly shown in Equation (13):
where is the fully connected layer; is the ReLU; is the batch normalization layer; and is the operation matrix of the fully connected layer.
(3) Following the fully connected layer, is expanded into two vectors that have the same dimension as . Subsequently, the weights of each convolutional kernel are obtained through the Softmax operation.
where , where and are the data of the row , respectively. Here, and denote the weight values of two distinct convolutional kernels. Given that two convolutional kernels are chosen for weighting in this study, it holds that .
Perform a weighting operation on the weight values with and to obtain the fused feature map , as explicitly shown in Equation (15).
where and are the weights generated through the fusion of different convolutional kernels.
Residual networks represent a variant of convolutional neural network (CNN). By leveraging the skip-connection architecture, they can construct a deeper network architecture, effectively addressing the issues of gradient explosion and gradient vanishing that plague traditional CNN. To a certain degree, this also reduces the risk of overfitting. The structure of the residual blocks in the ResNet18 model is depicted in Figure 2.
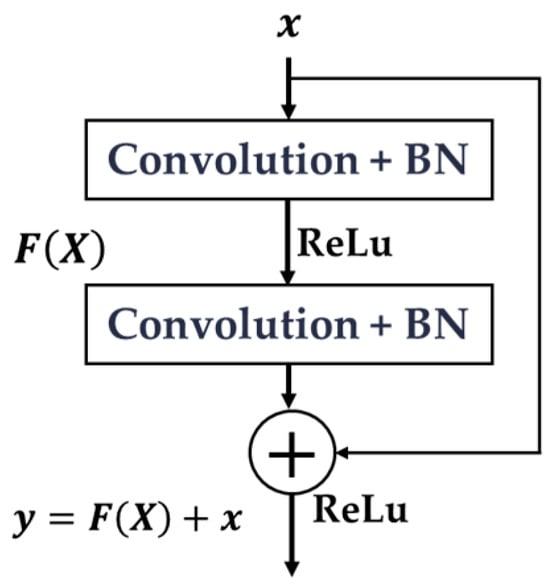
Figure 2.
Residual module.
Based on the foregoing analysis, this study aims to improve the ResNet model by integrating the SKNet module into the ResNet architecture. In the main body of the network, to prevent the introduction of excessive parameters and avoid model structure redundancy, the original residual structure is retained. After being processed by four residual blocks, the SKNet module is embedded for secondary enhancement. By adaptively adjusting the selection of convolutional kernels, this approach ensures that features at different scales can be effectively represented and exploited. Finally, the model performs global average pooling followed by a fully connected layer. The enhanced ResNet18 is presented in Figure 3.
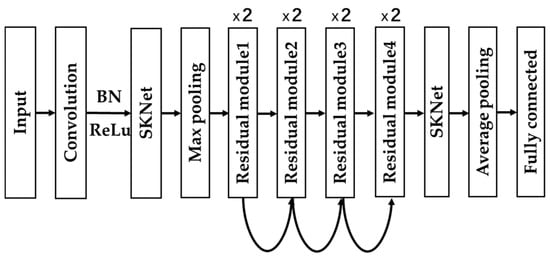
Figure 3.
SK-ResNet structure.
2.4. XGBoost
XGBoost is a tree-based ensemble learning algorithm widely used for its high predictive performance and regularization capabilities. It works by continuously adding new trees to fit the residuals in the data [27]. Specifically, each tree is constructed based on the residuals of the preceding tree. Each new tree endeavors to learn the areas where the previous tree falls short, thereby gradually enhancing the overall prediction accuracy.
The objective function is formulated as follows:
where is the value of the objective function at the th iteration. is the loss function of the th sample. indicates the maximum number of trees. refers to the tree complexity penalty term. The specific formulation for is as follows:
where represents the penalty coefficient of leaf nodes; denotes the number of leaf nodes; is the regularization penalty coefficient; and is the weight of leaf nodes.
XGBoost employs the gradient boosting approach to train the model. In each iteration round, the negative gradient of the loss function is computed. Subsequently, a new tree is utilized to fit these residuals. When training each individual tree, XGBoost endeavors to find the optimal splitting point with the aim of minimizing the objective function. This process entails computing the gain associated with each splitting point. The gain can be expressed by the following formula:
where and represent the cumulative gradients of the left and right child nodes, respectively; and denote the cumulative second-order derivatives of the left and right child nodes, respectively; is the weight of ; is the weight of the tree complexity penalty term.
3. Proposed Framework: STFT-SWT-P2D-Sk-ResNet-XGBoost
The overall architecture of the STFT-SWT-P2D-Sk-ResNet-XGBoost framework is illustrated in Figure 4, which outlines an end-to-end pipeline for intelligent fault diagnosis.
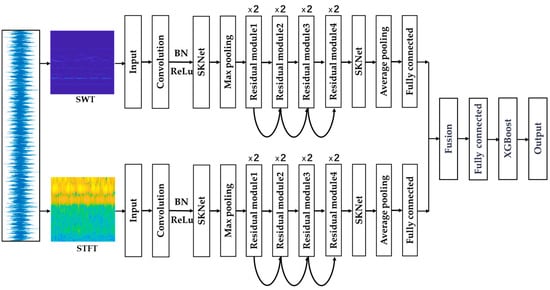
Figure 4.
The overall framework of the proposed STFT-SWT-P2D-Sk-ResNet-XGBoost.
The framework operates through four cohesive stages:
Stage 1: Signal input and dual-domain transformation.
The process begins with the raw one-dimensional vibration signal. This signal is simultaneously transformed into two distinct two-dimensional time–frequency representations (STFT and SWT). The dual-path transformation generates complementary inputs, providing the model with both a stable time–frequency distribution (STFT) and a sharpened, high-resolution time–frequency map (SWT).
Stage 2: Parallel feature extraction with P2D-Sk-ResNet.
The resulting STFT and SWT images are fed into two parallel branches of the P2D-Sk-ResNet module. Each branch is a dedicated feature extractor based on a ResNet architecture enhanced with selective kernel (SK) modules. Within each branch, the SK modules dynamically adjust the receptive field size, enabling the network to adaptively capture multi-scale fault feature. The residual learning blocks facilitate the training of this deep network by mitigating the vanishing gradient problem.
Stage 3: Feature fusion and compression.
High-level features extracted from the two parallel paths are then concatenated, effectively fusing the complementary information from the STFT and SWT domains. The fused feature set is then condensed through a fully connected layer to extract the most significant information, forming a compact feature vector.
Stage 4: Final classification with XGBoost.
The compact feature vector from the deep learning backbone is used as the input for the final classification. Instead of a traditional softmax layer, the XGBoost classifier is employed. XGBoost takes these discriminative features and constructs a powerful ensemble model to perform the ultimate fault type identification, leveraging its superior ability to handle complex, non-linear decision boundaries.
4. Experiments and Results Analysis
4.1. Experimental Dataset and Processing
The experimental dataset is sourced from Case Western Reserve University [28]. The bearing data from the drive end with a sampling frequency of 12 kHz was employed. To comprehensively evaluate the model’s performance, data from three different load conditions (0 hp, 1 hp, and 2 hp) were used. Detailed information for the 0 hp condition is shown in Table 1.

Table 1.
Description of the CWRU dataset (0 hp condition).
In this experiment, each continuous signal is segmented using a fixed-length sliding window. The window length is set to 1024 data points with a step size of 341. For each fault category and load condition, 1000 samples are obtained. Subsequently, these 1D samples are transformed into 2D images using both SWT and STFT. Datasets A0, A1, and A2 correspond to the sample sets under loads of 0, 1, and 2 hp, respectively. Each dataset (A0, A1, A2) contains 1000 STFT and 1000 SWT images for each of the 10 fault conditions, resulting in 20,000 images per dataset. The procedure for converting time-series data into images is illustrated in Figure 5. Herein, the red rectangle represents the current position of the sliding window, and the gray rectangle represents its historical positions along the time axis. Example SWT and STFT plots for various bearing conditions are shown in Figure 6 and Figure 7, respectively. The color mapping in both diagrams illustrates the signal’s energy distribution across time and frequency. In the SWT plot (Figure 6), areas of lower energy are depicted in dark blue, transitioning to light blue and white for higher energy. Similarly, in the STFT plot (Figure 7), lower energy density is shown in blue, and higher energy density is indicated by yellow, directly correlating with local signal strength.
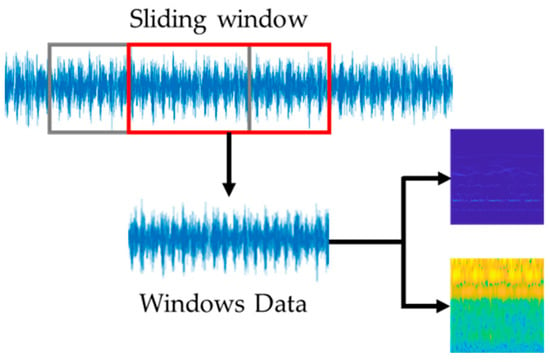
Figure 5.
The procedure for transforming time-series data into SWT and STFT.
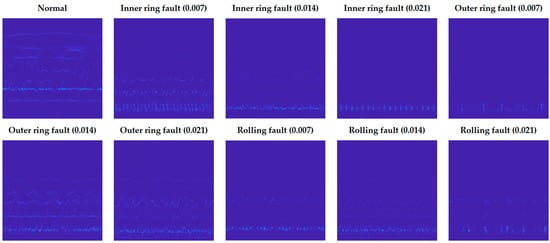
Figure 6.
Time–frequency representations generated by SWT for different bearing conditions.
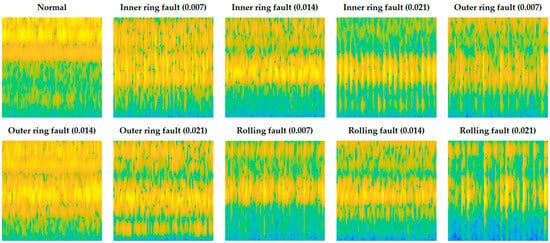
Figure 7.
Time–frequency representations generated by STFT for different bearing conditions.
4.2. Evaluation Metrics
The critical metrics including accuracy, precision, recall, and the F1-score are introduced, which are mathematically formulated in Equations (19)–(22).
TP (True positives) reflect situations in which the model successfully detects actual fault conditions, whereas TN (true negatives) correspond to non-fault cases that are correctly identified. FP (False positives) arise when the model mistakenly categorizes normal conditions as faulty, and FN (false negatives) occur when actual faults are incorrectly classified as normal. Collectively, these performance indicators offer a detailed assessment of the model’s classification capability, delivering key insights into its dependability, precision, and effectiveness in identifying bearing-related faults.
4.3. Model Training
The proposed model was implemented using the PyTorch (Meta, Menlo Park, CA, USA) 2.7.1 framework in Python. The hardware configuration included an Intel i7-9750H CPU (Intel Corporation, Santa Clara, CA, USA), an NVIDIA GTX-3060 GPU (NVIDIA Corporation, Santa Clara, CA, USA), and 16 GB RAM (Micron Technology, Inc., Boise, ID, USA). Dataset A0 (0 hp load) was partitioned into training and test sets using a stratified random split with a ratio of 8:2. The batch size was set to 64. The stochastic gradient descent (SGD) optimizer was used for parameter optimization with an initial learning rate of 0.00015. A learning rate scheduler was applied. The maximum number of training epochs was set to 100. To ensure statistical reliability, the experiment was repeated five times with different random seeds, and the final reported result is the average performance on the test set.
To validate the efficacy, this study carried out comparative analysis. It is important to note that the one-dimensional convolutional neural network (1DCNN) model necessitates one-dimensional data as input. The thorough assessment was carried out to evaluate the effectiveness. Figure 8 presents the training dynamics of the proposed and rival models. The comparative analysis was performed across various models based on the training behavior, highlighting the advantages of the proposed approach. The training accuracy metrics revealed that, at the beginning of training, all models demonstrated relatively low accuracy. As training advanced, the accuracy steadily increased. Throughout the training phase, each model exhibited a general upward trend in accuracy, although minor fluctuations or temporary declines were observed. In the final training epochs, all models except 1DCNN attained a high level of accuracy, surpassing 80%. Notably, the proposed model consistently maintained superior performance throughout the entire training period and demonstrated the best results in the later stages, achieving the highest accuracy among all models.
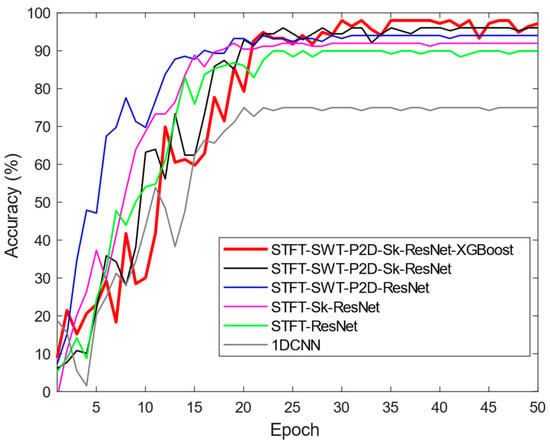
Figure 8.
Comparison of accuracy variations across models on the test set.
A comprehensive comparison of diagnostic performance and computational cost is detailed in Table 2. It is important to clarify the parameter counts reported for the models. The value of 23.61 M parameters for both the STFT-SWT-P2D-Sk-ResNet and STFT-SWT-P2D-Sk-ResNet-XGBoost models refer specifically to the parameters of the deep learning feature extraction backbone (P2D-Sk-ResNet). The final XGBoost classifier, which replaces the fully connected layer in the hybrid model, has a different parameterization based on the number and structure of its decision trees, which is not directly comparable to the count of weights in a neural network. The parameter count of the replaced fully connected layer is negligible compared to the deep backbone. Therefore, the reported parameter count effectively represents the complexity of the feature extraction architecture, which is identical for both models.

Table 2.
Performance and computational cost comparison of different models.
As expected, model complexity and computational demand increase with performance. The baseline 1DCNN has the fewest parameters (0.96 M) and shortest training time (4.01 s). The proposed STFT-SWT-P2D-Sk-ResNet-XGBoost model has the highest parameter count (23.61 M) and the longest training time (42.24 s), which is a direct consequence of its sophisticated dual-path architecture, SK modules, and XGBoost classifier.
However, a more nuanced analysis reveals that the performance gains significantly outweigh the associated computational costs. Crucially, the addition of the SK mechanism to create the STFT-SWT-P2D-Sk-ResNet model incurs only a minimal parameter increase (from 22.42 M to 23.61 M, a rise of approximately 5.3%) and a negligible extension in training time. This minor cost is justified by a substantial performance boost of 2.29 percentage points in accuracy (from 94.71% to 97.00%). This demonstrates that the SK mechanism efficiently enhances feature representation without introducing significant structural redundancy. Furthermore, replacing the standard softmax classifier with XGBoost in the final model results in a further accuracy improvement of 1.51 percentage points, while the training time increases by a mere 0.41 s. This demonstrates the exceptional efficiency of the XGBoost classifier. The 42.24 s training time for a model achieving 98.51% accuracy remains entirely feasible for an offline training process, establishing the proposed framework as a powerful and practical solution.
The confusion matrices for all compared models are shown in Figure 9. As depicted in Figure 9, varying color shades are employed to mirror the disparities in model performance. Dark regions signify that the model exhibits superior performance in the corresponding category, whereas light regions denote inferior performance. Leveraging the gradient distribution of colors, one can intuitively visualize the prediction accuracy and confusion scenarios of each model across diverse categories. It is evident that the 1DCNN model (a) exhibits significant feature aliasing. Models with 2D inputs (b–e) show progressively less aliasing. The proposed model (f) demonstrates the best inter-class separability and intra-class aggregation, with nearly all samples correctly classified along the diagonal, further validating its superiority.
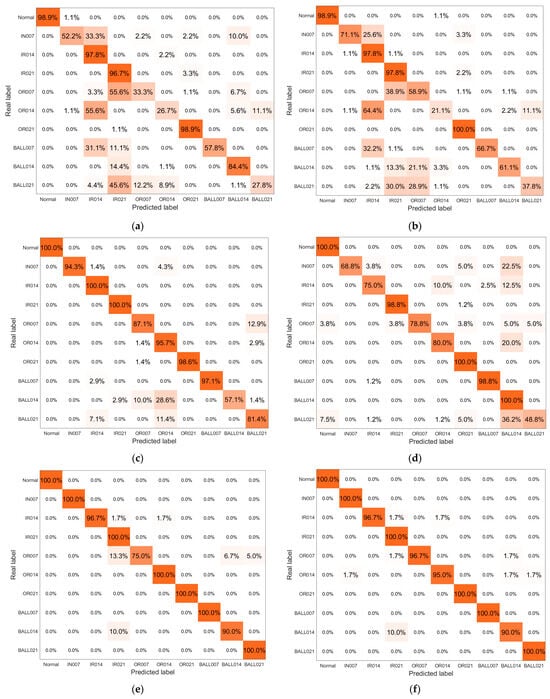
Figure 9.
The confusion matrix for the models, including 1DCNN (a), STFT-ResNet (b), STFT-Sk-ResNet (c), STFT-SWT-P2D-ResNet (d), STFT-SWT-P2D-Sk-ResNet (e) and STFT-SWT-P2D-Sk-ResNet-XGBoost (f).
To further validate the feature learning capability, t-SNE visualizations of the learned features are presented in Figure 10. Samples in (a) 1DCNN and (b) STFT-ResNet show significant overlap and dispersion. Models (c)–(f) show progressively better separation. The proposed model (f) achieves nearly complete separation of different categories while maintaining tight clustering within the same category, providing strong visual evidence of its superior feature learning and classification performance.

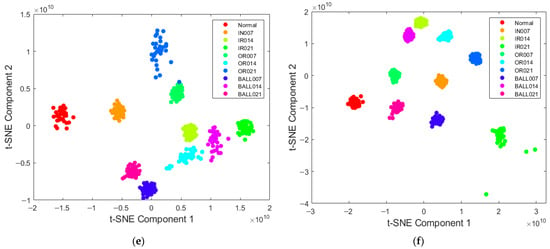
Figure 10.
The T-SNE image of the models, including 1DCNN (a), STFT-ResNet (b), STFT-Sk-ResNet (c), STFT-SWT-P2D-ResNet (d), STFT-SWT-P2D-Sk-ResNet (e) and STFT-SWT-P2D-Sk-ResNet-XGBoost (f).
4.4. Experimental Analysis Under Variable Load Conditions
To evaluate generalization capability under varying operational conditions, cross-domain experiments were conducted using datasets A0, A1, and A2 (0, 1, and 2 hp). As shown in Figure 11, the notation A0→A1 indicates training on A0 and testing on A1. AVG denotes the average accuracy across all variable-load scenarios.
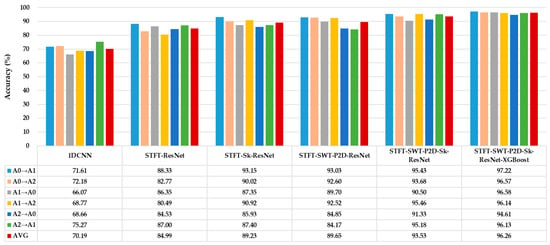
Figure 11.
The ability to accurately diagnose under varying load conditions.
The proposed method achieves an average diagnostic accuracy of 97.22% under these variable load conditions, with a minimal performance fluctuation (max–min difference of 2.61%), outperforming all rival models. This exceptional robustness can be attributed to the model’s inherent design, which effectively learns load-invariant features:
Dual-graph transformation as a robust feature extraction: The collaborative application of the STFT and SWT constructs a rich and complementary time–frequency feature space. By integrating the features extracted from these two transformations, the model can give prominence to these invariant morphological features rather than depending on the absolute frequency values that are influenced by the load. Consequently, it can sustain a high diagnostic accuracy under diverse operating conditions.
Adaptive feature refinement via the SK mechanism: The selective kernel (SK) mechanism is instrumental in enhancing model generalization. When presented with input signals from an unseen load condition which exhibits different energy distributions and noise profiles compared to the training data, the SK module dynamically recalibrates channel-wise responses and selectively emphasizes the most relevant multi-scale features for the target domain. This adaptability enables the model to suppress load-specific artifacts while amplifying features that are consistently discriminative across varying operating conditions, effectively functioning as an internal domain adaptation strategy.
Enhanced decision making with XGBoost: The XGBoost classifier further strengthens the model’s generalization capability. The deep features extracted by the P2D-Sk-ResNet backbone exhibit enhanced domain invariance due to the aforementioned mechanisms. Leveraging these robust representations, XGBoost constructs a highly non-linear yet well-regularized decision boundary that exhibits resilience to minor distributional shifts induced by load variations. Furthermore, its ensemble-based architecture and built-in structural regularization mitigate overfitting to spurious correlations present in the training data, thereby improving overall reliability and predictive consistency.
4.5. Experimental Analysis of Noise Resistance Capability
The anti-noise performance was investigated by adding Gaussian white noise with different signal-to-noise ratios (SNRs: −4, −2, 0, 4, 8 dB) to the original A1 dataset. The noisy data were transformed into images, and the dataset was split 8:2 for training and testing. For each SNR level, 20 repeated experiments were conducted, and the average accuracy was recorded. Figure 12 shows the average recognition accuracy of each network model under different SNR conditions.
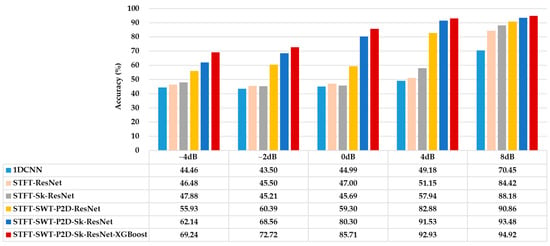
Figure 12.
The accuracy of the proposed and rival models under different SNR conditions.
The proposed model demonstrates superior noise robustness. This resilience stems from the synergistic integration of its core components:
Dual-graph transformation versus single-graph transformation: Models employing dual-graph transformation (STFT-SWT-P2D-ResNet) significantly outperform their single-graph counterparts (STFT-ResNet). This performance advantage originates from the complementary time–frequency representations provided by the STFT and SWT. STFT delivers consistent time–frequency resolution, while SWT enhances temporal and spectral localization via its synchrosqueezing procedure, making it particularly effective in characterizing non-stationary signal components. This complementarity introduces a form of information redundancy, which strengthens feature reliability. In a noisy environment, the model integrates the features of the two domains. This integration effectively mitigates the distortions induced by noise and simultaneously enhances the authentic fault-related patterns. In contrast, single-transformation models are more susceptible to domain-specific noise artifacts, compromising their generalization capability.
Selective kernel (SK) mechanism versus standard convolution: Models incorporating the SK mechanism (STFT-Sk-ResNet) consistently surpass standard convolutional architectures (STFT-ResNet). The SK mechanism operates as an adaptive, attention-driven feature selector at the kernel level, enabling dynamic selection of optimal receptive fields. In practical operating environments with varying noise levels, fault signatures manifest across multiple scales ranging from transient high-frequency impulses to broader spectral modulations. The SK module adaptively recalibrates multi-scale feature responses, allowing the network to prioritize the most discriminative and noise-invariant features in real time. This dynamic adaptation mitigates overreliance on noise-sensitive scales, thereby enhancing feature selectivity and classification stability under adverse conditions.
XGBoost classifier versus standard fully connected layers: The integration of the XGBoost classifier consistently improves the model’s resistance to noise. Although deep learning backbones extract high-dimensional and complex features, these representations may still contain redundant or noise-correlated components. As a powerful ensemble learning framework, XGBoost excels in constructing highly non-linear yet well-regularized decision boundaries. XGBoost can selectively accentuate the most informative features, and simultaneously perform down-weighting processing on irrelevant or noise—containing features. This intrinsic resistance to overfitting complements the hierarchical feature abstraction process of the deep network, resulting in a more reliable and generalizable classification outcome.
5. Conclusions
This study proposed an intelligent fault diagnosis framework termed STFT-SWT-P2D-Sk-ResNet-XGBoost. Experimental results on the CWRU dataset demonstrate that the proposed model achieves a test accuracy of 98.51% under constant load conditions, representing significant improvements over baseline models. More importantly, the model exhibits superior robustness under noisy conditions and exceptional generalization capability across varying load conditions. The key conclusions are as follows:
The dual-graph transformation (STFT and SWT) establishes a robust and complementary feature foundation. STFT provides stable time–frequency resolution, while SWT offers enhanced localization. Their fusion mitigates ambiguities present in single-transform methods, forming a critical step for extracting comprehensive and noise-resistant features.
The P2D-Sk-ResNet framework enables adaptive, multi-scale feature extraction. Its parallel architecture processes complementary time–frequency inputs, while the embedded SK mechanism dynamically adjusts receptive fields, allowing the model to emphasize the most salient features for different faults and noise levels, significantly improving diagnostic accuracy in complex environments.
The XGBoost classifier acts as a powerful and reliable decision engine. By leveraging a gradient boosting ensemble with intrinsic regularization, it constructs highly non-linear yet robust decision boundaries from the deep features, delivering superior generalization and stability compared to traditional softmax classifiers.
In summary, the superiority of the proposed model originates from a cohesive, purpose-driven architecture: the dual-graph input ensures a rich feature space, the SK-enhanced network enables adaptive feature learning, and the XGBoost classifier delivers robust final decisions. This hierarchical synergy effectively isolates fault-related features from noise and operational variability, offering a highly reliable and practical solution for intelligent fault diagnosis in real-world industrial applications.
Author Contributions
Conceptualization, Z.J.; methodology, L.Q.; software, H.Y.; validation, L.Q. and Y.C.; formal analysis, G.W.; investigation, G.W.; resources, H.Y.; data curation, Y.C.; writing—original draft preparation, L.Q.; writing—review and editing, F.Z.; visualization, Z.X.; supervision, Y.Y.; project administration, Z.J.; funding acquisition, Z.J. All authors have read and agreed to the published version of the manuscript.
Funding
This research was funded by the Science and Technology Planning Project of Chengde City (202404B019) and the Major Research and Development Project of Hebei Province (19211601D).
Data Availability Statement
The experimental dataset was obtained from the publicly available bearing fault dataset provided by Case Western Reserve University.
Conflicts of Interest
Author Fengjun Zhang was employed by the company Chengde Safety Production Technology Service Center. The remaining authors declare that the research was conducted in the absence of any commercial or financial relationships that could be construed as a potential conflict of interest.
References
- Rai, A.; Upadhyay, S.H. A review on signal processing techniques utilized in the fault diagnosis of rolling element bearings. Tribol. Int. 2016, 96, 289–306. [Google Scholar] [CrossRef]
- Siddique, M.F.; Saleem, F.; Umar, M.; Kim, C.H.; Kim, J.-M. A Hybrid Deep Learning Approach for Bearing Fault Diagnosis Using Continuous Wavelet Transform and Attention-Enhanced Spatiotemporal Feature Extraction. Sensors 2025, 25, 2712. [Google Scholar] [CrossRef]
- Saleem, F.; Ahmad, Z.; Siddique, M.F.; Umar, M.; Kim, J.-M. Acoustic Emission-Based Pipeline Leak Detection and Size Identification Using a Customized One-Dimensional DenseNet. Sensors 2025, 25, 1112. [Google Scholar] [CrossRef]
- He, M.; He, D. Deep Learning Based Approach for Bearing Fault Diagnosis. IEEE Trans. Ind. Appl. 2017, 53, 3057–3065. [Google Scholar] [CrossRef]
- Xue, Y.; Wen, C.; Wang, Z.; Liu, W.; Chen, G. A novel framework for motor bearing fault diagnosis based on multi-transformation domain and multi-source data. Knowl. Based Syst. 2024, 283, 111205. [Google Scholar] [CrossRef]
- Zhang, W.; Li, C.; Peng, G.; Chen, Y.; Zhang, Z. A deep convolutional neural network with new training methods for bearing fault diagnosis under noisy environment and different working load. Mech. Syst. Signal Process. 2018, 100, 439–453. [Google Scholar] [CrossRef]
- Gao, X.; Wei, H.; Li, T.; Yang, G. A rolling bearing fault diagnosis method based on LSSVM. Adv. Mech. Eng. 2020, 12, 1687814019899561. [Google Scholar] [CrossRef]
- Chae, S.G.; Yun, G.H.; Park, J.C.; Jang, H.S. Adaptive Structured Latent Space Learning via Component-Aware Triplet Convolutional Autoencoder for Fault Diagnosis in Ship Oil Purifiers. Processes 2025, 13, 3012. [Google Scholar] [CrossRef]
- Zhao, B.; Zhang, X.; Zhan, Z.; Pang, S. Deep multi-scale convolutional transfer learning network: A novel method for intelligent fault diagnosis of rolling bearings under variable working conditions and domains. Neurocomputing 2020, 407, 24–38. [Google Scholar] [CrossRef]
- Dao, F.; Zeng, Y.; Qian, J. Fault diagnosis of hydro-turbine via the incorporation of Bayesian algorithm optimized CNN-LSTM neural network. Energy 2024, 290, 130326. [Google Scholar] [CrossRef]
- He, K.; Zhang, X.; Ren, S.; Sun, J. Deep Residual Learning for Image Recognition. In Proceedings of the 2016 IEEE Conference on Computer Vision and Pattern Recognition (CVPR), Las Vegas, NV, USA, 27–30 June 2016; pp. 770–778. [Google Scholar] [CrossRef]
- Zhang, K.; Tang, B.; Deng, L.; Liu, X. A hybrid attention improved ResNet based fault diagnosis method of wind turbines gearbox. Measurement 2021, 179, 109491. [Google Scholar] [CrossRef]
- Yan, J.; Zhu, X.; Wang, X.; Zhang, D. A New Fault Diagnosis Method for Rolling Bearings with the Basis of Swin Transformer and Generalized S Transform. Mathematics 2025, 13, 45. [Google Scholar] [CrossRef]
- Zhai, Z.; Luo, L.; Chen, Y.; Zhang, X. Rolling Bearing Fault Diagnosis Based on a Synchrosqueezing Wavelet Transform and a Transfer Residual Convolutional Neural Network. Sensors 2025, 25, 325. [Google Scholar] [CrossRef]
- Qu, J.L.; Yu, L.; Yuan, T.; Tian, Y.P. Adaptive fault diagnosis algorithm for rolling bearings based on one-dimensional convolutional neural network. Chin. J. Sci. Instrum. 2018, 39, 134–143. [Google Scholar] [CrossRef]
- Chen, P.; Li, Y.; Wang, K.; Zou, M.J. An automatic speed adaption neural network model for planetary gearbox fault diagnosis. Measurement 2021, 171, 108784. [Google Scholar] [CrossRef]
- Huang, K.; Zhu, L.; Ren, Z.; Lin, T.; Zeng, L.; Wan, J.; Zhu, Y. An Improved Fault Diagnosis Method for Rolling Bearings Based on 1D_CNN Considering Noise and Working Condition Interference. Machines 2024, 12, 383. [Google Scholar] [CrossRef]
- Qin, G.H.; Zhang, K.; Ding, K.; Huang, F.F.; Zheng, Q.; Ding, G.F. Bearing fault diagnosis using dynamic wide convolutional residual networks. China Mech. Eng. 2023, 34, 2212–2221. [Google Scholar]
- Yuan, J.H.; Han, T.; Tang, J.; An, L.Z. An Approach to Intelligent Fault Diagnosis of Rolling Bearing Using Wavelet Time-Frequency Representations and CNN. Mach. Des. Res. 2017, 33, 93–97. [Google Scholar] [CrossRef]
- Wen, L.; Li, X.Y.; Gao, L.; Zhang, Y.Y. A New Convolutional Neural Network-Based Data-Driven Fault Diagnosis Method. IEEE Trans. Ind. Electron. 2017, 65, 5990–5998. [Google Scholar] [CrossRef]
- Tong, Y.; Pang, X.Y.; Wei, Z.H. A GADF-CNN based rolling bearing fault diagnosis method. J. Vib. Shock 2021, 40, 247–253. [Google Scholar] [CrossRef]
- Zhao, Z.H.; Li, C.X.; Dou, G.J.; Yang, S.P. Research on bearing fault diagnosis based on MTF-CNN. J. Vib. Shock 2023, 42, 126–131. [Google Scholar] [CrossRef]
- Duan, X.Y.; Jiao, M.X.; Lei, C.L.; Li, J.H. A rolling bearing fault diagnosis method based on MTF-MSMCNN with small sample. J. Aerosp. Power 2024, 39, 20230517. [Google Scholar] [CrossRef]
- Li, H.; Zhang, Q.; Qin, X.R.; Sun, Y.T. Fault diagnosis method for rolling bearings based on short-time Fourier transform and convolution neural network. J. Vib. Shock. 2018, 37, 124–131. [Google Scholar] [CrossRef]
- Liang, P.; Wang, W.; Yuan, X.; Liu, S.; Zhang, L.; Cheng, Y. Intelligent fault diagnosis of rolling bearing based on wavelet transform and improved ResNet under noisy labels and environment. Eng. Appl. Artif. Intell. 2022, 115, 105269. [Google Scholar] [CrossRef]
- Li, Z.; Hu, F.; Wang, C.; Deng, W.; Zhang, Q. Selective kernel networks for weakly supervised relation extraction. CAAI Trans. Intell. Technol. 2021, 6, 224–234. [Google Scholar] [CrossRef]
- Gu, M.; Kang, S.; Xu, Z.; Lin, L.; Zhang, Z. AE-XGBoost: A Novel Approach for Machine Tool Machining Size Prediction Combining XGBoost, AE and SHAP. Mathematics 2025, 13, 835. [Google Scholar] [CrossRef]
- Bearing Data Center|Case School of Engineering|Case Western Reserve University. Available online: https://engineering.case.edu/bearingdatacenter (accessed on 1 July 2025).
Disclaimer/Publisher’s Note: The statements, opinions and data contained in all publications are solely those of the individual author(s) and contributor(s) and not of MDPI and/or the editor(s). MDPI and/or the editor(s) disclaim responsibility for any injury to people or property resulting from any ideas, methods, instructions or products referred to in the content. |
© 2025 by the authors. Licensee MDPI, Basel, Switzerland. This article is an open access article distributed under the terms and conditions of the Creative Commons Attribution (CC BY) license (https://creativecommons.org/licenses/by/4.0/).