Abstract
This study investigates the determinants of service demand in the packaging and printing industry, identifying 19 key factors through expert evaluation. These factors were analyzed using the Importance–Satisfaction (I–S) Model to pinpoint areas requiring enhancement, with four elements classified within the improvement zone. Considering resource constraints, improvement priorities were established through a modified Risk Priority Number (RPN) framework derived from Failure Modes and Effects Analysis (FMEA), expressed as RPN = I × F × E. The highest-priority areas for improvement included product pricing, flexibility in meeting customer requirements, suppliers’ emergency response capabilities, and proactive communication regarding raw material price fluctuations. The findings indicate that consumers balance price against sustainability value, highlighting the necessity of setting prices that align with perceived value to sustain trust and meet expectations. Strengthening firms’ emergency response mechanisms and developing an online standard operating procedure (SOP) notification system for raw material price changes can enhance communication efficiency, increase transparency in pricing, and ultimately improve organizational competitiveness.
1. Introduction
In recent years, the global packaging and printing market has experienced significant growth and transformation, playing a critical role in brand building, product identification, and consumer engagement. This market has expanded steadily, driven primarily by increasing consumer demand, product innovation, and evolving market dynamics. The global packaging and printing market reached a value of USD 367.1 billion in 2022 and is projected to grow to USD 507.0 billion by 2030, with a compound annual growth rate (CAGR) of 4.3% from 2023 to 2030. With the rapid advancement of digital technologies and the profound influence of electronic and digital media formats, the current landscape of the printing industry differs substantially from the past. Consumer demand for printing is no longer homogeneous, prompting the industry to adopt new operational models. Nevertheless, as technology continues to evolve in response to changing temporal and environmental contexts, enterprises must consistently pursue innovation and transformation to strengthen their competitive advantage [1].
Packaging plays a vital role in contemporary industrial and cultural production. Through its design and esthetic expression, it contributes to product differentiation and reflects the integration of technology, creativity, and cultural values [2,3]. Evolving beyond utilitarian functions, packaging printing has become a medium of visual communication that embodies corporate philosophy and design innovation. Effective packaging enhances user experience and conveys information that shapes perception and emotional engagement [4,5]. Driven by the growing demand for uniqueness and personalization, the packaging and printing industry is rapidly advancing toward customization. The adoption of digital printing technologies enables small-batch and flexible production, improving efficiency and expanding creative possibilities. Packaging printing is therefore not only an industrial process but also an art form and a cultural expression that integrates esthetics, functionality, and sustainability. According to Round Table Creative Printing Co., Ltd. (Saint John, NB, Canada) [6], the key contemporary functions of packaging emphasize (1) sustainable and environmentally responsible design, (2) material innovation, (3) visual and cultural communication, and (4) the integration of creativity with technology.
Customer satisfaction is derived from consumers’ post-purchase evaluations, in which they compare the costs incurred at the time of purchase with the benefits experienced thereafter. This emotional response—whether pleasure or disappointment—emerges from the discrepancy between consumers’ prior expectations and their actual perceptions of product performance [7,8]. Previous research has indicated that the degree of expectation and post-purchase perception jointly shape satisfaction, and that the elements involved in such evaluations are multidimensional. Consequently, customer satisfaction is influenced by a variety of service quality factors [9]. Moreover, quality is neither defined subjectively by providers nor determined by a single customer; rather, it is assessed collectively by all customers [10]. Therefore, identifying customer needs is of critical importance. To assess and improve quality, organizations often adopt managerial frameworks. Among these, Martilla and James [11] introduced the Importance–Performance Analysis (IPA) model, which has since inspired numerous refinements. For instance, Yang [12] proposed the Importance–Satisfaction Model (I–S Model), which has been widely applied across industries to identify areas for improvement and strengthen competitive advantage. Given limited organizational resources, such models enable firms to establish priorities for service quality enhancement.
In addition, Failure Mode and Effects Analysis (FMEA) has emerged as a proactive risk assessment approach that identifies, ranks, and mitigates potential failure modes before they occur. It has been widely utilized across industries to enhance reliability and ensure operational safety [13], and applied to examine how failure modes influence product and service performance [14]. In the present study, FMEA is employed in conjunction with the I–S Model to prioritize improvement actions, ensuring that organizational resources are allocated strategically to areas most in need of enhancement. Conveying product quality, brand image, brand positioning, and unique brand benefits to target consumers is essential for stimulating purchase motivation and cultivating brand loyalty. These considerations are particularly critical in packaging design. This study is organized into five sections. Section 1 describes the research background and significance. Section 2 provides an overview of the packaging design industry and the theoretical foundations of the I–S model and FMEA. Section 3 details the questionnaire design and target respondents. Section 4 presents the empirical results from the application of the I–S model and FMEA. Finally, Section 5 discusses the research conclusions and directions for future studies. Against this backdrop, this study focuses on the packaging design of a paper industry product as a case study, with the aim of identifying critical attributes, determining improvement priorities, and providing managerial insights. The objectives of this study are threefold:
- To identify the key manufacturing factors in the paper packaging design industry through literature review and in-depth interviews.
- To determine the priority of improvement items in the case study using the Importance–Satisfaction Model (I–S Model) and Failure Mode and Effects Analysis (FMEA).
- To propose specific recommendations based on the findings, thereby offering managerial and operational insights for the paper packaging design industry.
2. Literature Review
2.1. Overview of the Packaging Design Industry
The packaging and printing industry in Taiwan has a long and distinguished history, evolving from manual operations in its formative years to today’s highly automated and high-speed production systems. Over time, this industry has experienced profound transformations that have not only advanced manufacturing technologies but also influenced the patterns of everyday life [6]. Its developmental trajectory can be summarized as follows:
- ➢
- Early development: Initially, printing processes were primarily manual and served mainly the production of books and newspapers. With gradual technological progress, the industry transitioned toward mechanized and automated systems.
- ➢
- Technological advancements: The evolution from traditional letterpress printing to modern digital technologies has substantially improved production efficiency, print precision, and cost-effectiveness. Each wave of innovation has contributed to higher productivity and better-quality control.
- ➢
- Environmental considerations: In response to growing awareness of environmental sustainability, numerous packaging and printing enterprises have adopted eco-friendly printing methods, including the use of recyclable materials and green production technologies.
- ➢
- Future trends: The future trajectory of the industry is anticipated to focus increasingly on personalization and customization, in alignment with evolving consumer preferences for distinctive and individualized products.
- ➢
- Taiwan’s global position: Taiwan occupies a competitive position in the global packaging and printing sector, driven by its advanced printing technologies, innovative design capabilities, and distinctive cultural esthetics that have garnered international recognition.
Packaging design constitutes a pivotal component in product presentation and user perception. Beyond its functional attributes, it embodies esthetic values, cultural expression, and technological innovation. Well-conceived design conveys essential product information, enhances usability, and elevates the overall consumer experience. Prior studies emphasize that systematically presenting design principles in an accessible manner enables consumers and practitioners alike to better comprehend the fundamental aspects of packaging design [15]. The key considerations in this process can be summarized as follows:
- ➢
- Clarifying product attributes: The initial step in packaging design involves a comprehensive examination of the product to delineate its core characteristics and functional purpose.
- ➢
- Identifying target users: Understanding the demographic and psychographic profiles of end users is essential for achieving an optimal balance between functionality and esthetic appeal.
- ➢
- Selecting appropriate materials: Material selection critically influences not only visual and tactile qualities but also durability, sustainability, and recyclability.
- ➢
- Considering production costs: As packaging directly affects overall production expenditure, cost assessment should be integrated into the early stages of design planning.
- ➢
- Ensuring production compatibility: The selected packaging materials and design specifications must align with existing manufacturing systems to ensure operational efficiency and minimize labor intensity.
- ➢
- Adopting sustainable design principles: Increasing global emphasis on environmental responsibility necessitates the adoption of green packaging materials and low-impact production methods consistent with circular economy principles.
- ➢
- Developing creative design concepts: After fundamental parameters are established, creative exploration and stylistic development can further enhance distinctiveness and cultural resonance.
- ➢
- Evaluating manufacturing partners: Upon completion of the design phase, selecting qualified and technically compatible manufacturers becomes critical, as complex or large-scale projects often require specialized expertise.
Recent evidence also indicates that the printing industry is undergoing a significant transformation in response to technological advancements and the proliferation of mobile and digital media formats. Traditional industry models are giving way to hybrid operations that combine printing technologies with digital services. This transition emphasizes consumer-centric approaches, including online business models, niche printing, large-scale customization, and specialized services, thereby moving toward a service-integrated operational paradigm [16].
2.2. Importance–Satisfaction Model (I–S Model)
A variety of frameworks exist for evaluating service quality, and an effective tool is one that identifies improvement priorities to enhance competitive advantage. The Importance–Satisfaction Model (I–S Model) is designed to help organizations identify service attributes that require urgent improvement. Traditional surveys often focus solely on satisfaction, neglecting the assessment of importance. Both importance and satisfaction must be measured concurrently to identify service attributes that are highly important to customers but receive low satisfaction ratings [17]. The concepts of importance and satisfaction are distinct. Importance measures the perceived significance of service elements from the customer’s perspective, whereas satisfaction reflects the degree to which the organization meets expectations. Importance analysis guides resource allocation and management strategy prioritization, while satisfaction analysis informs quality improvement priorities. The I–S Model integrates these two analyses, enabling organizations to examine the gap between importance and satisfaction and develop targeted improvement strategies.
The I–S Model builds upon the Importance–Performance Analysis (IPA) framework proposed by Martilla and James [11]. In this model, the concept of “performance” is replaced with “satisfaction,” which is more readily measurable [18]. Yang [12] further refined the I–S Model to support service strategy decisions, allowing firms to make informed managerial choices. Respondents rate both the importance and satisfaction of each survey item, which are then plotted on a two-dimensional matrix: importance on the X-axis and satisfaction on the Y-axis. The matrix is divided into four regions (Figure 1):
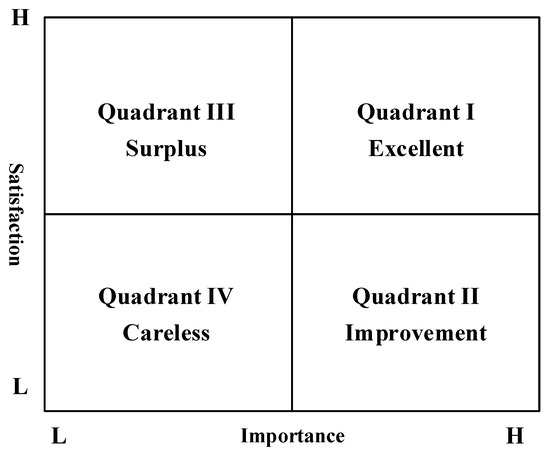
Figure 1.
Importance-Satisfaction Model. Source: Adapted from Yang (2003) [12].
The Importance–Satisfaction (I–S) Model categorizes customer requirements into four quadrants to facilitate strategic prioritization of service improvement efforts.
- ➢
- Quadrant I: Excellent Area—This quadrant represents attributes characterized by high importance and high satisfaction. Customer requirements in this category are both critical and well-fulfilled, indicating that current performance effectively meets expectations. These attributes should be continuously maintained and periodically reviewed to ensure sustained excellence and competitiveness.
- ➢
- Quadrant II: Improvement Area—This quadrant comprises attributes of high importance but low satisfaction. Customer requirements in this area are essential to customers; however, their current performance fails to meet expectations. Immediate attention and resource allocation are required to enhance these attributes, as improvements here have the greatest potential to increase overall customer satisfaction and loyalty.
- ➢
- Quadrant III: Surplus Area—Attributes in this quadrant demonstrate low importance but high satisfaction. Although customers express satisfaction with these requirements, they are not considered crucial to the purchase decision or overall service perception. Hence, if resource constraints exist, investment in these areas may be reduced without significantly affecting customer satisfaction.
- ➢
- Quadrant IV: Care-free Area—This quadrant includes attributes with both low importance and low satisfaction. Since these requirements are neither valued by customers nor contribute meaningfully to perceived service quality, they may be deprioritized or even omitted from improvement initiatives to optimize resource utilization.
Attributes in the Improvement Area indicate elements that are highly important to consumers but currently underperform. Organizations can prioritize these areas for improvement to better satisfy customer needs and optimize resource allocation [17,19].
2.3. Failure Mode and Effects Analysis (FMEA)
Failure Mode and Effects Analysis (FMEA) is a widely used proactive risk assessment tool. Its main objectives are to prevent potential failures, reduce the impact of system failures on products, and improve product quality and competitiveness [20]. FMEA systematically identifies potential failure modes within a system, evaluates their causes, and classifies them according to Severity (S), Occurrence (O), and Detection (D). By quantifying the risk associated with each failure mode, preventive measures can be developed to mitigate potential damage [21,22]. FMEA assesses current operational systems, reviewing processes, subsystems, and functional requirements. Teams identify potential failure modes caused by process flaws, environmental factors, human errors, or equipment limitations, and evaluate their potential impacts [23]. The Risk Priority Number (RPN) is calculated to rank failure modes and guide improvement actions [24,25]:
where
RPN = O × S × D
O = likelihood of occurrence
S = severity of failure
D = detectability of the failure
Traditional FMEA uses a 1–10 scoring system for each factor (Table 1). Higher RPN values indicate higher risk, enabling organizations to prioritize interventions and allocate limited resources effectively. Based on the RPN, risk coefficients (r) can be derived to support decision-making for corrective actions [26].

Table 1.
Risk coefficient table.
The application of FMEA has been widely adopted not only in industries such as defense, aerospace, automotive, shipbuilding, electronics, and semiconductors for design and process improvement, but also increasingly extended to service industries. By implementing FMEA, organizations can identify weaknesses in their designs, address inappropriate elements, and establish preventive measures to avoid potential failures, thereby enhancing product reliability [25]. In this study, the I–S Model and FMEA are combined to provide a comprehensive methodology for identifying and prioritizing improvement areas in packaging design. The I–S Model identifies attributes that are highly important to customers but receive low satisfaction scores, while FMEA quantifies the risk of failure associated with these attributes through RPN calculation. By integrating these two approaches, organizations can:
- ➢
- Pinpoint critical service or product attributes that significantly influence customer satisfaction.
- ➢
- Assess potential failure modes, their causes, and impacts on performance.
- ➢
- Prioritize improvement actions based on both customer importance–satisfaction gaps and risk levels indicated by RPN values.
- ➢
- Allocate resources efficiently to address high-priority issues, thereby enhancing product quality, customer satisfaction, and overall competitiveness.
This combined framework ensures that decision-making is both customer-centric and risk-aware, providing a structured approach to improving packaging design and service quality in highly competitive industries.
3. Methodology
3.1. Questionnaire Design
The evaluation of product attributes is determined by consumers, as these attributes define the quality of a product. Therefore, the literature data are collected as a foundation, supplemented by customer interviews to identify industry-specific attributes [17]. Previous studies have also incorporated the Delphi method to gather comprehensive product attributes from experts’ perspectives [27]. The diversification of visual packaging design techniques has elevated packaging design to a professional design discipline. Previous studies indicate that packaging provides consumers with design-related benefits, including esthetic appeal, originality, informativeness, identifiability, visibility, memorability, systematization, cultural relevance, symbolism, protection, convenience, environmental friendliness, and display ability, totaling 13 design benefits, which have been shown to influence brand equity [28]. The questionnaire in this study was designed for a packaging design company in the paper industry, aiming to investigate the pre-purchase importance of product attributes and post-service satisfaction (Appendix A, Table A1). Due to the limited number of existing studies in this industry, there were few references available for defining product attributes. Therefore, the Delphi method was employed to determine the questionnaire elements. The preliminary questionnaire was compiled from relevant literature across other industries. Furthermore, multiple consumers who had purchased the products were interviewed, and discussions were conducted with two industry experts and scholars to validate the key product attributes specific to the paper packaging industry. All identified product attributes were incorporated into the Importance–Satisfaction Model (I–S Model). Consequently, both pre-purchase importance and post-service satisfaction surveys were conducted as detailed below:
- Pre-purchase importance survey
Consumers were asked to evaluate the importance of all product attributes offered by the paper packaging design company using a 5-point Likert scale, where 5 = Very Important, 3 = Neutral, and 1 = Very Unimportant. The total scores were averaged, with higher scores indicating greater perceived importance.
- 2.
- Post-service satisfaction survey
Consumers assessed their satisfaction with all product attributes after utilizing the company’s services, also using a 5-point Likert scale, where 5 = Very Satisfied, 3 = Neutral, and 1 = Very Dissatisfied. The average scores reflected the overall satisfaction level, with higher scores indicating greater satisfaction.
3.2. Research Participants and Sampling
The target population for this study consisted of consumers of the paper packaging design company. A questionnaire survey method was employed to collect data. Random purposive sampling was used to distribute the questionnaires, and data collection was conducted between December 2024 and January 2025.
4. Empirical Analysis
This section presents the empirical analysis of the study, including descriptive statistics of demographic data, descriptive analysis of product attribute importance and satisfaction, implementation of the Importance–Satisfaction (I–S) Model, application of the modified Failure Mode and Effects Analysis (FMEA) method, and managerial implications.
4.1. Descriptive Analysis of Demographic Data
The study employed purposive sampling to distribute questionnaires to customers who had previously purchased products from the target paper packaging design company. A total of 172 valid responses were collected via Google Forms. The demographic characteristics of the respondents are summarized in Table 2.
Table 2.
Respondents’ demographic characteristics.
Gender: 66 respondents (38.37%) were male, and 106 respondents (61.63%) were female, with females comprising the majority.
Marital Status: 42 respondents (24.42%) were unmarried, and 130 respondents (75.58%) were married.
Age: 18 respondents (10.47%) were under 30 years old, 23 respondents (13.37%) were 31–40 years old, 32 respondents (18.6%) were 41–50 years old, 62 respondents (36.05%) were 51–60 years old, and 37 respondents (21.51%) were over 60 years old. The largest group was 51–60 years old, and the smallest group was under 30 years old.
Education Level: 41 respondents (23.84%) had a high school education or below, 83 respondents (48.26%) held a bachelor’s degree, and 48 respondents (27.91%) had a master’s degree or higher, with a majority holding a bachelor’s degree.
Occupation: Respondents were employed in the public sector (12.21%), service industry (38.37%), technology sector (15.7%), food and beverage industry (22.67%), and other sectors (11.05%). The service industry comprised the largest group.
4.2. Descriptive Analysis of Product Attribute Importance and Satisfaction
The study analyzed the average scores of 19 product attributes, as presented in Table 3. These data were subsequently used to construct the Importance–Satisfaction (I–S) Model, illustrated in Figure 2, to evaluate areas of strength and improvement.
Table 3.
Data on the importance and satisfaction of product attributes.
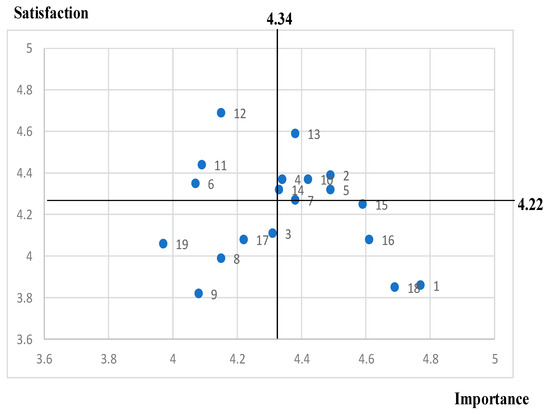
Figure 2.
Importance-Satisfaction Model of case study.
4.3. Implementation of the Importance–Satisfaction (I–S) Model
All values were plotted into the I–S Model, with an overall mean importance of 4.34 and mean satisfaction of 4.22 (Figure 2). The results are as follows:
Excellent Area: 7 manufacturing attributes:
- ➢
- No. 2 Product design
- ➢
- No. 4 Product appearance
- ➢
- No. 5 Product quality
- ➢
- No. 7 Product durability/load-bearing capacity
- ➢
- No. 10 Employees’ service attitude
- ➢
- No. 13 Punctuality of delivery
- ➢
- No. 14 Convenience of payment
To Be Improved Area: 4 manufacturing attributes:
- ➢
- No. 1 Product price
- ➢
- No. 15 Vendor’s emergency response capability
- ➢
- No. 16 Flexibility in adjusting to customer needs
- ➢
- No. 18 Proactive notification of raw material price fluctuations
Surplus Area: 3 manufacturing attributes:
- ➢
- No. 6 Product Material
- ➢
- No. 11 Company Reputation
- ➢
- No. 12 After-sales Service
Carefree Area: 5 manufacturing attributes:
- ➢
- No. 3 Product functionality
- ➢
- No. 8 Product compliance with energy-saving and carbon-reduction standards
- ➢
- No. 9 Product compliance with environmental awareness
- ➢
- No. 17 Professionalism of sales staff
- ➢
- No. 19 Proactive communication of market trends by sales staff
The study focused on the four attributes in the “To Be Improved” area, which pose potential operational risks or deficiencies. These attributes were evaluated by experts to determine their Risk Priority Number (RPN) and prioritize improvements using the FMEA method.
4.4. Application of the FMEA Method
Given the limited resources of enterprises, not all improvement items can be addressed simultaneously. Thus, prioritization is necessary [17]. The four attributes requiring improvement are
No. 1 Product price
No. 15 Vendor’s emergency response capability
No. 16 Flexibility in adjusting to customer needs
No. 18 Proactive notification of raw material price fluctuations
The FMEA method was applied to rank these items based on their RPN, enabling the identification of aspects causing customer dissatisfaction and providing preventive measures to enhance product quality and customer satisfaction. Experts assessed the Severity (S), Occurrence (O), and Detection (D) of each attribute, with the following formula used to calculate RPN.
For this study, the FMEA RPN parameters were modified as follows:
where
RPN = I × F × E.
I: Importance of the product attribute
F: Frequency of occurrence
E: Effect on the enterprise
The three parameters were quantified on a 1–10 scale, similar to the traditional FMEA scoring system. Each parameter was independently evaluated, and the RPN value was calculated by multiplying the three scores. To ensure representativeness, two scholars and one industry expert participated in the evaluation of the coefficients. After the expert assessments, the average scores for each parameter were computed. The three averages were then multiplied to obtain the final RPN, rounded to the nearest integer. The attributes were subsequently ranked according to their RPN values, providing a prioritized sequence for quality improvement. The consolidated data are presented in Table 4.
Table 4.
Adjusted RPN value.
Based on the modified FMEA approach and the evaluations conducted by scholars and industry experts, the prioritized sequence of improvement for the four attributes is as follows:
- Product price
- Flexibility in adjusting to customer needs
- Vendor’s emergency response capability
- Proactive notification of raw material price fluctuations
4.5. Discussion
The I–S Model identifies attributes requiring improvement, while the modified FMEA prioritizes them based on expert evaluation. The managerial implications for each attribute are as follows:
- Product price
Price is a highly sensitive variable in consumer purchase decisions. If prices are set too high, purchase intention may decrease; conversely, if prices are too low, consumers may doubt product quality or value. Consumers develop a psychological trust toward pricing, forming positive expectations that higher prices indicate higher quality. If this trust relationship is absent, consumers may adopt a more cautious and complex purchase decision process. Moreover, manufacturers that invest in quality improvements may not necessarily receive proportional returns, which can reduce their motivation to enhance products [29,30]. Price is a critical determinant of purchase intention. Studies show that the greater the degree of integration between innovative products and other product functions, the more purchase intention is influenced by word-of-mouth. When products remain popular despite being outdated, enterprises often launch a new generation of products to maintain market share. Furthermore, “sustainability awareness” positively influences consumers’ willingness to pay a premium for eco-friendly packaging (WTP), while price sensitivity negatively affects this willingness. In other words, consumers weigh price against sustainability value, highlighting the importance of setting prices that align with perceived value to maintain trust and expectation [31].
- 2.
- Flexibility in adjusting to customer needs
Customers are key to enterprise profitability. To continuously improve product and service quality, firms must pay attention to customer feedback. Customer orientation is therefore a vital tool for sustaining competitive advantage. Implementing corporate social responsibility (CSR) initiatives positively promotes customer orientation, which is a critical success factor for competitive advantage [32]. Research on product innovation indicates that involving customers and enhancing customer participation in innovation processes significantly increases the likelihood of innovation success. During the ideation stage of new product development (NPD), customer participation significantly enhances process effectiveness, which in turn improves marketing and operational performance [33]. Customer satisfaction, a psychological response to the fulfillment of customer needs, drives repeated purchase behavior, which fosters customer loyalty. Therefore, flexibility in adjusting to customer needs is a crucial attribute for maintaining customer satisfaction and developing competitive advantage.
- 3.
- Vendor’s emergency response capability
The ability of an enterprise to respond to emergencies is critical for maintaining operational stability and minimizing losses [34,35]. Variations in customer demand, supply chain disruptions, and public health events underscore the need for organizations to possess rapid response, resource reallocation, and coordinated decision-making capabilities [36]. Establishing cross-departmental collaboration platforms and learning mechanisms can significantly enhance organizational resilience and response efficiency [37]. Organizational resilience can be assessed through anticipation, coping, and adaptation, providing practical value for designing response strategies [38]. Additionally, official and policy reports suggest that core capabilities such as information visibility, collaborative decision-making, and contingency planning effectively strengthen an enterprise’s response and recovery capacity during emergencies. In summary, systematically building emergency response capability not only reduces operational risks from unexpected events but also enhances competitive advantage and long-term resilience, laying a foundation for sustainable operations in uncertain environments.
- 4.
- Proactive notification of raw material price fluctuations
Proactive notification of raw material price fluctuations is essential for maintaining strong customer relationships. Timely communication regarding material price changes allows customers to plan and adjust orders in advance, reducing potential dissatisfaction and mitigating the risk of order cancelations. This proactive approach not only strengthens trust between the customer and the enterprise but also enhances operational transparency and predictability. Furthermore, by providing early alerts, companies can collaborate with customers on alternative solutions, such as bulk ordering, material substitution, or adjusted delivery schedules, thereby supporting more efficient supply chain and production planning. Ultimately, this practice contributes to long-term customer loyalty and reinforces the enterprise’s reputation for reliability and responsiveness.
In summary, integrating the I–S Model and modified FMEA provides a systematic method for identifying, prioritizing, and addressing critical service and product attributes, enabling enterprises to optimize resource allocation, enhance customer satisfaction, and maintain a competitive advantage.
5. Conclusions and Suggestions
Modern product types and packaging technologies are evolving rapidly, and consumers’ desire for novelty and variety is increasingly difficult to satisfy. Therefore, pursuing originality in packaging design has become a key strategy for brand innovation and development. The conclusions of this study are summarized as follows.
5.1. Conclusions
As internationalized design approaches become more common, incorporating cultural elements into packaging design can create immediate brand recognition effects. Integrating cultural expressions into visual elements of packaging not only helps differentiate products in the market but also deepens consumers’ cultural associations with the brand, creating additional perceived value. Coding analysis results indicate that the cultural expression of packaging design affects brand recognition, associated product performance, cultural associations, and visual style associations [28].
In marketing practices, product packaging plays a crucial role. Packaging should not only protect and transport products but also serve as a marketing tool that communicates brand identity. When consumers see a product’s packaging, they can immediately identify the brand and may be motivated to purchase the product. This study applied the Importance–Satisfaction (I–S) Model to identify key service demand attributes in the packaging and printing market. Through expert validation, 19 product attributes were confirmed. All 19 attributes were input into the I–S Model to determine the areas requiring improvement. Due to limited enterprise resources, not all improvement items could be addressed simultaneously, necessitating the prioritization of improvement efforts. The modified FMEA method with the IFE coefficient was then applied to establish the improvement priority sequence, ensuring that resources were allocated to the most critical areas, satisfying customer needs, and enhancing competitive advantage.
In the highly competitive printing and packaging market, product packaging uniqueness and recognizability are essential. Packaging design must actively shape consumer impressions and brand recognition. Enterprises must employ diverse design strategies to attract consumer attention, reinforce brand recognition, stimulate brand recall, and create product category associations. This approach ensures that the brand is accurately recognized in subsequent purchase behavior. Consequently, printing and packaging firms must clearly understand customer needs, maintain excellent performance in well-performing service attributes, and proactively improve attributes identified in the “to be improved” area to meet customer expectations.
5.2. Research Limitations and Suggestions
Under the increasingly competitive global environment, Taiwan’s packaging and printing industry faces rapid market changes and gradual saturation. While innovation may not be essential for every industry, in saturated and globalized markets, enterprises must rely on continuous innovation and appropriate transformation strategies to survive and thrive. The results of this study are specifically applicable to the packaging and printing industry. Whether they can be generalized to other industries or applied to empirical research in related fields requires further validation. This study applied the I–S Model combined with modified FMEA to prioritize improvement items. Future research could integrate the I–S Model with AHP or fuzzy logic methods to calculate function values, determining improvement priorities quantitatively. It is also suggested to consider incorporating the concepts of risk management or service quality to enrich and enhance the comprehensiveness of future research directions. Regardless of the theoretical tools applied, enterprises must address the product attributes in the improvement area to design packaging that is distinctive, culturally rich, and brand-recognizable. Additionally, future studies could incorporate environmental topics, such as recyclability and sustainability, to further enrich the research outcomes and provide more comprehensive insights for the packaging industry.
Author Contributions
Conceptualization, S.-H.C. and H.-I.Y.; methodology, S.-H.C. and H.-I.Y.; software, H.-I.Y.; validation, S.-H.C. and H.-I.Y.; formal analysis, H.-I.Y.; investigation, H.-I.Y.; resources, S.-H.C.; data curation, H.-I.Y.; writing—original draft preparation, H.-I.Y.; writing—review and editing, S.-H.C. and H.-I.Y.; visualization, H.-I.Y.; supervision, S.-H.C.; project administration, S.-H.C. All authors have read and agreed to the published version of the manuscript.
Funding
This research received no external funding.
Data Availability Statement
The original contributions presented in this study are included in the article. Further inquiries can be directed to the corresponding authors.
Conflicts of Interest
The authors declare no conflicts of interest.
Appendix A
Table A1.
Initial questionnaire.
Table A1.
Initial questionnaire.
Gender: □Man □Woman Marital Status: □Single □Married Age: □Below 30 □31~40 □41~50 □51~60 □above 60 Education Level: □Below High school □University/College □Above Master Occupation: □Public sector □Service industry □High-tech industry □Catering industry □Other | |||||
| Very Unimportant 1 | 2 | Neutral 3 | 4 | Very Important 5 |
| Product price | □ | □ | □ | □ | □ |
| Product design | □ | □ | □ | □ | □ |
| Product practicality | □ | □ | □ | □ | □ |
| Product appearance (color, innovativeness, and recognizability) | □ | □ | □ | □ | □ |
| Product quality (satisfaction, safety, and reliability) | □ | □ | □ | □ | □ |
| Product material | □ | □ | □ | □ | □ |
| Product durability and load-bearing capacity (impact resistance and durability) | □ | □ | □ | □ | □ |
| Product design aligns with ESG principles. | □ | □ | □ | □ | □ |
| The product reflects environmental awareness (e.g., packaging reduction and reusability) | □ | □ | □ | □ | □ |
| Employees’ service attitude | □ | □ | □ | □ | □ |
| Company reputation | □ | □ | □ | □ | □ |
| Company’s after-sales service | □ | □ | □ | □ | □ |
| Punctuality of delivery | □ | □ | □ | □ | □ |
| Convenience of payment | □ | □ | □ | □ | □ |
| Vendor’s emergency response capability | □ | □ | □ | □ | □ |
| Flexibility in adjusting to customer needs | □ | □ | □ | □ | □ |
| Professionalism of sales staff | □ | □ | □ | □ | □ |
| Proactive notification of raw material price fluctuations | □ | □ | □ | □ | □ |
| Proactive communication of market trends by sales staff | □ | □ | □ | □ | □ |
| Very Dissatisfied 1 | 2 | Neutral 3 | 4 | Very Satisfied 5 |
| Product price | □ | □ | □ | □ | □ |
| Product design | □ | □ | □ | □ | □ |
| Product practicality | □ | □ | □ | □ | □ |
| Product appearance (color, innovativeness, and recognizability) | □ | □ | □ | □ | □ |
| Product quality (satisfaction, safety, and reliability) | □ | □ | □ | □ | □ |
| Product material | □ | □ | □ | □ | □ |
| Product durability and load-bearing capacity (impact resistance and durability) | □ | □ | □ | □ | □ |
| Product design aligns with ESG principles. | □ | □ | □ | □ | □ |
| The product reflects environmental awareness (e.g., packaging reduction and reusability) | □ | □ | □ | □ | □ |
| Employees’ service attitude | □ | □ | □ | □ | □ |
| Company reputation | □ | □ | □ | □ | □ |
| Company’s after-sales service | □ | □ | □ | □ | □ |
| Punctuality of delivery | □ | □ | □ | □ | □ |
| Convenience of payment | □ | □ | □ | □ | □ |
| Vendor’s emergency response capability | □ | □ | □ | □ | □ |
| Flexibility in adjusting to customer needs | □ | □ | □ | □ | □ |
| Professionalism of sales staff | □ | □ | □ | □ | □ |
| Proactive notification of raw material price fluctuations | □ | □ | □ | □ | □ |
| Proactive communication of market trends by sales staff | □ | □ | □ | □ | □ |
Remarks: Product attributes refer to the specific characteristics or features that define a product, such as appearance, quality, design, price, and functionality. They influence consumers’ perceptions, preferences, and purchasing decisions.
References
- Holzmann, P.; Breitenecker, R.J.; Schwarz, E.J. Business model patterns for 3D printer manufacturers. J. Manuf. Technol. Manag. 2020, 31, 1281–1300. [Google Scholar] [CrossRef]
- Shukla, P.; Singh, J.; Wang, W. The influence of creative packaging design on customer motivation to process and purchase decisions. J. Bus. Res. 2022, 147, 338–347. [Google Scholar] [CrossRef]
- Nuojua, S.; Pahl, S.; Thompson, R.C. Plastic alternatives and substitutes in the packaging sector—A UK consumer perspective. Sustain. Prod. Consum. 2024, 46, 68–81. [Google Scholar] [CrossRef]
- Keller, K.L. Strategic Brand Management: Building, Measuring, and Managing Brand Equity, 4th ed.; Pearson Education Limited: London, UK, 2008. [Google Scholar]
- Wang, I.C.; Jiang, Y.R.; Wang, Y.W.; Li, C.Y. Exploring the multisensory attractiveness of cosmetic packaging: A study of visual and tactile design elements and attractiveness factors. Sustainability 2024, 16, 5716. [Google Scholar] [CrossRef]
- Round Table Creative Printing Co., Ltd. Packaging and Printing: Current Status and Future Trends of the Taiwanese Industry. 2025. Available online: https://www.rtadv.com/taiwan-packaging-printing-technology (accessed on 10 July 2025).
- Kotler, P. Analysis, Planning, Implementation and Control; Prentice Hall International: Denver, CO, USA, 1994. [Google Scholar]
- Zygiaris, S. Service quality and customer satisfaction in the post-pandemic world. Front. Psychol. 2022, 13, 842141. [Google Scholar] [CrossRef]
- Perdomo-Verdecia, V. An fsQCA analysis of service quality for hotel customer satisfaction. Int. J. Hosp. Manag. 2024, 115, 103513. [Google Scholar] [CrossRef]
- Juran, J.M. Quality Control Handbook, 3rd ed.; Prentice Hall: New York, NY, USA, 1974. [Google Scholar]
- Martilla, J.A.; James, J.C. Importance-performance analysis. J. Mark. 1977, 41, 77–79. [Google Scholar] [CrossRef]
- Yang, C.C. Establishment and applications of the integrated model of service quality measurement. Manag. Serv. Qual. Int. J. 2003, 13, 310–324. [Google Scholar] [CrossRef]
- Yousaf, M.U.; Aized, T.; Shabbir, A.; Ahmad, M.; Nabi, H.Z. Automobile rear axle housing design and production process improvement using Failure Mode and Effects Analysis (FMEA). Eng. Fail. Anal. 2023, 154, 107649. [Google Scholar] [CrossRef]
- Wang, N.; Wang, W.; Yu, S.; Chen, J.; Yang, X. Efficiency assessment method for evoking cultural empathy in symbolic cultural and creative products based on fuzzy-FMEA. Appl. Sci. 2025, 15, 221. [Google Scholar] [CrossRef]
- Together Go International Marketing Design Co., Ltd. Nine Key Processes in Refining Product Packaging Design. 2025. Available online: https://togethergo.com.tw/project/package-design/ (accessed on 10 July 2025).
- Kowalik, M.; Foit, K. Towards a self-service approach in the printing industry. Multidiscip. Asp. Prod. Eng. (MAPE) 2021, 4, 381–389. [Google Scholar]
- Chen, S.H. A performance matrix for strategies to improve satisfaction among faculty members in higher education. Qual. Quant. 2011, 45, 75–89. [Google Scholar] [CrossRef]
- Tonge, J.; Moore, S.A. Importance-satisfaction analysis for marine-park hinterlands: A Western Australian case study. Tour. Manag. 2007, 28, 768–776. [Google Scholar] [CrossRef]
- Yang, C.C. The refined Kano’s model and its application. Total Qual. Manag. Bus. Excell. 2005, 16, 1127–1137. [Google Scholar] [CrossRef]
- Chang, K.H.; Fang, T.Y.; Li, Z.S. Using a flexible risk priority number method to reinforce abilities of imprecise data assessments of risk assessment problems. Electronics 2025, 14, 518. [Google Scholar] [CrossRef]
- Liu, H.C.; You, J.X.; Shan, M.M.; Shao, L.N. Failure Mode and Effects Analysis using intuitionistic fuzzy hybrid TOPSIS approach. Soft Comput. 2015, 19, 1085–1098. [Google Scholar] [CrossRef]
- Wu, X.; Wu, J. The risk priority number evaluation of FMEA analysis based on random uncertainty and fuzzy uncertainty. Complexity 2021, 2021, 8817667. [Google Scholar] [CrossRef]
- Li, Y.; Zhu, L. Failure Modes Analysis related to user experience in interactive system design through a fuzzy Failure Mode and Effect Analysis-Based hybrid approach. Appl. Sci. 2025, 15, 2954. [Google Scholar] [CrossRef]
- Yang, Z.; Wang, J. Use of fuzzy risk assessment in FMEA of offshore engineering systems. Ocean Eng. 2015, 95, 195–204. [Google Scholar] [CrossRef]
- Cebeci, U.; Simsir, U.; Dogan, O. Risk analysis of five-axis CNC water jet machining using fuzzy risk priority numbers. Symmetry 2025, 17, 1086. [Google Scholar] [CrossRef]
- Wei, N.C.; Wu, Y.; Yao, S.Y.; Chang, Y.C. Developing an integrated model with FMEA and Grey Theory for supplier selection. J. Prof. Mech. Eng. 2010, 3, 11–21. (In Chinese) [Google Scholar] [CrossRef]
- Varndell, W.; Fry, M.; Elliott, D. Applying Real-Time Delphi Methods: Development of a Pain Management Survey in Emergency Nursing. BMC Nurs. 2021, 20, 149. [Google Scholar] [CrossRef]
- Yen, J.; Lin, S.Y. A study of the variables of packaging design that affect brand equity. J. Des. 2010, 15, 71–91. [Google Scholar] [CrossRef]
- Xia, L.; Yang, Y. The influence of self-decided prices on expected quality. J. Bus. Res. 2023, 160, 113769. [Google Scholar] [CrossRef]
- Drosou, M.; Tsourgiannis, L. Young consumers’ price perceptions in purchasing foods: Evidence from Greece. Sustainability 2024, 16, 5752. [Google Scholar] [CrossRef]
- Alqahtani, A.S.; Alsolami, B. Sustainability awareness, price sensitivity, and willingness to pay for eco-friendly packaging: A discrete choice and valuation study in the Saudi retail sector. Sustainability 2025, 17, 7287. [Google Scholar] [CrossRef]
- Mahmood, S.; Khan, Z. CSR and customer orientation: A sustainable pathway towards competitive advantage? Soc. Responsib. J. 2023, 19, 741–755. [Google Scholar] [CrossRef]
- Rautela, S.; Singhal, T.K.; Sharma, S. Customer Participation and NPD Process Effectiveness: The Perspective of Marketers. Indian J. Mark. 2024, 54, 25. [Google Scholar] [CrossRef]
- Herstein, J.J.; Cohen, A.; Shapiro, S. Emergency preparedness: What is the future? J. Bus. Res. 2021, 130, 246–256. [Google Scholar] [CrossRef]
- Marshall, V.K.; Chavez, M.; Mason, T.M.; Martinez-Tyson, D. Emergency preparedness during the COVID-19 pandemic: Perceptions of oncology professionals and implications for nursing management from a qualitative study. J. Nurs. Manag. 2021, 29, 1375–1384. [Google Scholar] [CrossRef]
- Fleming, M.D.; Safaeinili, N.; Knox, M.; Brewster, A.L. Organizational and community resilience for COVID-19 and beyond: Leveraging a system for health and social services integration. Health Serv. Res. 2024, 59, e14250. [Google Scholar] [CrossRef] [PubMed]
- Su, W.; Chen, L.; Huang, M. Unlocking the recipe for organizational resilience: A systematic review. Sustainability 2023, 15, 4201. [Google Scholar] [CrossRef]
- Ignatowicz, A.; Tarrant, C.; Mannion, R.M.; Conroy, S.; Lasserson, D. Organizational resilience in healthcare: A review and descriptive narrative synthesis of approaches to resilience measurement and assessment in empirical studies. BMC Health Serv. Res. 2023, 23, 376. [Google Scholar] [CrossRef]
Disclaimer/Publisher’s Note: The statements, opinions and data contained in all publications are solely those of the individual author(s) and contributor(s) and not of MDPI and/or the editor(s). MDPI and/or the editor(s) disclaim responsibility for any injury to people or property resulting from any ideas, methods, instructions or products referred to in the content. |
© 2025 by the authors. Licensee MDPI, Basel, Switzerland. This article is an open access article distributed under the terms and conditions of the Creative Commons Attribution (CC BY) license (https://creativecommons.org/licenses/by/4.0/).