Abstract
This study investigates the mechanisms of hazardous gas outbursts in geologically complex non-coal tunnels. This is a critical safety concern during excavation, particularly at specific locations and during time-sensitive periods. To address this, a gas–solid coupled numerical model is established to simulate gas seepage processes under such conditions. The simulations systematically reveal the spatiotemporal evolutionary patterns of the velocity and direction of the gas seepage and elucidate the migration mechanism driven by excavation-induced pressure gradients. The model specifically analyzes how geological structures, such as rock joints and fractures, control the seepage pathways. The model also demonstrates the dynamic variations in and enrichment behavior of the gas escape velocities near these discontinuities. Field measurements obtained from the Hongdoushan Tunnel validated the simulated emission patterns along jointed fissures. The findings clarify the intrinsic relationships between the outburst dynamics and key factors that include pressure differentials, geological structures, and temporal effects. This work provides a crucial theoretical foundation and practical strategy for the prediction and prevention of hazardous gas disasters in analogous tunnel engineering projects, thereby enhancing overall construction safety.
1. Introduction
Hazardous gas incidents frequently occur during tunnel construction, and these pose serious threats to personnel safety and project progress. Such incidents have historically been concentrated in coal-bearing stratum tunnels, and study cases that involve the sudden release of high-concentration, multi-component hazardous gases in non-coal-bearing strata have been exceptionally rare. A representative example is the high-pressure pocket-shaped hazardous gas outburst accident that occurred during the construction of the No. 1 inclined shaft of the Hongdoushan Tunnel on the Dali–Lincang Railway in Lincang City, Yunnan Province, in June 2017. This accident resulted in six fatalities. On-site and subsequent monitoring revealed continuous emissions of high concentrations of H2S, CO2, CO, H2, NO2, and other hazardous gases in the tunnel. This tunnel is located in the Fengqing–Yunxian–Lincang hydrothermal activity zone, a region with intense geological activity, widespread hot springs, and associated gases, such as H2S and CO2. The Hongdoushan Tunnel sits within complex geological structures and deep-seated faults, providing a geological setting conducive to the accumulation and sudden release of toxic gases, thereby severely endangering construction safety [1,2].
Tunnel construction often has inherent risks, such as gas explosions and hazardous gas outbursts. These cause substantial dangers during both construction and operation. The hazardous gas incident frequency in non-coal-bearing stratum tunnels has increased in recent years. In response to these dangers, researchers worldwide have intensified their studies into the sources, qualitative prediction, and risk assessment of gases, such as methane (CH4) and hydrogen sulfide (H2S), in these tunnels [3,4,5,6,7]. However, the current research has notable limitations. A majority of studies on hazardous gas emissions in tunnels have still relied on the flow theory of coalbed methane for emission predictions and risk assessments. Previous numerical studies on tunnel gas have yielded key insights. Ge Jiang [8] combined monitoring data with simulations to assess gas emission risks via fuzzy evaluation. Zhang Lei [9] used a 3D model to emphasize the need for simultaneous control of gas concentration and wind speed during ventilation. Through FLUENT simulations, Zhang Xuejin et al. [10] identified gas emission rate and ventilation volume as primary factors affecting dispersion. Other researchers have proposed calculation methods and predictive models for gas emissions in specific geological contexts [11,12], while CFD analyses have guided ventilation strategy optimization [13]. Some studies have also addressed gas leakages into engineering structures and proposed disaster mechanisms. For example, Yi Shen et al. [14] investigated the factors that influence gas explosions in metro shield tunnels using field surveys and numerical simulations. Yonghong Gao et al. [15] examined the effects of the methane concentration, ignition location, vent area, and venting intensity on explosion loads using experiments and simulations. Nevertheless, these studies have primarily focused on coalbed methane (CH4), and there remains limited research on the emission dynamics and seepage mechanisms of complex gas components (e.g., CO2 and H2S) in non-coal-bearing strata. Nevertheless, these studies have primarily focused on coalbed methane (CH4) and ventilation strategies, with insufficient attention to the evolution of gas seepage pathways—particularly the dynamic changes in rock mass fractures and joints induced by excavation disturbances.
Furthermore, contemporary research on gas transport in porous and fractured media underscores the critical role of fracture network evolution and hydro-mechanical coupling, which remains under-explored in the context of non-coal tunnel construction. For instance, studies on the permeability characteristics of fractal porous media and fracture-porosity systems have revealed that the geometry and connectivity of pore-throat structures fundamentally govern seepage behavior [16,17]. The permeability of the surrounding rock is not static but evolves with stress and deformation, a key mechanism that models based on coal seam gas theory often overlook [18]. Research on the coupled hydro-mechanical evolution of fracture permeability, such as in sand injectite intrusions, demonstrates how stress field changes and plastic deformation dynamically alter gas migration channels [19]. Similarly, investigations under thermal-hydro-mechanical coupling conditions have established empirical and numerical models linking permeability evolution to inelastic volume strain and effective stress, providing mature methodologies that can be referenced [20]. However, the application of these advanced gas–solid coupling theories to simulate the entire process of gas emission from fracture initiation to steady flow in non-coal tunnels after excavation is still lacking.
An in-depth study of the emission patterns and mechanisms of atypical hazardous gases, such as CO2 and H2S, in non-coal-bearing stratum tunnels is crucial to reveal their sudden release mechanisms and enable precise risk predictions and formulate effective mitigation strategies. This study is based on the Hongdoushan Tunnel of the Dali–Lincang Railway, and employs numerical simulation to develop a numerical model of hazardous gas seepage in tunnels that incorporates gas–solid coupling effects. The aim of the model is to simulate and analyze the seepage velocity, direction, and dynamic characteristics of hazardous gases under varying spatiotemporal conditions to reveal their emission mechanisms and features. The findings are validated using on-site monitoring data. This research seeks to provide theoretical and technical guidance for the safe construction of similar non-coal-bearing stratum tunnels, enabling targeted risk mitigation in high-risk zones and periods. This research provides a foundation for the reduction in accident frequency, minimization of harm, and optimization of construction costs.
2. Model Establishment and Boundary Conditions
2.1. Governing Equations
2.1.1. Fundamental Theory
The hazardous gas transport process in the stratum is a process of flow in a porous medium. After the pressure relief at the heading face, a pressure variation zone related to distance forms within the stratum. The hazardous gases in the stratum will seep under the drive of the pressure gradient. This process conforms to Darcy’s seepage theory. The research process can be approximated as a two-dimensional radial flow.
Because the pressure difference is the dominant factor during the transport process of hazardous gases, it can be considered an isothermal process. Therefore, the interaction between the deformation field and the seepage field is primarily considered. The effective stress and pore pressure of the rock mass will change due to the influence of pressure on the gas in the stratum. This will consequently cause dynamic variations in the pore volume and permeability of the rock mass. Simultaneously, these changes will then affect the gas flow and pressure distribution, making the transport a coupled process governed by the interaction between the deformation field and the seepage field. The seepage field of hazardous gases is generally considered an unsteady seepage field, where the velocity, flow direction, and pressure of the gas at any point change over time. As time increases, the gas flow rate decays until equilibrium is reached.
2.1.2. Governing Equations for the Solid Domain
The equilibrium equation, named the Navier-type equation and considering the influence of pore pressure on effective stress, is
where is the effective stress; is the Biot coefficient (typically ranging from 0 to 1); is the pore pressure; and is the body load (e.g., gravity).
The geometric deformation equation that describes the relationship between the solid displacement, u, and strain is
In linear elastic materials, the constitutive equation that relates the stress and strain is
where is the elasticity matrix related to the Young’s modulus, E, and Poisson’s ratio, ν.
2.1.3. Governing Equations for the Fluid Domain
Darcy’s law is suitable for the low-velocity flow of a single-phase gas in porous media and is the following:
where is the Darcy velocity; is the permeability; is the dynamic viscosity of the gas; and is the pressure.
The equation of state for the gas (assumed to be an ideal gas) is combined with changes in the porosity, ϕ, and the mass conservation equation is then
where is the gas density that can be calculated using the ideal gas law ρ = PM/(RT), M is the molar mass; R is the gas constant; and T is the temperature.
2.1.4. Key Equations for the Fluid–Structure Interaction
Solid deformation leads to porosity changes that require the definition of a coupling relationship:
where ϕ0 is the initial porosity; and Tr(ε) is the trace of the strain tensor.
The permeability, k, may change with the stress state and can be defined by, for example, the Kozeny–Carman equation:
2.2. Calculation Model
The Hongdoushan Tunnel has a span of 7.5 m and a height of 6.2 m at the cross-section of X1DK1+245 in the No. 1 inclined shaft. The stress changes induced by excavation can be neglected beyond approximately five times the tunnel span. Accordingly, the model length was set to 25 m, and 50 m was used along the tunnel axis. The excavation direction of the Hongdoushan Tunnel is 167°, and the surrounding rock has an occurrence of N60° E. The orientation and spacing of the two joint sets intersecting the tunnel were obtained through field line mapping. For Joint 1, the field-measured orientation ranges from 176 to 182° ∠ 63–69° with a spacing of approximately 50 m; in the model, it was simplified to 179° ∠ 66° with a spacing of 50 m. For Joint 2, the field-measured orientation ranges from 28 to 32° ∠ 90° with a spacing varying between 20 m and 30 m; in the model, it was represented as 30° ∠ 90° with a spacing of 25 m. The joint distribution is illustrated in Figure 1, with Joint 1 forming a larger angle with the tunnel excavation direction. Based on the above parameters, a three-dimensional model was developed and meshed for subsequent finite element analysis (Figure 1).
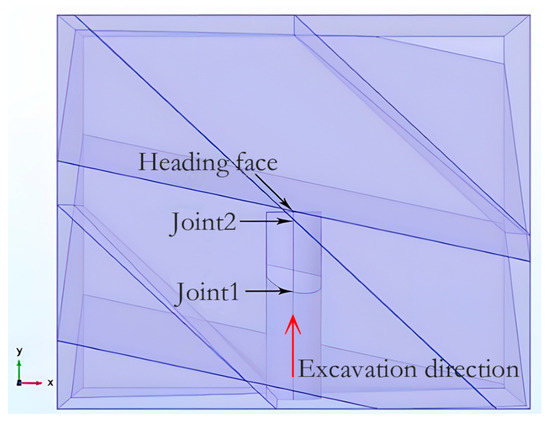
Figure 1.
The top view of the joint distribution of the surrounding rock.
A three-dimensional model was constructed and discretized utilizing an adaptive mesh refinement technique to automatically optimize the grid. Hexahedral elements were employed with a size of 5 m for the intact rock mass, while the regions around the tunnel periphery and joint surfaces were refined to 1–2 m. The resulting mesh comprised approximately 100,000 elements (Figure 2).
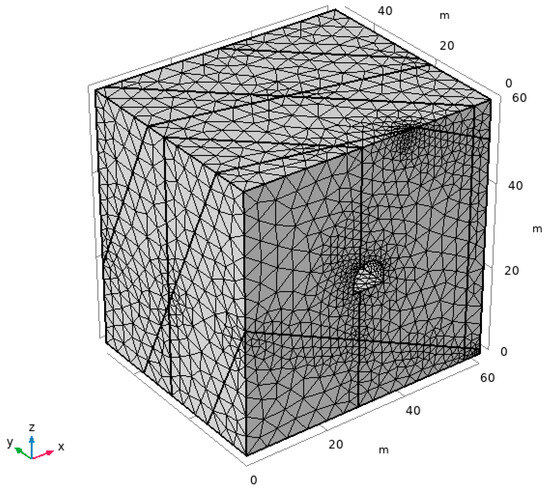
Figure 2.
Meshing of the surrounding rock model of the face of the No. 1 inclined shaft.
2.3. Parameter Selection
The parameters of the numerical model were all obtained from measurements or experimental data collected during the construction of the Hongdoushan Tunnel. The surrounding rock of the tunnel primarily consists of granitic mylonite with relatively developed joint fissures. The rock mass ranges from moderately fractured to relatively intact, exhibiting high strength overall. Localized features may include rock veins, weak interlayers, and small cavities, with partial water seepage observed. Since the joint width is only 0.05 m, which is much smaller than the mesh size, the joint was simplified to a thin-layer interface. Parameters, such as the density, internal friction angle, and porosity, were required due to the geometric interface with a specific width. The self-stabilizing ability of the rock mass is general. Table 1 shows the mechanical parameters of both the tunnel surrounding rock and joint.

Table 1.
Physical mechanics parameter table.
After the hazardous gas outburst in the tunnel, gas sampling and analyses were conducted at locations X1DK1+272.0 and X1DK1+278.5 where continuous bubble emissions were observed (Table 2). Gas components that constitute less than 1% of the total volume have negligible effects on gas outbursts and can be disregarded; hence, the primary composition of the hazardous gases was determined to be approximately 83.34% carbon dioxide (CO2), 13.14% nitrogen (N2), and 3.52% oxygen (O2). The average molar mass of the gas mixture was 0.042 kg/mol. At an altitude of 1200 m, a temperature of 20 °C (293 K), and an atmospheric pressure of 87,200 Pa in the tunnel area, the density ρ was calculated to be 1.50 kg/m3 using the ideal gas law (Equation (8)):
where P is the atmospheric pressure that is approximately 87,200 Pa at the tunnel’s altitude of 1200 m; R is the gas constant of R = 8.314 J/(mol·K); and T is the temperature of 293 K. The dynamic viscosity of the gas mixture was calculated using the Herning–Zipperer method, and it was approximately 1.55 × 10⁻⁵ Pa·s.
Table 2.
Gas sampling test results.
2.4. Boundary Condition
An accurate simulation of the stress changes induced by excavation is the foundation for predicting gas flow patterns in the surrounding rock. In reality, the displacement of rock masses at great depths is nearly negligible and can be considered fully fixed. Therefore, the lower boundary of the model was defined as a fixed constraint. The vertical in situ stress is primarily caused by the weight of the overlying rock mass. A uniformly distributed pressure (load) was applied to the upper boundary, and the effect of these overlying strata was equivalently replaced. For the lateral sides, to simulate the infinitely extended rock mass beyond the model boundaries, normal constraints (also referred to as roller supports) were applied to restrict displacement in the normal direction while allowing free movement in the tangential direction.
The initial stress state prior to tunnel excavation was calculated using the regional in situ stress variation equation with depth (Equations (9)–(11)), where σH, σh, and σv represent the maximum horizontal principal stress, minimum horizontal principal stress, and vertical principal stress, respectively, in MPa; and H is the burial depth (m).
At the X1DK1+158 cross-section of the No. 1 inclined shaft in the Hongdou Mountain Tunnel, within the burial depth range, the principal stresses follow the relationship σH > σh > σv. In this area, the orientation of σ1 is 200°. When incorporated into the model, the direction of the maximum principal stress, σH, is nearly aligned with the positive y-axis, the direction of σh aligns with the positive x-axis, and the direction of σv aligns with the positive z-axis.
Field measurements at the construction site indicated an initial gas emission pressure of 0.3 MPa. Accordingly, the boundary conditions for the seepage field in the model were established as follows. The lower boundary pressure was set to the initial gas pressure of 0.3 MPa, and the upper boundary and surrounding sides were defined as no-flow boundaries. After tunnel excavation, the tunnel wall pressure was set to zero. It is important to note that the elevation of the Hongdoushan Tunnel is approximately 1200 m, with an atmospheric pressure of approximately 88.2 kPa. All of the pressure values used in this simulation were relative pressure values obtained after subtracting the atmospheric pressure.
The initial gas concentration throughout the entire fluid domain was 83.34% carbon dioxide (CO2), 13.14% nitrogen (N2), and 3.52% oxygen (O2). Trace components such as H2S, CO, and CH4 in the gas were neglected, and the domain was considered to be filled with a mixed single-phase gas saturating both the joints and pore spaces. The temperature of the computational domain was held constant at 20 °C.
For the seepage, the boundary conditions for the fractures were set to be identical to those of the matrix. Mechanically, the fractures were modeled as thin elastic layers that would deform in conjunction with the matrix, and no initial stress was considered within the fractures themselves. The mechanical boundary conditions were also the same as those for the matrix.
For the solution, the Solid Mechanics and Darcy’s Law modules were used. A Transient study was employed to simulate the excavation process. As the simulation needed to calculate the gas migration process over a period of up to 60 days, trial computations were performed on a computer with an Intel(R) Core(TM) i7-9750H CPU, 32 GB of RAM, and an NVIDIA GeForce GTX 1660 Ti graphics card to determine an appropriate time step, which was set to 10 min. The relative tolerance for the computation was set to 1 × 10⁻⁴, and the absolute tolerance was set to 1 × 10⁻⁵.
3. Results
3.1. Principles of Hazardous Gas Occurrences and Mechanisms of the Outburst Sources
3.1.1. Principles of Hazardous Gas Occurrences
The hazardous gases in the Hongdoushan Tunnel are predominantly CO2 and H2S. These primarily exist in free and dissolved states within the strata, with the free state being the dominant form. Current research on hazardous gases in tunnels has primarily focused on methane (gas), and existing studies have identified three occurrence modes of tunnel gas: the porous-type, fracture-type, and absorption-type [21] (Figure 3). Hazardous gases, such as CO2 and H2S, migrate through and accumulate along fractures and joints in the surrounding rock, often forming localized high-pressure gas pockets. These gases maintain a dynamic equilibrium state in undisturbed rock formations. Tunnel excavation disrupts this original pressure equilibrium and induces gas flows through pores and fractures in the surrounding rock. The excavation creates a low-pressure space that is rapidly filled by atmospheric air, generating a pressure differential that drives the escape of hazardous gases from the tunnel. The flow of gases through rock pores and fractures generally follows Darcy’s law [22,23].
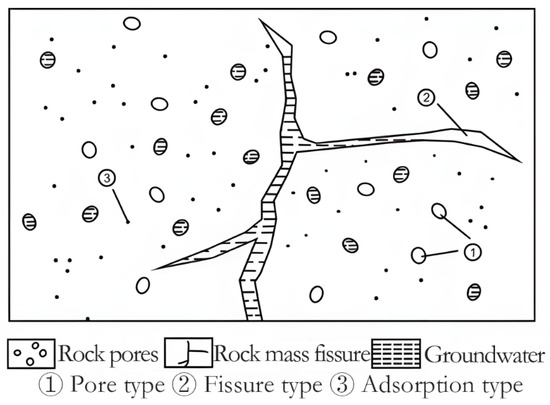
Figure 3.
Occurrence model of hazardous gases in rock formations.
3.1.2. Mechanisms of Outburst Sources
Gas emissions primarily stem from the generation of an internal–external pressure differential. Within the same geological formation, a greater pressure differential results in a higher rate of gas escape. During tunnel excavation, this pressure differential primarily arises from the high pressure within the hazardous gas air bladder and the low-pressure zone created by the excavation itself.
The No. 1 inclined shaft of the Hongdoushan Tunnel is located on the southern limb of the Yulu Village syncline, where the rock mass is heavily influenced by tectonic activity. The surrounding rock consists of highly weathered granitic mylonite with poor integrity, well-developed joints and fractures, and localized water seepage. Hazardous gases, such as CO2 and H2S, may migrate through faults, tectonic fractures, and groundwater into the tunnel and accumulate there. High-pressure gas pockets can form under the influence of tectonic stress and water pressure in areas where the rock layers exhibit good sealing properties.
During blasting excavation at the tunnel face, a low-pressure free space is created, which causes atmospheric air to rapidly flow in and generate a pressure differential. At this point, the accumulated hazardous gases in the surrounding rock surge from the high-pressure zones into low-pressure free spaces, leading to a high risk of sudden gas outbursts. The greater the gas pressure within the rock layers, the larger the pressure difference formed during excavation, which results in higher gas discharge velocities.
A simulation analysis was conducted on the maximum principal stress distribution in the surrounding rock along the tunnel’s central axis and the seepage velocity field of hazardous gases (Figure 4). Hazardous gas escapes from the surrounding rock and is indicated by red arrows, while their escape from joints is represented by the magenta arrows, with the arrow size corresponding to the seepage velocity. The results showed that the seepage velocity of hazardous gases was higher in stress concentration zones near the tunnel crown and invert, indicating a correlation between the gas discharge velocity and rock stress. This result indicated that higher stress areas tended to exhibit faster seepage flows.
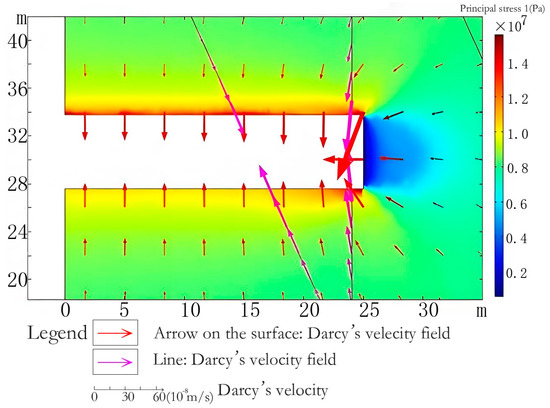
Figure 4.
Distribution of the maximum principal stress and velocity field of hazardous gas seepage.
After tunnel excavation, stress is released at the face, increasing the porosity and permeability of the rock mass. This facilitates gas discharge. Compared to the undisturbed tunnel sections, the gas discharge velocity is significantly higher near the face. This means that gas outflow speeds the increase closer to the excavation front. Additionally, joints in the tunnel lining exhibit higher permeability coefficients, leading to faster gas discharges through joints compared to intact rock masses.
3.2. Characteristics of Hazardous Gas Emission
3.2.1. Migration Pathway Analysis
A simulation analysis was conducted on the hazardous gas seepage velocity fields in the surrounding rock along the tunnel’s longitudinal profile at 1, 9, 30, and 60 days post-excavation (Figure 5). The results revealed that gas migration primarily occurred through the joints and rock matrix pores/fractures. The gas emission velocities exhibited a progressive decline with increasing excavation time. During the initial excavation phase, emission velocities from both the surrounding rock and joints decreased over time. Beyond 30 days post-excavation, the gas emission velocities demonstrated negligible variations, indicating essentially stabilized flow conditions.
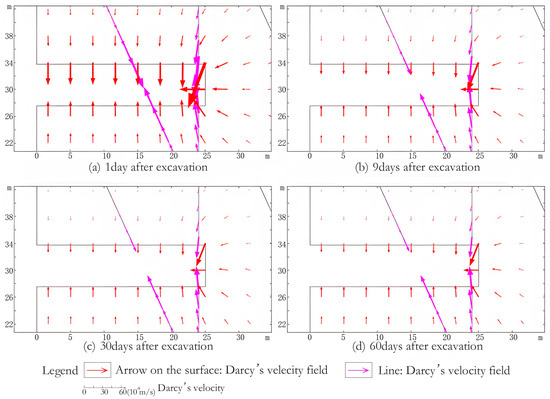
Figure 5.
The seepage velocity fields of hazardous gases at different times after excavation.
An analysis of the seepage velocity variations over time and position along the central axis of the tunnel vault and invert (Figure 6 and Figure 7) revealed consistent trends in the hazardous gas migration. Abrupt velocity decreases occurred at 14.5 m and 24 m in the crown and at 17 m and 23.5 m in the invert. Field verification confirmed that these inflection points corresponded to joint locations, and there were significantly reduced gas seepage velocities in the rock mass adjacent to joints. This phenomenon indicated that gases preferentially migrate through joints rather than the rock matrix prior to reaching the tunnel. Therefore, joints are the dominant migration channels at these positions.
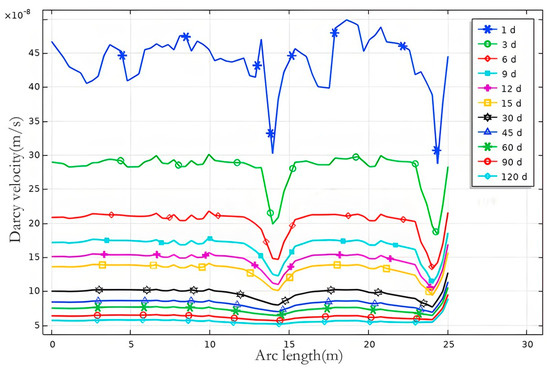
Figure 6.
Seepage velocity change trends in the surrounding rock medium of the tunnel vault.
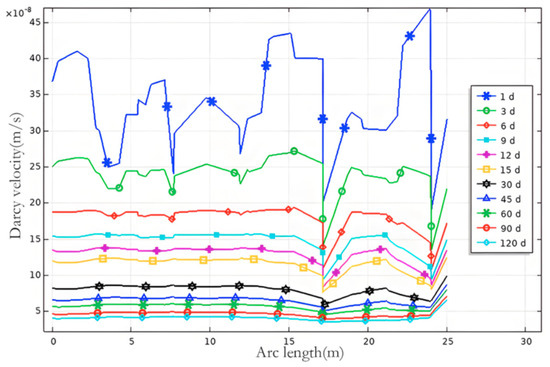
Figure 7.
The seepage velocity change trend diagram in the surrounding rock of the tunnel floor.
The figures further demonstrate a time-dependent decline in the gas seepage velocities. A pronounced decline occurred during the initial 1–6 days post-excavation, with velocities approaching stabilization at approximately day 12. Beyond 30 days, the seepage velocities exhibited minimal variation. Notably, the emission velocities at different locations displayed significant initial fluctuations without discernible patterns during the early excavation stages. As the excavation time progressed, velocities progressively decreased while simultaneously converging toward stable values across all of the monitored positions. In contrast, the velocity variations in the joint zones remained consistently less pronounced throughout the observed period.
Based on this comprehensive analysis, it was evident that the hazardous gas seepage velocities through rock matrix pores and fractures progressively decreased over time. Joints dominated the gas migration pathways, demonstrating that structural discontinuities, such as joints and faults, constituted the primary egress routes for tunnel gas emissions. This phenomenon was fundamentally correlated with the occurrence patterns of hazardous gases in geological formations, such as patterns for mantle-derived gases, migrations upward via deep-seated faults in association with groundwater, and accumulations in structurally favorable zones such as tectonic fractures. During tunnel excavation, the gas concentrations within joint networks are continuously replenished by deep subsurface sources. This results in joint-mediated emissions as the predominant release mechanism.
3.2.2. Analysis of the Seepage Velocity Variations
An analysis of the temporal trends of the average emission velocity of hazardous gases along the tunnel walls and invert (Figure 8) revealed an initial emission velocity of 7.7 × 10⁻⁷ m/s. A rapid decline in the gas emission velocity occurred within the first six days post-excavation. Subsequently, the declining trend gradually decelerated. By day 11, the emission velocities stabilized at significantly lower magnitudes, ultimately reaching a stable plateau of 5–10 × 10−8 m/s after 26 days. Figure 7 and Figure 8 were cross-referenced, and this confirmed that the gas emission velocities were substantially greater during the early excavation stages. The velocities progressively stabilized approximately 11 days post-excavation, with minimal variations observed beyond 26 days while maintaining consistently low emission rates.
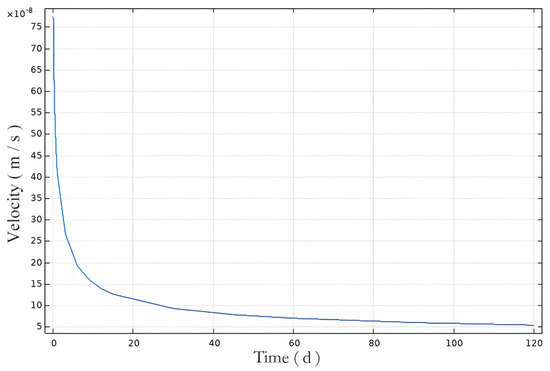
Figure 8.
Average velocity curves of hazardous gas escapes from the surrounding rock and tunnel floor.
The temporal evolution of the seepage velocities (Figure 9) showed initial velocities of 3.9 × 10⁻⁶ m/s (Joint 1) and 9.2 × 10⁻⁶ m/s (Joint 2). The higher seepage velocity in Joint 2 compared to Joint 1 is attributed to its steeper dip angle (90° versus 66° for Joint 1), which facilitates more efficient vertical gas migration and discharge. A rapid decline occurred in Joint 2 on the excavation day, after which both joints exhibited congruent velocity decay patterns with gradual attenuation. The velocities stabilized after day 11 post-excavation, showing negligible variations beyond day 26. The initial seepage velocity of proximal Joint 2 significantly exceeded that of distal Joint 1. This result agreed with field measurements that showed peak gas concentrations near the advancing face. This finding was validated by the numerical simulations.
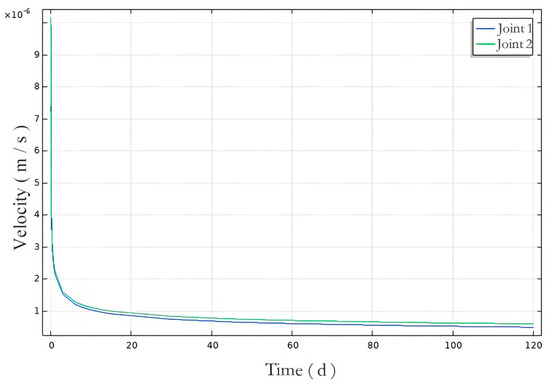
Figure 9.
The seepage velocity change trend diagram in the surrounding rock joints.
3.2.3. Analysis of the Gas Gushing Characteristics
A comprehensive analysis of the above data indicated that the initial average escape velocity of hazardous gases from the surrounding rock and invert was 7.7 × 10⁻⁷ m/s, while the initial velocities at Joint 1 and Joint 2 were 3.9 × 10⁻⁶ m/s and 9.2 × 10⁻⁶ m/s, respectively. The initial seepage velocities at both joints were significantly greater than the average initial seepage velocity.
The gas seepage velocities in the surrounding rock, invert, and both joints decreased rapidly after excavation. They then slowed and gradually stabilized after 11 days, remaining at a relatively low level. By 26 days, the escape velocity showed minimal variation.
These findings confirmed that joints serve as the primary pathways for hazardous gas escapes in tunnels. When gases migrate upward from the deeper strata, they accumulate in joint fractures, leading to localized, short-term, high-volume outbursts.
4. Case Study Analysis
4.1. Site Overview
During the blasting excavation of the No. 1 inclined shaft of the Hongdoushan Tunnel at chainage X1DK1+243.5, a hazardous gas outburst occurred. This resulted in a rock ejection inside the tunnel. After the outburst, the area in front of the working face was covered with loose, fine sandy collapsed deposits mixed with crushed stones that consisted of dark gray granitic mylonite. The deposits extended longitudinally for 8–15 m with a volume of approximately 150 m3, and no water flow or inrush was observed.
Hazardous gas monitoring was conducted in the section from X1DK1+248 to +245 on the day prior to the gas outburst. The results showed H2S and CO concentrations of 0.3 × 10⁻⁶ mol/mol and 1 × 10⁻⁶ mol/mol, respectively. This result indicated the presence of hazardous gases in the tunnel at that time. Bubbling was observed at multiple locations in the accumulated water at the base of the tunnel section from X1DK1+265 to +275 after the outburst. This observation suggested that hazardous gases were escaping through joints and fractures in the surrounding rock mass.
4.2. Data Analysis and Verification
After tunnel construction was suspended, continuous monitoring of hazardous gases was conducted in four advance boreholes at the working face and a radial exploratory hole at the right arch waist. The advance boreholes were located at chainage X1DK1+242.5 (Figure 10), while the right radial exploratory hole was positioned on the sidewall of the tunnel at chainage X1DK1+251.5. The monitoring period lasted from 23 November to 9 December 2017.
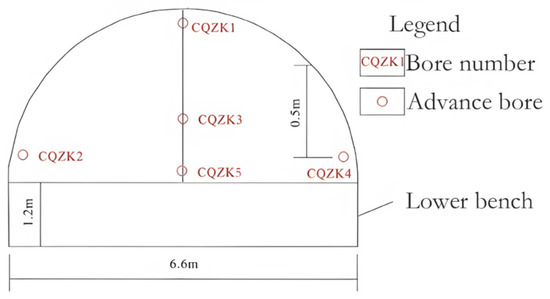
Figure 10.
Location map of the on-site inspection.
4.2.1. Analysis and Verification of the H2S Concentration Variations
Analysis of the H2S concentration variations in the advance boreholes and the right radial exploratory hole (Figure 11) revealed that the highest concentration occurred in the right radial exploratory hole, reaching 122.7 × 10⁻⁶ mol/mol. This far exceeded the standard limit of 6.6 × 10⁻⁶ mol/mol. The on-site H2S concentrations exhibited a clear declining trend over time and stabilized at relatively low levels after approximately 11 days, except for at the right arch waist radial exploratory hole.
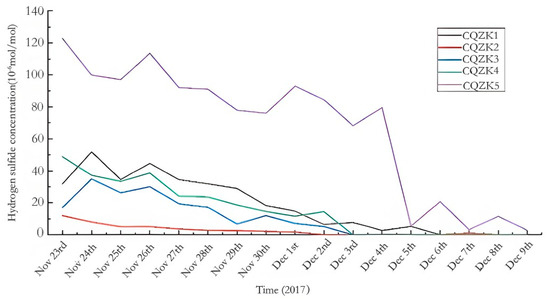
Figure 11.
H2S gas concentration change trends diagram in the geological hole of the tunnel face.
In contrast, the H2S concentration in the right arch waist radial exploratory hole remained notably higher than in the advance boreholes and only stabilized at a lower level after approximately 13 days. Based on the geological conditions, this phenomenon was attributed to the well-developed joint fractures in the surrounding rock at the right side of the tunnel section X1DK1+2515, where hazardous gases migrated and accumulated.
The field measurements validated the accuracy of the numerical simulation results and confirmed that joints dominated the hazardous gas migration pathways in the tunnel. As gases migrated upward from deeper strata, they accumulated in joint fractures. This led to localized, short-term, high-volume outbursts. The gas discharge gradually stabilized 11 days after excavation, and this result agreed with the numerical predictions.
4.2.2. Analysis and Verification of the CO2 Concentration Variations
An analysis of the CO2 concentration variations in the advance boreholes and the right radial exploratory hole (Figure 12) showed that within the first 11 days of tunnel excavation, multiple monitoring points in each borehole reached the instrument’s maximum detection range of 50,000 × 10−6 mol/mol. This value far exceeded the standard limit of 5000 × 10−6 mol/mol for the CO2 concentration (Specification for Unfavorable Geological Condition Investigation of Railway Engineering (TB 10027-2022)). The CO2 here remained at high concentrations for an extended period during the initial 11 days of excavation. This suggested a nearby CO2 reservoir as the primary source [19].
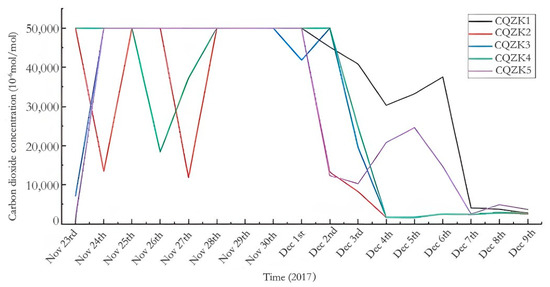
Figure 12.
CO2 gas concentration change trend diagram in the geological hole of the tunnel face.
The CO2 concentration gradually stabilized 11 days after excavation, and this was consistent with the numerical simulation results.
4.2.3. Comparison and Analysis of Numerical Simulation Results
Direct measurement of gas seepage velocity across the tunnel face was unfeasible due to its effusive emission pattern. As gas concentration in boreholes generally correlates with seepage velocity, the measured concentrations were used as a proxy to quantitatively assess the predictive accuracy of the numerical model. Specifically, the simulated joint seepage velocities were compared against the measured borehole gas concentrations.
The field monitoring data (from 23 November to 9 December 2017) were first converted into a time series with the initial monitoring day as day zero. Simulated seepage velocity data were aligned with the observation time points via linear interpolation. Since the observed concentrations and simulated velocities have different dimensions and numerical ranges, both datasets were normalized to the [0, 1] interval using min-max normalization to facilitate a trend consistency comparison (Figure 13).
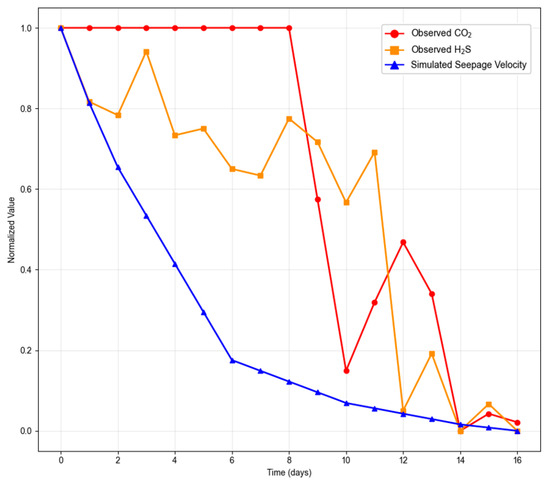
Figure 13.
The comparison and analysis curve graph of numerical simulation results.
Statistical metrics, including the Root Mean Square Error (RMSE) and Mean Absolute Error (MAE), were calculated. The 95% confidence intervals for these error metrics were estimated using the bootstrap resampling method (1000 repetitions) to evaluate statistical significance. The results showed moderate accuracy, with RMSE values of 0.483 (CO2) and 0.379 (H2S), and MAE values of 0.381 (CO2) and 0.290 (H2S). Despite this, the overall trends were consistent. The moderate error is likely attributed to the heterogeneous nature of gas emissions, which contrasts with the simplified homogeneous joint conditions assumed in the model.
4.3. Implications for Tunnel Engineering
The emission law for hazardous gases in the Hongdoushan Tunnel reveals that closely spaced joint zones pose the greatest risk when tunneling through strata with underlying gas sources. Consequently, the primary strategy during route selection should be to avoid fault-developed zones and high in situ stress regions, which are prone to such jointing. If avoidance is impossible, borehole gas sampling and testing during the investigation phase are essential to identify the primary gas components, informing the construction design. During construction, enhanced geological prediction (e.g., using TSP and GPR) must be employed to detect these joint zones. When encountered, hazards can be mitigated by reducing the excavation cross-section, intensifying ventilation, and performing radial grouting to seal fractures.
5. Conclusions
In this study, the hazardous gas emission patterns in non-coal-bearing stratum tunnels are investigated by analyzing the seepage velocity, direction, and their variations under the gas–solid coupling effects at different times and locations. The mechanisms and characteristics of hazardous gas emissions were examined and validated. Based on the numerical simulations and field verification, the following conclusions were drawn:
- (1)
- Hazardous gas emissions in tunnels are influenced by the pressure differential between the internal and external environments. A greater pressure difference leads to a higher emission rate. During tunnel excavation, this pressure difference arises from the high pressure of gas pockets and the low-pressure void created by excavation. The sudden formation of a low-pressure space during excavation causes high-pressure hazardous gases that have accumulated in the surrounding rocks to rapidly discharge into the tunnel, often resulting in gas outbursts.
- (2)
- The hazardous gas emission rate along joints remains relatively stable over time, whereas their seepage velocity through fractures in the surrounding rocks gradually decreases. The seepage velocity of hazardous gases in the surrounding rock sharply declines at joint locations, indicating that gases are primarily released through joints prior to entering the tunnel. This confirms that joints dominate the migration pathways of hazardous gases, with major transport routes occurring along geological structures such as joints and fractures in the rock strata.
- (3)
- The hazardous gas seepage velocity in tunnels decreases rapidly after excavation and stabilizes at a low level approximately 11 days post-excavation. This phenomenon suggests that gases that migrate upward from the deeper strata accumulate at joint fractures. This leads to localized, short-term, high-volume outbursts prior to gradual stabilization.
- (4)
- Analysis of hazardous gas emissions in the Hongdoushan Tunnel identifies closely spaced joint zones as the paramount hazard in gas-bearing strata. The optimal measure is to avoid these zones during alignment selection by steering clear of fault zones and high-stress areas. When unavoidable, pre-construction gas sampling and advanced geological forecasting (e.g., TSP, GPR) during excavation are critical. Mitigation measures include reducing the excavation section, enhancing ventilation, and applying radial grouting.
Author Contributions
Conceptualization, Y.L. (Yansong Li) and P.S.; Methodology, P.S.; Software, J.Y.; Resources, Y.L. (Yansong Li) and P.S.; Writing—original draft, Y.L. (Yougui Li); Writing—review & editing, P.S., L.L. and Y.L. (Yougui Li); Visualization, J.Y.; Supervision, W.L.; Project administration, Y.L. (Yansong Li), L.L. and W.L.; Funding acquisition, L.L. All authors have read and agreed to the published version of the manuscript.
Funding
This research received no external funding.
Data Availability Statement
The original contributions presented in this study are included in the article. Further inquiries can be directed to the corresponding author.
Conflicts of Interest
Author Yansong Li, Li Luo, Weihua Liu and Junjie Yang were employed by China MCC5 Group Corp., Ltd. The remaining authors declare that the research was conducted in the absence of any commercial or financial relationships that could be construed as a potential conflict of interest.
References
- Liu, W.; Shu, H.; Wu, G. Main engineering geology problems and geological railway location of Dali–Lincang railway. J. Railw. Eng. Soc. 2018, 35, 14–17. [Google Scholar]
- Du, Y.; Su, P.; Hu, X.; Jiang, X. Characteristics and rick assessment of harmful gases in geothermal anomaly area. J. Railw. Eng. Soc. 2020, 37, 19–23. [Google Scholar]
- Zhang, Z.; Yang, R. Prediction method for harmful gas in Tianping tunnel on Chongqing-Guiyang railway. Tunn. Constr. 2017, 37, 618–621. [Google Scholar]
- Morsali, M.; Rezaei, M. Assessment of H2S emission hazards into tunnels: The Nosoud tunnel case study from Iran. Environ. Earth Sci. 2017, 76, 227. [Google Scholar] [CrossRef]
- Ding, H.; Xu, M.; Yue, Z. Geological characteristics and distribution laws of harmful gas in Chengdu-Guiyang railway. Sci. Technol. Eng. 2018, 18, 309–314. [Google Scholar]
- Zhang, K.; Zheng, W.; Xu, C.; Chen, S. Risk assessment of gas outburst in tunnels in non-coal formation based on the attribute mathematical theory. Geomat. Nat. Hazards Risk 2019, 10, 483–504. [Google Scholar] [CrossRef]
- Jiang, G. Risk Assessment Analysis of Gas Emission on Tunnel in Construction. Master’s Thesis, Southwest Jiaotong University, Chengdu, China, 2014. [Google Scholar]
- Guo, P.; Chen, H.; Zou, Y.; Zhang, L.; Jing, C.; Wu, B.; Wen, L. Water-Mediated Competitive Adsorption and Desorption of CO2 and CH4 in Coal Seams Under Different Phase States: A Molecular Simulation Study. Processes 2025, 13, 2829. [Google Scholar] [CrossRef]
- Zhang, L.; Li, Y.; Sun, J.; Zhan, H. Research on flow field and gas transportation of construction ventilation in gas tunnel. Chin. J. Undergr. Space Eng. 2014, 10, 184–190. [Google Scholar]
- Zhang, X.; Fang, Y.; Peng, P.; Zhao, Z. Study on regularity of gas emission and diffusion at tunnel face during tunnel construction. J. Highw. Transp. Res. Dev. 2015, 32, 119–126. [Google Scholar]
- Wu, Y.; Yang, L.; Gou, H. Analysis of influencing factors of gas outburst intensity of tunneling face of gas tunnel and its control methods. Environ. Earth Sci. 2017, 37, 1262–1268. [Google Scholar]
- Tian, K.; Zheng, J.; Wang, X. Prediction of gas emission of tunnel under the influence of natural gas in oil reservoir and coal bed methane. Mod. Tunn. Technol. 2019, 56, 144–149. [Google Scholar]
- Su, P.; Lu, X.; Li, Y.; Qiu, P.; An, X. Study on Multi-factors Affecting Construction Ventilation in Hydraulic Tunnels with Gas in Tingzikou Irrigation Area. Mod. Tunn. Technol. 2024, 61, 180–191. [Google Scholar]
- Shen, Y.; Sun, S.; Sun, W.; Zhou, L.; Huang, Z. Understanding the Factors and Consequences of Gas Deflagration Accident in Metro Shield Tunnel: Site Investigation and Numerical Analysis. Buildings 2024, 14, 56. [Google Scholar] [CrossRef]
- Gao, Y.; Duan, Y.; Fu, R.; Wu, H.; Wang, Z.; Li, D.; Zhou, L. Research on Natural Gas Leakage and Explosion Mechanisms in a Container House. Buildings 2024, 14, 3752. [Google Scholar] [CrossRef]
- Li, T.; Li, M.; Jing, X.; Xiao, W.; Cui, Q. Mechanism of pore-scale anisotropy and pore distribution heterogeneity on permeability in porous media. Pet. Explor. Dev. 2019, 46, 569–579. [Google Scholar] [CrossRef]
- Xiong, F.S.; Gan, L.D.; Sun, W.T.; Yang, H.; Zhou, P.-Y. Permeability characterization and influencing factor analysis of fracture-pore media reservoirs. Chin. J. Geophys. 2021, 64, 279–288. [Google Scholar]
- Yang, T.; Li, B.; Ye, Q. Numerical study on permeability characteristics of coal around roadway based on gas-solid coupling model for gassy coal. Int. J. Min. Sci. Technol. 2018, 28, 925–932. [Google Scholar] [CrossRef]
- Gan, Q.; Elsworth, D.; Zhao, Y.; Grippa, A.; Hurst, A. Coupled hydro-mechanical evolution of fracture permeability in sand injectite intrusions. J. Rock Mech. Geotech. Eng. 2020, 12, 742–751. [Google Scholar] [CrossRef]
- Lyu, C.; Liu, J.; Ren, Y.; Liang, C.; Zeng, Y. Mechanical characteristics and permeability evolution of salt rock under thermal-hydro-mechanical (THM) coupling condition. Eng. Geol. 2022, 302, 106633. [Google Scholar] [CrossRef]
- Zhang, X.; Cai, J.; Liao, Y. Characteristics analysis and forecast evaluation of gas occurrence of the Longquanshan tunnel on Chengdu metro. Mod. Tunn. Technol. 2019, 56, 25–30. [Google Scholar]
- Zhou, S.; Sun, J. Coal bed gas flow theory and application. J. China Coal Soc. 1965, 1, 26–39. [Google Scholar]
- Yao, H.; Du, Y.; Zhang, W.; Gao, F. Study on safety thick-ness of surrounding rock in excavation face of gas tunnel in oil and gas field. J. Saf. Sci. Technol. 2020, 16, 168–174. [Google Scholar]


Disclaimer/Publisher’s Note: The statements, opinions and data contained in all publications are solely those of the individual author(s) and contributor(s) and not of MDPI and/or the editor(s). MDPI and/or the editor(s) disclaim responsibility for any injury to people or property resulting from any ideas, methods, instructions or products referred to in the content. |
© 2025 by the authors. Licensee MDPI, Basel, Switzerland. This article is an open access article distributed under the terms and conditions of the Creative Commons Attribution (CC BY) license (https://creativecommons.org/licenses/by/4.0/).