Abstract
Despite growing interest in carbon capture and utilization (CCU), the transformation of captured CO2 into dry ice remains poorly studied, particularly from a systems integration and energy optimization perspective. While previous works have examined individual components such as CO2 absorption, liquefaction, or refrigerant evaluation, no existing study has modeled the full dry ice production chain from capture to solidification within a unified simulation framework. This study presents the first complete simulation and optimization of a dry ice production process, incorporating CO2 absorption, solvent regeneration, dehydration, multistage compression, ammonia-based external liquefaction, and expansion-based solidification using Aspen HYSYS. The process features ammonia as a working refrigerant due to its favorable thermodynamic performance and zero global warming potential. Optimization of heat integration reduced total energy consumption by 66.67%, replacing conventional utilities with water-based heat exchangers. Furthermore, solvent recovery achieved rates of 75.65% for MDEA and 66.4% for piperazine, lowering operational costs and environmental burden. The process produced dry ice with 97.83% purity and 94.85% yield. A comparative analysis of refrigerants confirmed ammonia’s superiority over R-134a and propane. These results provide the first system-level roadmap for producing dry ice from captured CO2 in an energy-efficient, scalable, and environmentally responsible manner.
1. Introduction
As global efforts intensify to mitigate climate change, carbon capture and utilization (CCU) has emerged as a cornerstone of industrial decarbonization strategies [1,2]. While much research has focused on converting CO2 into chemicals like methanol, urea, or formic acid, physical utilization pathways remain comparatively neglected [3]. One such pathway, solid CO2 production, commonly known as dry ice, holds significant industrial and environmental promise.
Dry ice plays a pivotal role in sectors such as pharmaceutical logistics, food preservation, cold chain transportation, industrial cleaning, and biomedical applications [4,5]. Its non-toxic, non-residual, and energy-dense properties make it ideal for critical temperature-sensitive processes [4]. Moreover, with anticipated global growth in vaccine distribution, cold storage logistics, and green sanitation solutions, the demand for dry ice is expected to rise sharply, from 587.7 million USD in 2022 to 936.9 million USD by 2030 [4,6,7]. Unlike chemical CCU processes, dry ice production offers a near-immediate, low-barrier commercialization route by transforming captured CO2 into a value-added product with existing market infrastructure [8]. This makes it a uniquely viable CCU pathway, especially in regions with surplus CO2 emissions [2,7]. Yet, despite its practicality and growing importance, dry ice remains significantly underrepresented in academic and simulation-based CCU studies [1,3].
One of the most scalable and energy-efficient CO2 feedstocks for dry ice production is sour natural gas (NG), which contains 5–50% CO2 and has worldwide reserves exceeding 7200 trillion cubic feet (tcf), particularly in the Middle East and North America [9]. Processing NG streams for CO2 capture enables not only greenhouse gas mitigation but also resource valorization [10]. Most of the existing literature focuses on the chemical absorption of CO2 using solvents like monoethanolamine (MEA) or methyldiethanolamine (MDEA) [11], or blending with other organic compounds such as piperazine (PZ) [12]. Nevertheless, these studies typically end at the regeneration column [10,11]. They rarely consider how solvent performance, degradation, or recovery rates impact downstream liquefaction or final solidification performance [12,13]. Furthermore, the energy interplay between units such as compression heat recovery or solvent–water phase interactions is often excluded, limiting the usefulness of current models for full-system optimization [14,15].
Liquefaction represents the critical interface between gas capture and dry ice formation [16,17]. CO2 liquefaction can be achieved through internal refrigeration using CO2’s own expansion or through external systems that rely on refrigerants like ammonia (NH3), propane (C3H8), or carbon dioxide (R-744) [5,18]. Nevertheless, ammonia has emerged as a good candidate due to its excellent thermodynamic performance, negligible global warming potential (GWP), and cost-effectiveness [18,19]. While internal systems provide theoretical energy advantages, they tend to suffer from complexity and poor scalability [7,16]. Industrial operations increasingly favor external cycles for their stability, controllability, and robustness [19,20,21,22]. However, most existing simulations focus narrowly on energy metrics without addressing refrigerant influence on CO2 purity, solvent entrainment, or moisture removal, each of which critically affects the feasibility of subsequent solidification [18].
The final stage in dry ice production is the solidification of liquid CO2 into its solid form, commonly referred to as dry ice [22]. This transformation typically occurs through Joule–Thomson expansion, where liquid CO2 is rapidly depressurized across a valve, resulting in a temperature drop that causes part of the liquid to flash into gas while the remaining portion crystallizes into solid CO2 [23]. The efficiency of this phase change depends on several factors, including inlet temperature, expansion pressure, and the purity of the liquid stream [6]. Trace amounts of water or solvent residues can lead to undesirable solid behavior, such as clumping or altered grain structure, which can affect handling, storage, and the sublimation rate [3]. Therefore, maintaining optimal upstream conditions is crucial for achieving high-quality dry ice with consistent yield and performance [3].
Although some progress has been made in modeling individual capture or liquefaction, the literature still lacks a unified framework that connects gas treatment, solvent handling, compression, liquefaction, and dry ice formation [1,17]. Recent Aspen-based CCU simulations, such as integrated liquefaction–solidification models and cryogenic capture schemes, have advanced the field but remain limited in scope, as they generally neglect absorber column design, heat integration strategies, or solvent degradation effects within a single optimization framework [16,18,21]. This study addresses that gap by presenting the first end-to-end simulation of dry ice production from sour natural gas, using an external ammonia-based liquefaction cycle in Aspen HYSYS V15. The model captures every major stage of the process: chemical absorption of CO2, solvent regeneration and recycling, dehydration, compression, liquefaction, and final Joule–Thomson expansion into solid CO2. Through this comprehensive design, the work enables a full thermodynamic and operational evaluation of the system under industrially relevant conditions. Key performance metrics, including energy consumption, solvent loss, CO2 purity, and dry ice yield, are analyzed in an integrated manner to identify optimization opportunities that cannot be detected in isolated models.
2. Selection of Feedstock, Solvent, and CO2 Capture Method
The foundation of an efficient dry ice production system lies in the informed selection of the upstream pathway, beginning with the carbon dioxide source and extending through solvent and capture technology [1,2]. These elements determine the purity, energy profile, and operational feasibility of the downstream liquefaction and solidification processes [12]. To rationalize the process configuration adopted in this study, a detailed comparative evaluation was conducted of several potential feedstocks, solvent systems, and capture methods, focusing on their compatibility with high-purity solid CO2 applications.
The suitability of each CO2 source depends on factors such as concentration, impurity profile, availability, and the intensity of pre-treatment required [1,2]. Flue gas, while abundant, presents low CO2 concentration and high impurity levels including nitrogen oxides, sulfur oxides, oxygen, and water vapor, which complicate capture and conditioning [23,24]. Fermentation off-gas streams offer nearly pure CO2, but their limited availability and seasonal nature restrict scalability [25,26]. Biogas sources present moderate CO2 concentrations and a manageable impurity profile, yet their industrial deployment remains geographically constrained [26,27]. In contrast, natural gas reserves containing CO2, commonly referred to as sour gas, combine high CO2 partial pressure with stable availability, minimal oxygen content, and compatibility with existing absorption technologies [9]. As shown in Table 1, sour gas emerges as the most balanced and industrially viable option for integration into dry ice production systems.
Following feedstock selection, the choice of solvent must align with the goal of achieving high CO2 capture rates with low regeneration energy and chemical stability across multiple cycles (Table 1). Monoethanolamine (MEA), though widely applied, is hindered by high thermal regeneration demand and corrosivity [24]. Diethanolamine (DEA) and methyldiethanolamine (MDEA) offer incremental improvements, but it is the synergistic blend of MDEA with piperazine (PZ) that has shown the most promise [11]. This formulation combines the low regeneration heat of MDEA with the fast kinetics and strong nucleophilicity of PZ, allowing for higher CO2 loading and improved absorption rates [28,29]. In systems targeting solid CO2 formation, where downstream compression and moisture control are critical, the thermal stability and minimal solvent degradation of MDEA + PZ blends offer distinct advantages over single-amine systems [30].
In parallel, various CO2 capture techniques were examined with respect to their performance, energy intensity, and integration potential with dry ice manufacturing (Table 1) [31]. Chemical absorption with amines is the most established pathway and is particularly robust against moisture and pressure fluctuations [32]. Physical adsorption methods provide lower energy operation but are highly sensitive to humidity and exhibit reduced performance under dynamic flow conditions [33]. Membrane-based separations, though promising for compact design, suffer from fouling and limited industrial validation in high-moisture environments [34]. Cryogenic separation technologies, while capable of delivering highly pure CO2, require significant refrigeration duty and are better suited for niche or small-volume operations where energy costs are secondary to product purity [35].
For biogas, the absorber requires the largest redesign owing to the lower CO2 partial pressure, which necessitates higher solvent circulation or an increased packing height, together with additional pretreatment (e.g., H2S and siloxane removal) [36]. The compression train would also need more stages and intercooling for the lower inlet pressure. In contrast, for fermentation off-gas (very CO2 rich), the capture section could be simplified or replaced by polishing units, shifting the major redesign burden to compression and liquefaction, which would need to handle low-pressure, high-purity CO2 [37]. Thus, heat-integration and solvent-recovery subsystems would be scaled down accordingly.
These technologies are summarized and compared across critical decision parameters in Table 1.

Table 1.
Comparative evaluation of feedstocks, solvents, and capture methods for dry ice production.
Table 1.
Comparative evaluation of feedstocks, solvents, and capture methods for dry ice production.
| Category | Options | CO2 Purity | Key Impurities | Availability | Energy Requirement | Suitability for Dry Ice Production | Ref. |
|---|---|---|---|---|---|---|---|
| Feedstock | Flue Gas | 8–15% | NOx, SOx, H2O, O2 | Widely available | High | Low | [38] |
| Fermentation Gas | ~100% | Minimal | Low to moderate | Low | Moderate | [39] | |
| Natural Gas (Sour Gas) | 20–70% | CH4, H2S | High | Moderate | High | [40] | |
| Biogas | 35–55% | CH4, H2O, H2S | Moderate | Moderate | Moderate | [40] | |
| Solvent | Monoethanolamine (MEA) | Low | High | Low maturity for solid CO2 integration | High | High | [41] |
| Diethanolamine (DEA) | Moderate | High | Moderate | Moderate | High | [41] | |
| Methyldiethanolamine (MDEA) | High | Low | High | Low | High | [41] | |
| MDEA + Piperazine (PZ) Blend | Very high | Low | High (emerging in CO2-to-solid systems) | Moderate | High (emerging) | [41] | |
| Capture Method | Chemical Absorption (Amines) | High | Low | Moderate | High | High | [42] |
| Physical Adsorption | Moderate | Highly sensitive to humidity | Low | Moderate | Moderate | [43] | |
| Membrane Separation | Moderate | Highly sensitive to impurities/ fouling | Low to moderate | Limited | Low | [43] | |
| Cryogenic Separation | Very high | Low impurity sensitivity | Very high capital cost | High | Moderate to high | [42] |
Based on the collected evidence, natural gas (sour gas) was selected as the CO2 feedstock, and chemical absorption using MDEA blended with piperazine was chosen as the capture approach (Figure 1). This integrated configuration offers high-purity CO2 at moderate energy cost, stable operation under industrial conditions, and direct compatibility with downstream liquefaction using ammonia refrigeration and solidification via Joule-Thomson expansion.
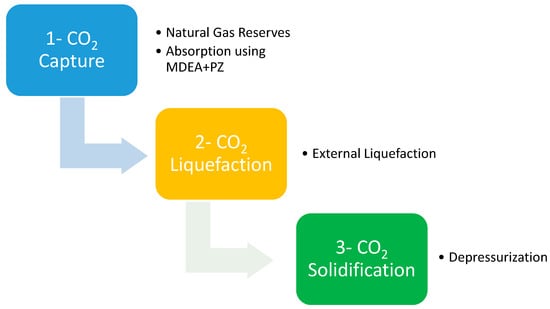
Figure 1.
Dry ice production pathway.
The process selection adopted for the simulation study is schematically represented as Figure 1.
This configuration reflects a balance between technical maturity, energy efficiency, and product quality control, and forms the basis for the detailed simulation and performance analysis that follows.
While the current design is tailored for sour natural gas (20–50% CO2), its applicability to feeds with lower CO2 concentrations, such as flue gas at 8–15% CO2 or diluted biogas, requires additional adaptation. At such concentrations, a pretreatment unit such as selective membranes or pressure swing adsorption (PSA) is often introduced upstream to enrich CO2 and reduce energy penalties in the absorber [44,45]. Lower CO2 partial pressure also increases solvent circulation and column sizing requirements, raising both capital and operating costs [46]. Future work should therefore extend the simulation to compare performance under multiple feed scenarios, including flue gas and biogas, in order to quantify trade-offs in energy consumption, solvent recovery, and compression duty.
3. Dry Ice Production Process Simulation
The dry ice production process was simulated in Aspen HYSYS and divided into three sequential stages: (1) CO2 capture from natural gas using an amine-based absorption system, (2) external liquefaction of the recovered CO2, and (3) its solidification into dry ice. These stages reflect the full operational pathway of industrial dry ice manufacturing, from gas treatment to product formation.
3.1. Simulation Methodology for CO2 Capture, Liquefaction and Solidification
Aspen HYSYS was employed to simulate each stage with industrially relevant parameters, reflecting practical conditions for energy efficiency, solvent recovery, and equipment sizing. Detailed descriptions of the process design, thermodynamic models, and operating conditions are presented in the following subsections.
3.1.1. Fluid Package Selection
The simulation of dry ice production on Aspen HYSYS requires the selection of a thermodynamically accurate fluid package that can handle both chemical equilibrium and physical phase behavior over a wide range of temperatures and pressures. In this study, the Acid Gas Property Package was used, as it is specifically developed for systems involving amine-based gas treating, such as MDEA/Piperazine blends used for selective CO2 and H2S removal [12]. This package utilizes a combination of Peng–Robinson Equation of State for vapor–liquid equilibrium (VLE) modeling and the Kent–Eisenberg model for amine–acid gas chemical reactions, allowing for accurate prediction of reaction kinetics, solvent loading, and regeneration behavior [47]. It is also well-suited for predicting phase equilibria in systems with multiple chemical species including light hydrocarbons, water, CO2, and H2S [48]. The Acid Gas-Chemical Solvent model enables integration of both physical and reactive thermodynamics, which is essential for capturing the interaction between CO2 and the blended solvent across the absorber and stripper [49]. Additionally, this package supports temperature-dependent heat capacity, enthalpy, and density estimations, which are critical for energy and heat integration analysis across liquefaction and solidification stages [50]. By selecting this fluid package, the simulation ensures consistency and reliability across the full process chain, from the high-pressure gas absorption to low-temperature CO2 phase transitions, thus enhancing the accuracy of energy consumption and solvent recovery estimations [47].
3.1.2. Feed Stream Specifications
The simulation of the dry ice production process begins with the definition of the feed gas and solvent streams, as these determine the basis for the CO2 capture and subsequent liquefaction steps. The sour gas feed is modeled to reflect a typical natural gas stream containing a high concentration of CO2 alongside methane and other hydrocarbons. This composition mirrors the those found in certain gas processing or industrial waste streams that are rich in acid gases, particularly CO2 [39,40]. The accurate definition of mass fractions for each component in the feed stream is essential, as it affects not only the capture efficiency but also the separation behavior during the liquefaction phase [1]. Similarly, the solvent stream is carefully designed to include a blend of MDEA (methyldiethanolamine) and piperazine (PZ), a combination widely recognized for its high CO2 absorption efficiency and thermal stability under operating conditions typical of industrial gas sweetening units [11]. The use of MDEA provides a low regeneration energy requirement due to its weak base nature, while piperazine enhances the overall absorption rate, acting as an activator [11]. This synergistic blend has shown excellent performance in CO2 capture systems with a balance between absorption kinetics and energy efficiency during regeneration [51,52].
Table 2 presents the composition and operating conditions of the sour gas and solvent feed streams, which form the input basis for all downstream operations. The feedstock composition used in this study is based on a typical Middle Eastern NG reserve, specifically the CO2-rich gas fields of the South Pars/North Dome region, which are known to contain exceptionally high volumes of natural gas and condensate [9]. Based on one of the biggest CO2-heavy gas reservoirs in the world, this representative feed composition guarantees accurate modeling of a high-acid gas stream and is in line with the industrial factors prevalent in large-scale gas processing facilities.
Table 2.
Composition and operating conditions of the sour gas and solvent feed streams.
3.2. Simulation of CO2 Capture via Amine Absorption
The capture of carbon dioxide (CO2) from sour gas was modeled using an amine-based chemical absorption process, recognized as one of the most mature and widely deployed post-combustion CO2 separation techniques [53]. In this simulation, the process is executed within a packed absorber column in Aspen HYSYS, utilizing a blended amine solvent composed of methyldiethanolamine (MDEA) and piperazine (PZ).
The process begins with the (Sour Gas) stream entering a separator, where heavier hydrocarbon liquids are removed. This results in two output streams: (Gas Out) and (Liq Out). The (Gas Out) stream continues toward the absorber section, where CO2 and H2S removal is achieved. The (Gas Out) stream enters the absorber from the bottom at a temperature of 30 °C and a pressure of 6895 kPa, while the amine solvent represented by the (Solvent Feed) stream enters the top of the column at 1996 kPa. The solvent blend consists of MDEA, a tertiary amine offering a low heat of regeneration and oxidative stability, and PZ, a fast-reacting cyclic diamine that serves as a rate promoter, significantly enhancing the absorption kinetics [11]. The use of the MDEA/PZ blend offers notable benefits, including lower reboiler duty, enhanced CO2 absorption kinetics, and higher cyclic capacity compared to single-component solvents like MEA [20,22]. Furthermore, the solvent regeneration temperatures and stripper operating pressures align with industry standards, ensuring energy efficiency and minimizing solvent degradation [54]. Within the absorber, acid gases (primarily CO2 and H2S) are chemically absorbed by the amine solution in a countercurrent flow configuration. After contact, the (Sweet Gas) stream exits from the top of the absorber, now free of CO2 and H2S. Simultaneously, the solvent, now rich in acid gases, is extracted from the bottom as (Rich Amine) at a pressure of 2000 kPa. The (Rich Amine) stream is next routed through a pressure-reducing valve, where the pressure drops from 2000 kPa to 620 kPa, then enters a flash tank to remove dissolved or entrained light gases. The exiting (Rich to L/R) stream is heated to 80 °C using a pre-heater and directed to a stripper column for solvent regeneration. In the stripper, heat is applied through a reboiler to release the absorbed acid gases. The acid gas stream exits the top of the stripper at 341 °C and 189.6 kPa, while the regenerated lean amine exits from the bottom and is cooled to 43 °C, mixed with make-up water, and recycled back into the process loop.
The key operational parameters of the stripper unit are summarized in Table 3.
Table 3.
Stripper operating conditions.
The complete simulation of the CO2 capture process, including the pre-treatment, absorption, and regeneration stages, is illustrated in Figure 2.
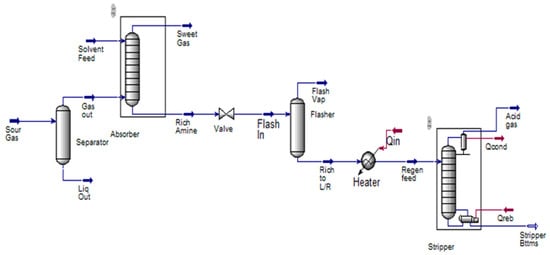
Figure 2.
CO2 capture process simulation.
Chemical Reactions of MDEA and Piperazine with CO2
The absorption of carbon dioxide using aqueous amine solvents involves acid-base reactions where CO2 reacts with water and amine groups to form carbamates or bicarbonates, depending on the type of amine [44,45]. In this simulation, a blended amine solution of methyldiethanolamine (MDEA) and piperazine (PZ) were used to enhance CO2 absorption kinetics and solvent regeneration performance [43,45,46]. MDEA is a tertiary amine and reacts with CO2 indirectly via the formation of bicarbonate ions through hydration and proton transfer, while piperazine, a cyclic diamine, reacts directly to form carbamate species due to its primary and secondary amine groups [52].
The major reaction pathways for CO2 absorption in this mixed amine system are:
- CO2 Hydration and Bicarbonate Formation (MDEA):CO2 + H2O ⇌ H+ + HCO3−HCO3− + MDEA ⇌ MDEAH+
Here, MDEA acts as a base, accepting protons and facilitating CO2 dissolution via bicarbonate formation.
- 2.
- Carbamate Formation (Piperazine):CO2 + PZ ⇌ PZCOO− + H+PZCOO− + H+ + PZ ⇌ PZ(COOH) + PZH+
These reactions illustrate piperazine’s role in enhancing reaction kinetics, especially at low CO2 partial pressures, which is beneficial in flue gas or sour gas treatment scenarios [55].
The synergy between MDEA’s high CO2 loading capacity and piperazine’s fast reaction kinetics makes this blend optimal for industrial CO2 capture [56]. Additionally, this mixture shows excellent thermal stability and lower degradation rates compared to monoethanolamine (MEA), contributing to its cost-effectiveness and environmental viability [56].
3.3. Simulation of CO2 Liquefaction via External Liquefaction
Once separated from the gas stream via amine absorption, the high-purity CO2 is directed through a multi-stage liquefaction and solidification sequence, comprising compression, heat exchange, separation, and expansion stages. In this simulation, an external liquefaction configuration was adopted over internal cycles due to its operational flexibility, lower capital complexity, and higher thermodynamic efficiency in medium-to-large-scale dry ice production facilities [6]. After compression and pre-cooling, the CO2 enters an indirect refrigeration loop where it is condensed into liquid form. Ammonia (NH3) was selected as the refrigerant owing to its high latent heat of vaporization, superior coefficient of performance (COP), zero ozone depletion potential (ODP), and negligible global warming potential (GWP < 1), aligning with industrial sustainability goals [21,48,49]. Compared with alternatives such as R-134a and propane (C3H8), ammonia demonstrated better cooling efficiency and environmental performance, with reduced energy input required to reach the cryogenic conditions necessary for CO2 liquefaction [22].
The ammonia refrigeration cycle, modeled in Aspen HYSYS, consisted of a compressor, condenser, expansion valve, and evaporator. Within the evaporator, ammonia absorbed heat from the CO2 stream, lowering its temperature below the condensation threshold at the given pressure. The target liquefaction point was −56.4 °C at 5.18 bar, in accordance with the CO2 phase diagram. This indirect heat exchange approach enabled precise temperature control and minimized refrigeration penalties, with validation performed using real fluid properties and accounting for pressure drops throughout the system [27,31]. The resulting liquid CO2 stream was subsequently routed to downstream storage or directly to the solidification stage for dry ice formation.
External Liquefaction Configuration
The simulation of the CO2 liquefaction process is illustrated in Figure 3. As shown, the process begins with the Acid Gas stream, obtained from the CO2 capture unit, entering a compression stage where its pressure is increased from 189.6 kPa to 800 kPa. This compression enhances the thermodynamic feasibility of liquefaction by reducing the gas volume and elevating the saturation temperature [57,58,59]. Due to adiabatic compression, the temperature of the outlet stream (Comp Out) rises significantly to 570.4 °C. A shell-and-tube cooler (Cooler 3) is employed to reduce this temperature to 40 °C. This step is critical for avoiding thermal degradation and ensuring the heat exchanger operates under stable conditions [10]. Following this, the stream, now termed “Cooled Gas” is directed into a cryogenic heat exchanger (HX) where it undergoes liquefaction. The liquefaction step is enabled by an external refrigeration cycle using ammonia (NH3) as the refrigerant. In the heat exchanger (HX) unit, the temperature of the CO2 stream is reduced from 40 °C to −50 °C under the maintained pressure of 800 kPa, resulting in the complete liquefaction of CO2. The final stream (Liq CO2), with a mass flow rate of 9971.008 kg/h, is collected and directed toward downstream storage or further processing units. The refrigeration cycle operates independently, using compression-condensation-expansion phases of ammonia to provide the necessary cooling capacity [59].
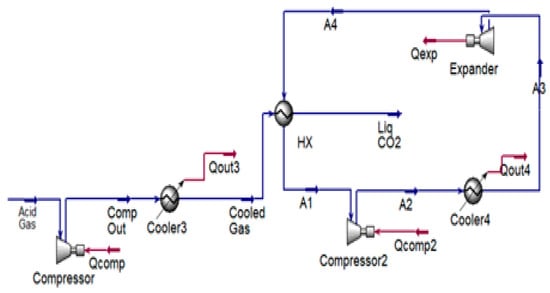
Figure 3.
CO2 liquefaction process simulation.
3.4. CO2 Solidification and Dry Ice Production
Once the liquefied CO2 (Liq CO2) reaches the desired sub-cooled conditions at −50 °C and 700 kPa, it is directed toward the solidification stage to produce dry ice. The transformation from liquid to solid is achieved through a rapid pressure reduction across a control valve, simulating the Joule–Thomson (JT) effect where gas expansion without heat exchange causes significant cooling due to enthalpy conservation [60]. The liquefied CO2 exiting the liquefaction process is passed through a JT valve (Simulated as Control Valve), where its pressure drops from 700 kPa to 175 kPa, and its temperature falls accordingly from −50 °C to −78 °C, reaching its sublimation point. Under these conditions, CO2 transitions from a liquid to a solid–gas mixture, forming snow-like dry ice (Snow CO2) [61]. If immediate solidification is not operationally required, the liquefied CO2 can be diverted to insulated storage tanks (Storage Tank Stream) at −20 °C and ~20 bar. This allows temporal decoupling between liquefaction and solidification, improving operational flexibility for industries like food preservation, pharmaceutical logistics, or chemical processing [62]. The snow-like CO2 is subsequently collected and fed to mechanical pressing units, where it is compressed into commercial-grade dry ice [63]. The mechanical compression of the snow CO2 requires only moderate pressure and short residence time, making it one of the most energy-efficient process steps. No external heating or chemical additives are necessary, only mechanical force is applied to ensure compaction and avoid premature sublimation [64]. Simulation results confirm a conversion efficiency of 97.83% from the (Liq CO2) stream to solid CO2, with minimal gas losses. Furthermore, any vaporized CO2 can be recycled by reintroducing it into the liquefaction loop, ensuring a near closed-loop operation with reduced emissions and minimal waste [65].
After integrating all the previously described stages from CO2 capture to liquefaction and solidification, the complete dry ice production process was established. Figure 4 presents the full simulation layout prior to any optimization, as modeled in Aspen HYSYS, highlighting all major process units and interconnections.
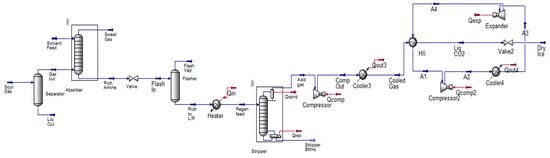
Figure 4.
Complete dry ice production process simulation.
3.5. Absorber Design and Parallel Configuration
The absorber is a key component in the CO2 capture process, as it facilitates the mass transfer of CO2 from the gas phase into the solvent phase [66,67,68]. In this study, the absorber design was carefully tailored based on operational flow rates, solvent properties, and the constraints of industrial-scale feasibility.
3.5.1. Packing Type Selection
In the context of CO2 capture using MDEA and PZ as solvents, packed columns provide many advantages over tray columns. Thereby, packed columns offer a larger area for mass transfer, which improves absorption’s efficiency particularly for processes such as CO2 absorption [69]. In addition, packed towers perform at lower pressure drops than tray towers, making them suitable for large volumetric gas flows [29,30]. Eventually, packed columns are proven to be more compact having lower capital and maintenance costs making them more beneficial for CO2 capture systems [70].
Packing materials are crucial in the absorption process, importantly affecting pressure drop, mass transfer efficiency and flooding behavior [69]. The selection of the appropriate packing material is essential as it affects the performance in the CO2 capture process. Table 4. below represents the most used types of packing materials.
Table 4.
Comparative table of packing types.
For CO2 capture using (MDEA + PZ), Ceramic Raschig Rings turn out to be the most suitable choice, as it provides low pressure drop and high mass transfer efficiency, which is ideal for absorbers performing under continuous operations [71].
3.5.2. Absorber Diameter and Flow Considerations
Given the elevated volumetric flow rates involved in the system, stemming from the high rate of sour gas input, an initial evaluation revealed that relying on a single absorber would result in a required column diameter that exceeds the conventional industrial limits [72]. This would not only introduce structural challenges but also pose risks related to pressure drops and inefficient contact between the gas and solvent phases [72].
To address this limitation, a parallel configuration consisting of two identical absorbers was selected. This approach ensures that each absorber operates within a manageable diameter, distributes the flow evenly, and maintains effective gas–liquid interaction [73]. Parallel absorption columns are a widely accepted strategy in large-scale gas treatment applications as they enhance operational flexibility, improve mass transfer efficiency, and reduce the pressure drop per column [72]. The optimum absorber diameter was determined using the pressure-drop curves developed by Eckert as shown in Figure 5.
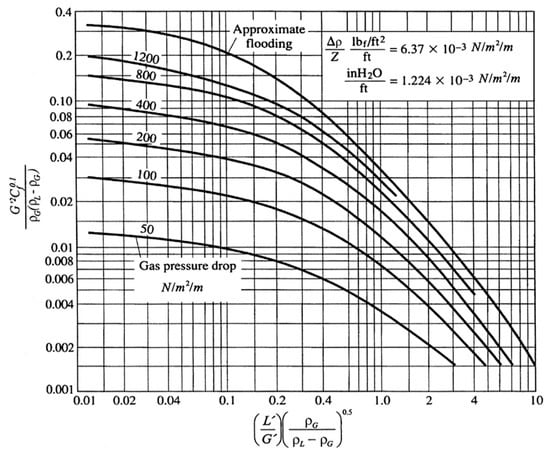
Figure 5.
Pressure-drop curves.
Table 5 presents the key parameters employed in calculating the diameter of the absorber column.
Table 5.
Parameters of the streams exiting the absorber.
To initiate the flooding velocity calculation, the first step involves determining the value of the abscissa:
Then, using the pressure-drop curve, the corresponding ordinate is obtained as:
Afterwards, the flooding velocity is calculated, and 80% of its value is used to ensure optimal and safe operating conditions: .
Finally, the diameter of the absorption column is determined using the following formula, which relates the volumetric gas flow rate to the flooding velocity and column cross-sectional area:
where
being the packing factor of the chosen packing material, in this case: .
being the ratio downcomer area to tray area.
Therefore, .
The unusually large diameter of 17.3 m calculated for the absorption column stems from the elevated inlet flow rate, which leads to oversizing and operational impracticality [72]. According to industrial design guidelines, the maximum feasible diameter for packed absorption towers typically ranges between 9 and 13 m, with 12.8 m considered the upper limit for safe and efficient operation in large-scale applications [32,33]. Consequently, using a single absorber would be technically infeasible. To address this, the system design incorporates two parallel absorbers, thereby distributing the flow evenly and reducing the individual column diameters to manageable dimensions. The diameters for each absorber were calculated using the same methodology previously described, with the resulting values presented in Table 6 below.
Table 6.
Diameter calculation for each absorber.
3.5.3. Sensitivity of Absorber Diameter to Flooding Velocity and Packing Assumptions
To assess whether the absorber diameter is overly sensitive to column design assumptions, we quantified how the calculated diameter varies with (i) the fraction of flooding velocity used for design (where f is the design flooding fraction, U is the superficial gas velocity, Uop the operating superficial gas velocity, and Uflood the flooding superficial gas velocity) and (ii) the packing factor/capacity of the internals (Fp). For a given volumetric gas rate Qg, the packed-tower diameter D is obtained from:
Thus, diameter scales inversely with the square root of the chosen operating velocity:
The baseline result in this work (single column, D = 17.3 m) used Ceramic Raschig rings (nominal Fp = 120 m−1) at f = 0.80. Two sensitivity studies were performed: (1) variation in f at fixed packing (Fp = 120 m−1), and (2) variation in packing factor (Fp = 60–150 m−1) at fixed f = 0.80. We generated two sensitivities around this baseline:
- Approach to flooding (f) at fixed packing (Fp = 120 m−1)
- Packing capacity (represented here by packing factor Fp within the same family of random packings) at fixed f = 0.80.
Diameter Sensitivity Results
We report absolute diameters (Dnew) by scaling from the baseline (17.3 m at Fp = 120, f = 0.80) using the relationship:
where
- D0 = baseline column diameter (17.3 m)
- Fp,0 = baseline packing factor
- Fp,new = packing factor under the new condition
- f0 = baseline design fraction of flooding
- fnew = design fraction of flooding under the new condition
Table 7 shows the sensitivity of absorber diameter to packing factor and design flooding fraction.
Table 7.
Sensitivity of absorber diameter to packing factor (Fp) and flooding velocity assumptions.
Takeaways:
- Reasonable design choices for f (0.60–0.85) shift D by 10–15% at fixed packing.
- Staying within the random packing family, changing ring size (approximated by Fp= 60–150 m−1) moves D by roughly −30% to +12% versus baseline.
In conclusion, while both factors matter, neither alone collapses the single-column diameter from 17.3 m to a clearly feasible number. Therefore, parallelization (2–3 columns) and/or higher-capacity packing are practical levers.
“What-If” with Higher-Capacity Structured Packing
For structured/high-capacity packing, vendor capacity parameters typically indicate +20–40% higher allowable operating velocity at comparable L/G. If increases by +30%, then:
Combined with a modestly higher approach to flooding (e.g., f = 0.85 with enhanced maldistribution control), diameter would further reduce by √(0.80/0.85) ≈ 0.972 to ~14.8 m.
Implications for Parallel Trains
Because area splits linearly, N identical columns reduce diameter as . Using a realistic scenario from the table above (e.g., Fp = 80, f = 0.85, D = 13.73 m):
- Two columns: (within common industrial limits).
- Three columns: .
This confirms the manuscript’s design choice to adopt parallel and shows quantitatively how packing selection and fraction of flooding influence sizing.
3.5.4. Column Height
The height of the column (H) is determined using the following formula:
where
being the number of trays.
being the distance between each equivalent theoretical stage.
Typically, a height equivalent to a theoretical stage of 0.6096) meters is commonly adopted for Ceramic Raschig Rings (25–50 mm), as it provides adequate space for gas–liquid contact and improves absorption efficiency, particularly important for large-diameter columns [69].
Thus, the height of Absorber 1 and Absorber 2 is calculated as follows: .
Figure 6 illustrates the final design configuration of the parallel absorbers following the system adjustment for high inlet flow rate constraints.
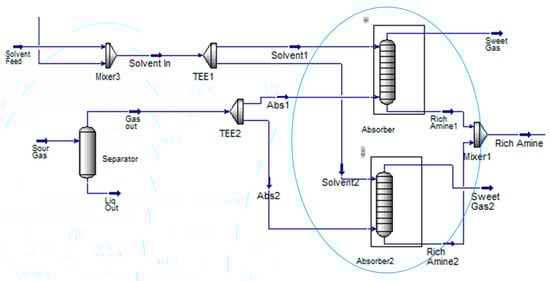
Figure 6.
Absorbers’ design after optimization.
3.5.5. Packing Weight
After determining both the diameter and height of the absorber, the total weight of the packing material can subsequently be calculated:
3.6. Heat-Exchanger Network (HEN) Aassumptions
Process–process matches were designed with a minimum approach temperature of ΔTmin = 10 K; a reduced ΔTmin = 5 K was allowed only across phase-change services (condensation/evaporation). Utility approaches were 8–10 K for cooling water, ~5 K for chilled-water/chiller evaporator, and ~3 K for refrigeration condenser. Exchanger types: plate-fin for gas/gas and low-temperature duties; shell-and-tube for liquid/liquid and condensing services. Pressure-drop limits per exchanger were ≤40 kPa (gas side, plate-fin) and ≤30 kPa (liquid side, shell-and-tube), with cumulative network drops ≤ 120 kPa (gas) and ≤80 kPa (liquid). These ΔTmin and ΔP constraints were enforced during targeting and network synthesis; the associated compression and pumping penalties are reflected in the reported utilities.
4. Process Modeling of Dry Ice Production
This section presents the simulation results of the dry ice production process and analyzes the effects of various operational parameters and material selections. Case studies focus on evaluating the impact of solvent choice and operating temperature on CO2 absorption efficiency, with comparative insights supported by literature findings and industrial relevance. The analysis aims to guide solvent selection and process optimization for enhanced dry ice production performance.
4.1. Effect of MDEA and Piperazine Solvents on CO2 Mass Fraction
The effectiveness of CO2 absorption depends significantly on the chemical composition and thermophysical behavior of the solvent system. In this study, two solvent systems were compared: methyldiethanolamine (MDEA) alone and MDEA blended with piperazine (PZ). Figure 7 shows the variation in CO2 mass fraction in the acid gas stream as a function of absorber inlet temperature for both solvents.
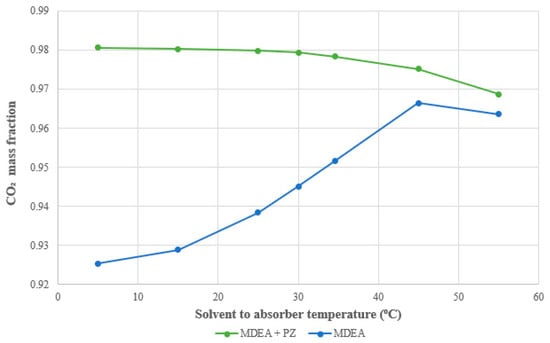
Figure 7.
Effect of the “solvent to absorber” temperature on the CO2 mass fraction of the acid gas.
The simulation demonstrates that the (MDEA + PZ) blend consistently achieves higher CO2 mass fractions than MDEA alone across the full range of operating temperatures. For the (MDEA + PZ) solvent, the CO2 mass fraction remains stable at approximately 0.9806 between 5 °C and 40 °C, with only a minor decline at 45 °C. This indicates superior solvent stability and enhanced absorption capacity, even at elevated temperatures. In contrast, the performance of pure MDEA improves initially from 0.9253 at 5 °C to 0.9664 at 45 °C, but then starts to decrease, likely due to the adverse effect of temperature on CO2 solubility. This behavior aligns with findings in recent research, where the addition of PZ to MDEA has been shown to increase absorption kinetics and loading capacity, especially under industrial conditions requiring low regeneration energy and stable operation across temperature fluctuations [74]. PZ acts as a promoter, accelerating reaction rates and enhancing the solvent’s ability to retain CO2 without significant degradation or energy penalty [55]. The observed thermal stability and performance of (MDEA + PZ) suggest its practical applicability in commercial-scale capture systems where robustness and energy efficiency are critical. Thus, for all subsequent simulations and system configurations in this study, the (MDEA + PZ) blend was selected as the optimal solvent.
4.2. Effects of Number of Trays on Reboiler Duty and CO2 Mass Fraction
In amine-based CO2 capture systems, the number of theoretical stages (trays or packed segments) in the absorber plays a crucial role in determining absorption efficiency and regeneration energy requirements [32]. Figure 8 illustrates the impact of increasing the number of absorber stages from 5 to 30 on two key performance metrics: (i) the mass fraction of CO2 in the acid gas and (ii) the reboiler duty in the regenerator, using the (MDEA+ PZ) solvent system.
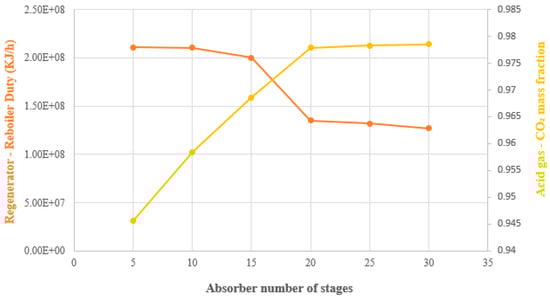
Figure 8.
Effect of number of trays of the absorber on the regenerator reboiler duty and CO2 mass fraction of the acid gas. “E” denotes powers of ten.
The simulation results indicate a clear trend: increasing the number of stages enhances CO2 absorption up to an optimal threshold, after which diminishing returns are observed. Specifically, the CO2 mass fraction in the acid gas increases from 0.9456 at 5 stages to 0.9783 at 22 stages. Beyond 22 stages, this value stabilizes, indicating that additional contact stages do not significantly enhance absorption. This plateau is consistent with findings from dynamic simulations and pilot-scale studies, which report similar saturation behaviors in counter-current gas–liquid systems [75]. Simultaneously, the reboiler duty exhibits a non-linear trend. Between 5 and 15 stages, reboiler energy demand remains relatively constant, at around 2 × 10⁸ kJ/h. However, from 15 to 22 stages, a substantial reduction occurs, with the reboiler duty dropping to 1.32 × 10⁸ kJ/h. This energy efficiency gain is attributed to improved CO2 loading in the rich solvent, which reduces the volume of solvent requiring regeneration and thus the heat required for CO2 desorption [54]. This observation aligns with process thermodynamics: as the lean/rich solvent loading gap narrows, energy demands in the reboiler decrease [55].
Beyond 22 stages, any additional improvement in CO2 capture becomes marginal, while capital costs (e.g., taller columns, additional internals) and operational complexities (e.g., pressure drop, liquid maldistribution) increase significantly [54]. These findings suggest that 22 absorber stages represent the optimal configuration, balancing high absorption performance with minimized reboiler duty and energy consumption. Selecting more than 22 stages would not be cost-effective or operationally justified for typical industrial systems [75].
This result has direct implications for commercial-scale systems. Studies have shown that over-designing absorber units can result in more than 20% unnecessary capital expenditure with negligible operational benefit [72]. As both CO2 purity and reboiler duty plateau beyond 22 stages, a design in the range of 20 to 22 stages for systems utilizing MDEA + PZ offers a technically and economically balanced solution, avoiding over-sizing while maintaining performance.
4.3. Effects of (MDEA + PZ) Flow Rate on Acid Gas—CO2 Mass Fraction and Reboiler Duty
The mass flow rate of the solvent entering the absorber is a critical parameter that directly influences both the CO2 absorption efficiency and the energy requirement for solvent regeneration [76]. Figure 9 demonstrates the impact of varying the mass flow rate of the (MDEA + PZ) blend from 4.5 × 10⁵ kg/h to 2.3 × 10⁶ kg/h on two key performance metrics: (1) the CO2 mass fraction in the acid gas stream exiting the stripper, and (2) the reboiler duty in the regeneration unit.
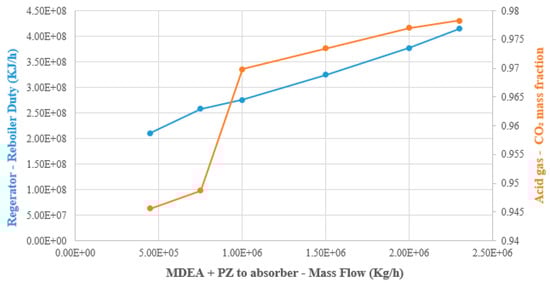
Figure 9.
Effects of the (MDEA + PZ) mass flow on the Acid gas-CO2 mass fraction and regenerator reboiler duty. “E” denotes powers of ten.
Both parameters showed an increasing trend with solvent flow rate. The CO2 mass fraction increases from 0.9456 to 0.9783, reflecting a significant enhancement in capture efficiency. This can be due to the increased availability of reactive amine groups in the absorption column, which facilitates a higher rate of chemical reaction and mass transfer between the gas and liquid phases [77,78,79]. A larger solvent inventory enhances CO2 solubility and provides more surface area for interaction, thereby reducing the partial pressure of CO2 in the treated gas stream [54]. However, this benefit comes at the cost of increased energy demand in the regenerator. The reboiler duty rises from 2.11 × 10⁸ kJ/h to 4.15 × 10⁸ kJ/h over the studied flow range. This increase is directly related to the larger thermal load needed to heat and strip a greater volume of solvent [80]. Since amine regeneration is typically the most energy-intensive step in the CO2 capture process, any increase in solvent circulation rate must be justified by proportional improvements in capture performance or solvent loading capacity [80]. These findings emphasize the classic trade-off in amine-based CO2 capture systems: maximizing absorption versus minimizing operational energy costs [31,62]. Over-dosing the system with solvent may marginally improve CO2 mass fraction but drastically inflate the reboiler duty, thereby increasing the plant’s energy footprint and reducing economic viability [24,62].
In this study, the flow rate of 2.3 × 10⁶ kg/h was selected as an optimal compromise, providing high absorption performance while maintaining a manageable regeneration load. Furthermore, similar behaviors have been reported in experimental and pilot-scale studies, which confirm that there exists a critical solvent-to-gas flow ratio beyond which no significant capture efficiency is gained [6]. These insights are valuable for scaling up CO2 capture systems and aligning process design with industrial economic constraints.
4.4. Effects of Regenerator Feed Temperature on Reboiler Duty
The temperature of the amine-rich stream entering the regeneration column plays a significant role in determining the thermal load required for solvent regeneration. Figure 10 illustrates the influence of varying the temperature of the (Regen Feed) stream, from 20 °C to 80 °C, on the reboiler duty (kJ/h).
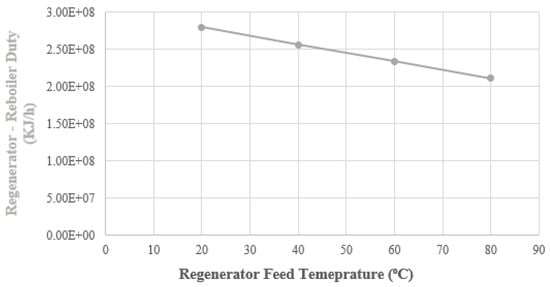
Figure 10.
Effects of the regenerator feed temperature on the regenerator reboiler duty. “E” denotes powers of ten.
The results reveal a clear downward trend in energy demand: as the inlet temperature of the rich amine stream increases, the reboiler duty declines from 2.8 × 10⁸ kJ/h at 20 °C to 2.11 × 10⁸ kJ/h at 80 °C. It is worth noting that this trend aligns with established thermodynamic behavior [81]. Since the solvent enters the regenerator closer to its desorption temperature, less additional heat is required in the reboiler to achieve CO2 stripping, leading to substantial energy savings [80]. This phenomenon aligns with industrial best practices, where preheating the rich amine stream by lean/rich heat exchangers is widely adopted to improve energy efficiency in CO2 capture systems [80]. By exchanging heat between the hot regenerated solvent and the incoming rich amine stream, the system not only reduces fuel consumption but also stabilizes thermal conditions in the regenerator, improving operational reliability [82]. However, this energy advantage must be evaluated against the capital and maintenance costs associated with implementing efficient heat exchange networks [83]. These costs include equipment purchase, installation, increased footprint, and periodic descaling or fouling treatment [83]. Nonetheless, process integration studies and industrial case analyses confirm that the energy savings typically outweigh these added expenditures, especially at large scale operations [75].
Therefore, the selection of 80 °C as the regenerator feed temperature represents an optimal balance between energy savings and additional preheating investment. This operating point ensures high thermal efficiency in the desorption unit without introducing excessive complexity or capital burden to the system. Moreover, such a configuration supports broader environmental goals by reducing the plant’s carbon footprint and improving its lifecycle performance [75].
4.5. Effects of Molar Flow of “A4 Stream” on the Power Demand of Compressor “2”
Compressors were modeled as adiabatic with a fixed isentropic efficiency. Unless otherwise noted, we used η = 0.75 for the compressor (Aspen default). Compressor power was evaluated as
where
= shaft power input (kW)
= mass flow rate (kg/s)
= outlet enthalpy for the isentropic process (kJ/kg)
= inlet enthalpy (kJ/kg)
= isentropic efficiency of the compressor
This value was kept constant in all parametric studies, including the “A4 stream” optimization, to ensure comparability of absolute power draws. Therefore, the increase in power with A4 flow arises from the higher mass rate handled at the same pressure targets and gas composition, not from efficiency changes.
The power consumption of compressors in a CO2 liquefaction system is a major contributor to the total energy demand of the plant [16,50]. Figure 11 illustrates the impact of the molar flow rate of the “A4 stream” which is the CO2-rich stream entering heat exchanger (HX) on the power required by Compressor “2”.
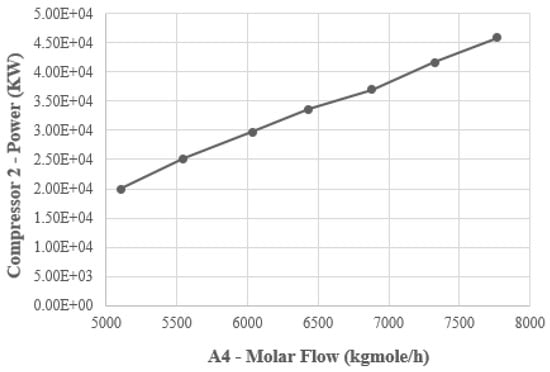
Figure 11.
Effects of the molar flow of “A4 stream” on the power of Compressor “2”. “E” denotes powers of ten.
To note that, when the molar flow of the “A4 stream” increases from 5103 to 7767 kgmol/h, the power required by Compressor “2” increases substantially, from 1.994 × 10⁴ kW to 4.59 × 10⁴ kW. This near-linear correlation is expected, as compression energy is directly influenced by the volume and pressure of gas to be handled [17]. Thus, the higher the flow rate of CO2 entering the compression stage, the more mechanical work is required to compress the gas to the desired pressure [17]. Thermodynamically, this follows the principles of isentropic compression, where energy consumption is a function of the gas flow rate, the pressure ratio, and the gas’s specific heat capacity [23]. Since no changes were introduced to the pressure targets or gas composition in this scenario, the observed increase in energy is solely attributable to the increased flow rate of the “A4 stream”. Furthermore, it is important to note that this increase in molar flow of the “A4 stream” does not result in a corresponding increase in liquid CO2 production downstream. This decoupling indicates that excess compression capacity is not being utilized efficiently and that the additional energy input is not contributing to higher process yield. Hence, it underscores the diminishing returns and energy waste associated with oversizing input streams in cryogenic systems [84].
Given these observations, the molar flow rate of 5103 kgmol/h is selected as the optimal input for the “A4 stream”. This value minimizes the power requirements of Compressor “2” while maintaining effective liquefaction performance downstream. This optimization not only reduces operational energy costs but also aligns with the overarching objective of enhancing the system’s sustainability profile.
4.6. Effects of Refrigerants on Refrigeration Loop Duty
Figure 12 compares the refrigeration loop duty (kW) for three different refrigerants: Ammonia (NH3), Propane (C3H8), and R134a (1,1,1,2-Tetrafluoroethane) were compared based on the total energy consumption of Compressor “2”, Cooler “4”, and the “Expander” in the liquefaction cycle. The refrigerant mass flow rate was fixed at 5103 kgmol/h across all simulations to ensure a fair thermodynamic comparison. The results reveal stark contrasts in system energy demands. Ammonia showed the lowest refrigeration loop duty, requiring only 37,560 kW, while Propane and R134a required 128,495 kW and 305,175 kW, respectively. These differences are primarily due to the thermodynamic efficiencies and latent heat properties of each refrigerant [7,18]. Ammonia’s high heat of vaporization and excellent heat transfer characteristics reduce the total cooling load, thereby minimizing compressor and expander work [7,48].
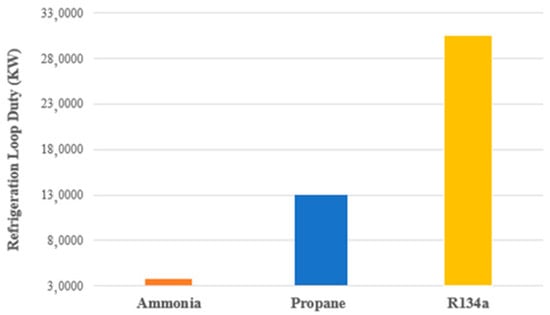
Figure 12.
Variation in the refrigeration loop duty Using Ammonia, Propane and R134a as refrigerants.
Given these findings, Ammonia was selected as the optimal refrigerant for the simulated liquefaction process. Thus, its use significantly reduces operational costs and minimizes environmental impact.
5. Heat Integration and Solvent Recovery
To enhance the overall efficiency of the dry ice production process, heat integration and solvent recovery strategies were evaluated. By replacing heaters and coolers with internal heat exchangers and implementing partial solvent recycling, the process achieved significant reductions in energy consumption and chemical losses. This section presents the simulation outcomes before and after optimization, highlighting key improvements in thermal efficiency and amine recovery.
5.1. Heat Integration
The integration of heat exchangers in place of conventional heaters and coolers plays a pivotal role in enhancing the energy efficiency of the dry ice production process [85]. Each heat exchanger utilizes water as the heating or cooling medium, providing a more sustainable and cost-effective thermal management approach [15]. Beyond reducing operational energy consumption, this strategy also contributes to minimizing overall fuel demand, thereby lowering greenhouse gas (GHG) emissions and supporting cleaner process design [16].
As illustrated in Figure 13, extracted from the Aspen Energy Analyzer (AEA), the substitution of heaters with heat exchangers led to a 49.78% reduction in heating utility demand, while replacing coolers resulted in a 76.39% decrease in cooling utility consumption. In total, these modifications reduced the plant’s overall thermal duty by 2.74 × 10⁸ KJ/h, corresponding to an impressive 66.67% energy savings. These results underscore the effectiveness of heat integration in optimizing the dry ice production system, not only in terms of energy conservation but also in terms of operational cost reduction and environmental impact mitigation.
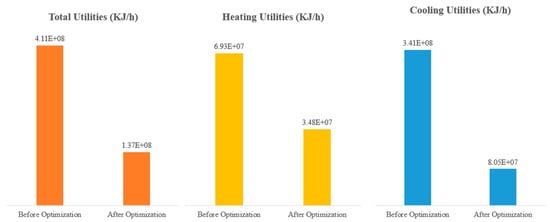
Figure 13.
Changes derived by the implementation of heat exchangers.
5.2. Solvent Recovery
Solvent recovery plays a vital role in reducing operational costs and environmental impact in CO2 capture processes [13]. In the current simulation, shown in Figure 14, the regenerated (Solvent Recovery) stream is reintroduced into the absorber to minimize the consumption of fresh solvents, specifically methyldiethanolamine (MDEA) and piperazine (PZ). This recovery system yielded 75.65% recovery of MDEA and 66.4% recovery of PZ.
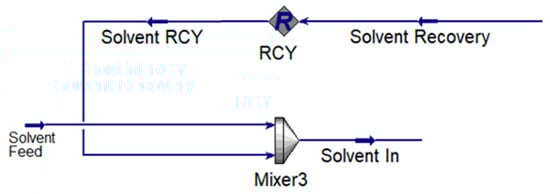
Figure 14.
Solvent recovery process.
While these values demonstrate effective solvent recycling, complete (100%) recovery was not achieved due to several realistic operational limitations [86]. First, minor solvent losses are inevitable through vaporization, mechanical entrainment, and degradation under high-temperature regeneration conditions, particularly affecting the more volatile and reactive PZ component [87]. Second, solvent degradation products, such as heat-stable salts and oxidative byproducts, may accumulate over time, reducing the recoverable fraction of the amines and necessitating periodic bleed and replacement [13]. Additionally, absorption-regeneration systems often experience minor solvent leakage or residual retention in purge or wastewater streams, which further prevents full recovery [88]. PZ, despite its favorable kinetics as a rate promoter, tends to degrade faster under oxidative conditions or at elevated temperatures, explaining its slightly lower recovery efficiency compared to MDEA [87]. Operational strategies such as improved thermal control, better packing design to reduce entrainment, and the implementation of reclaiming units could further improve solvent recovery rates [14]. Nonetheless, the current recovery levels reflect a realistic and economically optimized scenario, reducing the need for fresh solvent replenishment while enhancing the environmental sustainability of the process [13]. Therefore, the solvent recovery scheme contributes not only to cost savings but also to reducing emissions and minimizing the life-cycle environmental footprint of the dry ice production process.
6. Economic Analysis
This section presents a conservative economic evaluation for the optimized design. Cost items were estimated using Aspen Process Economic Analyzer (APEA), and to avoid double counting the analysis reports the Total Capital Cost (TCC) as provided by APEA, which already includes equipment purchase, installation, and indirects [89]. Operating expenditures are divided into annual operating cost (excluding utilities) and an annual utilities line that captures electricity and refrigeration services. All monetary figures are expressed in 2025 USD.
The post-integration utilities load is 113.972 MW. With an on-stream factor of 335 days per year at 24 h·day−1, the implied annual energy use is approximately 916,335 MWh·yr−1. The reported annual utilities expenditure for the optimized case is $14,610,000, which corresponds to an implied average electricity price of about $0.016·kWh−1 ($15.9·MWh−1). For context, the U.S. industrial-sector average electricity price in 2024 was roughly 8.15 ¢·kWh−1; if a different local tariff applies, the utilities cost and the payback below scale proportionally with that price [90].
As shown in Table 8, the primary revenue stream is dry ice (solid CO2) produced at a nominal rate of 36.9 t·h−1. A conservative bulk price of $160 per metric ton, consistent with low-end institutional procurement, was adopted to avoid overstating revenue [90]. At 335 operating days per year, this yields an annual dry-ice revenue of approximately $47,468,160. Co-produced light-hydrocarbon streams (methane and ethane) may be recycled as internal fuel or, where market access and specifications permit, sold externally; because such commercialization is site-dependent, no by-product credits are taken in the base case.
Table 8.
Summary of capital, operating, utilities, revenue, and payback (dry-ice-only base case).
The simple payback is defined as TCC divided by the annual net cash flow, where the latter equals product revenue minus annual operating and utilities costs. Because utilities scale linearly with the electricity price, substituting a local tariff into the utilities line will update the payback proportionally. If a project elects to monetize methane and/or ethane co-products, those credits would shorten the payback further; such upside is case-specific and therefore not included in this base case.
7. Optimal Operating Conditions and Final Process Configuration
This section presents the consolidated results of the optimization efforts carried out across the CO2 capture, liquefaction, and solidification stages. By systematically adjusting operational parameters and redesigning unit configurations, significant improvements in energy efficiency, process stability, and sustainability were achieved. Table 9 summarizes the key modifications implemented during the simulation, including heat integration improvements, solvent recovery performance, and absorber design upgrades, along with the optimized values obtained through parametric studies. This table shows both the initial vs. optimized process improvements and the specific values selected to enhance performance metrics. Thus, it serves as a conclusive reference to the multiple optimization efforts discussed throughout the study. Each adjustment reflects a critical design choice aimed at reducing operational costs, enhancing environmental performance, and improving equipment reliability. Previous studies typically report energy savings between 40–55% through heat integration alone [85]; our process achieved 66.67% savings in total utility demand, due to combined solvent recycling and exchanger placement.
Table 9.
Summary of key performance enhancements before and after process optimization.
Following these optimizations, the entire process was simulated in Aspen HYSYS using the finalized configurations. Figure 15 shows the fully optimized dry ice production plant.
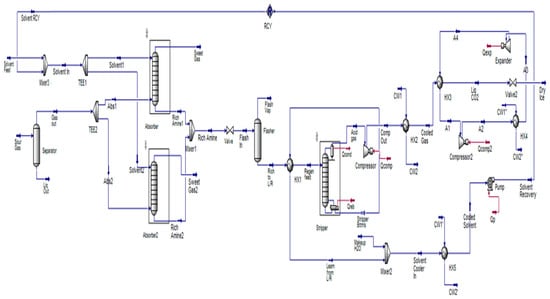
Figure 15.
Optimized dry ice production process.
8. Sustainability and Industrial Relevance
Notable sustainability and industrial applications are displayed by the suggested dry ice production method. Using water-based exchangers for heat integration lowers overall utility demand by 66.7%, higher than energy savings often shown in previous research [91]. This directly reduces the need for operating fuel and thus lowers greenhouse gas (GHG) emissions. Moreover, compared to R134a (GWP > 1300) and propane (GWP ≈ 3), ammonia (NH3) has zero global warming potential (GWP = 0) and zero ozone depletion potential (ODP = 0), which improves the system’s environmental profile. Nevertheless, ammonia is also toxic and mildly flammable under certain conditions [92]. To mitigate these risks, industrial refrigeration systems typically employ safety measures such as continuous leak detection sensors, adequate ventilation systems, and strict adherence to permissible exposure limits [92]. These safeguards ensure that the environmental benefits of ammonia are realized without compromising operational safety or regulatory compliance. Furthermore, this process reduces chemical waste and solvent make-up expenses by achieving solvent recovery rates above 95% [83]. This not only minimizes environmental pollution but also enhances circularity in chemical management, which is a cornerstone of sustainable process design. When combined with optimized equipment sizing and minimized thermal losses, the proposed approach demonstrates how energy efficiency and material efficiency can synergistically reinforce economic viability and long-term environmental stewardship.
These advantages are further reinforced when viewed through the lens of measurable climate benefits. Assuming a baseline emission intensity of 0.45 kg CO2e per kWh of grid electricity (global average), the 66.7% reduction in utility demand compared to conventional CO2 liquefaction systems translates into an estimated reduction of approximately 450–550 kg CO2 per metric ton of dry ice produced, depending on operating conditions and local energy mix [93]. This emission avoidance is particularly significant in regions relying on fossil-based power generation, where indirect CO2 emissions from electricity consumption constitute a substantial environmental burden and represent a significant share of industrial carbon footprints [94].
Table 10 presents a comparison of typical refrigerants used in industrial CO2 liquefaction, highlighting the environmental superiority of ammonia under standard conditions.
Table 10.
Environmental and performance characteristics of selected refrigerants for CO2 liquefaction.
Beyond climate change mitigation, the system addresses broader pillars of sustainability and many Sustainable Development Goals (SDGs). By reducing chemical waste and promoting solvent reuse, it contributes to SDG 12 (Responsible Consumption and Production). By fostering innovation in carbon capture and utilization technologies, it supports SDG 9 (Industry, Innovation and Infrastructure). And by directly cutting greenhouse gas (GHG) emissions, it advances SDG 13 (Climate Action). The system’s design promotes resource efficiency and circularity by achieving solvent recovery rates exceeding 95%, thereby minimizing the consumption of fresh amine solution and reducing chemical waste discharge. This feature contributes to both economic viability and environmental resilience, aligning with SDG 12 (Responsible Consumption and Production) [41]. Furthermore, the approach aligns with principles of industrial ecology, where waste streams are minimized and energy flows are optimized to mimic natural closed-loop systems.
In broader industrial contexts, this process model provides a scalable, replicable framework for integrating CO2 capture and solidification in energy-intensive applications. Potential deployment in cold-chain logistics, food preservation, and pharmaceutical transport highlights how industrial symbiosis and technological innovation can converge to minimize environmental burdens. By embedding climate resilience, energy efficiency, and circularity into its design, the proposed method illustrates a pathway toward more sustainable, low-carbon industrial practices that can be adopted across sectors globally.
9. Conclusions
This work integrates CO2 capture, liquefaction, and solidification into a single, cohesive simulation framework, enabling the evaluation and optimization of the entire system rather than isolated stages. Optimization targeted three major aspects: energy recovery, solvent recycling, and absorber configuration. Heat exchangers replaced coolers and heaters, achieving a 66.67% reduction in total energy duty. Recycling of MDEA and PZ solvents achieved recovery rates of 75.65% and 66.4%, respectively, lowering operational costs and improving environmental sustainability. To address the impracticality of the large single absorber, the column was split into two parallel absorbers with industrially feasible diameters, maintaining performance while reducing equipment constraints. Ammonia was selected as the optimal refrigerant due to its low energy requirements and zero global warming potential. The final optimized process achieved a CO2 purity of 97.83% and dry ice yield of 94.85%, confirming the industrial viability and sustainability of the design. By uniting multiple process stages with targeted optimizations in a unified simulation, this study delivers a technically sound and environmentally responsible pathway for scalable dry ice production.
Author Contributions
J.C.A.: Conceptualization, Methodology, Supervision, Writing—review & editing, Funding acquisition. M.N.: Conceptualization, Methodology, Supervision, Writing—review & editing, Funding acquisition. C.I.: Writing—original draft, Formal analysis, Software, Validation. T.F.: Writing—original draft, Formal analysis, Software, Validation. L.E.M.: Data curation, Investigation, Resources, Writing—review & editing. All authors have read and agreed to the published version of the manuscript.
Funding
This work was supported by the University of Balamand (UOB) under project number RGA/FOE/23-24/019.
Data Availability Statement
The original contributions presented in this study are included in the article. Further inquiries can be directed to the corresponding authors.
Conflicts of Interest
The authors declare no conflicts of interest.
References
- Yousaf, M.; Zaman, M.; Mahmood, A.; Imran, M.; Elkamel, A.; Rizwan, M.; Wilberforce, T.; Riaz, F. Carbon dioxide utilization: A critical review from multiscale perspective. Energy Sci. Eng. 2022, 10, 4890–4923. [Google Scholar] [CrossRef]
- Acampora, L.; Grilletta, S.; Costa, G. The Integration of Carbon Capture, Utilization, and Storage (CCUS) in Waste-to-Energy Plants: A Review. Energies 2025, 18, 1883. [Google Scholar] [CrossRef]
- Aneesh, A.M.; Sam, A.A. A mini-review on cryogenic carbon capture technology by desublimation: Theoretical and modeling aspects. Front. Energy Res. 2023, 11, 1167099. [Google Scholar] [CrossRef]
- Dzido, A.; Krawczyk, P. Abrasive Technologies with Dry Ice as a Blasting Medium—Review. Energies 2023, 16, 1014. [Google Scholar] [CrossRef]
- Dziejarski, B.; Krzyżyńska, R.; Andersson, K. Current status of carbon capture, utilization, and storage technologies in the global economy: A survey of technical assessment. Fuel 2023, 342, 127776. [Google Scholar] [CrossRef]
- Chen, F.; Morosuk, T. Exergetic and Economic Evaluation of CO2 Liquefaction Processes. Energies 2021, 14, 7174. [Google Scholar] [CrossRef]
- Dry Ice Market Overview and Forecast by 2030. Available online: https://www.theinsightpartners.com/reports/dry-ice-market (accessed on 16 August 2025).
- Chen, S.; Qiao, H.; Xu, G. Performance evaluation of refrigerants for external CO2 liquefaction with focus on ammonia’s thermodynamic advantages. J. CO2 Util. 2021, 46, 101469. [Google Scholar]
- South Pars—Global Energy Monitor. Available online: https://www.gem.wiki/South_Pars (accessed on 1 September 2025).
- Gong, W. Modeling of CO2 Conditioning Processes. Ph.D. Thesis, DTU Chemical Engineering, Kgs. Lyngby, Denmark, 2023. [Google Scholar]
- Closmann, F.; Nguyen, T.; Rochelle, G.T. MDEA/Piperazine as a solvent for CO2 capture. Energy Procedia 2009, 1, 1351–1357. [Google Scholar] [CrossRef]
- Chew, Y.E.; Putra, Z.A.; Foo, D.C. Process simulation and optimisation for acid gas removal system in natural gas processing. J. Nat. Gas Sci. Eng. 2022, 107, 104764. [Google Scholar] [CrossRef]
- Vega, F.; Sanna, A.; Navarrete, B.; Maroto-Valer, M.M.; Cortés, V.J. Degradation of amine-based solvents in CO2 capture process by chemical absorption. Greenh. Gases Sci. Technol. 2014, 4, 707–733. [Google Scholar] [CrossRef]
- Emori, W.; Udoh, I.I.; Ekerenam, O.O.; Ikeuba, A.I.; Etim, I.N.; Njoku, C.N.; Daniel, E.F.; Njoku, D.I.; Uzoma, P.C.; Kolawole, S.K.; et al. Handling heat—stable salts in post—combustion CO2 capture: A detailed survey. Greenh. Gases Sci. Technol. 2023, 13, 876–904. [Google Scholar] [CrossRef]
- Eliasson, Å.; Fahrman, E.; Biermann, M.; Normann, F.; Harvey, S. Efficient heat integration of industrial CO2 capture and district heating supply. Int. J. Greenh. Gas Control 2022, 118, 103689. [Google Scholar] [CrossRef]
- Aromada, S.A.; Eldrup, N.H.; Øi, L.E. Cost and Emissions Reduction in CO2 Capture Plant Dependent on Heat Exchanger Type and Different Process Configurations: Optimum Temperature Approach Analysis. Energies 2022, 15, 425. [Google Scholar] [CrossRef]
- Jackson, S.; Brodal, E. A comparison of the energy consumption for CO2 compression process alternatives. IOP Conf. Ser. Earth Environ. Sci. 2018, 167, 012031. [Google Scholar] [CrossRef]
- Jackson, S.; Brodal, E. Optimization of the CO2 Liquefaction Process-Performance Study with Varying Ambient Temperature. Appl. Sci. 2019, 9, 4467. [Google Scholar] [CrossRef]
- Soujoudi, R.; Manteufel, R. Thermodynamic performance of ammonia in liquefied natural gas precooling cycle. Therm. Sci. 2021, 25, 2003–2016. [Google Scholar] [CrossRef]
- Sarkar, J.; Bhattacharyya, S.; Lal, A. Selection of suitable natural refrigerants pairs for cascade refrigeration system. Proc. Inst. Mech. Eng. Part A J. Power Energy 2013, 227, 612–622. [Google Scholar] [CrossRef]
- Saeed, M.Z.; Contiero, L.; Blust, S.; Allouche, Y.; Hafner, A.; Eikevik, T.M. Ultra-Low-Temperature Refrigeration Systems: A Review and Performance Comparison of Refrigerants and Configurations. Energies 2023, 16, 7274. [Google Scholar] [CrossRef]
- Mazyan, W.; Ahmadi, A.; Ahmed, H.; Hoorfar, M. Increasing the COP of a refrigeration cycle in natural gas liquefaction process using refrigerant blends of Propane-NH3, Propane-SO2 and Propane-CO2. Heliyon 2020, 6, e04750. [Google Scholar] [CrossRef]
- Isentropic Compression or Expansion. Available online: https://www.grc.nasa.gov/www/k-12/airplane/compexp.html (accessed on 1 September 2025).
- Abu-Zahra, M.R.; Schneiders, L.H.; Niederer, J.P.; Feron, P.H.; Versteeg, G.F. CO2 capture from power plants. Int. J. Greenh. Gas Control 2007, 1, 37–46. [Google Scholar] [CrossRef]
- Raksajati, A.; Ho, M.T.; Wiley, D.E. Techno-economic Evaluation of CO2 Capture from Flue Gases Using Encapsulated Solvent. Ind. Eng. Chem. Res. 2017, 56, 1604–1620. [Google Scholar] [CrossRef]
- Serviss, M.T.; Van Hout, D.; Britton, S.J.; MacIntosh, A.J. Brewing for the Future: Balancing Tradition and Sustainability. J. Am. Soc. Brew. Chem. 2025, 1–19. [Google Scholar] [CrossRef]
- Ryckebosch, E.; Drouillon, M.; Vervaeren, H. Techniques for transformation of biogas to biomethane. Biomass-Bioenergy 2011, 35, 1633–1645. [Google Scholar] [CrossRef]
- Angelidaki, I.; Treu, L.; Tsapekos, P.; Luo, G.; Campanaro, S.; Wenzel, H.; Kougias, P.G. Biogas upgrading and utilization: Current status and perspectives. Biotechnol. Adv. 2018, 36, 452–466. [Google Scholar] [CrossRef]
- Bishnoi, S.; Rochelle, G.T. Absorption of carbon dioxide into aqueous piperazine: Reaction kinetics, mass transfer and solubility. Chem. Eng. Sci. 2000, 55, 5531–5543. [Google Scholar] [CrossRef]
- Freeman, S.A.; Dugas, R.; Van Wagener, D.H.; Nguyen, T.; Rochelle, G.T. Carbon dioxide capture with concentrated, aqueous piperazine. Int. J. Greenh. Gas Control 2010, 4, 119–124. [Google Scholar] [CrossRef]
- Yang, H.; Xu, Z.; Fan, M.; Gupta, R.; Slimane, R.B.; Bland, A.E.; Wright, I. Progress in carbon dioxide separation and capture: A review. J. Environ. Sci. 2008, 20, 14–27. [Google Scholar] [CrossRef]
- Wang, M.; Lawal, A.; Stephenson, P.; Sidders, J.; Ramshaw, C. Post-combustion CO2 capture with chemical absorption: A state-of-the-art review. Chem. Eng. Res. Des. 2011, 89, 1609–1624. [Google Scholar] [CrossRef]
- Samanta, A.; Zhao, A.; Shimizu, G.K.H.; Sarkar, P.; Gupta, R. Post-Combustion CO2 Capture Using Solid Sorbents: A Review. Ind. Eng. Chem. Res. 2012, 51, 1438–1463. [Google Scholar] [CrossRef]
- Bernardo, P.; Drioli, E.; Golemme, G. Membrane Gas Separation: A Review/State of the Art. Ind. Eng. Chem. Res. 2009, 48, 4638–4663. [Google Scholar] [CrossRef]
- Takahashi, N.; Furuta, Y.; Fukunaga, H.; Takatsuka, T.; Mano, H.; Fujioka, Y. Effects of membrane properties on CO2 recovery performance in a gas absorption membrane contactor. Energy Procedia 2011, 4, 693–698. [Google Scholar] [CrossRef]
- Vo, T.T.; Wall, D.M.; Ring, D.; Rajendran, K.; Murphy, J.D. Techno-economic analysis of biogas upgrading via amine scrubber, carbon capture and ex-situ methanation. Appl. Energy 2018, 212, 1191–1202. [Google Scholar] [CrossRef]
- Sutanto, S.; Dijkstra, J.; Pieterse, J.; Boon, J.; Hauwert, P.; Brilman, D. CO2 removal from biogas with supported amine sorbents: First technical evaluation based on experimental data. Sep. Purif. Technol. 2017, 184, 12–25. [Google Scholar] [CrossRef]
- Wang, X.; Song, C. Carbon Capture from Flue Gas and the Atmosphere: A Perspective. Front. Energy Res. 2020, 8, 560849. [Google Scholar] [CrossRef]
- Buchhauser, U.; Vrabec, J.; Faulstich, M.; Meyer-Pittroff, R. CO2 Recovery Improved Performance with a Newly Developed System. Tech. Q. 2008, 45, 84. [Google Scholar] [CrossRef]
- da Cunha, G.P.; de Medeiros, J.L.; Araújo, O.d.Q.F. Carbon Capture from CO2-Rich Natural Gas via Gas-Liquid Membrane Contactors with Aqueous-Amine Solvents: A Review. Gases 2022, 2, 98–133. [Google Scholar] [CrossRef]
- Loachamin, D.; Casierra, J.; Calva, V.; Palma-Cando, A.; Ávila, E.E.; Ricaurte, M. Amine-Based Solvents and Additives to Improve the CO2 Capture Processes: A Review. Chemengineering 2024, 8, 129. [Google Scholar] [CrossRef]
- Obi, D.; Onyekuru, S.; Orga, A. Review of recent process developments in the field of carbon dioxide (CO2) capture from power plants flue gases and the future perspectives. Int. J. Sustain. Energy 2024, 43, 2317137. [Google Scholar] [CrossRef]
- Siegelman, R.L.; Milner, P.J.; Kim, E.J.; Weston, S.C.; Long, J.R. Challenges and opportunities for adsorption-based CO2 capture from natural gas combined cycle emissions. Energy Environ. Sci. 2019, 12, 2161–2173. [Google Scholar] [CrossRef]
- Rochelle, G.; Chen, E.; Freeman, S.; Van Wagener, D.; Xu, Q.; Voice, A. Aqueous piperazine as the new standard for CO2 capture technology. Chem. Eng. J. 2011, 171, 725–733. [Google Scholar] [CrossRef]
- Merkel, T.C.; Lin, H.; Wei, X.; Baker, R. Power plant post-combustion carbon dioxide capture: An opportunity for membranes. J. Membr. Sci. 2010, 359, 126–139. [Google Scholar] [CrossRef]
- Li, K.; Cousins, A.; Yu, H.; Feron, P.; Tade, M.; Luo, W.; Chen, J. Systematic study of aqueous monoethanolamine—Based CO2 capture process: Model development and process improvement. Energy Sci. Eng. 2015, 23. Available online: https://www.scipedia.com/public/Li_et_al_2015c (accessed on 1 September 2025).
- Darani, N.S.; Behbahani, R.M.; Shahebrahimi, Y.; Asadi, A.; Mohammadi, A.H. Simulation and Optimization of the Acid Gas Absorption Process by an Aqueous Diethanolamine Solution in a Natural Gas Sweetening Unit. ACS Omega 2021, 6, 12072–12080. [Google Scholar] [CrossRef] [PubMed]
- Harmsen, J. Process intensification in the petrochemicals industry: Drivers and hurdles for commercial implementation. Chem. Eng. Process.-Process. Intensif. 2010, 49, 70–73. [Google Scholar] [CrossRef]
- Aspen Technology, Inc. Top 10 Questions About Acid Gas Removal Optimization with Aspen HYSYS. AspenTech2018. Available online: https://www.aspentech.com/-/media/aspentech/home/resources/faq-documents/pdfs/fy18/q4/at-04066-faq-acid-gas-removal.pdf (accessed on 1 September 2025).
- Ramli, R.M.; Lock, S.S.M.; Hussein, N.; Shahid, M.Z.; Farooqi, A.S. Simulation of Natural Gas Treatment for Acid Gas Removal Using the Ternary Blend of MDEA, AEEA, and NMP. Sustainability 2022, 14, 10815. [Google Scholar] [CrossRef]
- Lock, S.; Lau, K.; Ahmad, F.; Shariff, A. Modeling, simulation and economic analysis of CO2 capture from natural gas using cocurrent, countercurrent and radial crossflow hollow fiber membrane. Int. J. Greenh. Gas Control. 2015, 36, 114–134. [Google Scholar] [CrossRef]
- Alam Khan, B.; Ullah, A.; Saleem, M.W.; Khan, A.N.; Faiq, M.; Haris, M. Energy Minimization in Piperazine Promoted MDEA-Based CO2 Capture Process. Sustainability 2020, 12, 8524. [Google Scholar] [CrossRef]
- Pancione, E.; Erto, A.; Di Natale, F.; Lancia, A.; Balsamo, M. A comprehensive review of post-combustion CO2 capture technologies for applications in the maritime sector: A focus on adsorbent materials. J. CO2 Util. 2024, 89, 102955. [Google Scholar] [CrossRef]
- Hosseini-Ardali, S.M.; Hazrati-Kalbibaki, M.; Fattahi, M.; Lezsovits, F. Multi-objective optimization of post combustion CO2 capture using methyldiethanolamine (MDEA) and piperazine (PZ) bi-solvent. Energy 2020, 211, 119035. [Google Scholar] [CrossRef]
- Derks, P.; Kleingeld, T.; van Aken, C.; Hogendoorn, J.; Versteeg, G. Kinetics of absorption of carbon dioxide in aqueous piperazine solutions. Chem. Eng. Sci. 2006, 61, 6837–6854. [Google Scholar] [CrossRef]
- Vevelstad, S.J.; Buvik, V.; Knuutila, H.K.; Grimstvedt, A.; da Silva, E.F. Important Aspects Regarding the Chemical Stability of Aqueous Amine Solvents for CO2 Capture. Ind. Eng. Chem. Res. 2022, 61, 15737–15753. [Google Scholar] [CrossRef]
- Pearson, A. Refrigeration with ammonia. Int. J. Refrig. 2008, 31, 545–551. [Google Scholar] [CrossRef]
- Bantillo, S.M.R.; Callejo, G.A.C.; Camacho, S.M.K.G.; Montalban, M.A.; Valderin, R.E.; Rubi, R.V.C. Future Trends of Natural Refrigerants: Selection, Preparation, and Evaluation. Eng. Proc. 2024, 67, 9. [Google Scholar] [CrossRef]
- Øi, L.E.; Eldrup, N.; Adhikari, U.; Bentsen, M.H.; Badalge, J.L.; Yang, S. Simulation and Cost Comparison of CO2 Liquefaction. Energy Procedia 2016, 86, 500–510. [Google Scholar] [CrossRef]
- Gao, M.; Wang, L.; Chen, X.; Wei, X.; Liang, J.; Li, L. Joule–Thomson Effect on a CCS-Relevant (CO2 + N2) System. ACS Omega 2021, 6, 9857–9867. [Google Scholar] [CrossRef] [PubMed]
- Wałęsa, K.; Górecki, J.; Berdychowski, M.; Biszczanik, A.; Wojtkowiak, D. Modelling of the Process of Extrusion of Dry Ice through a Single-Hole Die Using the Smoothed Particle Hydrodynamics (SPH) Method. Materials 2022, 15, 8242. [Google Scholar] [CrossRef] [PubMed]
- Transporting Temperature-Sensitive Goods: Moving Towards Self-Contained Cold Logistics—Olivo Logistics. Available online: https://www.olivo-logistics.com/en/self-contained-cold-logistics/ (accessed on 16 August 2025).
- Berdychowski, M.; Górecki, J.; Wałęsa, K. Numerical Simulation of Dry Ice Compaction Process: Comparison of the Mohr–Coulomb Model with the Experimental Results. Materials 2022, 15, 7932. [Google Scholar] [CrossRef]
- Biszczanik, A.; Górecki, J.; Kukla, M.; Wałęsa, K.; Wojtkowiak, D. Experimental Investigation on the Effect of Dry Ice Compression on the Poisson Ratio. Materials 2022, 15, 1555. [Google Scholar] [CrossRef]
- CO2 Recovery for Dry Ice Production Systems: 10 Frequently Asked Questions. Available online: https://blog.coldjet.com/co2-recovery-for-dry-ice-production-systems (accessed on 16 August 2025).
- Le Cao, K.A.; Cao, K.L.A.; Abdillah, O.B.; Septiani, E.L.; Hirano, T.; Nguyen, N.T.; Ogi, T. Correlation between Pore Characteristics and High-Performance Carbon Dioxide Capture of Sustainable Porous Carbon Derived from Kraft Lignin and Potassium Carbonate. Energy Fuels 2025, 39, 6372–6387. [Google Scholar] [CrossRef]
- Dietrich, F.; Schöny, G.; Fuchs, J.; Hofbauer, H. Experimental study of the adsorber performance in a multi-stage fluidized bed system for continuous CO2 capture by means of temperature swing adsorption. Fuel Process. Technol. 2018, 173, 103–111. [Google Scholar] [CrossRef]
- Li, S.; Yuan, X.; Deng, S.; Zhao, L.; Lee, K.B. A review on biomass-derived CO2 adsorption capture: Adsorbent, adsorber, adsorption, and advice. Renew. Sustain. Energy Rev. 2021, 152, 111708. [Google Scholar] [CrossRef]
- Packed Columns in Mass Transfer. Available online: https://www.numberanalytics.com/blog/ultimate-guide-packed-columns-mass-transfer (accessed on 1 September 2025).
- Lyddon, L. Trays vs. Packing. Available online: https://www.bre.com/Blog/Trays-vs-Packing.aspx (accessed on 1 September 2025).
- Gul, A.; Barış, M.; Un, U.T. Carbon dioxide absorption using monoethanolamine, piperazine and n-metil-2-pirolidon solvents under counter current regime in packed column reactor. Int. J. Greenh. Gas Control. 2024, 131, 104036. [Google Scholar] [CrossRef]
- Otitoju, O.; Oko, E.; Wang, M. A new method for scale-up of solvent-based post-combustion carbon capture process with packed columns. Int. J. Greenh. Gas Control. 2020, 93, 102900. [Google Scholar] [CrossRef]
- Lyregaard, M.; Jørgensen, S.B.; Abildskov, J. Modeling Tray Separation Columns with Parallel Streams. Ind. Eng. Chem. Res. 2023, 62, 11109–11127. [Google Scholar] [CrossRef]
- Zhang, X.; Zhang, C.-F.; Qin, S.-J.; Zheng, Z.-S. A Kinetics Study on the Absorption of Carbon Dioxide into a Mixed Aqueous Solution of Methyldiethanolamine and Piperazine. Ind. Eng. Chem. Res. 2001, 40, 3785–3791. [Google Scholar] [CrossRef]
- Antonini, C.; Pérez-Calvo, J.-F.; van der Spek, M.; Mazzotti, M. Optimal design of an MDEA CO2 capture plant for low-carbon hydrogen production—A rigorous process optimization approach. Sep. Purif. Technol. 2021, 279, 119715. [Google Scholar] [CrossRef]
- Halim, H.N.A.; Shariff, A.M.; Tan, L.S.; Bustam, M.A. Mass Transfer Performance of CO2 Absorption from Natural Gas using Monoethanolamine (MEA) in High Pressure Operations. Ind. Eng. Chem. Res. 2015, 54, 1675–1680. [Google Scholar] [CrossRef]
- Kolmetz, K.; Jaya, A. Distillation Column Packing Hydraulics Selection, Sizing and Troubleshooting. KLM Technology Group, March 2011. Available online: www.klmtechgroup.com (accessed on 1 September 2025).
- Hoon, C.Y.; Ling, A.L.; Jaya, A. Distillation Column Selection and Sizing. KLM Technology Group. February 2011. Available online: www.klmtechgroup.com (accessed on 1 September 2025).
- Mathisen, A.; Sørensen, H.; Melaaen, M.; Müller, G.-I. Investigation into Optimal CO2 Concentration for CO2 Capture from Aluminium Production. Energy Procedia 2013, 37, 7168–7175. [Google Scholar] [CrossRef]
- Dey, A.; Balchandani, S.; Dash, S.K.; Mandal, B.P. Effect of various Key Process parameters on the Reboiler heat duty of CO2 capture unit using single and blended amine system. In Proceedings of the 12th International Conference on Thermal Engineering: Theory and Applications (ICTEA), Gandhinagar, India, 23–26 February 2019. [Google Scholar]
- Vinjarapu, S.H.B.; Neerup, R.; Larsen, A.H.; Jørsboe, J.K.; Villadsen, S.N.B.; Jensen, S.; Karlsson, J.L.; Kappel, J.; Lassen, H.; Blinksbjerg, P.; et al. Results from pilot-scale CO2 capture testing using 30 wt% MEA at a Waste-to-Energy facility: Optimisation through parametric analysis. Appl. Energy 2024, 355, 122193. [Google Scholar] [CrossRef]
- Andreasen, A. Optimisation of carbon capture from flue gas from a Waste-to-Energy plant using surrogate modelling and global optimisation. Oil Gas Sci. Technol.-Rev. D’ifp Energ. Nouv. 2021, 76, 55. [Google Scholar] [CrossRef]
- Vinjarapu, S.H.B.; Neerup, R.; Larsen, A.H.; Villadsen, S.N.B.; von Solms, N.; Jensen, S.; Karlsson, J.L.; Kappel, J.; Lassen, H.; Blinksbjerg, P.; et al. Pilot-scale CO2 capture demonstration of heat integration through split flow configuration using 30 wt% MEA at a Waste-to-Energy facility. Sep. Purif. Technol. 2024, 345, 127311. [Google Scholar] [CrossRef]
- Haq, S.E.U.; Uddin, F.; Taqvi, S.A.A.; Naqvi, M.; Naqvi, S.R. Multistage carbon dioxide compressor efficiency enhancement using waste heat powered absorption chillers. Energy Sci. Eng. 2021, 9, 1373–1384. [Google Scholar] [CrossRef]
- Improving Energy Efficiency of Carbon Capture Processes with Heat Pumps|International Sustainable Energy Conference—Proceedings. Available online: https://www.tib-op.org/ojs/index.php/isec/article/view/1083/1121 (accessed on 1 September 2025).
- Raghu, A. Quantification of Amine Loss in the Post Combustion CO2 Capture Process. Master’s Thesis, University of Regina, Regina, SK, Canada, 2012. [Google Scholar]
- Thompson, J.G.; Frimpong, R.; Remias, J.E.; Neathery, J.K.; Liu, K. Heat Stable Salt Accumulation and Solvent Degradation in a Pilot-Scale CO2 Capture Process Using Coal Combustion Flue Gas. Aerosol Air Qual. Res. 2014, 14, 550–558. [Google Scholar] [CrossRef]
- Fisher, K.S.; Rochelle, G.T.; Schubert, C. Advanced Amine Solvent Formulations and Process Integration for Near-Term CO2 Capture Success; Trimeric Corporation: Buda, TX, USA, 2007. [Google Scholar]
- AspenTech: Knowledge Base. Available online: https://esupport.aspentech.com/S_Article?id=000098074 (accessed on 27 September 2025).
- Electric Power Monthly—U.S. Energy Information Administration (EIA). Available online: https://www.eia.gov/electricity/monthly/epm_table_grapher.php?t=table_5_03 (accessed on 27 September 2025).
- Yoro, K.O.; Sekoai, P.T.; Isafiade, A.J.; Daramola, M.O. A review on heat and mass integration techniques for energy and material minimization during CO2 capture. Int. J. Energy Environ. Eng. 2019, 10, 367–387. [Google Scholar] [CrossRef]
- Khudhur, D.A.; Abdullah, T.A.T.; Norazahar, N. A Review of Safety Issues and Risk Assessment of Industrial Ammonia Refrigeration System. ACS Chem. Health Saf. 2022, 29, 394–404. [Google Scholar] [CrossRef]
- Impact of impurities on CO2 capture, transport and storage. In IEA Greenhouse GAS R&D Programme; Report Number PH4/32; IEA: Paris, France, 2004.
- Carbon Intensity of Electricity Generation. 2024. Available online: https://ourworldindata.org/grapher/carbon-intensity-electricity?utm_source=chatgpt.com (accessed on 16 August 2025).
- Cholik, A.; Ruhyat, N.; Novianto, S. Performance Evaluation of Ammonia Refrigeration Systems in a Texturizing Plant. Int. J. Innov. Mech. Eng. Adv. Mater. 2024, 6, 161–172. [Google Scholar] [CrossRef]
- Nie, J.; Li, Z.; Kong, X.; Li, D. Analysis and Comparison Study on Different HFC Refrigerants for Space Heating Air Source Heat Pump in Rural Residential Buildings of North China. Procedia Eng. 2017, 205, 1201–1206. [Google Scholar] [CrossRef]
- Yang, Z.; Qu, M.; Gluesenkamp, K. Model-Based Performance Comparison of Ammonia Chemisorption Heat Pumps for Cold Climate with Different Working Pairs and Cycle Configurations; Purdue University: West Lafayette, IN, USA, 2018. [Google Scholar]


Disclaimer/Publisher’s Note: The statements, opinions and data contained in all publications are solely those of the individual author(s) and contributor(s) and not of MDPI and/or the editor(s). MDPI and/or the editor(s) disclaim responsibility for any injury to people or property resulting from any ideas, methods, instructions or products referred to in the content. |
© 2025 by the authors. Licensee MDPI, Basel, Switzerland. This article is an open access article distributed under the terms and conditions of the Creative Commons Attribution (CC BY) license (https://creativecommons.org/licenses/by/4.0/).