Abstract
Coke is an essential raw material in the blast furnace (BF) ironmaking process. Its moisture content significantly impacts BF ironmaking production. This study employs a coupled Computational Fluid Dynamics–Discrete Element Method (CFD-DEM) approach to simulate the drying process of wet coke within a coke silo (CS) dryer. Initially, the model was validated by comparing numerical results with experimental data from the literature. Subsequently, it investigated the gas flow dynamics, heat and mass transfer characteristics, and differences in drying behaviour across distinct dryer zones. Finally, the effects of inlet gas velocity and inlet gas temperature on the drying process were systematically quantified. Simulation results reveal that the bottom of the CS dryer exhibits a low-velocity laminar state, while the middle and upper regions display intense gas flow motion. Consequently, the bottom region exhibits insufficient particle drying in comparison to other zones, with the average particle moisture content decreasing by less than 20%. Under the continuous heat exchange between the hot gas and the particles, the moisture content of the particles decreases rapidly. Based on the drying rate behaviour, the drying process exhibits the following three different stages: the pre-heating period, the constant-rate period, and the falling-rate period. Compared to zones 1 and 3, zone 2 exhibits higher temperatures due to its high heat transfer efficiency, which significantly promotes a reduction in particle moisture content. An increase in inlet gas velocity enhances the particle drying rate and heat flux, accelerates moisture reduction, and raises the temperature. The impact of inlet gas velocity is most pronounced after the constant-rate period, with particle drying uniformity decreasing as the inlet gas velocity increases, consequently leading to a decline in drying quality. Increasing inlet gas temperature significantly increases particle temperature and heat flux throughout the drying period and accelerates the high-rate drying stage. These findings provide fundamental insights for further understanding and studying the coke drying process.
1. Introduction
Drying of wet granules is a key unit operation for material handling in industrial production and is widely applied in pharmaceuticals, chemical engineering, food processing, and agricultural product handling [1,2,3,4,5]. In the blast furnace (BF) ironmaking process, coke and iron-bearing materials are alternatively charged into the BF, where coke serves as the reducing agent, fuel, carburizer, and structural support [6,7], and its moisture content is crucial for smooth furnace operation. For example, high moisture in coke reduces its calorific value, causes temperature fluctuations in the hot metal within the furnace, and increases coke consumption. The moisture in the coke may originate from upstream production processes or from storage and transportation under rainy conditions [8]. In current drying technologies, the traditional rotary kiln drying process can be used for coke drying with a large material handling capacity; however, it also has huge energy consumption. In recent years, as the iron and steel industry develops towards low-carbon, energy-saving and consumption reduction [9,10], it is necessary to develop energy-saving and high-efficiency coke drying processes, such as a coupled drying system that recovers waste heat from the waste flue gas of hot blast stoves [11]. Such a drying system not only effectively removes moisture from the coke but also improves overall energy utilisation efficiency. The coupled coke drying system is depicted in Figure 1. Waste flue gas from hot blast stoves is introduced into the coke silo (CS) from the bottom by an induced draft fan to facilitate full heat exchange with the coke and remove its moisture. Meanwhile, dust removal equipment installed on top of the CS subjects the dry exhaust gas to centralised dust removal treatment before discharge.
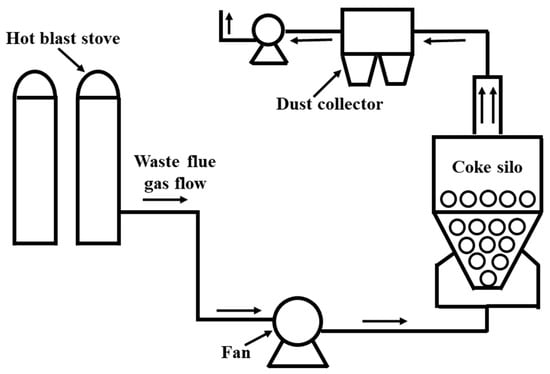
Figure 1.
Schematic illustration of the coke drying system.
To date, few studies have investigated the drying of metallurgical coke. Cywicka-Jakiel et al. elucidated that highly automated metallurgical processes necessitate online control of coke moisture content to ensure high steel quality and fuel economy [12]. Ravichandar et al. demonstrated experimentally that coke with higher porosity rapidly absorbs substantial moisture, thereby affecting the smooth operation of BFs [13]. This suggests that coke drying is critical to metallurgical processes, and therefore studying the coke drying process is of significant importance. However, large-scale industrial coke drying experiments not only entail huge energy consumption and costs but also face challenges in maintaining stable operation under extreme conditions and in separating individual variables for systematic parameter analysis. Moreover, prevailing monitoring techniques make it difficult to accurately characterise the dynamics of the drying process. Nevertheless, numerical simulation emerges as a viable solution to overcome these constraints, facilitating systematic investigation of multiphase transport phenomena within precisely controlled virtual environments.
In general, the numerical computational methods for the coke drying process are mainly categorised into Eulerian–Eulerian and Eulerian–Lagrangian approaches [14,15,16,17]. The former regards both fluid and particles as interpenetrating continua and is also known as the two-fluid model (TFM) [18]. TFM is extensively applied in simulating industrial gas–solid systems due to its high computational efficiency; however, it cannot provide particle-scale information [19,20,21]. The latter treats the fluid and solid phases separately, employing computational fluid dynamics (CFD) to solve the fluid phase and the discrete element method (DEM) to solve the solid phase. The coupled CFD-DEM overcomes the limitations of TFM by capturing accurate details of each particle [14,22,23]. The CFD-DEM approach has been widely used to simulate the drying behaviour of wet particles in a spouted bed or fluidised bed dryer. Azmir et al. [24,25,26] developed a CFD-DEM drying model to study the heat and mass transfer behaviour of grain particles in the fluidised bed drying process, the results indicate that increasing inlet air velocity or decreasing inlet air temperature can improve drying product quality, and reducing the particle size leads to an increase in particle temperature and drying rate. Aziz et al. [27] simulated the drying process of pharmaceutical wet particles in a fluidised bed dryer, and the study revealed the mechanism of the effects of inlet air velocity, initial particle moisture and fluidisation state on the drying efficiency. It is worth noting that both Azmir et al. and Aziz et al. employed an interesting normalisation approach for model validation. Zhong et al. [28] proposed a CFD-DEM model incorporating an improved heat conduction model to investigate the motion and drying behaviour of wet particles in a spouted bed, and systematically examined the effects of four reactor configurations and different operating conditions. Liu et al. [29] established a CFD-DEM model considering dynamic cohesion to simulate the fluid dynamics, thermal transfer, and mass exchange behaviour within a fluidised bed, revealing the mechanism of the impact of particle shape and fluid velocity on the drying non-uniformity.
Although fluidised bed or spouted bed dryers have exhibited good particle drying efficiency, they have limitations when it comes to large-sized, high-density coke particles that require reduced breakage. To date, few studies have been conducted on the drying process of static large-sized, high-density particle systems. The drying of coke in CS represents a typical static deep-bed drying system, which fundamentally differs from the intense gas–solid mixing drying observed in fluidised or spouted beds. Moreover, uneven airflow distribution often occurs in the CS dryer, causing over-drying or even overheating in some areas while other regions remain insufficiently dried. However, knowledge of particle drying behaviour in such systems remains limited. To comprehensively investigate the drying behaviour of coke in the CS dryer and thus provide guidance for further design optimisation of the drying system, a drying model is developed based on a multi-scale CFD-DEM approach to accurately predict the coke drying process. This is of great significance for comprehensively understanding the theory and mechanism of static bed coke drying.
In this study, a multi-scale CFD-DEM is used to simulate the drying process of wet coke particles in the CS dryer in a waste heat recovery drying system. Gas flow patterns, heat and mass transfer characteristics, including variations in gas temperature and water vapour concentration, particle temperature and moisture content, drying rate, and the drying behaviour in different zones of the dryer are considered. Additionally, the effects of inlet gas velocity and inlet gas temperature on the heat and mass transfer behaviour of the drying process are investigated.
2. Methodology and Simulation Conditions
In this work, the drying process occurs in a gas–solid system consisting of coke particles and drying gas. The CFD-DEM model is applied to investigate the gas–solid drying characteristics in the CS dryer. The specific model description is fully outlined in Section 2.1.
2.1. Mathematical Model
2.1.1. Governing Equations for the Gas Phase
The gas phase is described by the local averaged Navier–Stokes equations. The conservation equations for mass and momentum in terms of the locally averaged variables over a computational cell can be expressed as [18,30]:
where εf, ρf and uf are the volume fraction, the density and the velocity of gas, respectively. Sfi is the mass source term due to the evaporation of water from particle phase; p is the gas pressure. τ is the gas phase stress tensor; g is the gravitational acceleration. In the present work, the gas turbulence is described by the widely used standard k-ε turbulence model [31,32,33,34]. Sfivi is the momentum transfer from particle phase to gas phase. β is the interphase momentum exchange coefficient, which can be calculated by the Gidaspow drag model [35] as:
where μf is the gas dynamic viscosity; dpi is the diameter of particle i; CD is the drag coefficient and Repi is the particle Reynolds number.
The conservation equations for energy can be expressed as [36]:
where cp,f, kf and Tf are the specific heat capacity, the thermal conductivity and the temperature of gas, respectively; Qfp is the convective heat flux between gas and particles; represents the heat transfer between the particle phase and gas phase due to water evaporation.
The conservation equations for species can be expressed as [28]:
where is the vapour mass fraction, Dm is the diffusion coefficient, and Sfi is the mass source term expressed in Equation (1).
2.1.2. Governing Equations for the Solid Phase
The DEM is used to model the particle motion, which is originally developed by Cundall and Strack [37]. The movement of individual particle i is determined by Newton’s second law, which can be formulated as:
where mi, vi, ωi, and Ii are the mass, the translational velocity, the angular velocity, and the moment of inertia of particle i, respectively. fe,ij, fd,ij, mig, and fpf,i are the particle–particle elastic force, the damping force, the gravitational force, and the gas–particle interaction force, respectively. Tt,ij, and Tr,ij are the tangential and rolling friction torques acting on particle i by particle j, respectively. The detailed calculation formulas used in the present study for the above items have been presented in our previous work [38,39].
The governing equations for energy of the particle i can be expressed as [27,28]:
where cp,i, and Ti are the specific heat capacity and the temperature of particle i, respectively. Qi,j is conductive heat transfer between particles i and j, Qi,f is convective heat transfer between the particle and its surrounding environment, and Qi,dry is the heat for drying.
The heat conduction between two particles i and j in contact is described by a linear model proposed by Chaudhuri [40], which is expressed as:
where hi,j is the inter-particle thermal conductance; kp is the particle thermal conductivity, and fn is the inter-particle normal force. R* and E* are the geometric mean of the particle radii and the effective Young’s modulus for the two particles, respectively.
The heat convection between particle i and fluid is calculated as [41,42,43]:
where Ai is the particle surface area, and Tf is the gas temperature in a computational cell where particle i is located. hi,f is the convective heat transfer coefficient. Nui is the Nusselt number, which can be calculated by the expression of Ranz and Marshall [44] as follows:
where the Pr is the Prandtl number.
The heat of drying from each particle can be computed as [45]:
where is the latent heat of water evaporation.
During the drying process, assuming that the particle does not undergo shrinkage, the particle size and density remain constant, and the moisture content within the particle gradually decreases. The variation in moisture content of each particle can be defined as:
where mi is the mass of particle i; is the moisture mass fraction of particle i, and is the drying rate, which can be written as [46,47]:
where Ai is the particle surface area, and Mw,v is the molecular weight of vapour. Cv,p is vapour concentration at the particle surface and Cv,∞ is vapour concentration in the bulk gas, which can be calculated by the following formulas [47]:
where psat is the saturated vapour pressure, and R is the universal gas constant. Xv is the local bulk mole fraction of vapour, p is the local pressure, and T∞ is the local bulk temperature in the gas.
The mass transfer coefficient of vapour kv is related to the Sherwood number shp, which can be expressed as [29]:
where Dm is the vapour diffusion coefficient in the gas, which is given by [47] . Sc is the Schmidt number defined as .
2.2. Simulation Setup
The CFD-DEM simulations in this study were implemented by coupling the ANSYS Fluent 19.0 and EDEM 2020 software package. Each simulation case is performed in parallel using 10 CPUs on a high-performance workstation. There are some fundamental steps to perform before beginning CFD-DEM simulations, such as geometric model construction, CFD mesh partitioning, and the initial particle bed packing. Figure 2 illustrates the schematic diagram of the CFD-DEM simulation process. First, CFD and DEM are initialised with corresponding parameters settings (properties of gas and particle listed in Table 1). At each calculation time step, DEM generates information for each coke particle, including position, velocity, temperature, and moisture content. Subsequently, DEM calculates the porosity, particle–fluid interactions, heat flux, and moisture evaporation rate for each grid cell, transmitting this data to CFD to determine fluid flow, temperature distribution, and species transfer. Finally, the information computed by CFD is transferred to DEM to generate the position, velocity, and moisture content of each coke particle for the next time step. This procedure is continuously repeated until the predetermined target time is reached. Generally, the time step in DEM is often smaller than that in CFD, with the difference between the two potentially ranging from 1 to 100 times.
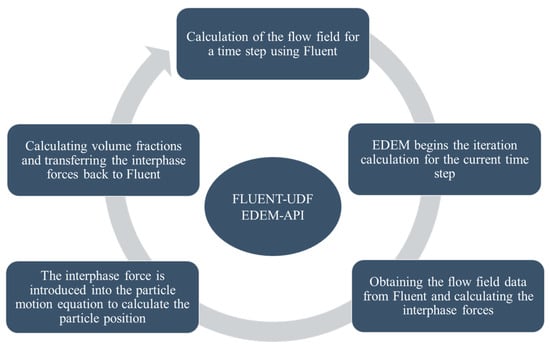
Figure 2.
Schematic diagram of the CFD-DEM coupling process.

Table 1.
Gas and particle properties and simulation parameters.
2.3. Boundary Conditions
In this study, the geometry and dimensions of the CS dryer are shown in Figure 3. To reduce the computational cost, a pseudo-2D slot model is established with a thickness of four particle diameters. Boundary conditions are applied as follows: the velocity inlet boundary condition for the gas inlet at the central regions of the sides, the pressure outlet boundary condition for the top surface, and the no-slip condition for the walls.
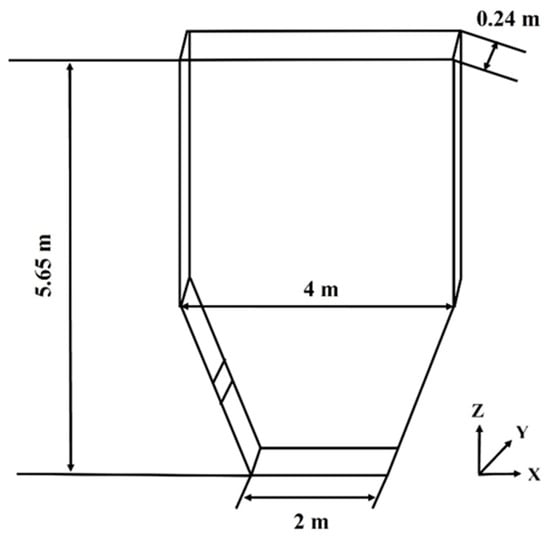
Figure 3.
Schematic diagram of a coke silo.
Figure 4a illustrates the CFD mesh partitioning of the computational domain, with a mesh dimension of 2 to 3 times the particle diameter. The initial packed bed configuration within the CS, generated by gravitational deposition of 18,000 coke particles with an initial temperature of 300 K, is illustrated in Figure 4b. The walls and particles are assumed to have the same material properties, and the periodic boundary condition is applied in the front and rear directions to eliminate the influence of walls [48]. Additionally, Figure 4c shows the grid independence test, which is performed by comparing the average gas temperature on the inlet centreline for 864, 1536, and 2400 meshes. It is worth noting that the minimum mesh quality across all three mesh types exceeds 0.93, with the smallest mesh size in the near-wall layer ranging 1.5 to 2.5 times the particle size. Thus, the mesh employed in this study possesses sufficient precision. It can be seen that the difference in gas temperature between different grid numbers is not significant. Considering the calculation accuracy and efficiency, the grid number of 1536 is selected in the simulation. Hot gas is introduced at a certain velocity through bilateral inlets (0.24 m × 0.236 m) to heat coke particles and ultimately exits via the top outlet.
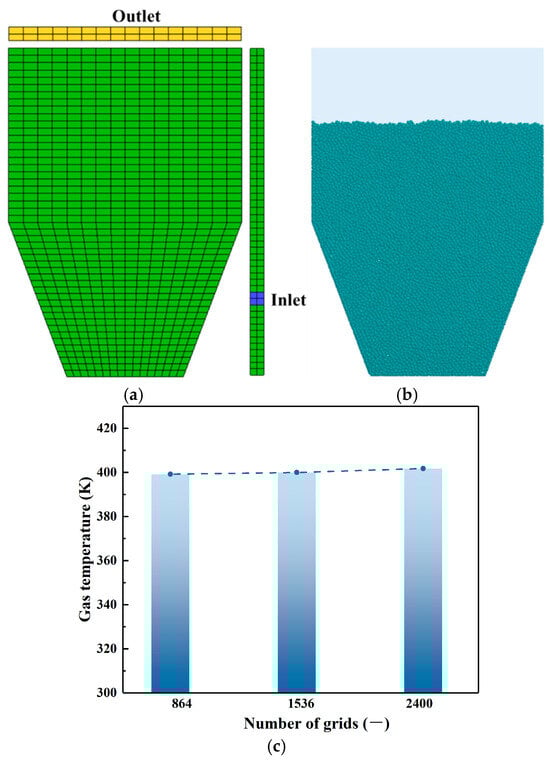
Figure 4.
(a) CFD mesh division; (b) initial particle bed structure; (c) grid independence analysis.
In the base case, the inlet gas temperature and inlet gas velocity are set to 413 K and 110 m/s, respectively. The details of the gas- and solid-phase material properties and the simulation parameters are listed in Table 1. Some of the materials and simulation parameters are adopted from the previous study [38].
It is worth noting that the inlet velocity conditions of 90 to 120 m/s used in this study are relatively high compared to practical industrial operations. Consequently, the prediction results of this study are based on extremely high gas velocity conditions (outside the range commonly used in industry). They are primarily for mechanism exploration rather than direct industrial application. Despite these limitations, the high inlet velocity conditions have been demonstrated to be reasonable in particle-packed bed systems [49].
3. Results and Discussion
3.1. Model Validation
Due to the lack of coke drying experiments and specific experimental data, to evaluate the accuracy of the mathematical model, the simulation results are verified by validating another drying experiment process in the literature and comparing the experimental data [50]. The simulated results cannot be directly compared to the experimental data since the current simulation system (dryer size and number of particles) differs from the experimental system. The drying experiments are performed in a conical column fluidised bed dryer, with 2 kg of particles dried in each trial [50]. Due to the large number of particles in the system (~106), considering the actual particle size would result in extremely high computational costs. To improve computational efficiency, the current simulation employs a simplified slice model (thickness of 0.018 m) of the fluidised bed dryer with an inlet length of 0.174 m, an outlet length of 0.457 m, a height of 0.762 m, as depicted in Figure 5, and a larger particle diameter of 2.4 mm to reduce the total number of particles. The initial moisture content of each particle is set to 19 wt%, inlet air temperature and velocity conditions are consistent with the experiment.
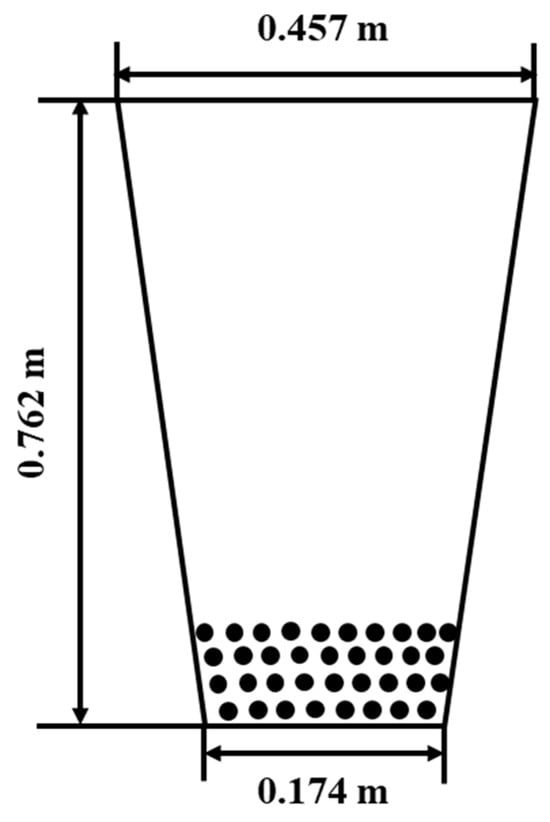
Figure 5.
Schematic diagram of the model for validation.
Therefore, the simulated and experimental data are standardised before comparison, following an approach similar to that used by Azmir et al. [24] and Aziz et al. [27]. Although this is not a direct validation of the current model, it verifies the drying curve trend generated from the numerical simulations in the present study, which has been demonstrated in the studies by Azmir et al. and Aziz et al. Moisture content is normalised using equation , where Xt is the average moisture of particles in the system at time t, and Xn denotes the normalised particle moisture. Similarly, the time is normalised using equation . Here, tmax is the drying time, with 3 min and 7.67 min for the simulation and experiment, respectively. Correspondingly, Xmax and Xmin are 19% and 14.73%, respectively, for both the simulation and experiment. tmin is zero for both the simulation and experiment.
Figure 6a compares the evolution of the normalised simulated and experimental moisture content against the normalised time. As shown in Figure 6a, the simulation results exhibit good agreement with the experimental data. Figure 6b compares the mean particle temperature with the normalised moisture ratio for both simulated and experimental results. The simulated values are slightly higher relative to the experimental values within the normalised average moisture ratio range of 0 to 0.9. Overall, the simulation results are in good agreement with the experimental data, which validates the predictive accuracy of the model. It is worth noting that the differences in scale between the current system and the experimental system may introduce certain limitations. For example, the nonlinear behaviour caused by the scale effects of flow field characteristics and heat and mass transfer may degrade the precision of the normalisation. Additionally, experimental measurements inevitably involve various sources of uncertainty, which can affect the accuracy of the results. Despite these limitations and uncertainties, this model still has good predictive accuracy with the current results validation.
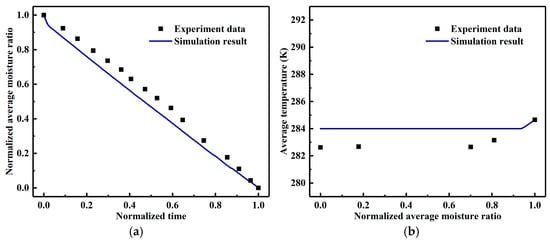
Figure 6.
Comparisons of simulation results and experiment data in the literature [50] (a) the standardised average particle moisture ratio with standardised time, and (b) average particle temperature with standardised average particle moisture ratio.
3.2. Flow Behaviour
Figure 7 presents the gas streamlines and velocity contours within the x-z plane at t = 10 s, with colours representing velocity magnitudes. Contrary to fluidised bed or spouted bed dryers, the CS dryer clearly exhibits a regionally dependent gas flow pattern, analogous to lateral gas jets entering a packed bed [48]. The gas velocity is significantly higher near the inlet, and then drops sharply when the gas flow encounters resistance from the porous coke bed. Eventually, the gas flow approaches a state of uniform low velocity as it moves through the coke bed and reaches its upper part. Additionally, gas flow in the centre and bottom areas of the dryer is relatively weak. Notably, a clear dead zone exists at the bottom of the dryer, where gas movement is minimal because the flow is impeded by the drag force and struggles to reach this region. Consequently, the drying rate of coke particles in the dead zone is quite low.
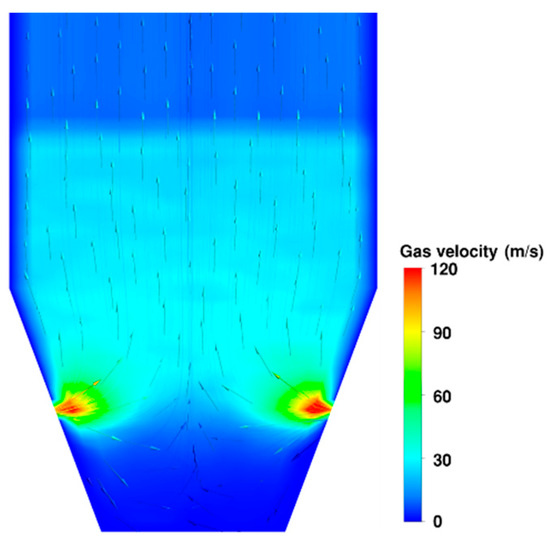
Figure 7.
Gas flow pattern in the x-z plane at t = 10 s.
To further characterise the gas flow behaviour, velocity profiles are presented in Figure 8. Figure 8a displays the gas velocity profile along the inlet centreline (x-direction), and Figure 8b shows the gas velocity distribution along the vertical centreline (z-direction) at the centre of the x-z plane. As shown in Figure 8a, the gas velocity exhibits a symmetric distribution along the centreline. It attains a maximum exceeding 120 m/s approximately 0.5 m downstream from the inlet, subsequently decreasing significantly with increasing bed depth, and ultimately reaching a minimum of approximately 18 m/s at the geometric centre. Figure 8b delineates the variation in gas velocity with height at the coke bed centre. Moving upwards from the dead zone at the bottom, the gas velocity increases rapidly from near zero to a maximum of 31 m/s at a height of approximately 2.4 m, followed by a gradual decrease to a minimum of 9 m/s as the gas exits the porous coke structure.
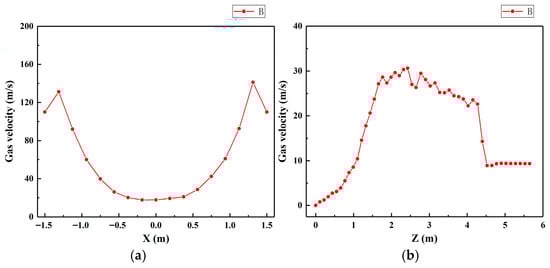
Figure 8.
Gas velocity profile (a) along the x direction at the inlet centreline and (b) along the z direction at the centre of the x-z plane.
To understand the state of gas flow within the dryer, Figure 9a shows the spatial distribution of the particle Reynolds number. The distribution of the particle Reynolds number closely follows the gas velocity pattern. The bottom region exhibits a relatively low particle Reynolds number, indicating that the gas flow in this area is in a low-velocity laminar state. In contrast, the particle Reynolds number is very high in the middle and upper regions, especially near the inlet, indicating that these areas are fully turbulent. Figure 9b illustrates the probability distribution of the particle Reynolds number. Quantitatively, particles with a Reynolds number less than 4000 account for only 1.5%, while those with a Reynolds number greater than 4000 account for up to 98.5%. This confirms that gas turbulence dominates within the current dryer.
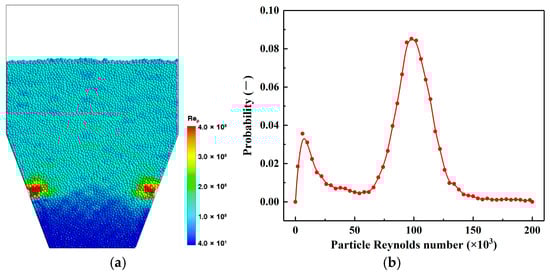
Figure 9.
(a) The spatial distribution of particle Reynolds number in the dryer; (b) The probability distribution of particle Reynolds number.
3.3. Heat and Mass Transfer Behaviours
Figure 10a illustrates the temporal evolution of gas temperature contours at an inlet gas velocity of 110 m/s and an inlet gas temperature of 413 K. Gas temperature exhibits a symmetric distribution about the central axis, with higher temperatures near the inlet forming bilateral high-temperature regions. This high-temperature zone progressively expands, reaching its maximum spatial extent at 240 s and occupying most of the coke bed volume. Additionally, the dead zone and the upper central region exhibit lower temperatures due to reduced gas flow velocity in these areas. Figure 10b depicts the temporal variation in water vapour mass fraction in the gas phase. Initially, the gas temperature is 300 K, with no water vapour present. During the initial stage (0–10 s), particles are gradually heated by the introduced hot gas. Water within the particles evaporates via convection heat transfer and migrates from the particle surface into the gas phase. Subsequently (10–120 s), the vapour concentration in the dryer increases to a maximum. In the final stage (120–240 s), the vapour concentration decreases as drying progresses, primarily due to the depletion of readily available free water in the particles. At 240 s, the vapour mass fraction is significantly reduced except in regions characterised by restricted gas flow, indicating the drying process is nearing completion. The trends in gas temperature and water vapour observed during these drying processes are consistent with those reported by Azmir et al. [24].
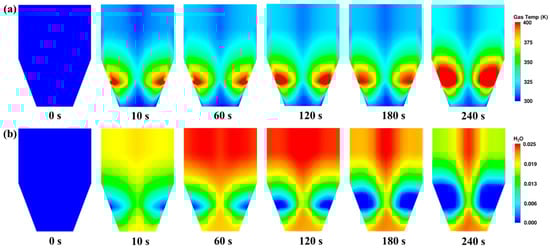
Figure 10.
Evolution of (a) gas temperature and (b) water vapour mass fraction for the inlet gas velocity of 110 m/s and the inlet gas temperature of 413 K.
Similarly, Figure 11 presents the variation in particle temperature (Figure 11a) and moisture content (Figure 11b) over time at identical operating conditions. The initial moisture content of all particles is 0.1. The injection of hot gas initiates particle heating and water evaporation at the onset of drying. Subsequently, continuous convective heat transfer causes particle temperature to rise to a maximum. Particles adjacent to the inlet are heated first, exhibiting an initial decline in moisture content as temperature increases. Meanwhile, moisture reduction begins in cooler particles located in deeper bed regions. Progressive heating permeates the bed, accompanied by declining moisture content driven by continuous gas–particle heat exchange. At 240 s, the moisture content of the majority of the particles is nearly completely evaporated. This drying phenomenon can be attributed to the heat transfer process causing evaporation when moisture-laden particles encounter the hot gas stream, thereby reducing the moisture content [51].
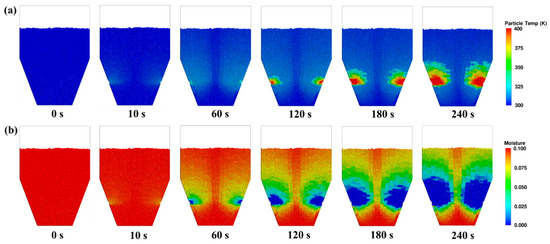
Figure 11.
Evolution of (a) particle temperature and (b) moisture content for the inlet gas velocity of 110 m/s and the inlet gas temperature of 413 K.
Figure 12a illustrates the variation in average particle moisture content and average particle temperature over time. Over the drying period from 0 s to 240 s, the average particle moisture content decreases almost linearly from 0.1 to approximately 0.04, while the average particle temperature rises nonlinearly from 300 K to 318 K. In terms of the drying rate behaviour shown in Figure 12c, the drying process can be broadly divided into three distinct drying stages [51]. The particles initially undergo a pre-heating stage (0–73 s) characterised by rapid increases in temperature and drying rate. Subsequently, the drying rate reaches a maximum and remains constant (constant-rate period of 74–146 s), while the particle heating rate declines due to substantial heat consumed by water evaporation. Finally, the drying rate gradually decreases (falling-rate period of 147–240 s) as the water content in the particles diminishes, and the particle heating rate increases. Overall, the drying rates during the constant-rate stage and the falling-rate stage differ only slightly, resulting in a near-linear trend in particle moisture reduction.
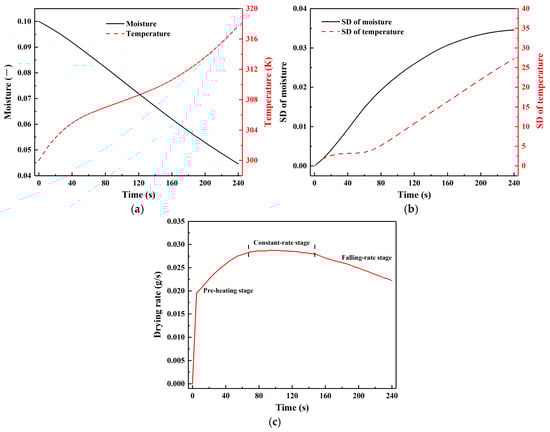
Figure 12.
Profile of (a) mean particle moisture content and temperature, (b) standard deviation of moisture content and temperature of particles, and (c) mean particle drying rate.
To further investigate drying uniformity, Figure 12b presents the standard deviation (SD) of particle moisture and temperature over time. At the onset of drying, the SD values for both moisture content and temperature increase, indicating that the uniformity of moisture evaporation and heating processes gradually decreases. Since the particle temperature rise and moisture evaporation inside the dryer is a slow process, and the particles at the bottom and centre are difficult to contact with the hot gas flow, the difference between high-temperature and low-temperature particles, as well as high-moisture and low-moisture particles, becomes more pronounced as the drying proceeds. This observation is also evident in Figure 11, where the bilateral low-moisture and high-temperature zones expand over time.
The uneven distribution of gas flow within the CS dryer leads to regional differences in particle drying characteristics. To analyse these differences, Figure 13 divides the silo vertically into zones 1, 2, and 3.
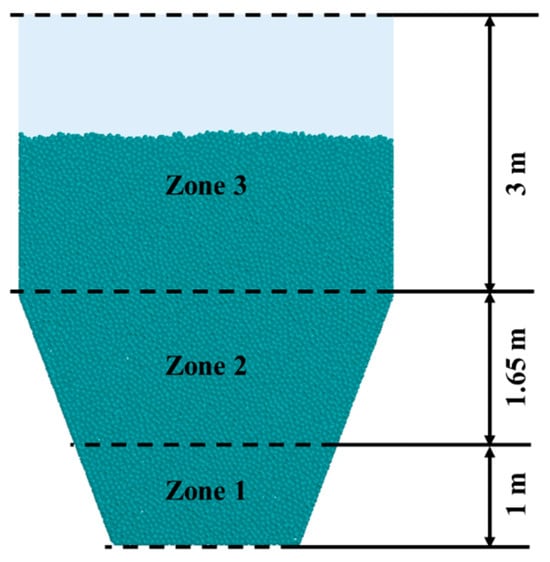
Figure 13.
Schematic diagram of a coke silo partitioning.
Figure 14a compares temporal variations in average moisture content and temperature across these zones. The average particle moisture in zone 2 exhibits the fastest decline, with an 87% reduction in average moisture (from 0.1 to 0.0135), due to strong convective heat transfer between the hot gas and particles, which promotes uniform heating and evaporation. In contrast, the average moisture content decreases by only 17% in zone 1 and 43% in zone 3. The low drying efficiency in zone 1 results from most particles residing in the dead zone, minimising contact with hot gas. Drying progresses gradually upwards from the centre, causing slower drying in zone 3 compared to zone 2. Similarly, particles in zone 2 show the fastest heating rate, with temperatures rising from 300 K to 338 K, while zones 1 and 3 exhibit slower heating with minimal temperature increases. Figure 14b shows temporal variations in average particle heat flux. Initially, the average particle heat flux in zone 2 sharply drops to a minimum, correlating with low temperature rise rates (Figure 12a), then steadily increases, accelerating the temperature rise. The average particle heat flux in zone 3 declines until mid-drying before stabilising, whereas zone 1 gradually decreases to the level of zone 3, with nearly the same final temperature. These observations illustrate the significance of high temperatures in promoting moisture reduction during the drying process [25,51].
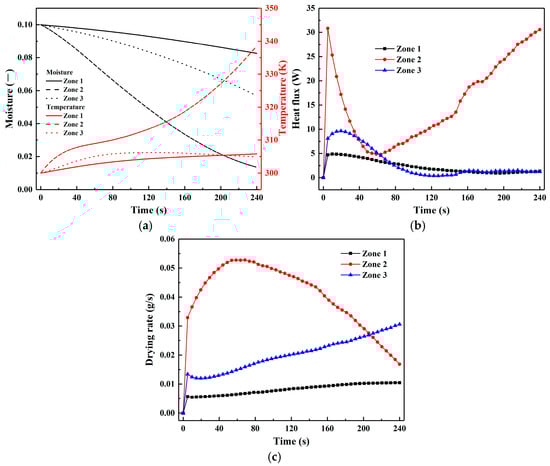
Figure 14.
Variations in (a) mean particle moisture content and temperature, (b) mean particle heat flux, and (c) mean particle drying rate over time in zone 1, zone 2, and zone 3.
Figure 14c reveals an inverse relationship between drying rate and heat flux. The average particle drying rates in zones 1 and 3 increase over time, with zone 3 being consistently higher than zone 1. Moreover, compared to the overall drying rate behaviour in the entire dryer (Figure 12c), zone 2 exhibits only pre-heating and falling-rate periods, lacking a constant-rate period. This occurs because the increased drying rate in zones 1 and 3 offsets the decreased rate in zone 2, resulting in the constant-rate stage observed in Figure 12c. However, the increase in drying rates in zones 1 and 3 is insufficient to compensate for the drying rate in zone 2 drops sharply, triggering the transition to the falling-rate stage.
3.4. Effect of Inlet Gas Velocity
Inlet gas velocity is a key operating parameter in the drying process, significantly affecting moisture and heat transfer between particles and gas. To investigate its effect, numerical simulations were conducted at inlet gas velocities of 90 m/s, 100 m/s, 110 m/s, and 120 m/s, while maintaining a constant inlet gas temperature of 413 K across all cases. Figure 15a shows the temporal evolution of average particle temperature at different inlet gas velocities. Particle temperature rises more rapidly with increasing inlet gas velocity, especially during the later drying stages. This occurs because higher inlet gas velocities deliver greater thermal energy to the dryer, raising gas temperatures and enhancing particle–gas heat transfer [27], thereby accelerating particle heating. Figure 15b illustrates that the SD of particle temperature increases with inlet gas velocity, indicating a decline in particle temperature uniformity. This is due to the expansion of high-temperature zones at higher inlet gas velocities, which aggravates temperature heterogeneity.
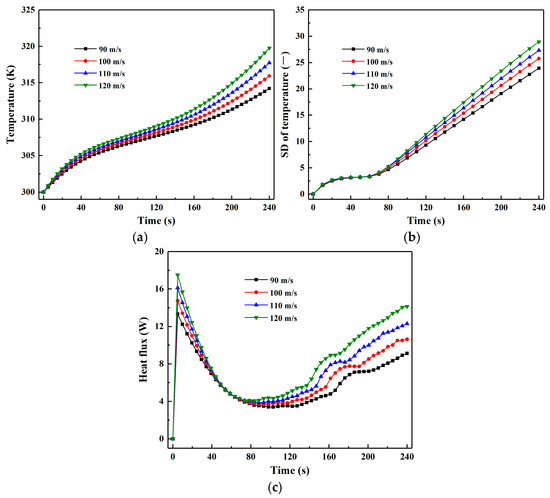
Figure 15.
Effect of inlet gas velocity on (a) mean particle temperature, (b) standard deviation of particle temperature, and (c) mean particle heat flux.
Figure 15c shows the temporal variation in average particle heat flux. The heat flux rapidly declines from its maximum to minimum during the initial drying stage, followed by a gradual increase in the mid-to-late stages. Higher inlet gas velocities increase particle heat flux throughout this process. Importantly, variations in particle heat flux directly govern particle heating rates: periods of declining and rising heat flux correspond to the phases of slow and rapid temperature increases, respectively, as shown in Figure 15a. In fact, as reported in the literature [27], an increase in inlet gas velocity enhances both the convective heat transfer rate and the drying rate (Figure 16c) due to the increase in relative velocity between the particles and gas. However, the difference is that the particle temperature variation under varying inlet gas velocities is not significant during the initial drying stage. This observation indicates that the increased drying rate results in higher heat consumption for evaporation.
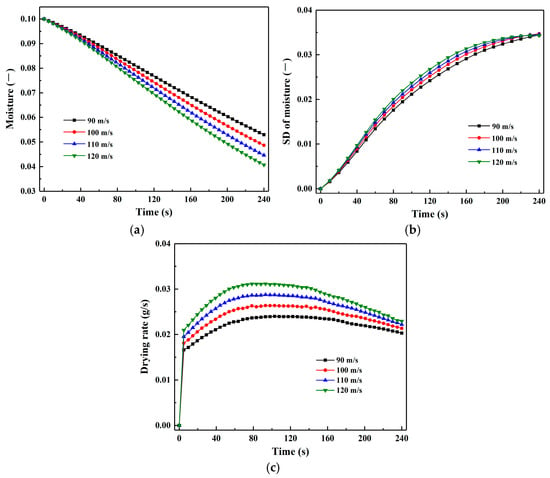
Figure 16.
Effect of inlet gas velocity on (a) mean particle moisture content, (b) standard deviation of particle moisture, and (c) mean particle drying rate.
Figure 16a illustrates the effect of inlet gas velocity on average particle moisture content. Higher inlet gas velocities accelerate moisture reduction, producing near-linear temporal decline profiles. This enhanced reduction results from the increased drying rate associated with higher inlet gas velocities (Figure 16c). The increase in drying rate with inlet gas velocity arises from two main factors: first, higher inlet gas velocity boosts the heat transfer rate, thereby enhancing drying; second, it raises the relative velocity between particles and gas, improving the mass transfer coefficient and further increasing the drying rate. The final product quality mainly depends on the uniformity of the moisture content distribution of the particles.
Figure 16b shows the temporal evolution of particle moisture SD at different inlet gas velocities. The SD of the particles increases slightly with increasing inlet gas temperature, indicating a less uniform particle moisture content. This may be due to the higher inlet velocity resulting in shorter contact time between the gas and the particles in the dryer, thereby causing poorer drying performance. Conversely, in the fluidised bed dryer, increased gas velocity enhances drying efficiency and improves particle drying uniformity [29]. This opposite trend reflects the distinctive characteristics of the CS dryer. Figure 16c compares drying rate evolution across inlet gas velocities. The drying rate increases significantly with inlet gas velocity. Additionally, the constant-rate period shortens while the falling-rate period lengthens as inlet gas velocity increases, and the differences in drying rates among velocities decrease. These trends suggest that the influence of inlet gas velocity is more pronounced during the constant-rate period and weakens as drying progresses.
3.5. Effect of Inlet Gas Temperature
Inlet gas temperature is another key operating parameter that directly influences the drying process in the CS dryer. Numerical simulations were performed to examine drying characteristics at inlet gas temperatures of 393 K, 413 K, 433 K, and 453 K, while maintaining a constant inlet gas velocity of 110 m/s in all cases. Figure 17a compares the average particle temperature over time. The rate of rise in particle temperature increases significantly with higher inlet gas temperature due to enhanced heat transfer between the particles and the gas.
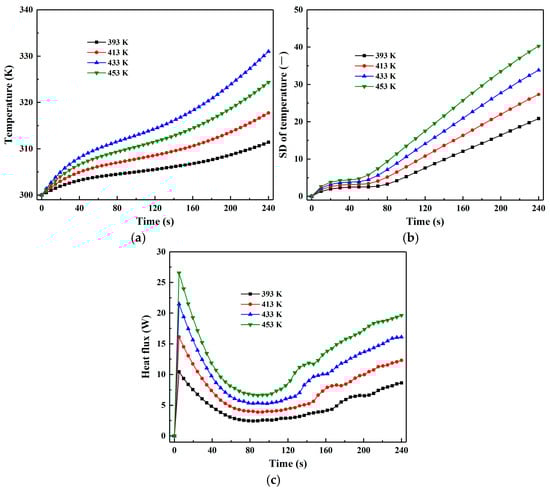
Figure 17.
Effect of inlet gas temperature on (a) mean particle temperature, (b) standard deviation of particle temperature, and (c) mean particle heat flux.
Similarly, as shown in Figure 17b, the SD of particle temperature increases with the increase in inlet gas temperature, implying less temperature uniformity. Such an observation might be the result of the combined effects of uneven airflow distribution inside the dryer and increased heat transfer rates at higher inlet gas temperatures. Furthermore, since the inlet gas velocity is the same and all particles are stationary, it can be concluded that the convective heat and mass transfer rates caused by the relative velocity of the particle with respect to the gas are approximately the same at all inlet gas temperatures. Figure 17c shows that the average particle heat flux increases with inlet gas temperature, accompanied by a more pronounced initial decrease followed by an increase in heat flux. In comparison with the gas inlet velocity, these results indicate that the increase in gas inlet temperature has a more significant impact on all stages of the drying.
Figure 18a illustrates the variation in average particle moisture content over time at different inlet gas temperatures. The drying period shortens as the inlet gas temperature rises. When the temperature increases from 393 K to 453 K, the drying period (with the same moisture of 0.055) decreases from 210 s to 166 s, respectively. This is because a higher inlet gas temperature leads to an increased drying rate [52,53] (Figure 18c), thereby accelerating the reduction in particle moisture. Although a higher gas temperature results in a shorter drying period, a high temperature could have negative effects on the product quality, such as thermal stress or physical structural damage [24]. As mentioned above, the product quality can be reflected to a certain extent by the uniformity of particle moisture content during drying.
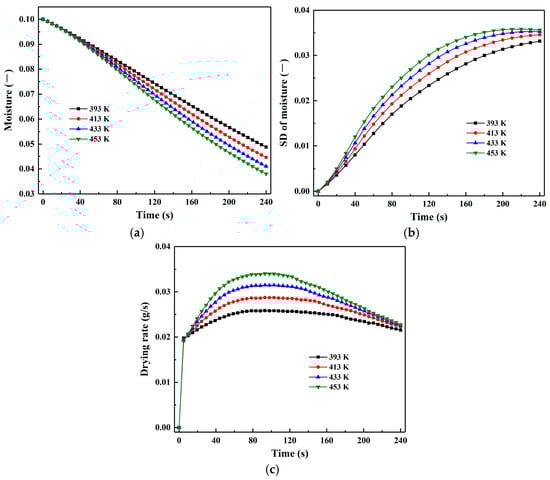
Figure 18.
Effect of inlet gas temperature on (a) mean particle moisture content, (b) standard deviation of particle moisture, and (c) mean particle drying rate.
As shown in Figure 18b, the SD of particle moisture rises with increasing inlet gas temperature, indicating a decline in uniform moisture distribution. This observation might be the combined result of regional differences in dryness and the increased drying rate. Due to insufficient drying in some areas of the dryer, there is an uneven moisture distribution. Furthermore, the increase in drying rate at a higher temperature further reduces moisture uniformity. On the other hand, uneven gas temperature distribution in the dryer might also lead to non-uniform particle moisture distribution. Figure 18c compares the evolution of the drying rate, showing that higher inlet gas temperatures shorten the constant-rate period and prolong the falling-rate period, while also extending and intensifying the preheating period.
4. Conclusions
In this study, a coupled CFD-DEM model was developed to accurately simulate the drying process of wet coke particles within a CS dryer. Furthermore, the effects of varying inlet gas velocities and inlet gas temperatures on the drying process were systematically quantified. The primary conclusions are summarised as follows:
- (1)
- The uneven distribution of gas flow within the CS dryer results in insufficient drying of particles in the centre and bottom regions, and forms a distinct dead zone at the bottom. As the drying process progresses, the spatial non-uniformity in particle moisture content and temperature distribution gradually intensifies. In comparison to zones 1 and 3, particles in zone 2 exhibit relatively high drying rates and heat fluxes, zones 1 and 3 show similar trends in temperature rise and heat flux, with zone 1 demonstrating the lowest drying rate and the smallest reduction in moisture content.
- (2)
- Increasing the inlet gas velocity enhances the particle drying rate and heat flux, thereby accelerating moisture reduction and particle temperature rise. However, higher inlet gas velocities decrease the uniformity of particle moisture distribution, slightly reducing drying product quality. Additionally, increased inlet gas velocity shortens the constant-rate period and prolongs the falling-rate period. The effect of inlet gas velocity on particle heat flux becomes significant mainly after the constant-rate period.
- (3)
- In comparison, inlet gas temperature has a more significant impact on the drying process. Increasing inlet gas temperature substantially enhances particle heat flux throughout the drying duration, leading to a more rapid rise in both particle temperature and its SD. The particle drying rate also increases with higher inlet gas temperature, accompanied by a shortening of the constant-rate period and an extension of the pre-heating and falling-rate periods.
The fundamental insights and key parameter influence trends obtained in this study are valuable for enhancing the mechanistic understanding of the coke drying process. Nevertheless, there are still limitations that need to be improved. As the current model is validated indirectly through normalisation, which has some impact on the model’s predictive accuracy. To address this limitation, future work will consider directly validating the model using data from coke drying experiments. Additionally, a three-dimensional model closer to the industrial scale will also be developed.
Author Contributions
Conceptualization, P.Z. and D.E.; Methodology, P.Z. and J.C.; Software, P.Z. and Y.W.; Validation, P.Z.; Investigation, P.Z. and Y.W.; Writing—original draft, P.Z.; Writing—review & editing, P.Z., J.C. and D.E.; Supervision, J.C. and D.E.; Funding acquisition, J.C. and D.E. All authors have read and agreed to the published version of the manuscript.
Funding
This research was funded by the National Natural Science Foundation of China (grant No. 52264042) and Jiangxi Provincial Natural Science Foundation (grant No. 20242BAB23034, 20242BAB20162, 20223AAG01009, 20214BBG74005).
Data Availability Statement
The original contributions presented in this study are included in the article. Further inquiries can be directed to the corresponding authors.
Conflicts of Interest
The authors declare that they have no known competing financial interests or personal relationships th at could have appeared to influence the work reported in this paper.
References
- Cil, B.; Topuz, A. Fluidized bed drying of corn, bean and chickpea. J. Food Process Eng. 2010, 33, 1079–1096. [Google Scholar] [CrossRef]
- Lang, W.; Sokhansanj, S. Bulk volume shrinkage during drying of wheat and canola. J. Food Process Eng. 1993, 16, 305–314. [Google Scholar] [CrossRef]
- Jang, J.; Arastoopour, H. CFD simulation of a pharmaceutical bubbling bed drying process at three different scales. Powder Technol. 2014, 263, 14–25. [Google Scholar] [CrossRef]
- Park, J.H.; Lee, C.H.; Park, Y.C.; Shun, D.; Bae, D.H.; Park, J. Drying efficiency of indonesian lignite in a batch-circulating fluidized bed dryer. Dry. Technol. 2014, 32, 268–278. [Google Scholar] [CrossRef]
- Aziz, H.; Sansare, S.; Duran, T.; Gao, Y.J.; Chaudhuri, B. On the applicability of the coarse grained coupled CFD-DEM model to predict the heat transfer during the fluidized bed drying of pharmaceutical granules. Pharm. Res. 2022, 39, 1991–2003. [Google Scholar] [CrossRef]
- Gavel, D.J. A review on nut coke utilisation in the ironmaking blast furnaces. Mater. Sci. Technol. 2016, 33, 381–387. [Google Scholar] [CrossRef]
- Lv, Q.Q.; Tian, Y.S.; Du, P.; Zhou, J.L.; Wang, G.H. A study on the characteristics of coke in the hearth of a superlarge blast furnace. PLoS ONE 2021, 16, e0247051. [Google Scholar] [CrossRef]
- Zhao, Z.G.; Yu, X.B.; Shen, Y.S. Transient CFD study of wet burden charging on dynamic in-furnace phenomena in an ironmaking blast furnace: Impacts and remedies. Powder Technol. 2022, 408, 117708. [Google Scholar] [CrossRef]
- Lan, C.C.; Hao, Y.J.; Shao, J.N.; Zhang, S.H.; Liu, R.; Lyu, Q. Effect of H2 on Blast Furnace Ironmaking: A Review. Metals 2022, 12, 1864. [Google Scholar] [CrossRef]
- Yilmaz, C.; Wendelstorf, J.; Turek, T. Modeling and simulation of hydrogen injection into a blast furnace to reduce carbon dioxide emissions. J. Clean. Prod. 2017, 154, 488–501. [Google Scholar] [CrossRef]
- Chen, L.G.; Yang, B.; Shen, X.; Xie, Z.H.; Sun, F.R. Thermodynamic optimization opportunities for the recovery and utilization of residual energy and heat in China’s iron and steel industry: A case study. Appl. Therm. Eng. 2015, 86, 151–160. [Google Scholar] [CrossRef]
- Cywicka-Jakiel, T. Fast-neutron and gamma-ray transmission method for coke-humidity determination. Appl Energy. 2003, 74, 305–311. [Google Scholar] [CrossRef]
- Ravichandar, D.; Naha, T.K.; Pillai, M.S.; Nagashanmugam, K.B. The influence of porosity on the moisture adsorption capacity of coke and installation of drying system to minimize coke moisture fluctuation. Trans. Indian Inst. Met. 2015, 69, 61–65. [Google Scholar] [CrossRef]
- Wang, S.; Luo, K.; Hu, C.S.; Lin, J.J.; Fan, J.R. CFD-DEM simulation of heat transfer in fluidized beds: Model verification, validation, and application. Chem. Eng. Sci. 2019, 197, 280–295. [Google Scholar] [CrossRef]
- Zhuang, Y.Q.; Chen, X.M.; Luo, Z.H.; Xiao, J. CFD-DEM modeling of gas-solid flow and catalytic MTO reaction in a fluidized bed reactor. Comput. Chem. Eng. 2014, 60, 1–16. [Google Scholar] [CrossRef]
- Uglietti, R.; Bracconi, M.; Maestri, M. Coupling CFD-DEM and microkinetic modeling of surface chemistry for the simulation of catalytic fluidized systems. React. Chem. Eng. 2018, 3, 527–539. [Google Scholar] [CrossRef]
- Xie, J.; Zhong, W.Q.; Shao, Y.J.; Li, K.X. Coupling of CFD-DEM and reaction model for 3D fluidized beds. Powder Technol. 2019, 353, 72–83. [Google Scholar] [CrossRef]
- Cai, W.J.; Zhang, Q.H.; Wang, S.Y.; Lu, H.L. Numerical investigation of the two-fluid model and computational fluid dynamics-discrete element method in supercritical methanol fluidized beds. Ind. Eng. Chem. Res. 2022, 61, 14983–14999. [Google Scholar] [CrossRef]
- Wei, G.C.; Zhang, H.; An, X.Z.; E, D.Y. Numerical investigation on the mutual interaction between heat transfer and non-spherical particle dynamics in the blast furnace raceway. Int. J. Heat Mass Tran. 2020, 153, 119577. [Google Scholar] [CrossRef]
- Wang, S.; Shen, Y.S. CFD-DEM modelling of raceway dynamics and coke combustion in an ironmaking blast furnace. Fuel 2021, 302, 121167. [Google Scholar] [CrossRef]
- Wei, G.C.; Zhang, H.; An, X.Z.; Jiang, S.Q. Influence of particle shape on microstructure and heat transfer characteristics in blast furnace raceway with CFD-DEM approach. Powder Technol. 2020, 361, 283–296. [Google Scholar] [CrossRef]
- Alobaid, F.; Epple, B. Improvement, validation and application of CFD/DEM model to dense gas-solid flow in a fluidized bed. Particuology 2013, 11, 514–526. [Google Scholar] [CrossRef]
- Deb, S.; Tafti, D. Investigation of flat bottomed spouted bed with multiple jets using DEM-CFD framework. Powder Technol. 2014, 254, 387–402. [Google Scholar] [CrossRef]
- Azmir, J.; Hou, Q.F.; Yu, A.B. Discrete particle simulation of food grain drying in a fluidised bed. Powder Technol. 2018, 323, 238–249. [Google Scholar] [CrossRef]
- Azmir, J.; Hou, Q.F.; Yu, A.B. CFD-DEM simulation of drying of food grains with particle shrinkage. Powder Technol. 2019, 343, 792–802. [Google Scholar] [CrossRef]
- Azmir, J.; Hou, Q.F.; Yu, A.B. CFD-DEM study of the effects of food grain properties on drying and shrinkage in a fluidised bed. Powder Technol. 2020, 360, 33–42. [Google Scholar] [CrossRef]
- Aziz, H.; Ahsan, S.N.; De Simone, G.; Gao, Y.J.; Chaudhuri, B. Computational modeling of drying of pharmaceutical wet granules in a fluidized bed dryer using coupled CFD-DEM approach. AAPS PharmSciTech 2022, 23, 59. [Google Scholar] [CrossRef]
- Zhong, Z.X.; Ku, X.K.; Lin, J.Z.; Yu, Z.S. Influence of reactor configuration and operating conditions on heat transfer and drying behavior of wet particles in a spouted bed. Powder Technol. 2025, 461, 121117. [Google Scholar] [CrossRef]
- Liu, H.R.; He, Y.R.; Tang, T.Q.; Zhai, M. Prediction of the non-uniform drying of wet grain in a fluidised-bed based on a modified CFD-DEM drying model. Biosyst. Eng. 2023, 236, 103–119. [Google Scholar] [CrossRef]
- Jin, H.; Wu, Q.; Wang, S.; He, Y. Heat and mass transfer performance of non-spherical wet particles in a fluidized bed dryer. Appl. Therm. Eng. 2024, 236, 121780. [Google Scholar] [CrossRef]
- Launder, B.E.; Spalding, D.B. The numerical computation of turbulent flows. Comp. Methods Appl. Mech. Eng. 1974, 3, 269–289. [Google Scholar] [CrossRef]
- Wei, G.C.; Zhang, H.; An, X.Z.; Xiong, B.; Jiang, S.Q. CFD-DEM study on heat transfer characteristics and microstructure of the blast furnace raceway with ellipsoidal particles. Powder Technol. 2019, 346, 350–362. [Google Scholar] [CrossRef]
- Li, M.; Li, C.; Wu, G.; An, X.; Zhang, H. DEM-CFD investigation on the blast furnace raceway characteristics: Heat/mass transfer, dynamics and mechanisms. Powder Technol. 2024, 435, 119411. [Google Scholar] [CrossRef]
- Mahmoodi, B.; Hosseini, S.H.; Ahmadi, G. CFD-DEM simulation of a pseudo-two-dimensional spouted bed comprising coarse particles. Particuology 2019, 43, 171–180. [Google Scholar] [CrossRef]
- Gidaspow, D.; Rukmini, B.; Ding, J. Hydrodynamics of Circulating Fluidized Beds: Kinetic Theory Approach; Illinois Inst. of Tech., Dept. of Chemical Engineering: Chicago, IL, USA, 1990. [Google Scholar]
- Wu, Z.; Shi, Y.; Zhou, F.; Li, B.; Zhang, X. Numerical Simulation of Pellet Drying Process in Updraught Drying of Chain Grate Based on CFD-DEM. Trans. Indian Inst. Met. 2021, 74, 1751–1761. [Google Scholar] [CrossRef]
- Cundall, P.A.; Strack, O.D.L. A discrete numerical model for granular assemblies. Geotechnique 1979, 29, 47–65. [Google Scholar] [CrossRef]
- E, D.Y.; Zhou, P.; Guo, S.Y.; Zeng, J.; Xu, Q.; Guo, L.J.; Hou, Q.F.; Yu, A.B. Particle-scale study of coke combustion in the raceway of an ironmaking blast furnace. Fuel 2021, 311, 122490. [Google Scholar] [CrossRef]
- E, D.Y.; Zhou, P.; Ji, L.Y.; Cui, J.X.; Xu, Q.; Guo, L.J.; Yu, A.B. Particle-scale modelling of injected hydrogen and coke co-combustion in the raceway of an ironmaking blast furnace. Fuel 2023, 336, 126778. [Google Scholar] [CrossRef]
- Chaudhuri, B.; Muzzio, F.J.; Tomassone, M.S. Modeling of heat transfer in granular flow in rotating vessels. Chem. Eng. Sci. 2006, 61, 6348–6360. [Google Scholar] [CrossRef]
- Sousani, M.; Hobbs, A.M.; Anderson, A.; Wood, R.J.P.T. Accelerated heat transfer simulations using coupled DEM and CFD. Powder Technol. 2019, 357, 367–376. [Google Scholar] [CrossRef]
- Zhou, Z.Y.; Yu, A.B.; Zulli, P. Particle scale study of heat transfer in packed and bubbling fluidized beds. AIChE J. 2009, 55, 868–884. [Google Scholar] [CrossRef]
- Jin, H.Y.; Wang, S.; He, Y.R. Investigation of drying process of non-spherical particle in a pulsed fluidized bed. Particuology 2025, 98, 134–141. [Google Scholar] [CrossRef]
- Ranz, W.E. Evaporation form drops. Chem. Eng. Prog. 1952, 48, 141–146. [Google Scholar]
- Pan, K.S.; Jen, W.H.; Wang, T.F.; Lo, K.Y.; Hsu, W.Y.; Huang, A.N.; Kuo, H.P. CFD-DEM studies of continuous particle drying in a bubbling fluidized bed with large hole perforated plates. Can. J. Chem. Eng. 2025. [Google Scholar] [CrossRef]
- Choicharoen, K.; Devahastin, S.; Soponronnarit, S. Numerical simulation of multiphase transport phenomena during impinging stream drying of a particulate material. Dry. Technol. 2012, 30, 1227–1237. [Google Scholar] [CrossRef]
- Khomwachirakul, P.; Devahastin, S.; Swasdisevi, T.; Soponronnarit, S. Simulation of flow and drying characteristics of high-moisture particles in an impinging stream dryer via CFD-DEM. Dry. Technol. 2015, 34, 403–419. [Google Scholar] [CrossRef]
- Hou, Q.F.; E, D.Y.; Yu, A.B. Discrete particle modeling of lateral jets into a packed bed and micromechanical analysis of the stability of raceways. AIChE J 2016, 62, 4240–4250. [Google Scholar] [CrossRef]
- Lu, Y.X.; Liu, S.H.; Zhang, X.R.; Jiang, Z.Y.; E, D.Y. A probabilistic statistical method for the determination of void morphology with CFD-DEM approach. Energies 2020, 13, 4041. [Google Scholar] [CrossRef]
- Briens, L.; Bojarra, M. Monitoring fluidized bed drying of pharmaceutical granules. AAPS PharmSciTech 2010, 11, 1612–1618. [Google Scholar] [CrossRef]
- Nadda, M.; Banaeizadeh, A.; Avilala, P.; Roy, S.; Yadav, A. Coupled computational fluid dynamics-discrete element method (CFD-DEM) modeling of moisture removal in a fluidized bed dryer for heterogeneously coated solids. Chem. Eng. Sci. 2025, 316, 121811. [Google Scholar] [CrossRef]
- Chen, H.; Liu, X.; Bishop, C.; Glasser, B.J. Fluidized bed drying of a pharmaceutical powder: A parametric investigation of drying of dibasic calcium phosphate. Dry. Technol. 2017, 35, 1602–1618. [Google Scholar] [CrossRef]
- Chen, H.; Rustagi, S.; Diep, E.; Langrish, T.A.G.; Glasser, B.J. Scale-up of fluidized bed drying: Impact of process and design parameters. Powder Technol. 2018, 339, 8–16. [Google Scholar] [CrossRef]


Disclaimer/Publisher’s Note: The statements, opinions and data contained in all publications are solely those of the individual author(s) and contributor(s) and not of MDPI and/or the editor(s). MDPI and/or the editor(s) disclaim responsibility for any injury to people or property resulting from any ideas, methods, instructions or products referred to in the content. |
© 2025 by the authors. Licensee MDPI, Basel, Switzerland. This article is an open access article distributed under the terms and conditions of the Creative Commons Attribution (CC BY) license (https://creativecommons.org/licenses/by/4.0/).