Abstract
This preliminary study investigates the optimization of the mechanical properties of the zinc wrought alloy ZEP1510 with the objective of assessing its potential to approach the hardness, strength, and toughness of the brass alloy, CuZn21Si3P. Enhancing both toughness and hardness was targeted to improve the durability of potential replacement components. Heat treatment was the primary method, applying annealing, air cooling, water quenching, and artificial aging to modify material properties. Mechanical characterization was performed through Brinell hardness, as well as tensile and Charpy impact testing, complemented by metallographic analysis. Air cooling from temperatures near the transformation point at 275 °C produced a visually refined and homogeneous microstructure (qualitative assessment by OM/SEM), resulting in simultaneous increases in hardness and toughness. Water quenching from this range yielded a metastable state with high toughness but low hardness, while subsequent natural aging significantly increased strength and reduced toughness. Artificial aging indicated precipitation hardening behavior similar to that of aluminum alloys. Although property improvements were achieved, the targeted combination of high toughness and high strength was not fully realized. The findings suggest that controlled artificial aging, alternative quenching media and grain refinement strategies could further enhance performance, providing a basis for tailoring ZEP1510 for demanding engineering applications.
1. Introduction
The increasing global demand for raw materials, rising production costs, and tightening environmental regulations are reshaping the requirements placed on modern engineering materials. Industries that manufacture safety-critical components are under growing pressure to combine uncompromising functional performance with improved sustainability and resource efficiency [1]. In this context, replacing conventional high-cost alloys with environmentally friendly alternatives that offer comparable or superior properties has become a key driver of innovation. Gas cylinder valves for respiratory protection equipment are subject to stringent requirements defined in the DIN EN 144-1 [2] standard. In addition to dimensional and tolerance specifications, this standard sets out test procedures for assessing impact resistance to ensure operational safety. Valve bodies intended for such applications must pass the specified impact test at a defined energy level without exhibiting cracks in the material or unacceptable leakage of the system. Currently, valve bodies are predominantly manufactured from the lead-free high-performance brass alloy CuZn21Si3P, which offers a proven balance of strength, toughness, and machinability [3]. Despite its favorable technical properties, rising raw material costs and the need for improved resource efficiency are driving the search for alternative materials. The zinc wrought alloy ZEP1510 represents a potentially more cost-effective and resource-efficient alternative that is, in principle, capable of achieving the mechanical properties required for valve bodies [4]. Its nominal chemical composition is approximately 15 wt.% Al, 1 wt.% Cu, and 0.1 wt.% Mg, with the balance being Zn. To evaluate its suitability for safety-critical components such as gas cylinder valves, preliminary investigations into the optimization of key mechanical properties—particularly toughness and strength—are presented in this work. Heat treatment plays a central role in this context, and its influence on the property profile of ZEP1510 is explored in an initial study.
Brass alloys have long played a central role in the production of components for the sanitary, electrical, and fittings industries. Leaded free-cutting brasses such as CuZn39Pb3 are particularly valued for their excellent machinability and favorable forming behavior. However, increasing regulatory restrictions [5] on lead usage and a growing focus on environmental sustainability have intensified the search for lead-free alternatives. One such candidate is CuZn21Si3P, which, despite its somewhat reduced machinability, is considered a promising substitute for traditional leaded alloys [3]. At the same time, the rising costs of copper and energy-intensive processing have introduced significant economic pressure [6]. As a result, there is a growing interest in alternative materials that combine ecological benefits with lower production costs. ZEP1510 is seen as a promising alternative to brass. ZEP1510 differs from traditional die-cast zinc alloys as it was specifically developed for forging, thereby enabling additional processing routes such as extrusion [4]. As a response to the restrictions on lead, ZEP1510 was developed to replace copper–zinc–lead alloys such as CuZn39Pb3 [4]. ZEP1510 combines strength and functionality, showing a yield strength about 40% higher than CuZn39Pb3 while keeping enough ductility for forming operations. Its electrical conductivity, around 15% above machining brass, further broadens possible applications in electronics [4]. Demonstration trials confirmed its suitability for cold forging, producing items like bolts, terminals, and rivets [7]. While its machinability is somewhat below that of leaded brass, it remains serviceable in practice. Together with excellent recyclability and the prospect of up to 40% CO2 reduction compared to brass, the alloy presents a sustainable alternative [8]. Presently available as rods, work is underway to enable its production in wire form for continuous forging processes [9]. According to Rollez et al. [10], prolonged exposure of ZEP1510 to 80 °C or 220 °C can reduce hardness by as much as 30%, attributed to η-phase recrystallization. This underlines the importance of assessing thermal stability for long-term use. Montesano et al. [11] investigated cavitation erosion of ZnAl15Cu1Mg by ASTM G32 ultrasonic testing, benchmarking it against ZA27 and Alzen305. Despite its comparatively low hardness, ZEP1510 exhibited the smallest mass loss, which was linked to its refined microstructure with evenly distributed eutectic phases. These characteristics suggest promising suitability for fluid power and other wear-intensive applications. A previous study [12] investigated the corrosion behavior of the lead-free zinc wrought alloy ZEP1510 under standardized test conditions, comparing its performance to that of conventional brass (CuZn40Pb2) and galvanized steel. Using neutral salt spray (DIN EN ISO 9227 [13]) and condensation water constant climate (DIN EN ISO 6270-2 [14]) tests, the authors demonstrated that ZEP1510 exhibits corrosion resistance comparable to brass and superior to galvanized steel. The findings underline the alloy’s potential as a sustainable substitute for traditional materials in applications requiring both mechanical performance and corrosion protection. While ZEP1510’s combination of mechanical performance, corrosion resistance, and processing versatility positions it as a strong candidate for safety-critical applications, its aluminum content also introduces the potential for precipitation phenomena within the Zn–Al system. In binary Zn–Al alloys, precipitation typically occurs at lower temperatures, and prolonged exposure, even below 150 °C, can promote coarsening of intermetallic phases such as the η-phase, leading to changes in mechanical properties [15]. In contrast, in multicomponent Zn–Al–Mg(-X) alloys such as ZEP1510, additional alloying elements can significantly modify precipitation and recrystallization behavior [16,17]. This makes thermal stability a critical consideration in both the design and service life of ZEP1510 components, particularly when heat treatment is used as a tool for property optimization [18]. The aim is to identify tendencies in heat treatment parameters that could potentially lead to a property level comparable to that of CuZn21Si3P while meeting the requirements of DIN EN 144-1 [2]. The novelty of this work lies in providing, for the first time, a systematic evaluation of annealing, quenching, and aging treatments for ZEP1510, linking mechanical test results with metallographic observations. Unlike previous studies that primarily focused on corrosion resistance, machinability, or forming feasibility, this paper explores the precipitation behavior and toughness optimization of ZEP1510. In this way, it establishes a foundation for tailoring this zinc wrought alloy to safety-critical engineering applications.
2. Materials and Methods
2.1. Heat Treatment
The aim of the heat treatment experiments was to provide preliminary insights into the mechanical property changes of ZEP1510 and to explore whether its behavior could resemble that of the brass alloy CuZn21Si3P. Samples of ZEP1510 were placed in a furnace for a specified duration and heated accordingly. Since the melting point of ZEP1510 is 378 °C [19], heat treatment was limited to a maximum temperature of 340 °C. A Heraeus furnace, model RL-200E, was used for this purpose. As a reference, CuZn21Si3P samples were soft-annealed at 580 °C for 3 h, followed by hardness and toughness testing. Similarly, ZEP1510 samples were initially annealed at 150 °C for 4 h in accordance with the manufacturer’s recommendations, allowing a direct comparison of properties. To evaluate the effect of different heat treatment conditions on hardness and toughness, ZEP1510 samples were treated at various temperatures for 1 h, followed by air cooling at room temperature (cf. Table 1). Based on the results, parameters such as holding time and cooling medium were subsequently varied.

Table 1.
Summary of all performed heat treatment procedures.
Rapid cooling (e.g., in 20 °C water) can result in a metastable phase, similar to precipitation hardening in aluminum. Aging treatments were also carried out as part of the heat treatment strategy.
2.2. Material Testing
Several test methods were employed to characterize the material properties and to track changes resulting from heat treatment. Although previous studies provided initial reference values, extensive data for conditions following heat treatment were still required.
2.2.1. Brinell Hardness Test
Hardness was measured before and after heat treatment using the Brinell method (DIN EN ISO 6506-1). Testing was performed with an EMCO-test M4U-075 (EMCO-TEST Prüfmaschinen GmbH, Kuchl, Austria) hardness tester, using a 2.5 mm diameter carbide ball and a test load of 612.9 N (equivalent to 10 N/mm2). The surface of the Charpy samples was used for indentation.
After ensuring the test surface was clean and flat, the sample was positioned to avoid interference from prior indentations. The ball was pressed vertically into the surface for 10–15 s (cf. Figure 1). Using 96× optical magnification, the diameter of the indent was measured along two orthogonal axes. The average of at least three measurements was used to calculate the Brinell hardness value.
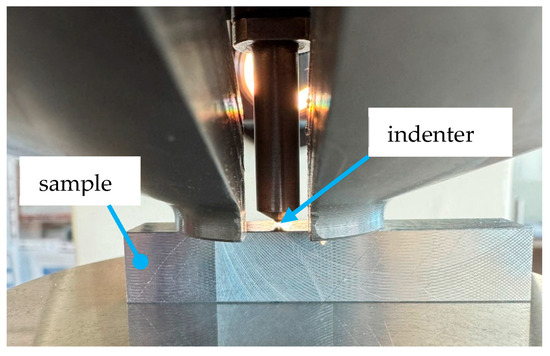
Figure 1.
Brinell hardness test; hardness measurement on a Charpy V sample.
2.2.2. Charpy Impact Test
The Charpy impact test (DIN EN ISO 148-1) was conducted to assess the material’s resistance to dynamic loading and determine fracture behavior. This is essential for evaluating changes in toughness due to heat treatment. V-notched standard samples (55 mm × 10 mm × 10 mm) were used, and tests were conducted at room temperature.
Testing was performed on a PSd 450 pendulum impact tester (Kögel Werkstoff- und Materialprüfsysteme GmbH, Leipzig, Germany) with a nominal energy of 300 J and a hammer tip radius of 2 mm. Friction losses were determined via preliminary empty runs and subtracted from the measured impact energy.
The samples were positioned with the V-notch facing away from the hammer, which then fractured the sample with a single swing (cf. Figure 2). Impact energy was derived from the height difference before and after fracture. Fracture appearance was classified as brittle (T), mixed (M), ductile (V), or non-fractured (V*).
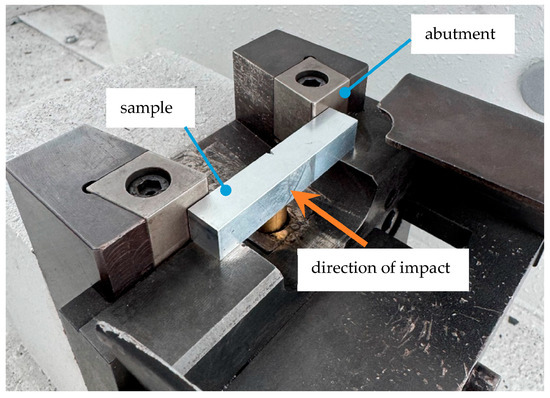
Figure 2.
Alignment of the sample in the pendulum impact tester.
2.2.3. Tensile Testing
Tensile tests were carried out in accordance with DIN EN ISO 6892-1 (room temperature) and 6892-2 (elevated temperature). These tests provided essential parameters for structural calculations and material comparisons, particularly because the material may be subjected to elevated temperatures during application. Non-proportional round samples with threaded ends were used, with a gauge length of 30 mm and a cross-sectional area of 6 mm2.
Testing was performed using a Zwick Roell Z100 (ZwickRoell GmbH & Co. KG, Ulm, Germany) universal testing machine (cf. Figure 3). For elevated temperature tests, a Maytec HTO-15-FB14 (MAYTEC Mess- und Regeltechnik GmbH, Singen, Germany) furnace with three heating zones and a Zwick Roell ME44-186 (ZwickRoell GmbH & Co. KG, Ulm, Germany) controller was employed. Strain was measured using an Epsilon 3549 extensometer with ceramic sensor arms.
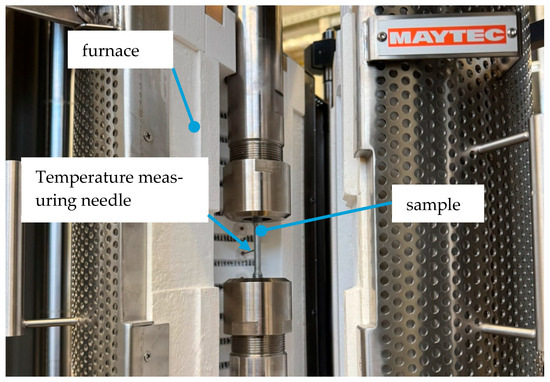
Figure 3.
Clamped sample for the elevated temperature test.
After securing the sample in the testing machine, the test began with a preload of 400 N. During elevated temperature tests, the furnace heated the specimen at defined rates (cf. Table 2), and the extensometer was attached once the target temperature was reached. All test parameters and results were recorded using Zwick’s testXpert III v.1.5 software.
Table 2.
Heating rates for elevated temperature tensile tests.
2.2.4. Metallographic Analysis
Metallographic analysis provides insight into the microstructure of metallic materials. Understanding the microstructure helps to reveal the relationship between chemical composition, phase formation, mechanical properties, and in-service behavior of the material.
Proper sample preparation is essential for accurate light microscopic analysis. To ensure flatness and cleanliness, the samples were ground and polished. Charpy samples were sectioned and embedded using the cold-curing resin VariKEM 200 (Schmitz-Metallographie GmbH, Herzogenrath, Germany), which cures at room temperature.
The grinding and polishing process was carried out using an ATM Saphir 330 system. The procedure included sequential grinding, intermediate cleaning, and final polishing steps, as listed in Table 3.
Table 3.
Metallographic preparation steps.
During grinding, the direction of grinding was alternated by 90° between steps. After each step, the samples were rinsed with water and dried with ethanol. The process continued until deformation layers from the previous stage were completely removed [20].
Prepared samples were analyzed using a Keyence Remax V digital microscope (Keyence Deutschland GmbH, Frankfurt am Main, Germany) and an Olympus BX51-M optical microscope (Olympus Europa SE Co. KG, Hamburg, Germany). Initially, samples were observed in the unetched state to identify pores and non-metallic inclusions, and to evaluate intergranular corrosion. These features are often more visible without etching. Subsequently, the samples were etched using 3% nitric acid in ethanol to reveal the microstructure of the Zn-Al alloy. This etchant enables phase contrast visualization [21]. Figure 4a shows the etched structure of the ZEP1510 alloy, recorded in brightfield mode (BF), where illumination is directed perpendicularly to the sample surface.
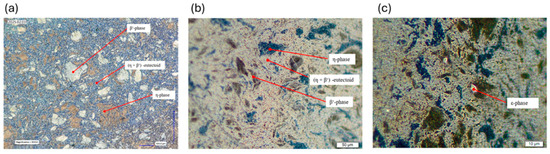
Figure 4.
(a) Microstructure analysis under the digital microscope (initial state ZEP1510); BF; magnified 600 times. (b) Microstructure analysis under the light microscope (initial state ZEP1510); DF; magnified 500 times. (c) Microstructure analysis under the light microscope (initial state ZEP1510); DF; magnified 1000 times.
After etching, phase differentiation became visible: the aluminum-rich β’-phase appeared bright, while the zinc-rich η-phase appeared as darker brown regions. This phase identification is consistent with prior metallographic studies on Zn-Al-Cu alloys [10].
3. Results
3.1. Heat Treatment
To evaluate the potential of ZEP1510 as a substitute for the brass alloy CuZn21Si3P, a direct comparison of mechanical properties in the soft-annealed state was conducted. Since CuZn21Si3P is typically characterized in the annealed condition, heat treatment was applied to both materials according to their respective manufacturer guidelines to achieve comparable states.
The results in Table 4 summarize the Brinell hardness (HBW), Charpy impact energy (KV2), and fracture appearance before and after soft annealing. While CuZn21Si3P shows a substantial increase in toughness after annealing (KV2 = 28.1 J), ZEP1510 displays only a moderate improvement, with Charpy energy increasing from 3.2 J to 4.5 J. The Brinell hardness of ZEP1510 decreased slightly after annealing (from 127 to 112 HBW), but remained considerably lower than CuZn21Si3P, which decreased from 207 to 165 HBW after annealing.
Table 4.
Comparison of mechanical properties of ZEP1510 and CUZN21SI3P in the as-received and annealed conditions.
The observed mechanical behavior underlines a key challenge in the substitution process. Despite the slight improvement in impact resistance of ZEP1510 after soft annealing, the material’s toughness remains significantly lower than that of CuZn21Si3P. This indicates that further optimization of heat treatment parameters is necessary to narrow the performance gap, particularly in applications in which energy absorption and ductile fracture behavior are critical. The fracture surfaces of both ZEP1510 samples (as-received and annealed) showed similar brittle fracture morphologies under visual inspection and digital microscopy, with no significant change in fracture appearance observed. This suggests that annealing at 150 °C for 4 h is not sufficient to induce major microstructural transformations in ZEP1510 (see Table 5).
Table 5.
Material comparison from the initial state to the soft-annealed state.
3.1.1. Effect of Annealing Temperature and Air Cooling
A series of annealing experiments was conducted at different temperatures to determine the onset of measurable improvements in the mechanical properties of ZEP1510. For all tests, the holding time was kept constant at 1 h, and samples were air-cooled after heat treatment. The maximum annealing temperature applied was 340 °C, as defined in the methodology. The results (Table 6) indicate that impact toughness increased progressively with annealing temperature, particularly above 200 °C. The Brinell hardness decreased from the as-received value of 127 HBW to a minimum of 113–117 HBW in the temperature range of 150–180 °C. Above 220 °C, hardness began to rise again, reaching 146 HBW at 340 °C. The most pronounced toughness increase for the 1 h condition was observed at 250 °C, where the Charpy energy reached 11.1 J, accompanied by a transition in fracture appearance from predominantly brittle to mixed.
Table 6.
Mechanical properties of ZEP1510 after annealing for 1 h and air cooling.
Extending the holding time to 2 h (Table 7) yielded a further increase in impact toughness at 250 °C and above, with the maximum measured value of 13.1 J recorded at 340 °C. Hardness values in this condition were slightly lower than in the 1 h series, suggesting partial softening due to prolonged exposure.
Table 7.
Mechanical properties of ZEP1510 after annealing for 2 h and air cooling.
For a 3 h holding time (Table 8), the toughness remained high for temperatures ≥ 250 °C, but the hardness showed no further increase compared to shorter durations, remaining close to the as-received value of ~130 HBW. This plateau in hardness, combined with microstructural evidence, suggests that extended holding leads to grain coarsening, which counteracts potential strengthening effects.
Table 8.
Mechanical properties of ZEP1510 after annealing for 3 h and air cooling.
Figure 5 shows the measured Brinell hardness and impact energy values of ZEP1510 as a function of annealing temperature for different holding times. The symbols represent individual experimental results, and the connecting lines are only intended to guide the eye. It can be observed that the hardness tends to increase up to intermediate annealing temperatures before slightly decreasing at higher temperatures, while the impact energy follows a comparable trend.
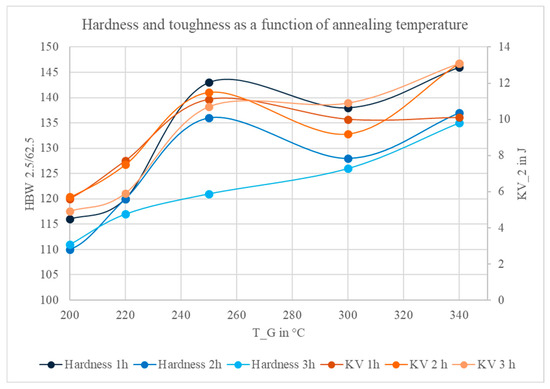
Figure 5.
Hardness and impact toughness of ZEP1510 as a function of annealing temperature for different holding times.
The fracture surface analysis (Figure 6) confirmed that samples annealed at ≥250 °C exhibited finer fracture morphologies compared to the as-received and lower-temperature conditions. However, prolonged holding at 250 °C for 3 h resulted in a coarser fracture texture, indicative of grain growth. Microstructural observations (Figure 7, Figure 8 and Figure 9) showed a more homogeneous elemental distribution and slightly refined grains with increasing annealing temperature. These microstructural trends are consistent with the observed changes in mechanical properties.
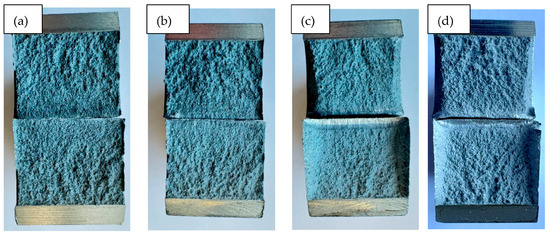
Figure 6.
Fracture surface images: (a) initial state. (b) WB 180 °C (1 h). (c) WB 250 °C (1 h). (d) WB 250 °C (3 h).
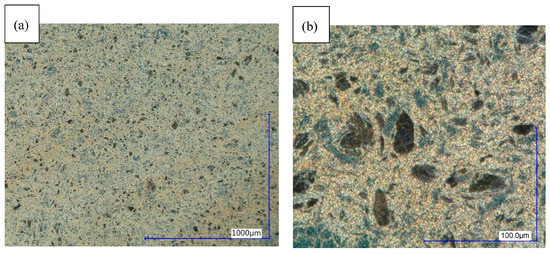
Figure 7.
Structure in initial state (sample 1), digital microscope DF. (a) Magnified 100 times. (b) Magnified 1000 times.
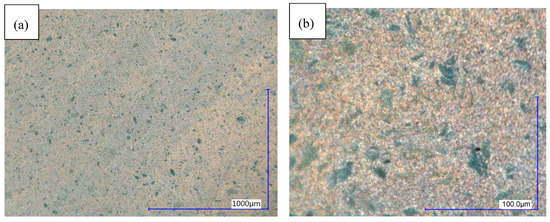
Figure 8.
Microstructure of sample 7 (WB 180 °C; 2 h), digital microscope DF. (a) 100× magnification; (b) 1000× magnification.
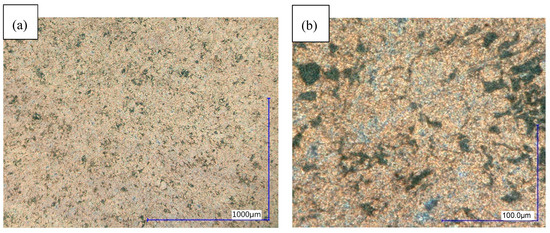
Figure 9.
Microstructure of sample 16 (WB 250 °C; 2 h), digital microscope DF. (a) 100× magnification; (b) 900× magnification.
3.1.2. Effect of Annealing Temperature and Water Cooling
In the previous experiments, samples were air-cooled after annealing. To investigate the effect of rapid cooling on the mechanical behavior of ZEP1510, additional tests were performed in which samples were quenched in water at 20 °C immediately after heat treatment. Based on earlier results, only the temperature range ≥ 250 °C was considered. As lower temperatures produced negligible changes in mechanical properties compared to the as-received state, the holding time for all tests was set to 1 h. The results (Table 9) show that water quenching after annealing at 300 °C and above leads to a pronounced increase in impact toughness, reaching approximately 40 J. However, this improvement in ductility is accompanied by a significant decrease in hardness, which drops to around 100 HBW. The Charpy energy values obtained after quenching at 300 °C and 340 °C even exceed those of CuZn21Si3P in the soft-annealed condition.
Table 9.
Results for samples quenched in water.
While hardness decreases markedly under water quenching, toughness shows a sharp increase, particularly between 250 °C and 300 °C. Fractography (Figure 10 and Figure 11) revealed a significant enlargement of the deformation zones in the water-quenched samples compared to the air-cooled ones, with fracture surfaces transitioning from mixed to predominantly ductile morphologies.
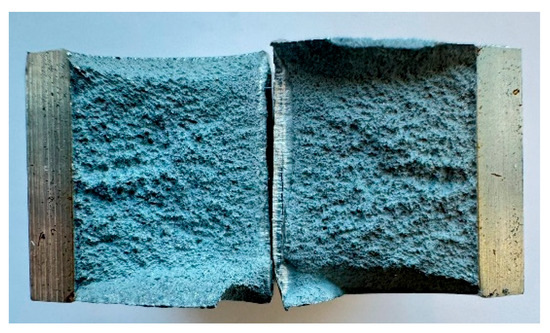
Figure 10.
Fracture surface, WB 250 °C (1 h), water-quenched.
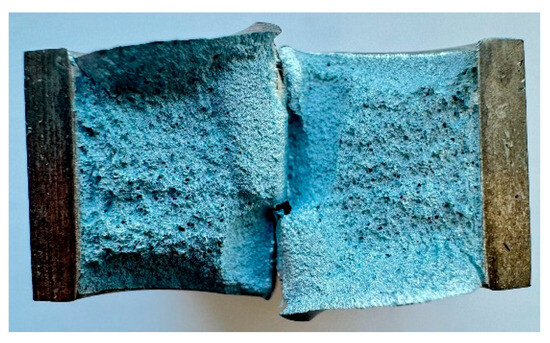
Figure 11.
Fracture surface, WB 340 °C (1 h), water-quenched.
To further assess the influence of water quenching on strength-related properties, tensile tests were performed on samples annealed at 300 °C and 340 °C, followed by water quenching (Table 10). To exclude deviations, at least three samples per temperature were used. The results were compared to the as-received condition (see Figure 12).
Table 10.
Strength and deformation properties of ZEP-1510 in the as-cast condition and after heat treatment at 300 °C/340 °C (water-quenched).
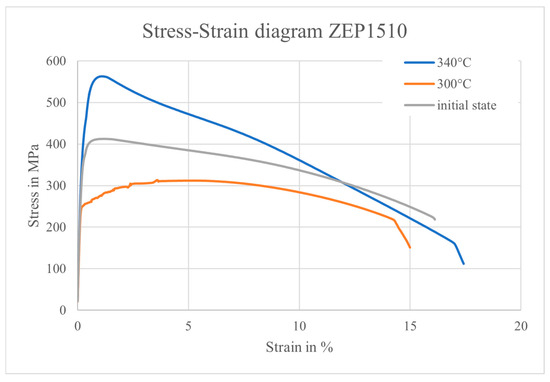
Figure 12.
Comparison of stress–strain curves of ZEP1510 in the untreated condition and after heat treatment at 300 °C/340 °C (water-quenched).
The elongation at fracture remained approximately constant across all conditions, suggesting that overall ductility was unaffected by water quenching. However, the tensile strength exhibited an opposing trend. A reduction was observed at 300 °C, whereas a substantial increase occurred at 340 °C compared to the as-received state (cf. Figure 12). This unexpected difference in strength cannot be fully explained by the relatively small differences in hardness and toughness observed between these two conditions.
3.2. Precipitation Hardening
A possible explanation for the observed differences in mechanical properties after heat treatment is the timing of the sample testing. The tensile samples treated at 300 °C were heat-treated 1 h before testing, while the samples treated at 340 °C had undergone heat treatment one week prior to the test. During this one-week storage period at room temperature (RT), unintended natural aging could have occurred, potentially affecting the tensile test results. To verify this hypothesis, additional Charpy V-notch samples were heat-treated at 340 °C for 1 h, quenched in water, and subsequently aged for one week at RT. Table 11 compares the mechanical properties immediately after heat treatment with those after a 7-day aging period.
Table 11.
Comparison of mechanical properties of ZEP1510 after heat treatment at 340 °C (1 h) and water quenching, measured immediately and after 7 days of aging at RT.
The results indicate that the material is metastable. A non-equilibrium state was achieved immediately after quenching. After one week of aging at RT, phase transformations appear to have occurred, as evidenced by a doubling of the hardness from 98 HBW to 203 HBW and a dramatic reduction in Charpy impact energy from 43.2 J to 1.5 J—below the value of the as-received condition (3.2 J). This increase in hardness correlates with the high tensile strength values of the 340 treated specimens from the tensile tests. The combination of increased hardness and strength with significantly reduced toughness is characteristic of precipitation hardening phenomena, similar to those observed in aluminum alloys. A review of the binary Zn–Al phase diagram (Figure 13) reveals that heating above approximately 275 °C induces phase transformations. The η-phase can dissolve more aluminum and copper at elevated temperatures than at RT and the solubility of zinc and copper in the β-phase is also reduced at RT. Furthermore, the eutectoid decomposition of the β-phase at ~275 °C is suppressed during quenching. Based on the results and the metallographic background, it is concluded that aluminum and copper precipitations likely formed from the unstable β-phase and the η-matrix during natural aging.
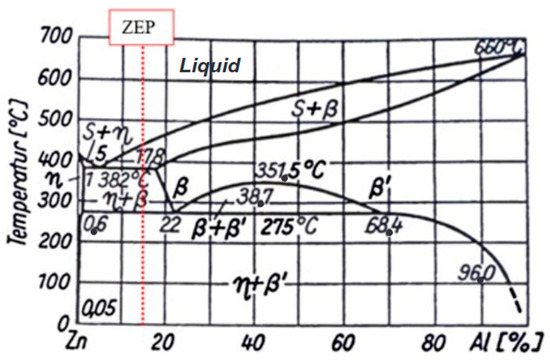
Figure 13.
Binary phase diagram of zinc–aluminum [18].
A direct comparison of the microstructures confirms these changes. The bright-field image of the as-received condition (Figure 14a) shows distinct coarse η-matrix grains (marked as position 1) with clearly distinguishable phases at 200× magnification. In the aged sample (Figure 14b), such coarse grains are less pronounced. The eutectoid phase appears finer and its volume fraction is increased.
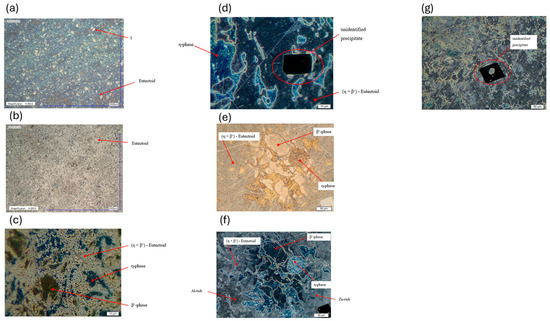
Figure 14.
Microstructure of ZEP1510 samples in initial condition and after heat treatment (digital and light microscopy, various magnifications). Labels (a–g) indicate different states and methods. (a) Microstructure of sample 1 (initial condition), digital microscope HF; 200× magnification. (b) Microstructure of sample 35 (340 °C; 1 h; water quenched), digital microscope HF; 200× magnification; hardened by natural aging. (c) Microstructure of sample 1 (initial condition), light microscope DF; 1000× magnification. (d) Microstructure of sample 35 (340 °C; 1 h; water-quenched), light microscope DF; 1000× magnification; hardened by natural aging. (e) Microstructure of sample 35 (340 °C; 1 h; water-quenched), light microscope BF; 500× magnification; hardened by natural aging. (f) Microstructure of sample 35 (340 °C; 1 h; water-quenched), light microscope DF; 500× magnification; hardened by natural aging. (g) Microstructure of sample 35 (340 °C; 1 h; water quenched), light microscope DF; 500× magnification; hardened by natural aging.
At 1000× magnification, the differences become more evident (see Figure 14c,d). In the aged sample, precipitates of aluminum and copper can be observed at the grain boundaries of the η-matrix. The bright spots within the η-matrix include ε-phase precipitates, as well as magnesium precipitates, located both in the matrix and at the grain boundaries.
In bright-field and dark-field microscopy at 500× magnification (Figure 14e,f), the eutectoid region (η + β′) appears in gray tones. In DF (Figure 14f), the contrast is more noticeable. The darker areas are richer in aluminum than the lighter ones. Cube-shaped precipitates, absent in the previous microstructures, are visible in the aged condition (Figure 14d,g), indicating their formation either during quenching or during subsequent aging.
To determine the chemical composition of these precipitates, an Energy Dispersive X-ray Spectroscopy (EDS) analysis was performed. In Figure 15, the SEM micrograph shows a cubic precipitate with the corresponding elemental map for aluminum. The orange coloration over the precipitate confirms a high aluminum concentration. The lighter microstructural regions correspond to the zinc-rich η-phase, while the eutectoid (η + β′) areas exhibit a more homogeneous aluminum distribution, but at lower concentrations than in the precipitates.
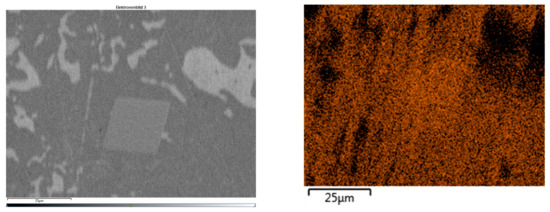
Figure 15.
(Left) Electron image of cubic precipitation in sample 35; (Right) element distribution of aluminum (orange).
A second EDS measurement (Figure 16) confirmed that the η-matrix exhibits a very low solubility for aluminum, consistent with the metallographic findings.
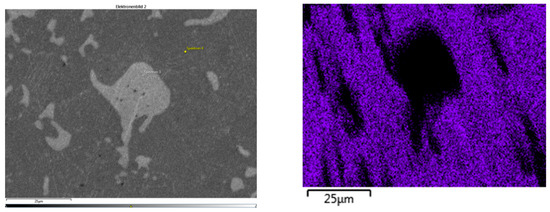
Figure 16.
(Left) Electron image of sample 35; (Right) element distribution of aluminum (blue).
3.3. Warm Aging of Precipitation-Hardened Samples
Aging at room temperature as previously discussed, is referred to as natural aging. In this section, artificial aging at elevated temperatures is applied to investigate whether hardness and toughness can be adjusted after quenching into the metastable state. Following warm aging, all samples were cooled in air. Artificial aging at 150 °C resulted in a moderate hardness level (167 HBW 2.5/62.5), while the toughness remained very low (1.8 J). In contrast, aging at 250 °C led to a significant increase in toughness to approximately 10 J, accompanied by a hardness reduction to 131 HBW 2.5/62.5 (see Table 12).
Table 12.
Comparison of the results of heat treatment at 340 °C (1 h) quenched in water at different ageing times and ageing temperatures.
Follow-up measurements after an additional week of natural aging at room temperature confirmed that the artificially aged condition remained stable, with no notable changes in hardness or impact energy. Figure 17a–c show the microstructures of the samples aged at different temperatures. With increasing aging temperature, the η-matrix phase became more uniformly distributed throughout the microstructure. The observed increase in toughness at 250 °C can be attributed to this more homogeneous and finer-grained microstructure. The zinc-rich η-phase, due to its hexagonal crystal structure, exhibits limited dislocation mobility and is therefore less ductile than the face-centered cubic β′-phase. During artificial aging. both η- and β′-matrix phases formed from the eutectoid (η + β′) phase.
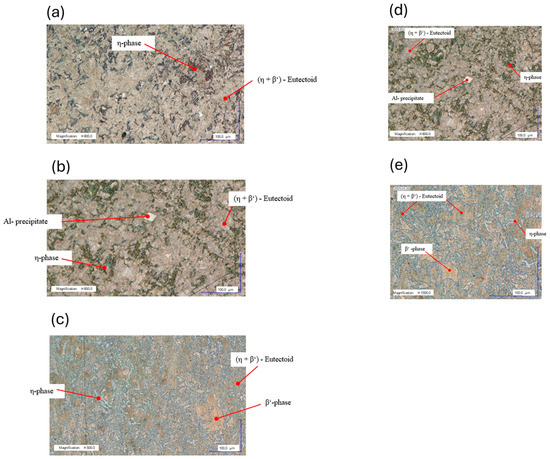
Figure 17.
Microstructures of ZEP1510 after heat treatment at 340 °C for 1 h, water quenching, and subsequent aging (natural or artificial) observed by light and digital microscopy (a–e). (a) Microstructure of Sample 35 (340 °C; 1 h; water-quenched). Light microscopy BF; 600× magnification; precipitation-hardened by natural aging at RT. (b) Microstructure of Sample 37 (340 °C; 1 h; water-quenched). Light microscopy BF; 600× magnification; precipitation-hardened by artificial aging at 150 °C. (c) Microstructure of Sample 40 (340 °C; 1 h; water-quenched). Digital microscopy BF; 500× magnification; precipitation-hardened by artificial aging at 250 °C. (d) Microstructure of Sample 37 (340 °C; 1 h; water-quenched). Digital microscopy BF; 600× magnification; precipitation-hardened by artificial aging at 150 °C. (e) Microstructure of Sample 40 (340 °C; 1 h; water-quenched). Light microscopy BF; 1000× magnification; precipitation-hardened by artificial aging at 250 °C.
The direct comparison in Figure 17d,e highlights the differences between the two artificial aging conditions. At 250 °C, diffusion conditions for aluminum are significantly improved, enabling the formation of β′-matrix crystals from the eutectoid phase of the metastable state. As a result, aluminum is more evenly distributed. In the eutectoid region at 150 °C, only bright aluminum-rich accumulations are visible, with no β′-matrix crystals present.
3.4. High-Temperature Strength of Precipitation-Hardened Samples
The precipitation-hardened condition after natural aging was tested to evaluate its mechanical performance at elevated temperatures. This state was selected because it exhibited the highest strength values among all the investigated conditions. High-temperature tensile tests were also available for the as-received state, enabling direct comparison.
The results show that, at 150 °C, both the untreated and precipitation-hardened conditions exhibit a pronounced loss of strength, indicating that applications at temperatures above 100 °C are not technically feasible. In the precipitation-hardened condition, the tensile strength decreases from 560 MPa at room temperature to 215 MPa at 150 °C, while the modulus drops from 70 GPa to 30 GPa. Nevertheless, the precipitation-hardened samples display a noticeably higher elongation at fracture compared to the as-received material across all test temperatures. Figure 18 illustrates the stress–strain curves for the heat-treated (WB) and as-received (U) conditions at different test temperatures. With increasing temperature, the tensile strength decreases sharply in both states, accompanied by a clear reduction in stiffness. The improved ductility in the precipitation-hardened condition is particularly evident at elevated temperatures.
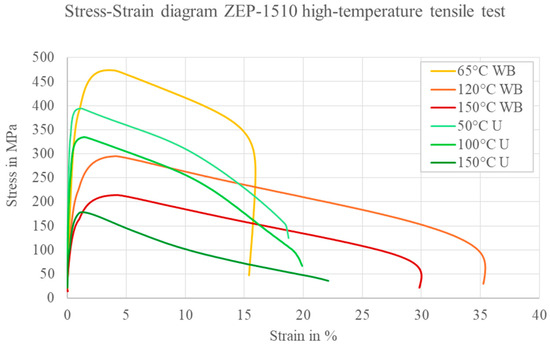
Figure 18.
Comparison of the stress–strain curves of ZEP1510. Hot tensile tests at different temperatures (WB = sample heat-treated at 340 °C; U = sample untreated, initial state).
4. Discussion and Conclusions
The objective of this study was to explore potential approaches for improving the mechanical properties of the zinc wrought alloy ZEP1510—specifically hardness, strength, and toughness—so that they could approach those of the brass alloy CuZn21Si3P. Increasing both toughness and hardness was intended to enhance the durability of potential replacement components made from ZEP1510. Such mechanical resistance is particularly critical for safety-relevant applications, such as respiratory protection valves.
The optimization strategy focused on heat treatment. Controlled thermal processes—including annealing, air cooling, water quenching, and artificial aging—were used to modify and improve the alloy’s hardness and toughness. These treatments not only produced property changes but also suggested notable microstructural phenomena.
At high annealing temperatures, close to the transformation reaction at 275 °C, air cooling led to a simultaneous increase in toughness and hardness. The toughness improvement is attributed to a homogeneous and visually refined microstructure (qualitative assessment), which could be beneficial for relieving work hardening after forming operations. Whether this represents true recrystallization annealing requires further investigation. Above the transformation temperature, solution annealing occurred due to phase transformations, and slow air cooling yielded a uniform atomic distribution in the crystal lattice. After solution annealing, ZEP1510 exhibited increased toughness with stable strength; however, a significant improvement in toughness at high strength—which would have been necessary to match CuZn21Si3P—was not achieved.
Water quenching from the transformation range produced a metastable condition with high toughness but low hardness. Subsequent unintentional natural aging caused significant increases in strength but a considerable loss of toughness. Artificial aging of the metastable condition provided initial indications of improved properties in the hardened state. While the present study provided initial indications of precipitation hardening through artificial aging, the parameters were not systematically optimized. A more comprehensive exploration of aging conditions—such as varying temperatures, durations, and stepwise aging sequences—will be necessary to fully assess the alloy’s potential. The results demonstrate that ZEP1510 undergoes precipitation hardening similar to aluminum alloys. While precipitation phenomena were analyzed using optical and SEM techniques in this study, further investigations using TEM or XRD would allow a more precise identification and characterization of the precipitates. Figure 19 shows the results for hardness and toughness across all of the tests.
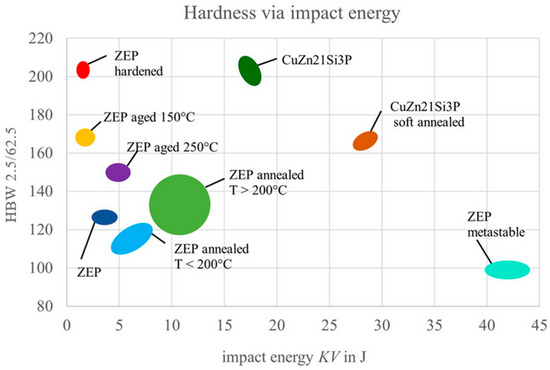
Figure 19.
Diagram showing the results from the heat treatment tests; states with corresponding value spectra are marked in color and labeled.
In summary, heat treatment showed potential to improve individual properties of ZEP1510, but the desired simultaneous optimization of toughness and strength was not fully achieved. Specific conditions—such as air cooling near the transformation temperature and controlled artificial aging—warrant further exploration in subsequent studies. Moreover, long-term properties such as creep, fatigue, and stress relaxation, which are critical for safety-relevant applications, were not evaluated in this preliminary study and should be systematically investigated in future work.
5. Outlook
Future investigations should build upon the present preliminary results, with a particular focus on precipitation hardening behavior and microstructural refinement. One key area is the analysis of artificial aging parameters. In aluminum alloys, prolonged aging for several hours can yield substantial toughness gains without compromising strength. Since ZEP1510 already exhibits good strength for mechanical processing, further enhancement of toughness is of primary interest. A potential approach, known from aging studies on light alloys, is to interrupt natural aging by low-temperature storage after quenching (freezing), followed by artificial aging at a later stage. The application of such combined aging strategies to ZEP1510 could be tested to determine whether natural aging can be suppressed and toughness improved.
Additional variables to be explored include the following:
- -
- Low-temperature storage prior to artificial aging;
- -
- Artificial aging with extended holding times;
- -
- Multiple artificial aging steps at varying temperatures;
- -
- Alternative quenching media. such as oil or water at different temperatures.
The metallographic results showed that a visually refined microstructure (qualitative assessment) enhances toughness. Mechanisms to further refine the grain size should be considered, such as increasing the extrusion ratio in wrought products. Alloying modifications could also be employed to improve toughness or promote grain refinement. Increasing the aluminum content beyond 25% can enhance both strength and ductility, while minor additions of Mn, Si, Li, Ti or Ni may improve hardness, tensile strength or impact resistance.
If these measures produce improved property combinations, long-term stability should be evaluated through creep and stress–relaxation testing to ensure suitability for service applications.
Author Contributions
Conceptualization M.M., M.F. and A.K.; methodology. M.Z., M.F. and A.K.; validation. M.Z., formal analysis. M.Z.; investigation. M.Z.; writing—original draft preparation. M.Z. and A.K.; writing—review and editing. M.M. and M.F.; visualization. M.Z.; project administration. M.M. and A.K.; All authors have read and agreed to the published version of the manuscript.
Funding
This research received no external funding.
Data Availability Statement
The original contributions presented in this study are included in the article. Further inquiries can be directed to the corresponding author.
Acknowledgments
The authors would like to thank the Zinc Metals GmbH for providing the raw material.
Conflicts of Interest
The authors declare no conflicts of interest.
References
- International Energy Agency. Global Critical Minerals Outlook 2025. Paris, France, 2025. Available online: https://iea.blob.core.windows.net/assets/ef5e9b70-3374-4caa-ba9d-19c72253bfc4/GlobalCriticalMineralsOutlook2025.pdf (accessed on 14 August 2025).
- DIN EN 144-1; Atemschutzgeräte—Gasflaschen—Teil 1: Anforderungen, Prüfung, Kennzeichnung. Beuth Verlag GmbH: Berlin, Germany, 2018.
- Schultheiss, F.; Johansson, D.; Linde, M.; Tam, P.L.; Bushlya, V.; Zhou, J.; Nyborg, L.; Ståhl, J.E. Machinability of CuZn21Si3P brass. Mater. Sci. Technol. 2016, 32, 1744–1750. [Google Scholar] [CrossRef]
- Karaman, A.; Marré, M. Forging of Zinc Alloys—A Feasibility Study. Eng. Proc. 2022, 26, 2. [Google Scholar] [CrossRef]
- European Commission. RoHS Directive—Restriction of Hazardous Substances in Electrical and Electronic Equipment. Available online: https://environment.ec.europa.eu/topics/waste-and-recycling/rohs-directive_en (accessed on 1 April 2025).
- London Metal Exchange. Market Data and Reference Prices. London, UK. Available online: https://www.lme.com/en/market-data/lme-reference-prices (accessed on 12 August 2025).
- Karaman, A.; Marré, M. Energieeinsparung Durch Die Anwendung von Zink-Knetlegierungen: Untersuchungen zur Massivumformung und Entwicklung Eines Technologischen Leitfadens zur Verarbeitung Dieser Werkstoffe. Abschlussbericht. Gefördert Durch Die Deutsche Bundesstiftung Umwelt (AZ 35420/01); Fachhochschule Südwestfalen: Iserlohn, Germany, 2022. [Google Scholar]
- Bergs, T.; Klocke, F.; Baier, S. Analyse der Zerspanbarkeit von Stranggepressten Zinkknetlegierungen und Entwicklung Angepasster Werkzeuge und Bearbeitungsstrategien für das Drehen und Bohren. Abschlussbericht zum IGF-Vorhaben 18190 N; Werkzeugmaschinenlabor WZL der RWTH Aachen University: Aachen, Germany, 2018. [Google Scholar]
- Hochschulnetzwerk NRW. Schadstoffarme Bauteile aus Zinklegierung. Available online: https://www.hn-nrw.de/schadstoffarme-bauteile-aus-zinklegierung/ (accessed on 1 April 2025).
- Rollez, D.; Pola, A.; Montesano, L.; Brisotto, M.; De Felicis, D.; Gelfi, M. Effect of aging on microstructure and mechanical properties of ZnAl15Cu1 alloy for wrought applications. Int. J. Mater. Res. 2017, 108, 447–454. [Google Scholar] [CrossRef]
- Montesano, L.; Pola, A.; La Vecchia, G.M. Cavitation-Erosion Resistance of Three Zinc-Aluminum Alloy for Bearing Application. Metall. Ital 2016, 108, 25–30. [Google Scholar]
- Karaman, A.; Kremer, A.; Marré, M. Corrosion Behavior of Zinc Wrought Alloy ZnAl15Cu1Mg (ZEP1510) as a Potential Substitute for Brass and Galvanized Steel. Alloys 2025, 4, 9. [Google Scholar] [CrossRef]
- DIN EN ISO 9227; Korrosionsprüfungen in künstlichen Atmosphären—Salzsprühprüfungen (ISO 9227:2022). Deutsche und Englische Fassung EN ISO 9227:2023; Beuth Verlag GmbH: Berlin, Germany, 2024.
- DIN EN ISO 6270-2; Beschichtungsstoffe—Bestimmung der Beständigkeit Gegen Feuchtigkeit—Teil 2: Kondensation (Beanspruchung in Einer Klimakammer mit Geheiztem Wasserbehälter) (ISO 6270-2:2017); Deutsche und Englische Fassung EN ISO 6270-2:2018. Beuth Verlag GmbH: Berlin, Germany, 2018.
- Bargel, H.-J. Werkstoffkunde: Strukturen, Grundlegende Eigenschaften, 13th ed.; Springer Vieweg: Berlin, Germany, 2022. [Google Scholar]
- Strzępek, P.; Osuch, P.; Walkowicz, M.; Zasadzińska, M.; Mamala, A.; Knych, T.; Napióra, T. Impact of the Heat Treatment Parameters on Ultimate Tensile Strength, Microstructure and Wire Drawing Process of Zn-Al15. Metallurgija 2020, 59, 489–492. [Google Scholar]
- Jin, W.; Sharma, P.; Singh, P.; Kundu, A.; Balasubramanian, G.; Chan, H.M. Solid State Reduction Driven Synthesis of Mn Containing Multi-principal Component Alloys. Metall. Mater. Trans. A 2024, 55, 3799–3808. [Google Scholar] [CrossRef]
- Xu, M.; Zheng, Z.; Han, D.; Ma, R.; Du, A.; Fan, Y.; Zhao, X.; Cao, X. Improvement of cracking resistance of hot-dip Zn-Al-Mg coatings by heat treatment. Mater. Today Commun. 2023, 36, 106521. Available online: https://ssrn.com/abstract=4356005 (accessed on 26 September 2025). [CrossRef]
- Grillo-Werke, A.G. Technical data sheet ZEP®1510. Duisburg, Germany. 2025. Formerly available online, currently not accessible.
- Zinkberatung Ingenieurdienste. Zink-Taschenbuch, 1st ed.; Metall-Verlag GmbH: Berlin, Germany, 1981. [Google Scholar]
- Benkißer, G.; Bernthaler, T.; Cyrener, K. Metallografie. Mit Einer Einführung in Die Keramografie, 15th ed.; Oettel, H., Schumann, H., Eds.; Wiley-VCH Verlag GmbH & Co. KGaA: Weinheim, Germany, 2016. [Google Scholar]


Disclaimer/Publisher’s Note: The statements, opinions and data contained in all publications are solely those of the individual author(s) and contributor(s) and not of MDPI and/or the editor(s). MDPI and/or the editor(s) disclaim responsibility for any injury to people or property resulting from any ideas, methods, instructions or products referred to in the content. |
© 2025 by the authors. Licensee MDPI, Basel, Switzerland. This article is an open access article distributed under the terms and conditions of the Creative Commons Attribution (CC BY) license (https://creativecommons.org/licenses/by/4.0/).