Article

Hydrocracking of Algae Oil and Model Alkane into Jet Fuel Using a Catalyst Containing Pt and Solid Acid

Research Institute of Energy Process, National Institute of Advanced Industrial Science and Technology (AIST), AIST Tsukuba West, 16-1 Onogawa, Tsukuba 305-8569, Ibaraki, Japan
Processes 2025, 13(10), 3129; https://doi.org/10.3390/pr13103129
Submission received: 28 July 2025 / Revised: 15 August 2025 / Accepted: 17 September 2025 / Published: 29 September 2025
(This article belongs to the Special Issue Biomass to Renewable Energy Processes, 2nd Edition)

Abstract

Aluminum polyoxocations were introduced into a lamellar zirconium phosphate (α-ZrP) via ion exchange. The Al polyoxocation pillars transformed into Al2O3 particles within the interlayer zone after calcination at 673 K. The resulting Al2O3-α-ZrP exhibited a large BET surface area and medium-strength acidity. Pt-supported Al2O3-α-ZrP was used as a catalyst for hydrocracking squalene and Botryococcus braunii oil in an autoclave batch system. In a one-step squalene hydrocracking process, the yield of jet-fuel-range hydrocarbons was 52.8% on 1 wt.% Pt/Al2O3-α-ZrP under 2 MPa H2 at 623 K for 3 h. A two-step process was designed with the first step at 523 K for 1 h and the second at 623 K for 3 h. During the first step, the squalene was hydrogenated to squalane without cracking, and in the second step, the squalane was hydrocracked. This two-step catalytic process increased the yield of jet-fuel-range hydrocarbons to 65% in squalene hydrocracking. For algae oil hydrocracking, the jet-fuel-range hydrocarbons occupied 66% of the total products in the two-step reaction. Impurities in algae oil, mainly fatty acids, did not affect the yield of jet-fuel-range hydrocarbons because they were deoxygenated into hydrocarbons during the reaction. The activity of Pt/Al2O3-α-ZrP remained unchanged after four reuses through simple filtration.

1. Introduction

Jet fuel is also known as aviation fuel or aviation kerosene. Some types of jet fuel are commonly used, with Jet A-1 being the most popular. Jet A-1 has a maximum freezing point of 226 K, and its average C/H ratio is C12H23 [1]. Since its main component is a kerosene distillate derived from petroleum, jet fuel is a blend of saturated hydrocarbons with carbon chains ranging from 8 to 16 atoms and some aromatic compounds [2]. The use of jet fuel has recently increased, and demand is expected to continue rising because electric motors cannot match the high energy density of jet engines. Because current jet fuel is derived from petroleum, its use contributes to increased CO2 emissions worldwide [3]. Various efforts have been made to reduce emissions and achieve carbon neutrality [4]. Replacing petroleum-derived jet fuel with alternatives from sustainable energy sources can help lower CO2 emissions from aircraft [5]. Biomass is a sustainable energy source because it grows using the absorbed CO2 to carry out photosynthesis in sunlight. Based on a life cycle assessment, biomass-derived jet fuel (bio-jet fuel) offers lower CO2 emissions than petroleum-derived fuel by considering the CO2 reduction during biomass growth [6].
Although fatty acid methyl ester (FAME) was used as the first-generation bio-jet fuel, the fuel, composed of hydrocarbons, is preferred for jet engines for flight safety reasons [7]. Several chemical methods have been employed to convert various types of biomass into hydrocarbon jet fuel [8]. Woody biomass can be transformed into hydrocarbon fuels through a biomass-to-liquid (BTL) process using syngas as a platform [9]; vegetable oils can be converted into hydrocarbon fuels via hydrotreatment technology [10]; bioethanol can be turned into hydrocarbon fuels through dehydration and oligomerization [11]; and waste plastics can be converted into hydrocarbon fuels by hydrocracking [12]. Since the limited availability of harvested crops restricts the commercial scale of bio-jet fuel production, it is important to explore high-yield biomass sources. Algae oils are a promising biomass feedstock because their oil yields significantly surpass those of other crops [13,14,15]. Different types of algae produce oils with distinct chemical compositions that can be transformed into biofuels through various chemical reactions [16].
Botryococcus braunii is a microalga known for its rapid growth and high oil production. The Botryococcus braunii oil (denoted as Bot-oil) is composed of hydrocarbons with carbon numbers ranging from 29 to 34 [17]. Table 1 summarizes the catalysts and reactors used for hydrocracking Bot-oil in the literature. Hillen et al. hydrocracked Bot-oil into gasoline-range hydrocarbons with a 67% yield at 673 K in a batch reactor as early as the 1980s [18]. Over the past decade, Tomishige’s group reported a 70% yield of gasoline-range hydrocarbons from Bot-oil hydrocracking using Ru-supported catalysts at 513 K in a batch reactor [19]; Watanabe’s group hydrocracked Bot-oil into diesel-range hydrocarbons at a relatively mild temperature of 533 K in a fixed-bed flow reactor [20]; Zhang’s group obtained a jet-fuel-range hydrocarbons yield of 41% from Bot-oil hydrocracking using a Ru/CeO2 catalyst at 513 K in a batch reactor [21]; and the author’s group hydrocracked Bot-oil into jet-fuel-range hydrocarbons with a yield exceeding 50% at 573 K in an autoclave batch reactor [22,23].
Bifunctional catalysts that contain metals and solid acids are effective for hydrocracking Bot-oil into jet-fuel-range hydrocarbons [21,22,23]. Developing highly active catalysts and designing suitable reaction processes are essential for achieving commercial biofuel production [24,25,26]. Zirconium phosphate has multiple structures, and α-type zirconium phosphate (denoted as α-ZrP) is a solid acid with a layered structure [27]. This study pillared large Al polyoxocations into the α-ZrP to increase the height of the interlayer zone. The catalyst containing Pt and Al2O3-pillared α-ZrP achieved a high yield of jet-fuel-range hydrocarbons in the hydrocracking of squalene or Bot-oil. Additionally, a two-step reaction process was designed to increase the yield of jet-fuel-range hydrocarbons. This study obtained a yield of jet-fuel-range hydrocarbons of 66.2%, which was higher than those reported in the literature (as shown in Table 1).

2. Materials and Methods

2.1. Reagents

Inorganic reagents used for catalyst synthesis were purchased from Wako Pure Chemical Industries Ltd. in Tokyo, Japan, with purities exceeding 99%. Organic reagents, such as squalene, were obtained from Tokyo Chemical Industry Co., Ltd., in Tokyo, Japan, with purities above 99%. Gas cylinders for the reaction and analysis were purchased from Sumitomo Seika Chemicals Co., Ltd. in Tokyo, Japan, with purities larger than 99.995%.
Prof. Makoto M. Watanabe from the University of Tsukuba (Tsukuba city, Ibaraki, Japan) provided the Bot-oil. The Botryococcus braunii cells were cultivated outdoors on a large scale in Tsukuba City. The oil was extracted from air-dried Botryococcus braunii cells using hexane. The crude oil, labeled as Bot-oil-C, was obtained after removing the hexane through evaporation. The pure oil, labeled as Bot-oil-P, was produced by purifying the crude oil through a silica gel column.
SiO2 support was obtained from Fuji Silysia Chemical Company in Tokyo, Japan. H-ZSM-5 zeolite (SiO2/Al2O3 = 23) was sourced from Tosoh Chemical Company in Tokyo, Japan.
Na-type montmorillonite (Kunipia G), a refined natural clay mineral, was provided by Kunimine Industrial Company in Tokyo, Japan.

2.2. Catalyst Syntheses

The sample of α-ZrP was prepared using a refluxing method as described in the literature [28]. A 10 g portion of ZrOCl2·8H2O was refluxed with 100 mL of 6 M H3PO4 in a glass flask at 373 K for 24 h. Afterward, the solid sample was separated by centrifugation and dried at 373 K for 10 h.
The solution of Al polyoxocation (Na7[AlO4Al12(OH)24(H2O)12]) was prepared by alkalizing an Al(NO3)3 solution with NaOH [29]. An aqueous solution of 0.2 M NaOH was added dropwise to a 0.5 M Al(NO3)3 solution at a rate of 0.015 mL/sec with vigorous stirring to achieve a desired OH/Al molar ratio of 2.4 [29]. The aluminum polyoxocation solution was stored at room temperature for 24 h before the pillaring process.
Al polyoxocation-pillared α-ZrP (denoted as Alpoly-α-ZrP) was prepared using an ion exchange method, as described in the literature [30,31]. A colloidal suspension containing 5 g of α-ZrP was added to 100 mL of Al polyoxocation solution and refluxed for 48 h. Afterward, the solid sample was separated by centrifugation and thoroughly washed with deionized water. The obtained Alpoly-α-ZrP sample was dried at 373 K for 10 h. Following calcination at 673 K for 3 h, the Al polyoxocations converted to Al2O3 particles through dehydration in the interlayer region, transforming the sample into Al2O3-α-ZrP.
Pt-supported catalysts (Pt/α-ZrP, Pt/Al2O3-α-ZrP, Pt/SiO2, and Pt/H-ZSM-5) were prepared by wet impregnation of the solid support (α-ZrP, Al2O3-α-ZrP, SiO2, or H-ZSM-5) using an aqueous solution of H2PtCl6. The solid samples were obtained after evaporating the water solvent at 368 K. The resulting samples were dried at 373 K for 10 h and then calcined in air at 673 K for 3 h. Each catalyst contained 1 wt.% of platinum.
Molded catalysts were prepared for the reaction using a clay binder. A Na-type montmorillonite served as the binder for the Pt-supported catalysts. A soil suspension was created by vigorously stirring montmorillonite in deionized water at room temperature. The ratio of montmorillonite to water was 1:4 by weight. Afterward, a powder of the Pt-supported catalyst was added to the suspension, maintaining a montmorillonite-to-catalyst ratio of 1:4. The water was evaporated at 368 K with vigorous stirring to form a mud. The mud was extruded from a syringe through a 1.2 mm outlet. The mud noodles were dried at 373 K for 10 h, then cut into columnar pellets measuring 1.2 to 1.5 mm in height. The pellet catalysts were calcined at 673 K for 3 h before use in the reaction.

2.3. Characterization Method

Powder X-ray diffraction (XRD) patterns were obtained using a MAC Science MXP-18 diffractometer (MAC Science MXP-18, MAC Science Co., Japan, Tokyo, Japan) with Cu Kα radiation. The operating voltage and current were 40 kV and 50 mA, respectively. The solid phase was identified by referencing the JICST database, Version 6th (Japan Information Center of Science and Technology, Crystallographic Society of Japan, Tokyo, Japan, 2012).
N2 adsorption measurements were performed in liquid N2 (at 77 K) using a Belsorp 28SA automatic adsorption instrument (MicrotracBEL Corp., Osaka, Japan). The surface areas of the samples were calculated using a Brunauer–Emmett–Teller (BET) plot, and the pore size distribution was determined using the Barrett–Joyner–Halenda (BJH) method.
Temperature-programmed desorption of ammonia (NH3-TPD) was conducted using a BELCAT-B automatic system equipped with a TCD and a Q-mass. A 0.05 g sample was pretreated at 673 K for 1 h in a helium flow of 60 mL/min. After cooling to 373 K, NH3 was introduced into the system and adsorbed onto the sample. The sample was then evacuated at 373 K for 1 h to remove weakly physically adsorbed ammonia. Finally, NH3-TPD was recorded by heating from 373 to 873 K at a rate of 8 K/min.
FT-IR spectra of chemisorbed pyridine on samples were obtained using a Shimadzu FTIR-8200PC spectrometer. Self-supporting wafers (about 10 mg/cm2; 13 mm in diameter) were prepared from the sample powders and heated directly in the IR cell. The wafers were calcined in vacuum (10−3 Torr, 1 Torr = 133.3 N/m2) at 673 K for 1 h before introducing pyridine. After pyridine was introduced at room temperature, the weakly adsorbed pyridine that had desorbed was evacuated at 423 K for 1 h. Then, the FT-IR spectra of the pyridine adsorbed on the samples were recorded at room temperature.

2.4. Reaction Procedure

Figure 1 shows the schematic diagram of the stirred autoclave reaction process used in this study. A 100 mL autoclave with a stirrer was used for the reaction. An iron filter with a 50 nm pore size was installed at the bottom of the reactor to support the solid catalyst, similar to the setup in a slurry bubble column reactor reported previously [32]. A pressure-reducing valve was placed before the autoclave inlet, and a back-pressure valve was located after the autoclave outlet. The inlet gas was directed into the autoclave through a tube at the bottom, while the outlet gas was vented through a tube on the top lid of the autoclave. A funnel was mounted on the top lid to introduce the liquid reactant into the autoclave. The liquid product was removed through the tube at the bottom of the autoclave.
Before the reaction, the molded solid catalyst was placed in the autoclave reactor. Then, a flow of H2 (60 mL/min) was introduced into the autoclave at 573 K for 1 h for reducing pretreatment at ambient pressure. After the autoclave cooled to room temperature, 20 g of liquid reaction reagent (squalene or Bot-oil) was added through the upper lid to form a slurry in the autoclave. Once 0.5 MPa of H2 was introduced at room temperature, the reactor was heated with an electric furnace while stirring at 300 rpm to reach the reaction temperature. When the temperature reached the reaction point, the pressure-reducing valve before the gas inlet was adjusted to 2 MPa for H2 input, and the back-pressure valve after the gas outlet was set to 2.5 MPa. This setup allowed H2 to be supplied from the cylinder to maintain a 2 MPa pressure in the autoclave as soon as H2 was consumed during the reaction.

2.5. Product Analysis

After the reaction, the autoclave reactor was cooled to room temperature.
The gas products were collected in a plastic bag, and the total gas volume was measured with a WS-1 integration flow meter (Shinagawa Corp., Tokyo, Japan). Inorganic gases were analyzed using a thermal conductivity detector (TCD) on a Shimadzu 2014 GC (Shimadzu Corp., Kyoto, Japan) equipped with a SHINCARBON packed column (Shiwa Kakou Corp., Kyoto, Japan). C1–C4 hydrocarbons were analyzed with a flame ionization detector (FID) on a Shimadzu 2010 GC equipped with an RT-QPLOT capillary column (Agilent Technologies Japan, Ltd., Tokyo, Japan). Factors for various gaseous compounds were obtained using a standard mixed gas from a cylinder with known concentrations of each component.
Liquid products were collected from the bottom of the autoclave tube, while the solid catalyst remained on the iron filter inside the autoclave. A specific amount of dichloromethane (CH2Cl2) was added to the autoclave to wash both the reactor and the used catalyst, then collected through the tube at the bottom of the autoclave.
The liquid products were analyzed using a Shimadzu GC-2014 with an FID detector and a UA-DX30 capillary column (Frontier Laboratories Ltd., Koriyama, Fukushima, Japan). The oven was maintained at 323 K for 5 min and then heated from 323 to 623 K at a rate of 10 K/min during the FID-GC analysis. GC–MS analysis was conducted using a Shimadzu GC-MS-QP-2010-Ultra with the same capillary column (UA-DX30) as in the FID-GC, following the same temperature program. Data from FID-GC analyses were used to determine product yields, and the GC–MS data helped confirm the components of the liquid products using the NIST-11 database.
The factors of squalene (C30H50), squalane (C30H62), and normal alkanes (n-alkanes) with carbon chains ranging from 5 to 29 were calculated using standard solutions with known concentrations in CH2Cl2 for each compound. In the FID-GC charts, all peaks between n-Cn−1H2n and n-CnH2n+2 were identified as Cn hydrocarbons, except n-Cn−1H2n. The factor for each Cn hydrocarbon was calculated using the factor of n-CnH2n+2 with the same carbon number.
The conversion was determined by comparing the reduction in squalene or Bot-oil to the initial fed amount. The yield of each carbon-based product was calculated as the ratio of each product’s amount to the initial squalene amount on a carbon basis.

3. Results and Discussion

3.1. Catalyst Synthesis and Characterization

The α-type zirconium phosphate (α-ZrP) has a layered structure with the chemical formula Zr(HPO4)2·H2O [33]. The layer features a plane of zirconium atoms linked by HPO4 groups positioned above and below the main Zr atom plane [33]. The thickness of the host layer is 6.3 Å in α-ZrP [34]. The –OH group of the HPO4 units points into the space between layers and forms hydrogen bonds with water molecules in this interlayer region. Because no chemical bonds form between the layers and interlayer cations, large cations can be inserted into the interlayer space through ion exchange in α-ZrP materials [34]. Large metal polyoxocations can be exchanged within the layers of α-ZrP, resulting in a type of porous material after calcination [35].
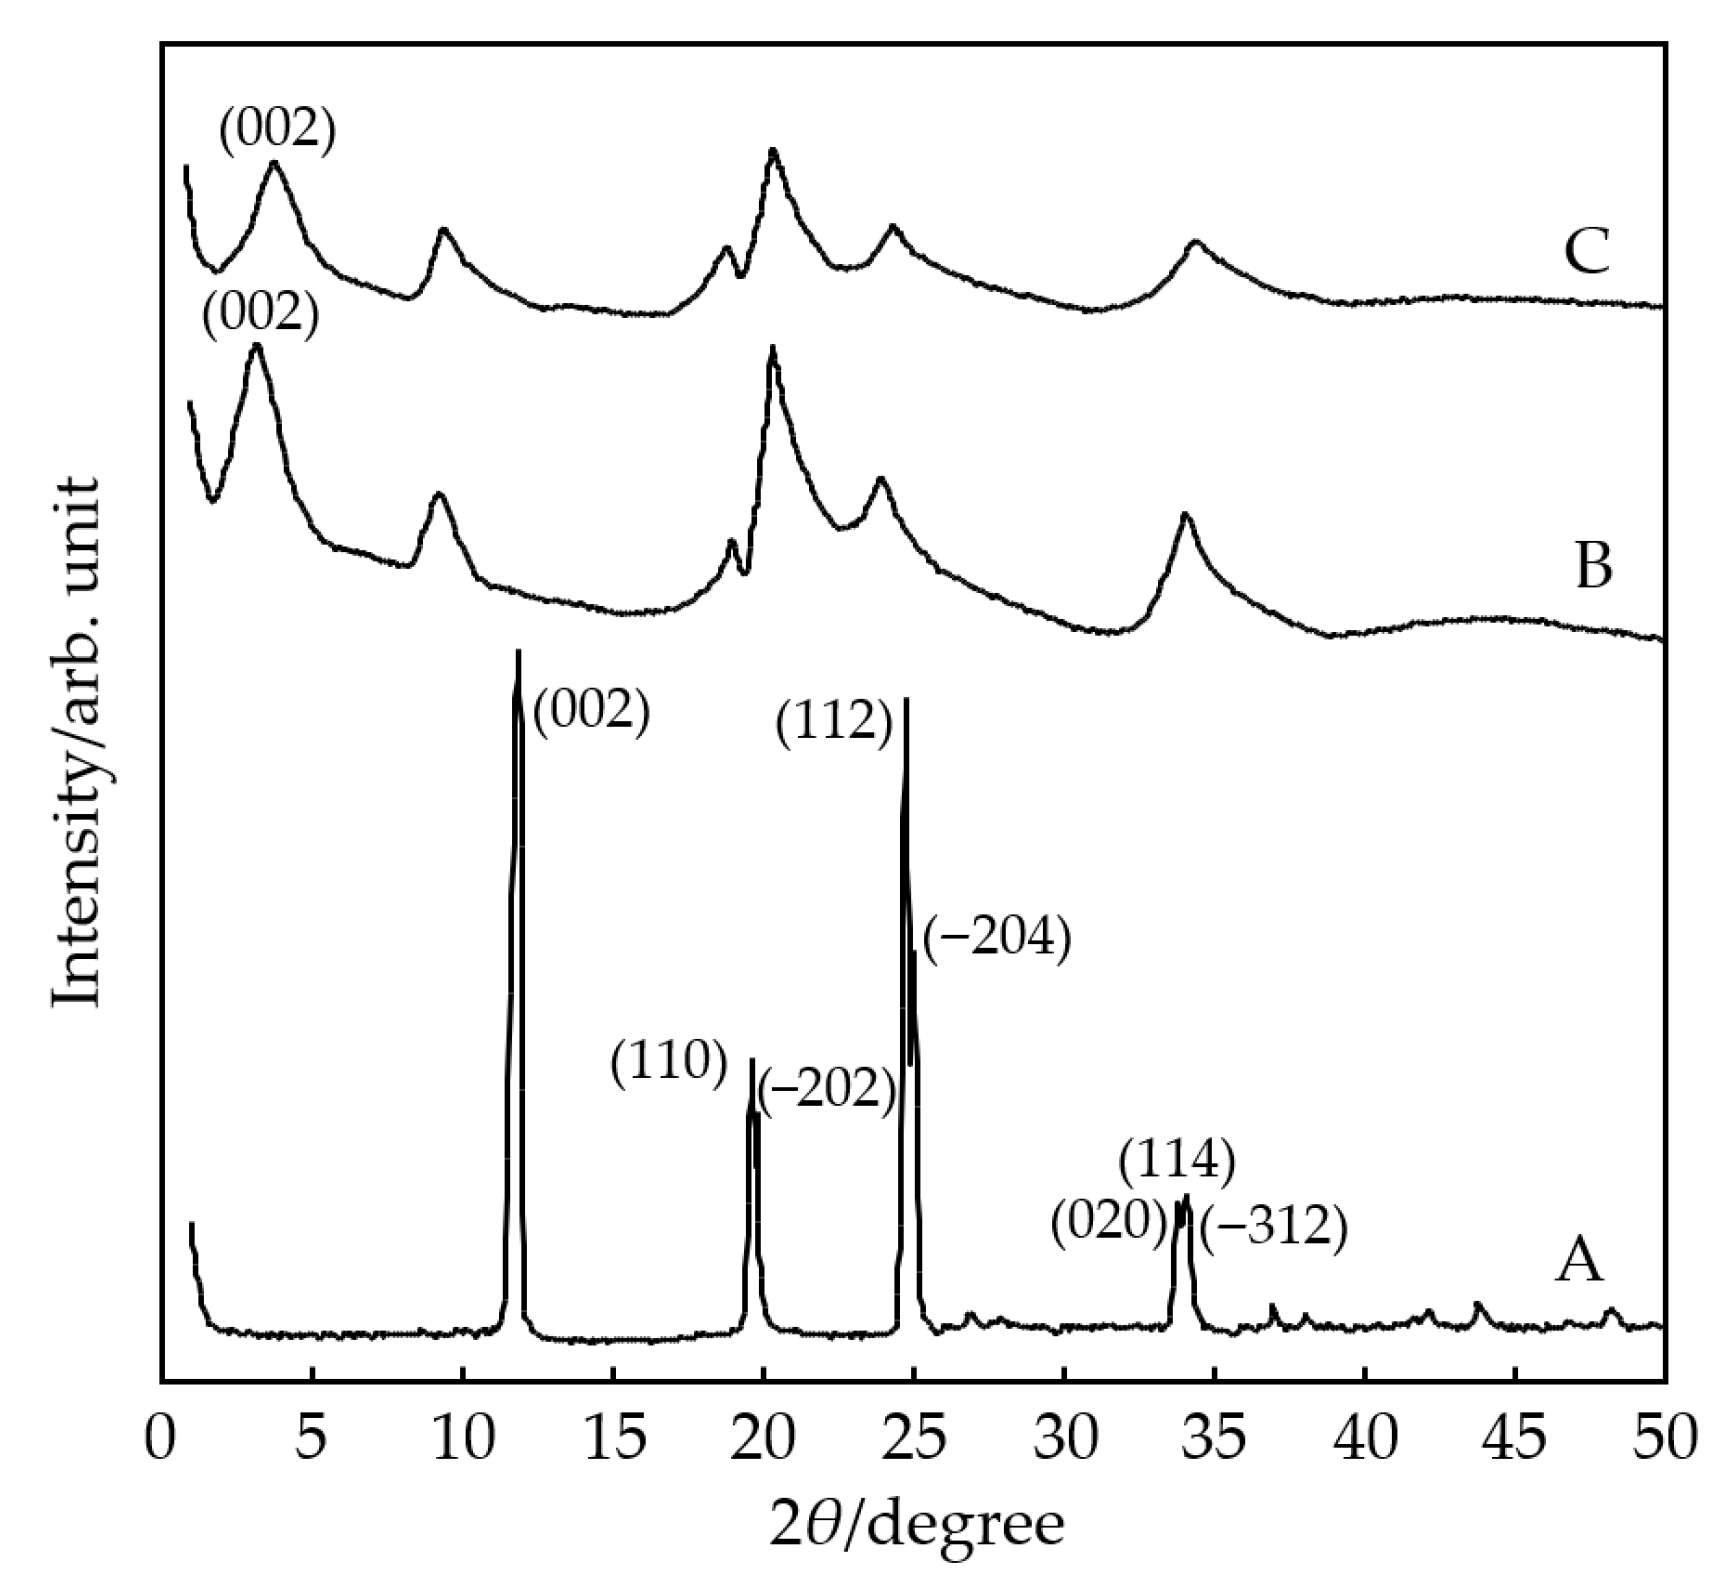
Figure 2 displays the XRD patterns of various α-ZrP materials. These patterns help determine the gallery heights in layered compounds. The basal plane reflection at the lowest angle is a sum of the thickness of the host layer and the height of the interlayer gallery [29]. The α-ZrP sample shows a typical layered structure in its XRD pattern, with a basal spacing of 7.6 Å calculated from the (002) diffraction at the lowest angle. The gallery height of α-ZrP is 1.3 Å, found by subtracting the layer thickness (6.3 Å) from the basal spacing (7.6 Å) [34]. In the XRD pattern of Alpoly-α-ZrP, the peak at 7.6 Å disappears, and a new (002) basal plane reflection appears at 25.8 Å. The gallery height of Alpoly-α-ZrP is 19.5 Å, determined by subtracting the 6.3 Å layer thickness from 25.8 Å. This suggests that the size of the Al-polyoxocations within the interlayer space of Alpoly-α-ZrP is 19.5 Å. After calcining Alpoly-α-ZrP at 673 K for 3 h, it transforms into Al2O3-α-ZrP as the Al polyoxocations convert into Al2O3 particles through dehydration. The (002) basal diffraction in the XRD pattern of Al2O3-α-ZrP indicates a spacing of 25.3 Å, corresponding to a gallery height of 19.0 Å. The Al2O3 particles serve as pillars in Al2O3-α-ZrP after calcination, and these newly formed Al2O3 pillars are slightly smaller than the original Al polyoxocations.
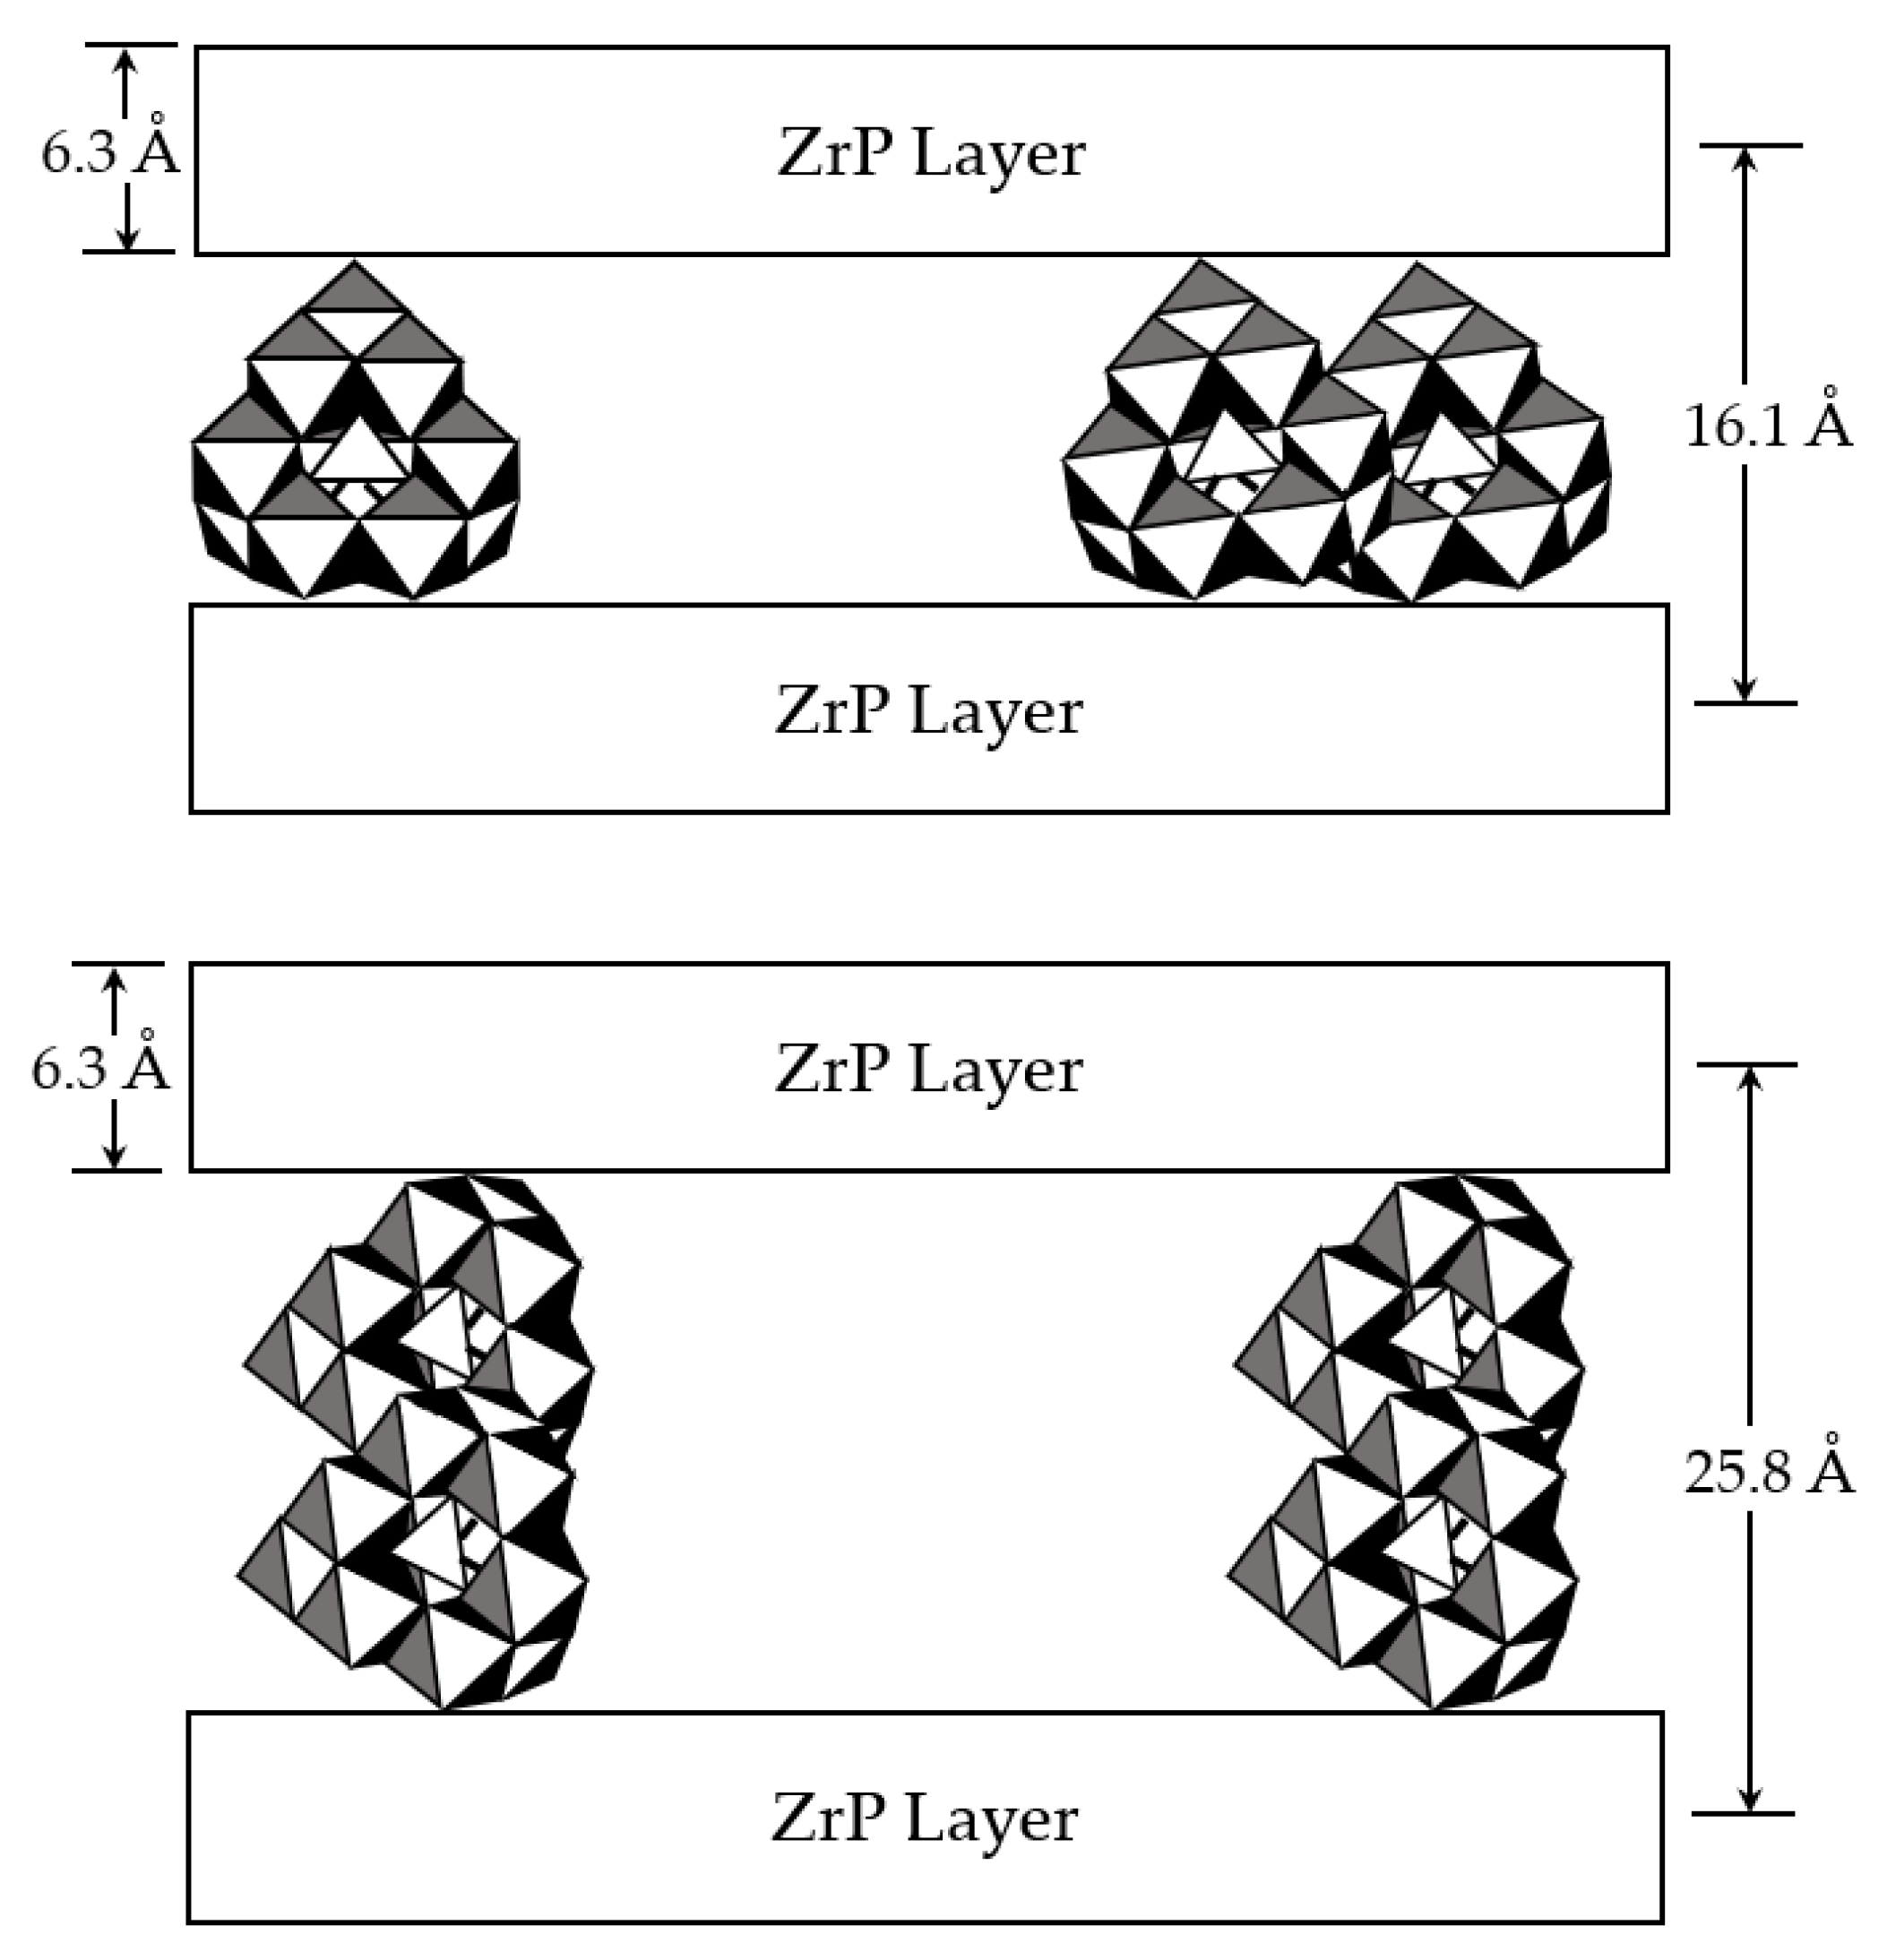
Figure 3 shows the structural model of the Al polyoxocation-pillared α-ZrP (Alpoly-α-ZrP). The Keggin structure [AlO4Al12(OH)24(H2O)12], labeled as Al13, is common among Al polyoxocations. Both the height and length of the Al13 polyoxocation are 9.8 Å due to its cage-like shape. In contrast, Al25 polyoxocations can be formed through the dimerization of Al13 in the reaction system [36]. Since the shape of the Al25 dimer is nearly a rectangular parallelepiped, it has a height of 9.8 Å and a length of 19.5 Å. XRD pattern results show an interlayer spacing of 19.5 Å in the Alpoly-α-ZrP sample, indicating that Al25 polyoxocations formed during the reaction and exchanged within the interlayer region of α-ZrP. Occasionally, oligomerization or decomposition of pillaring ions occurs during ion exchange due to acidity or oxidation of the suspension [37]. The dimerization of Al13 polyoxocation has been reported during the synthesis of Al polyoxocation-pillared α-ZrP materials, likely because of the solid acidity of α-ZrP [30,35]. Typically, interlayer ions are fixed in a specific orientation within the interlayer zone of layered compounds [38]. As shown in Figure 3, the basal diffraction for the basal spacing is 16.1 Å when Al25 lies in the interlayer zone, and 25.8 Å when Al25 stands in the interlayer zone. The XRD pattern of Alpoly-α-ZrP gives a basal spacing of 25.8 Å, indicating that Al25 polycations are fixed in a standing position within the interlayer region. Al2O3-α-ZrP is produced by calcining Alpoly-α-ZrP at 673 K. Since Al2O3-α-ZrP has a gallery height of 19.0 Å, it functions as an effective two-dimensional porous material with a pore size much larger than that of zeolites. The ZrP layer contains negative charges that are uniformly distributed on the surface [33,34]. The Al polyoxocations are exchanged to the interlayer zone to balance the negative charges of the ZrP layers. This determines the uniform distribution of Al polyoxocations in the Alpoly-α-ZrP. Upon calcination, one Al polyoxocation converts an Al2O3 particle by dehydration. The uniformly distributed hard Al2O3 particles strongly support the ZrP layers, which increases the pore size and thermal stability of Al2O3-α-ZrP. The results of the XRD patterns indicate that the layer structure remains unchanged during the process of Al polyoxocations dehydrating to Al2O3 particles by calcination at 673 K.
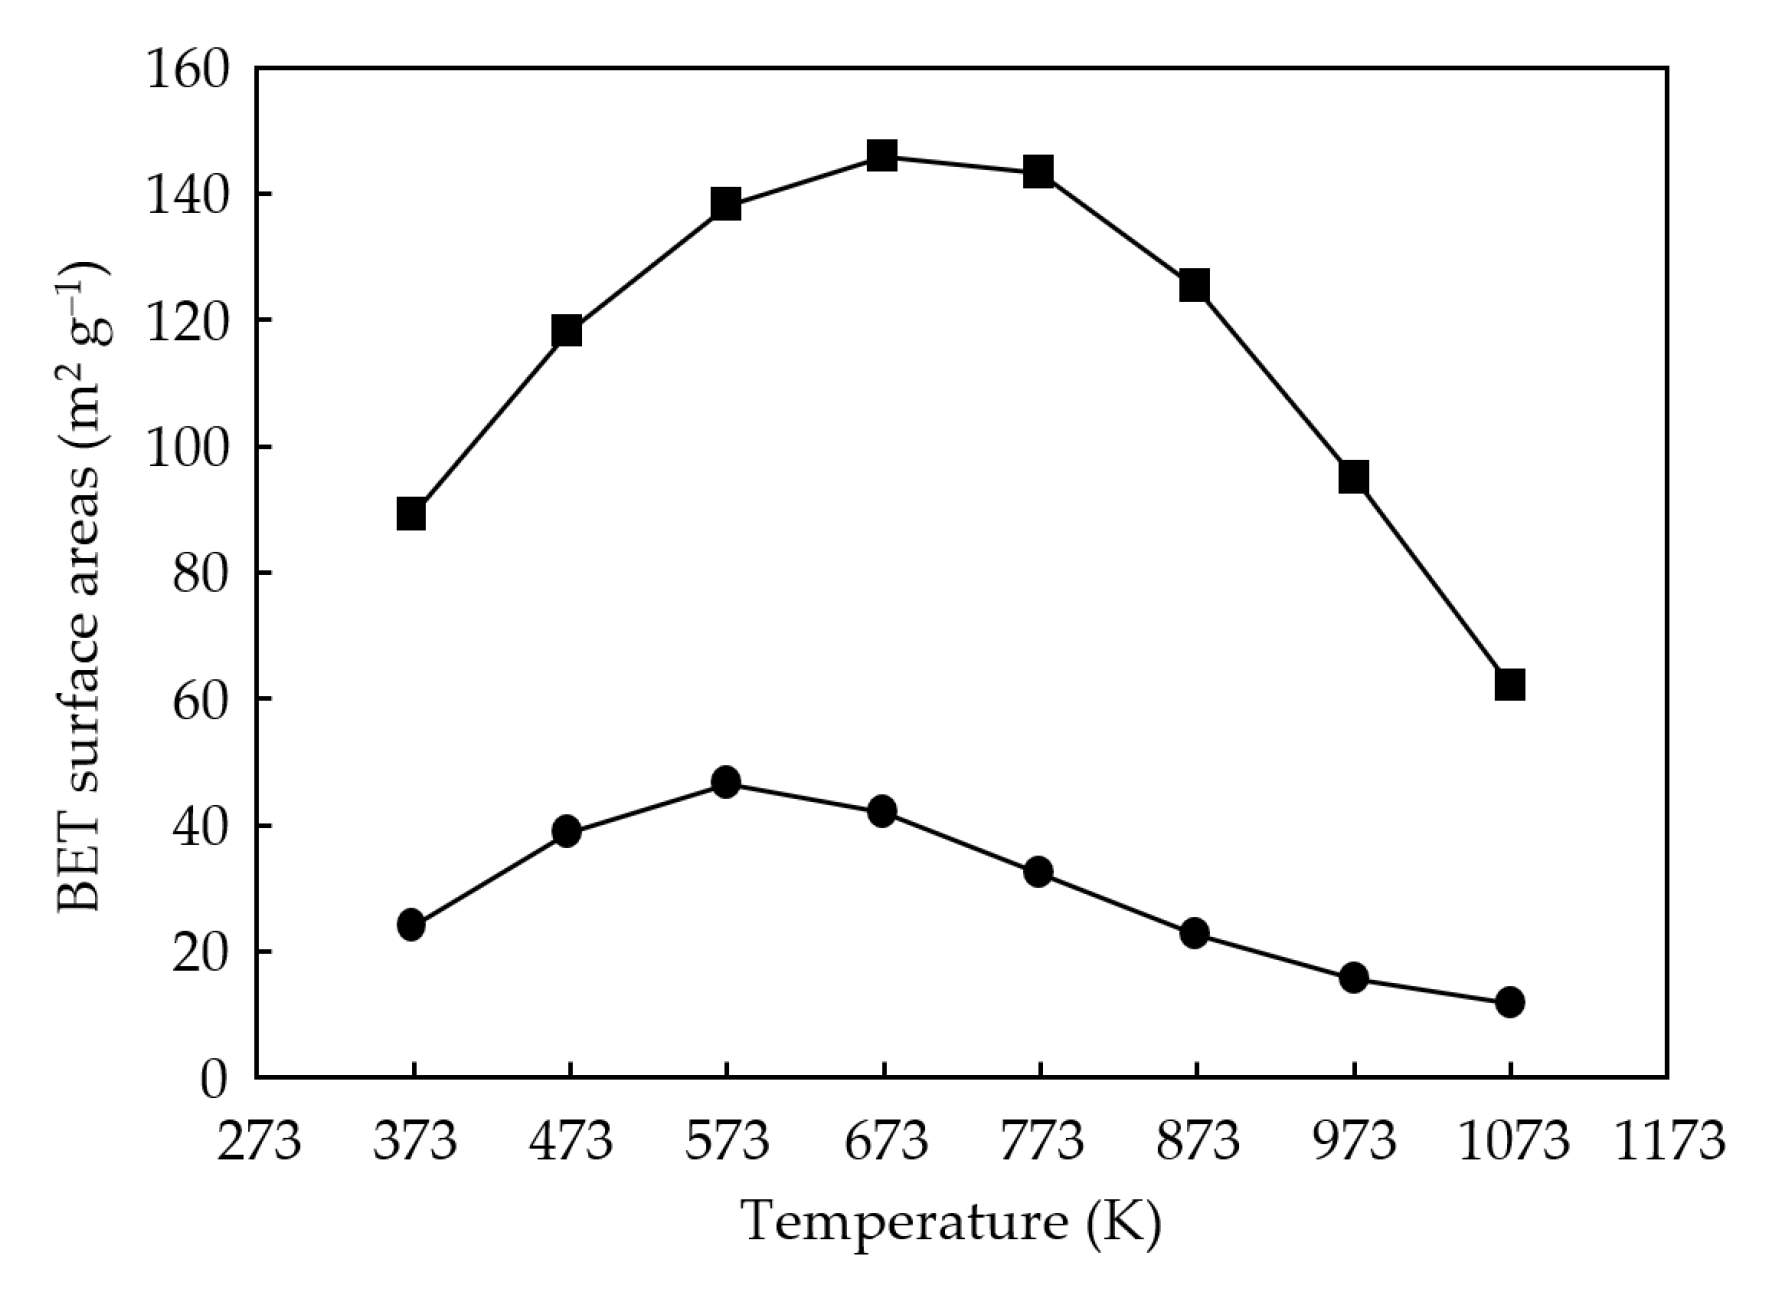
Figure 4 illustrates the BET surface areas of α-ZrP and Alpoly-α-ZrP after calcination for 3 h at different temperatures. The BET surface area of α-ZrP reached a maximum of 51 m2/g when calcined at 573 K and declined at higher temperatures. Alpoly-α-ZrP, dried at 373 K, showed a BET surface area of 87 m2/g due to expansion of the interlayer zone. The BET surface area increased notably after pillaring with Al polyoxocations in the α-ZrP material. Additionally, the BET surface area of Alpoly-α-ZrP grew with rising calcination temperature up to 673 K. At this temperature, Alpoly-α-ZrP converted to Al2O3-α-ZrP through dehydration of the Al polyoxocation. The Al2O3-α-ZrP maintained its layered structure after calcination at 673 K, thanks to the stable Al2O3 pillars. However, the BET surface area of Al2O3-α-ZrP decreased when calcined at 773 K or higher, indicating partial destruction of the layered structure above this temperature. Since Al2O3-α-ZrP achieved a maximum surface area of 143 m2/g after calcination at 673 K, this temperature was chosen for catalyst calcination in this study. Overall, pillaring with Al polyoxocations in the α-ZrP precursor significantly enhanced the BET surface area and thermal stability.
Table 2 summarizes the physical characteristics of α-ZrP and Alpoly-α-ZrP after calcination at various temperatures for 3 h. The value of d (002) at the lowest angle in the XRD pattern includes the thickness of a host layer and the gallery height of an interlayer region [34]. Since the interlayer cations support the layers, any changes in the interlayer cations will cause shifts in the d (002) basal plane in the XRD pattern. The d (002) spacing notably increased after pillaring large Al polyoxocations into the interlayer zone of α-ZrP. The d (002) value of α-ZrP decreased to 7.1 Å after calcination at 673 K and could not be observed after calcination at 773 K for 3 h. In the case of Alpoly-α-ZrP, the d (002) value remained at 25.1 Å after calcination at 773 K for 3 h. Regarding the pore size of the layered α-ZrP materials, it is determined not only by the interlayer distance (between two layers) but also by the lateral distance (between two pillars). The micropore (pore diameter less than 20 Å) volume of α-ZrP was low. As for Alpoly-α-Zr, both the total pore volume and the micropore volume increased with the rising calcination temperature up to 673 K and then decreased upon calcination at 773 K. The porous structure of α-ZrP was destroyed, but the porous structure of Alpoly-α-ZrP remained after calcination at 773 K.
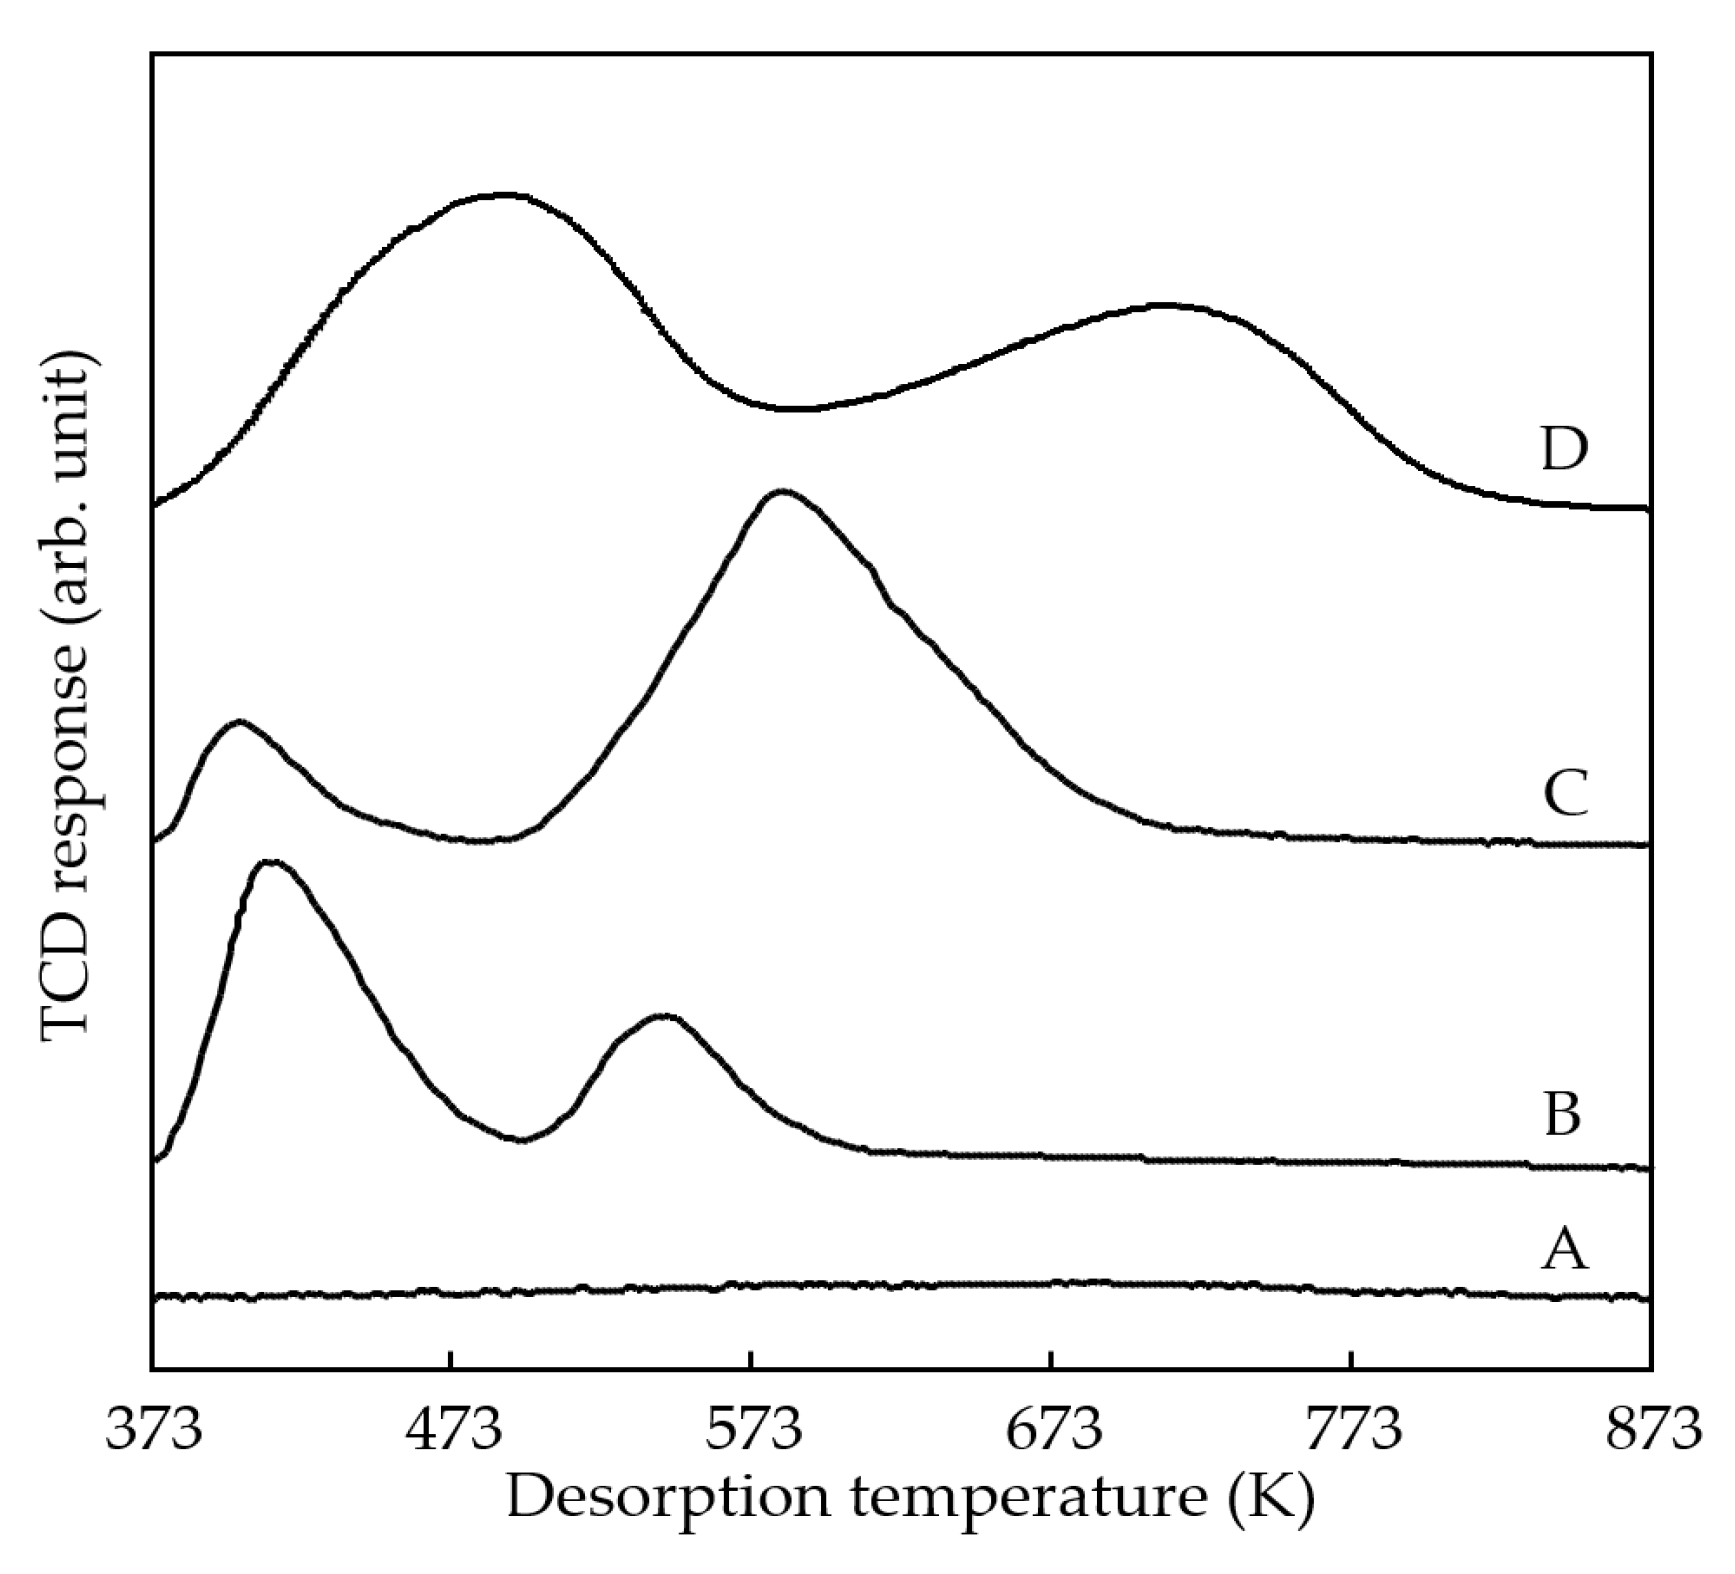
Figure 5 shows the NH3-TPD profiles of various catalyst supports used in this study. The analysis of NH3-TPD was employed to evaluate acid strength and the amount of acid on the catalyst supports. NH3 gas was adsorbed onto the solid surface after the sample was treated with vacuum evacuation. As the temperature increased, the NH3 molecules that adsorbed on weak solid acid sites desorbed at low temperatures, while those on strong solid acid sites desorbed at higher temperatures. In the NH3-TPD profile of a solid sample, acid strength corresponds to the NH3 desorption temperature, and the acid amount relates to the area of NH3 desorption. As shown in Figure 5, no peak was observed in the NH3-TPD profile of SiO2, indicating that SiO2 lacked solid acid sites on its surface. Conversely, α-ZrP showed two peaks with maximum values at 403 and 553 K, indicating the presence of two types of acid sites on the surface. The peak at 403 K is identified as weak acid sites, and the peak at 553 K as medium acid sites. In the NH3-TPD profile of Al2O3-α-ZrP, the high-temperature peak became more prominent and shifted to a higher temperature compared to that of α-ZrP. This suggests a significant increase in stronger solid sites after pillaring Al polyoxocations into the interlayer zone of α-ZrP. H-ZSM-5 zeolite exhibited two peaks at approximately 513 and 733 K in the NH3-TPD profile. Since the strength of a solid acid is mainly determined by the strongest acid sites on the solid surface, the acidity order of the catalyst support is H-ZSM-5 (strong solid acid) > Al2O3-α-ZrP (medium strong solid acid) > α-ZrP (weak solid acid) > SiO2 (no acidity). Therefore, Al2O3-α-ZrP is a material characterized by large pores and medium-strength solid acid sites.
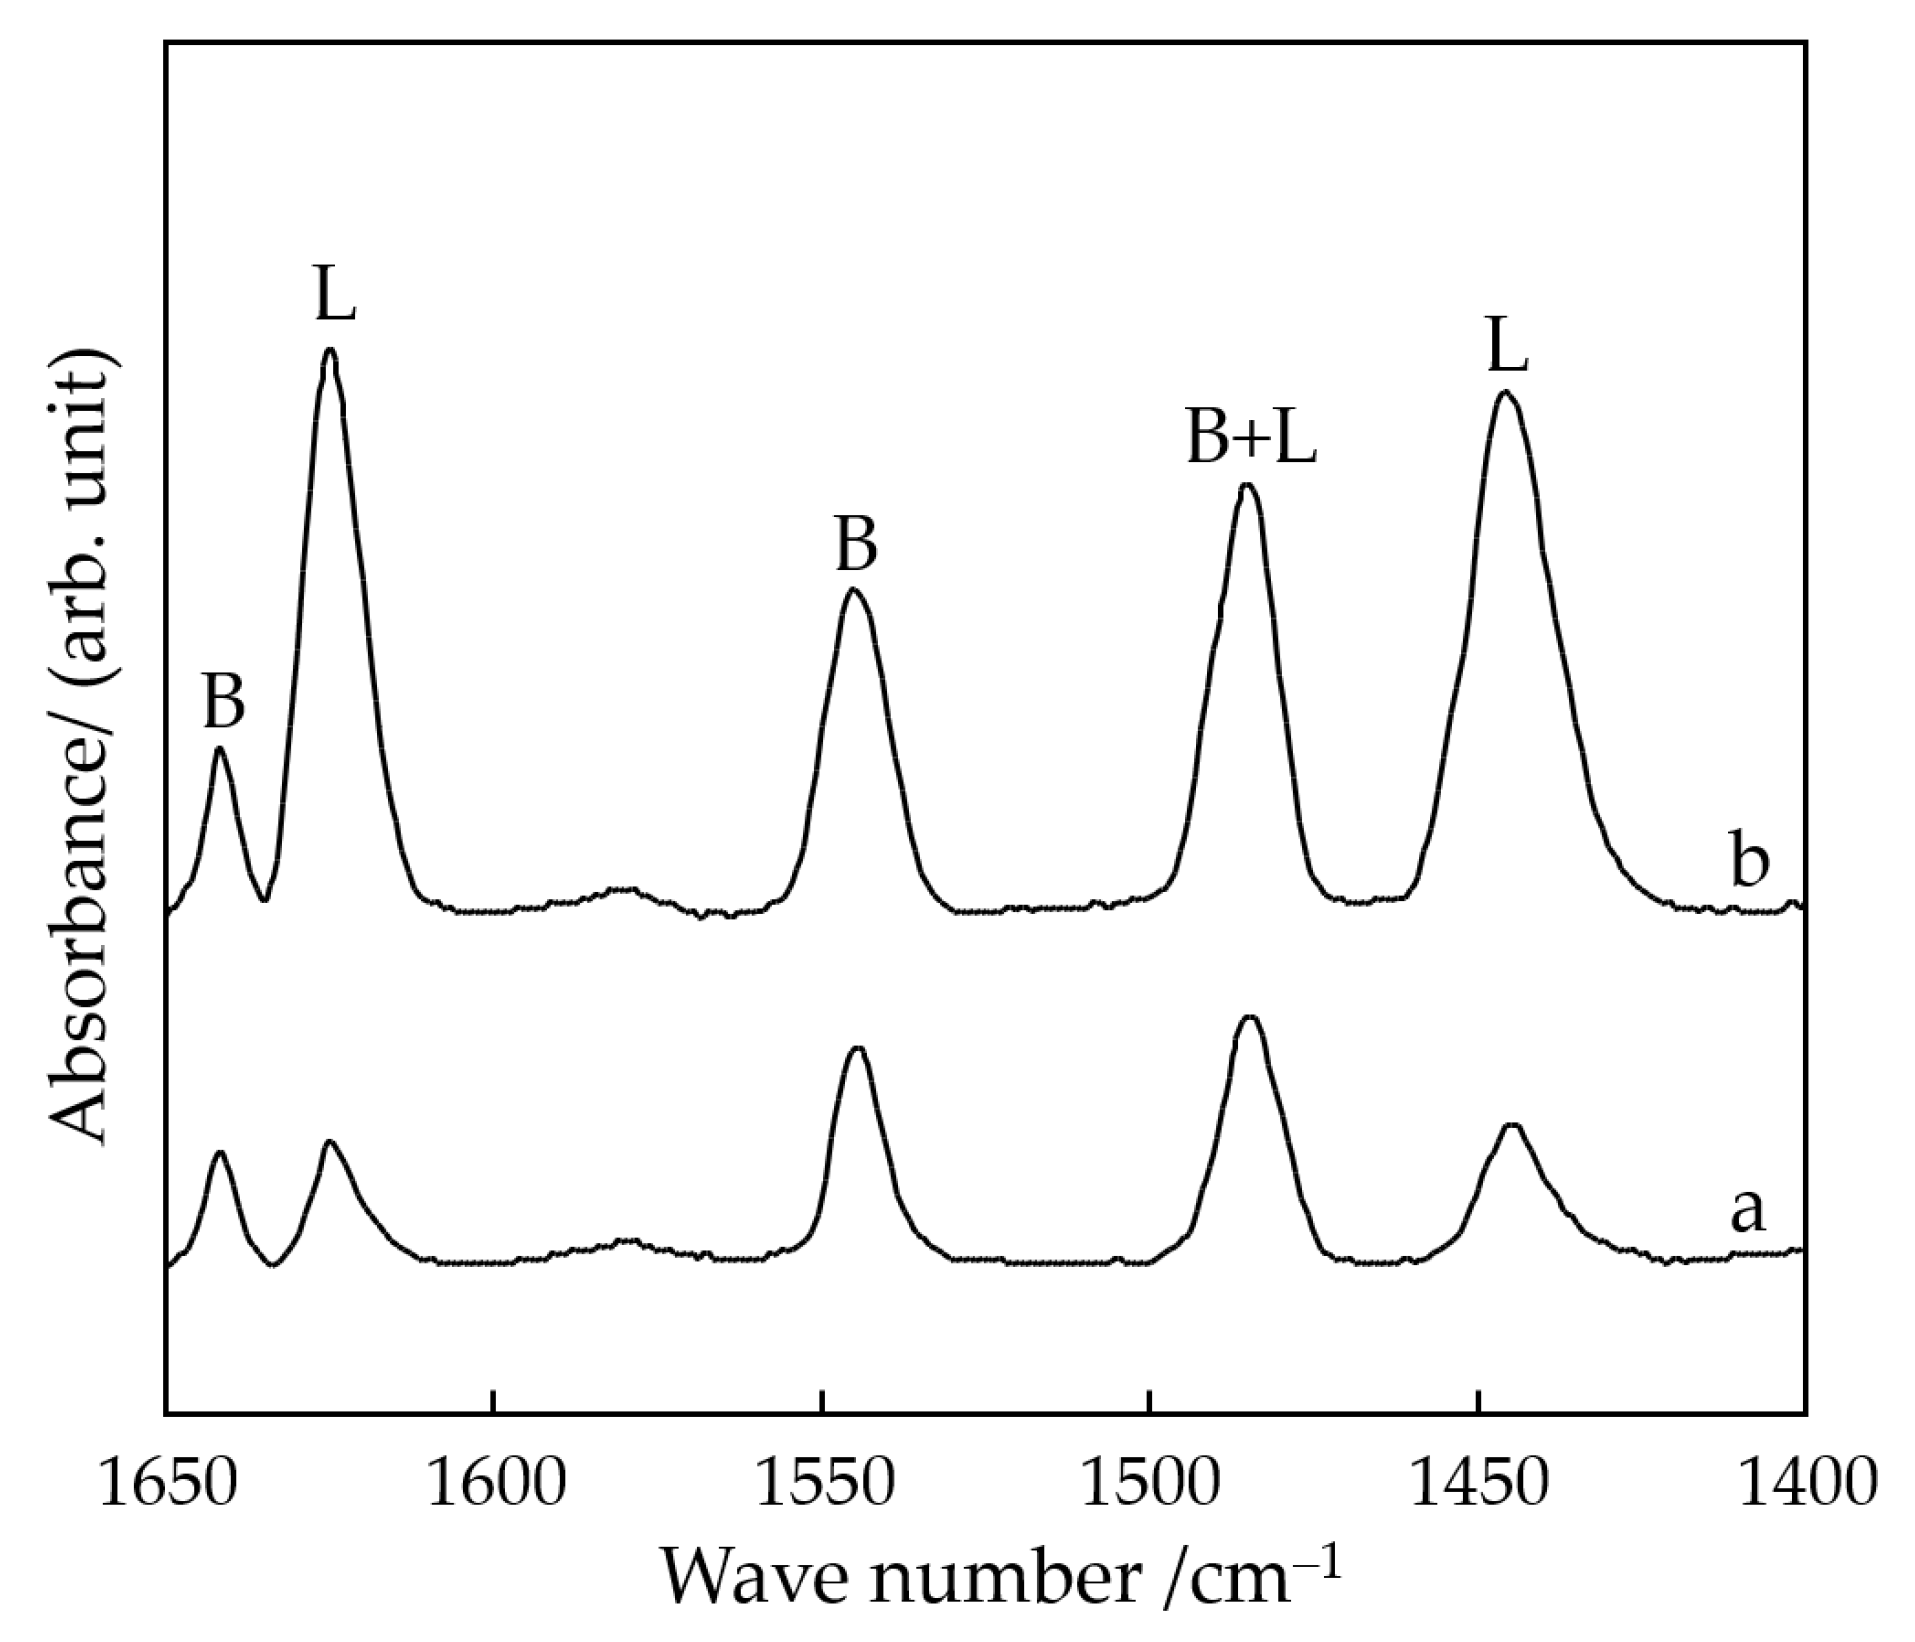
Figure 6 shows the FT-IR spectra of pyridine absorption on α-ZrP and Alpoly-α-ZrP after vacuum exhaust at 423 K for 1 h. The vibration bands in the 1400–1650 cm−1 region of the IR spectrum of chemisorbed pyridine can distinguish between Brønsted and Lewis acid sites [39]. Pyridine chemisorbed on Lewis sites exhibits two bands at 1445 and 1625 cm−1, caused by the combination of the C–C stretching frequency with the in-plane C–H bending frequency. Pyridine chemisorbed on Brønsted acid sites shows two bands at 1640 and 1545 cm−1, resulting from the combination of the C–C stretching frequency with the C–H and N–H in-plane bending frequencies. The band at 1485 cm−1 corresponds to the C–C bond stretching frequency of pyridine associated with both Lewis and Brønsted acid sites. As shown in Figure 6, bands related to pyridine bound to Lewis acid sites (1445 and 1625 cm−1) and Brønsted acid sites (1545 and 1640 cm−1) are observed on both samples. These findings demonstrate that both α-ZrP and Alpoly-α-ZrP possess two types of acid sites: Lewis and Brønsted. The intensities of bands for chemisorbed pyridine on the Lewis acid sites at 1445 and 1625 cm−1 increased with the addition of pillaring Al polyoxocations in the interlayer region of α-ZrP. Furthermore, the band at 1485 cm−1 over Alpoly-α-ZrP was more intense than that over α-ZrP, indicating that the acidity of Alpoly-α-ZrP is higher than that of α-ZrP, consistent with the results from the NH3-TPD.

3.2. Hydrocracking of Squalene over Various Catalysts

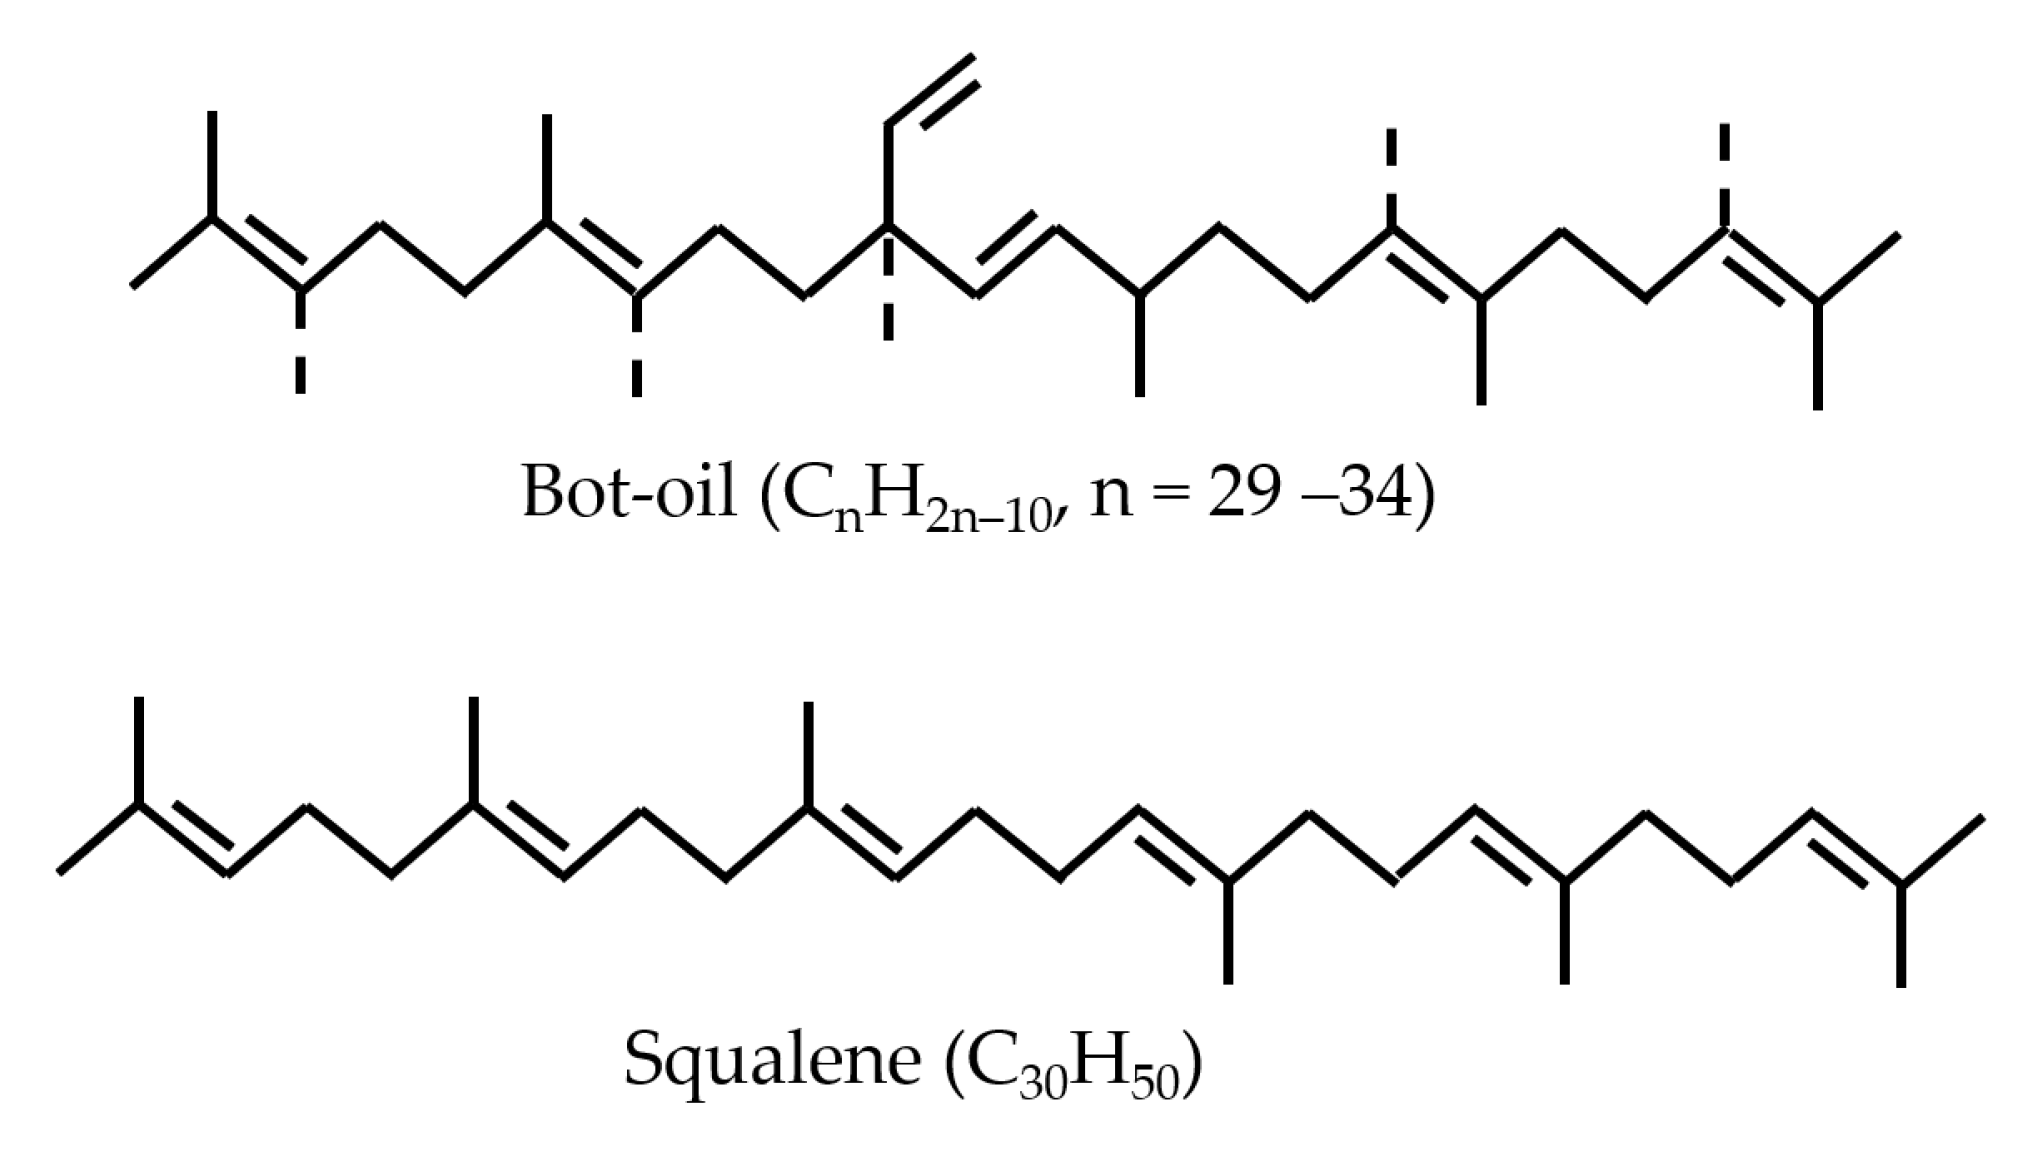
Figure 7 displays the molecular structures of Bot-oil and its model compound, squalene. Bot-oil is a blend of long carbon-chain hydrocarbons with a molecular formula of CnH2n−10 (n = 29–34) [20]. Its main carbon chain contains 22 carbons, while multiple short carbon branches range from 7 to 12 carbons. Each Bot-oil molecule includes six C=C double bonds. The numerous short-chain branches on the central carbon backbone give Bot-oil a low freezing point (<213 K), which is highly useful for jet fuel in planes operating in cold environments (high altitude). Squalene has a molecular formula of C30H50, and each squalene molecule also contains six C=C double bonds. Squalene is frequently used as a model compound for Bot-oil in hydrocracking reactions.
Table 3 presents the results of squalene hydrocracking over various catalysts at 623 K for 3 h. After reaction with each catalyst, the squalene conversion reached 100%, with no remaining squalene (C30H50) in the product. The yield of C10−C15 jet-fuel-range hydrocarbons is important for evaluating catalyst performance in squalene hydrocracking. Pt/α-ZrP produced a squalane (C30H62) yield of 9.5%, a C1−C4 gas hydrocarbon yield of 7.2%, a C5−C9 gasoline-range hydrocarbon yield of 48.7%, a C10−C15 jet-fuel-range hydrocarbon yield of 30.6%, a C16−C20 diesel-range hydrocarbon yield of 1.7%, and a C21−C29 wax hydrocarbon yield of 0.2%. Squalane results from squalene hydrogenation, while C1−C29 hydrocarbons originate from hydrocracking. The squalane yield decreased to just 0.1% for Pt/Al2O3-α-ZrP, while the C10−C15 hydrocarbon yield increased to 52.8% after the reaction. Pillaring large Al polyoxocations within the interlayer of α-ZrP notably improved the production of jet-fuel-range hydrocarbons during squalene hydrocracking. The Al2O3-α-ZrP catalyst without Pt mainly yielded C1−C4 gas hydrocarbons and C5−C9 gasoline-range hydrocarbons. Conversely, Pt/SiO2 without a solid acid exhibited a high yield of 92.4% for the hydrogenation product squalane, with very low yields of C1–C29 cracking products. Therefore, Pt is crucial for squalene hydrogenation, and solid acidity is necessary for cracking. Pt/H-ZSM-5 cracked all squalene and primarily produced C5−C9 gasoline-range hydrocarbons at 623 K for 3 h. Because the CH2Cl2 solvent was used to wash the internal parts of the autoclave (including the used catalyst), all liquid and wax products were collected for analysis after reaction. The carbon mass balance before and after the reaction showed an error of less than 5% for each catalyst.
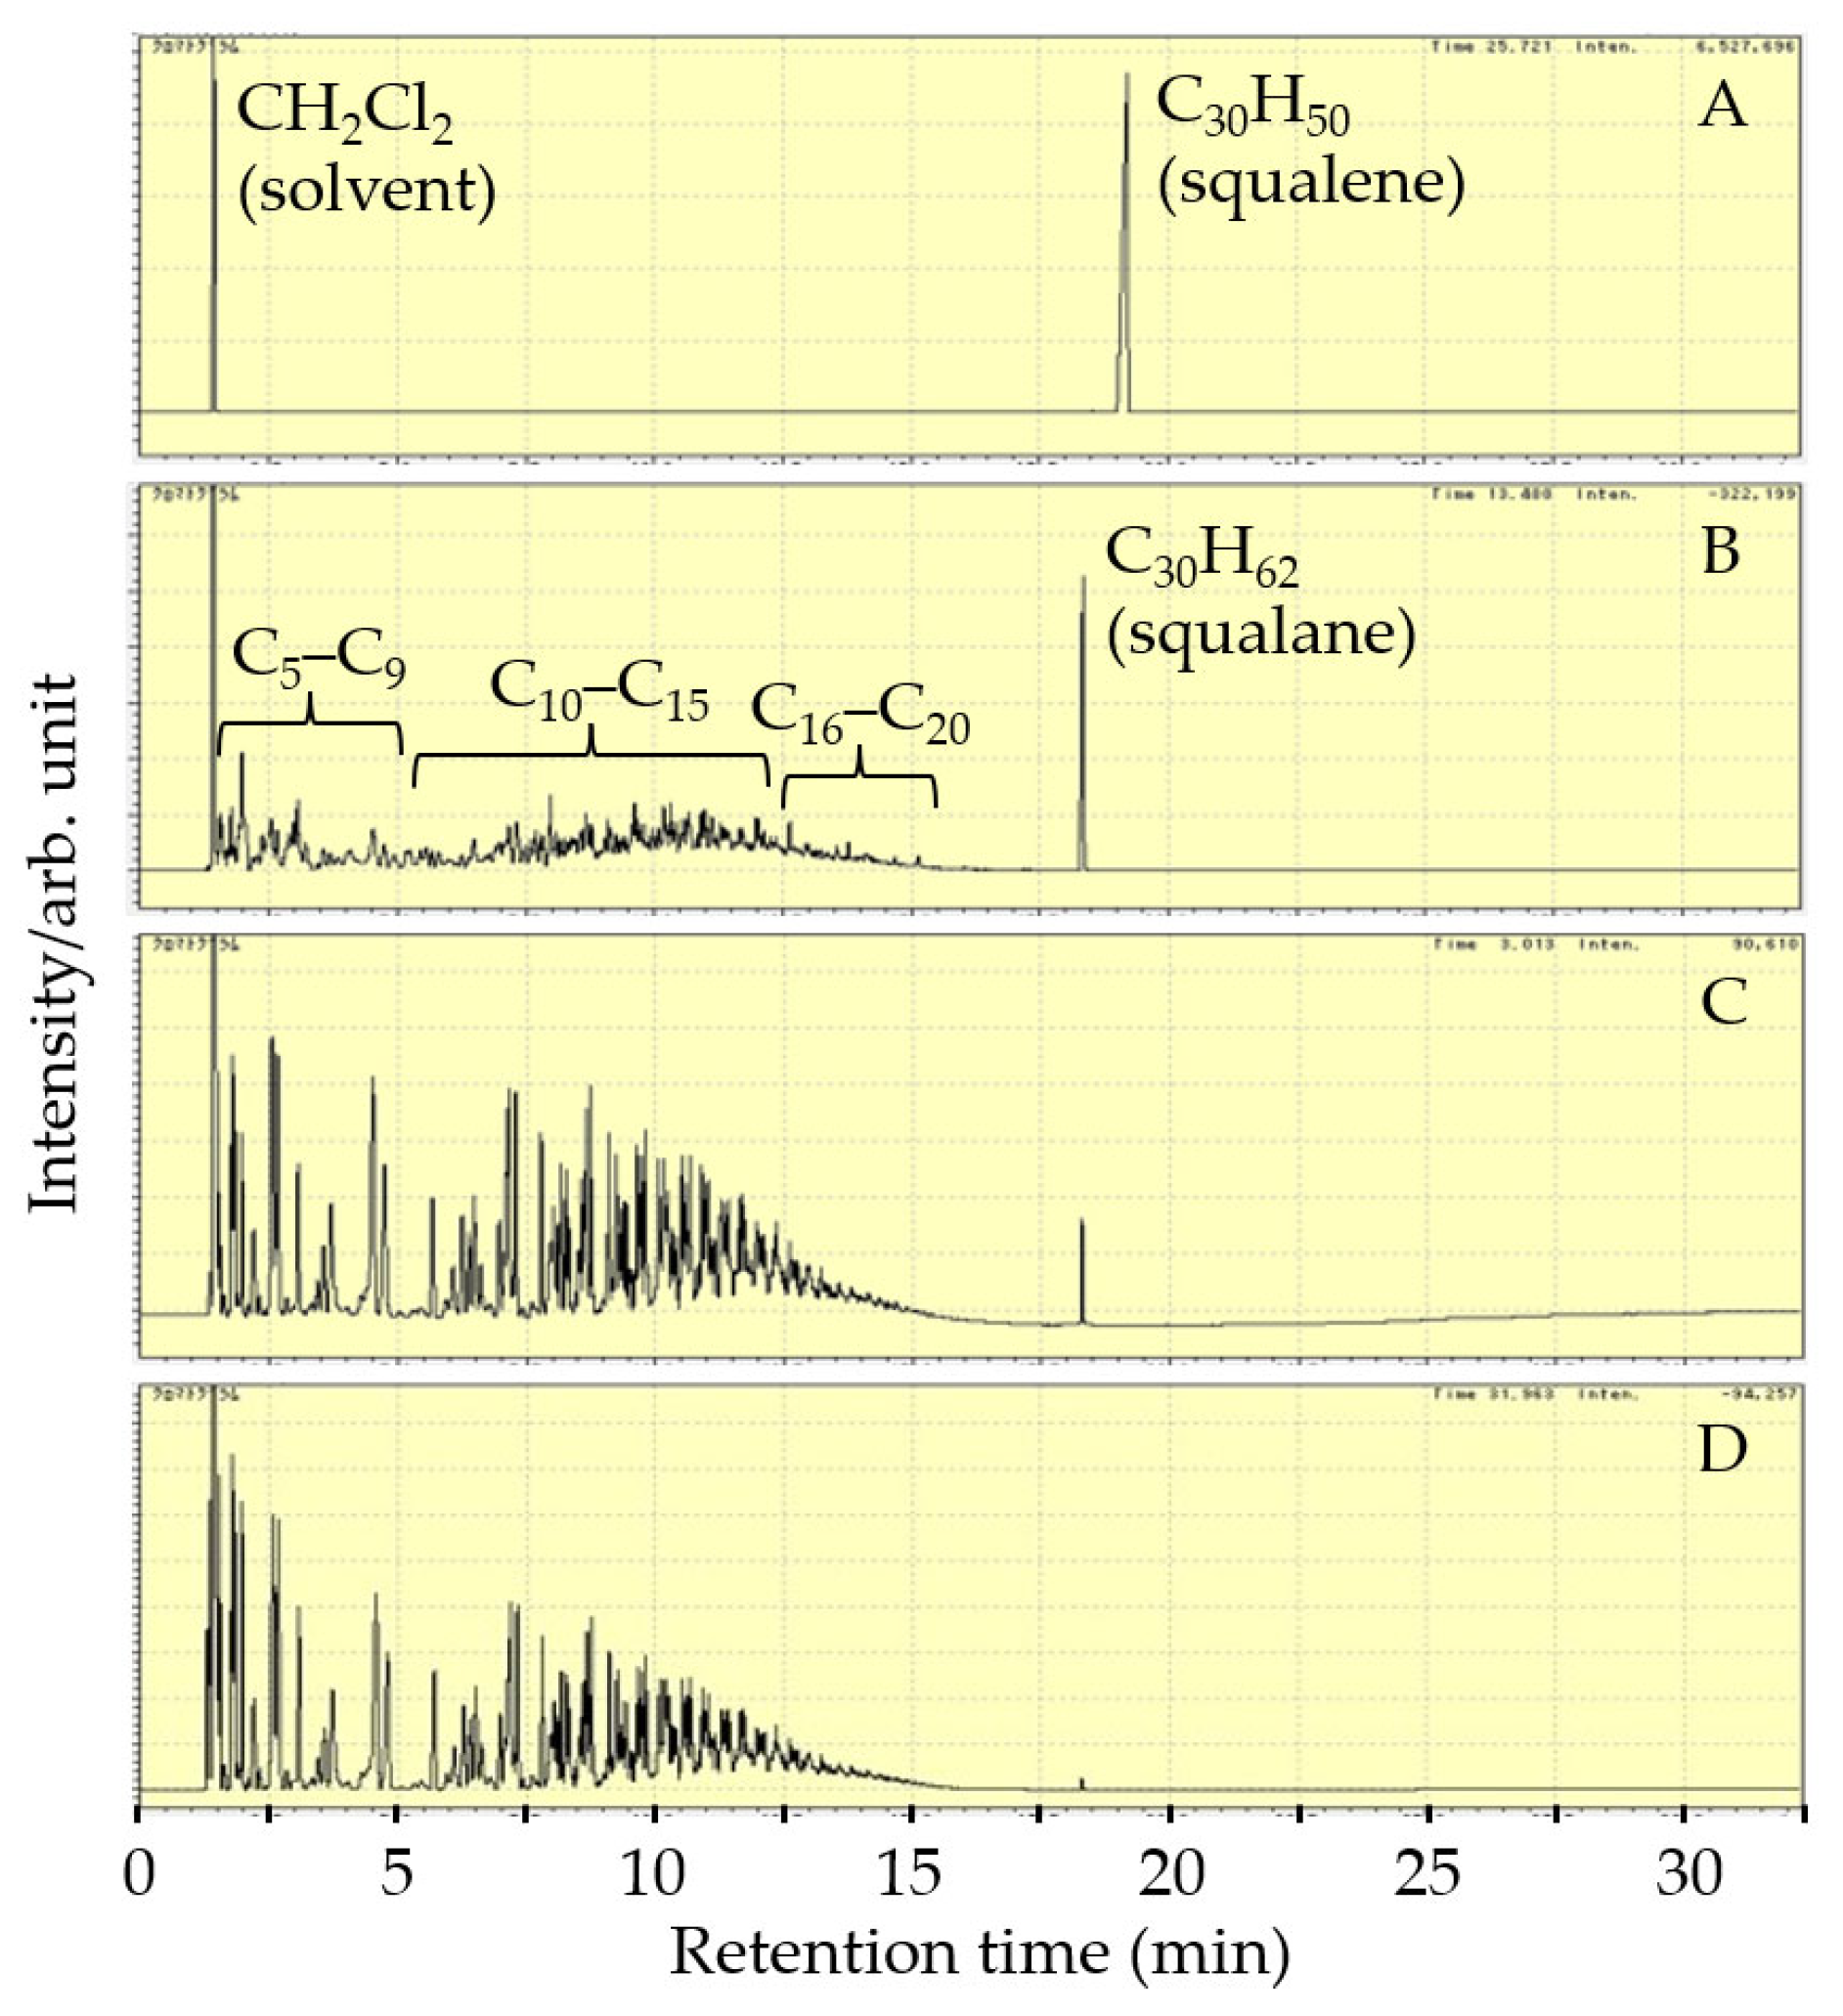
Squalene hydrocracking on 1 wt.% Pt/Al2O3-α-ZrP after reacting at 623 K for various durations: the FID-GC charts of liquid products are shown in Figure 8, and the reaction results are summarized in Table 4.
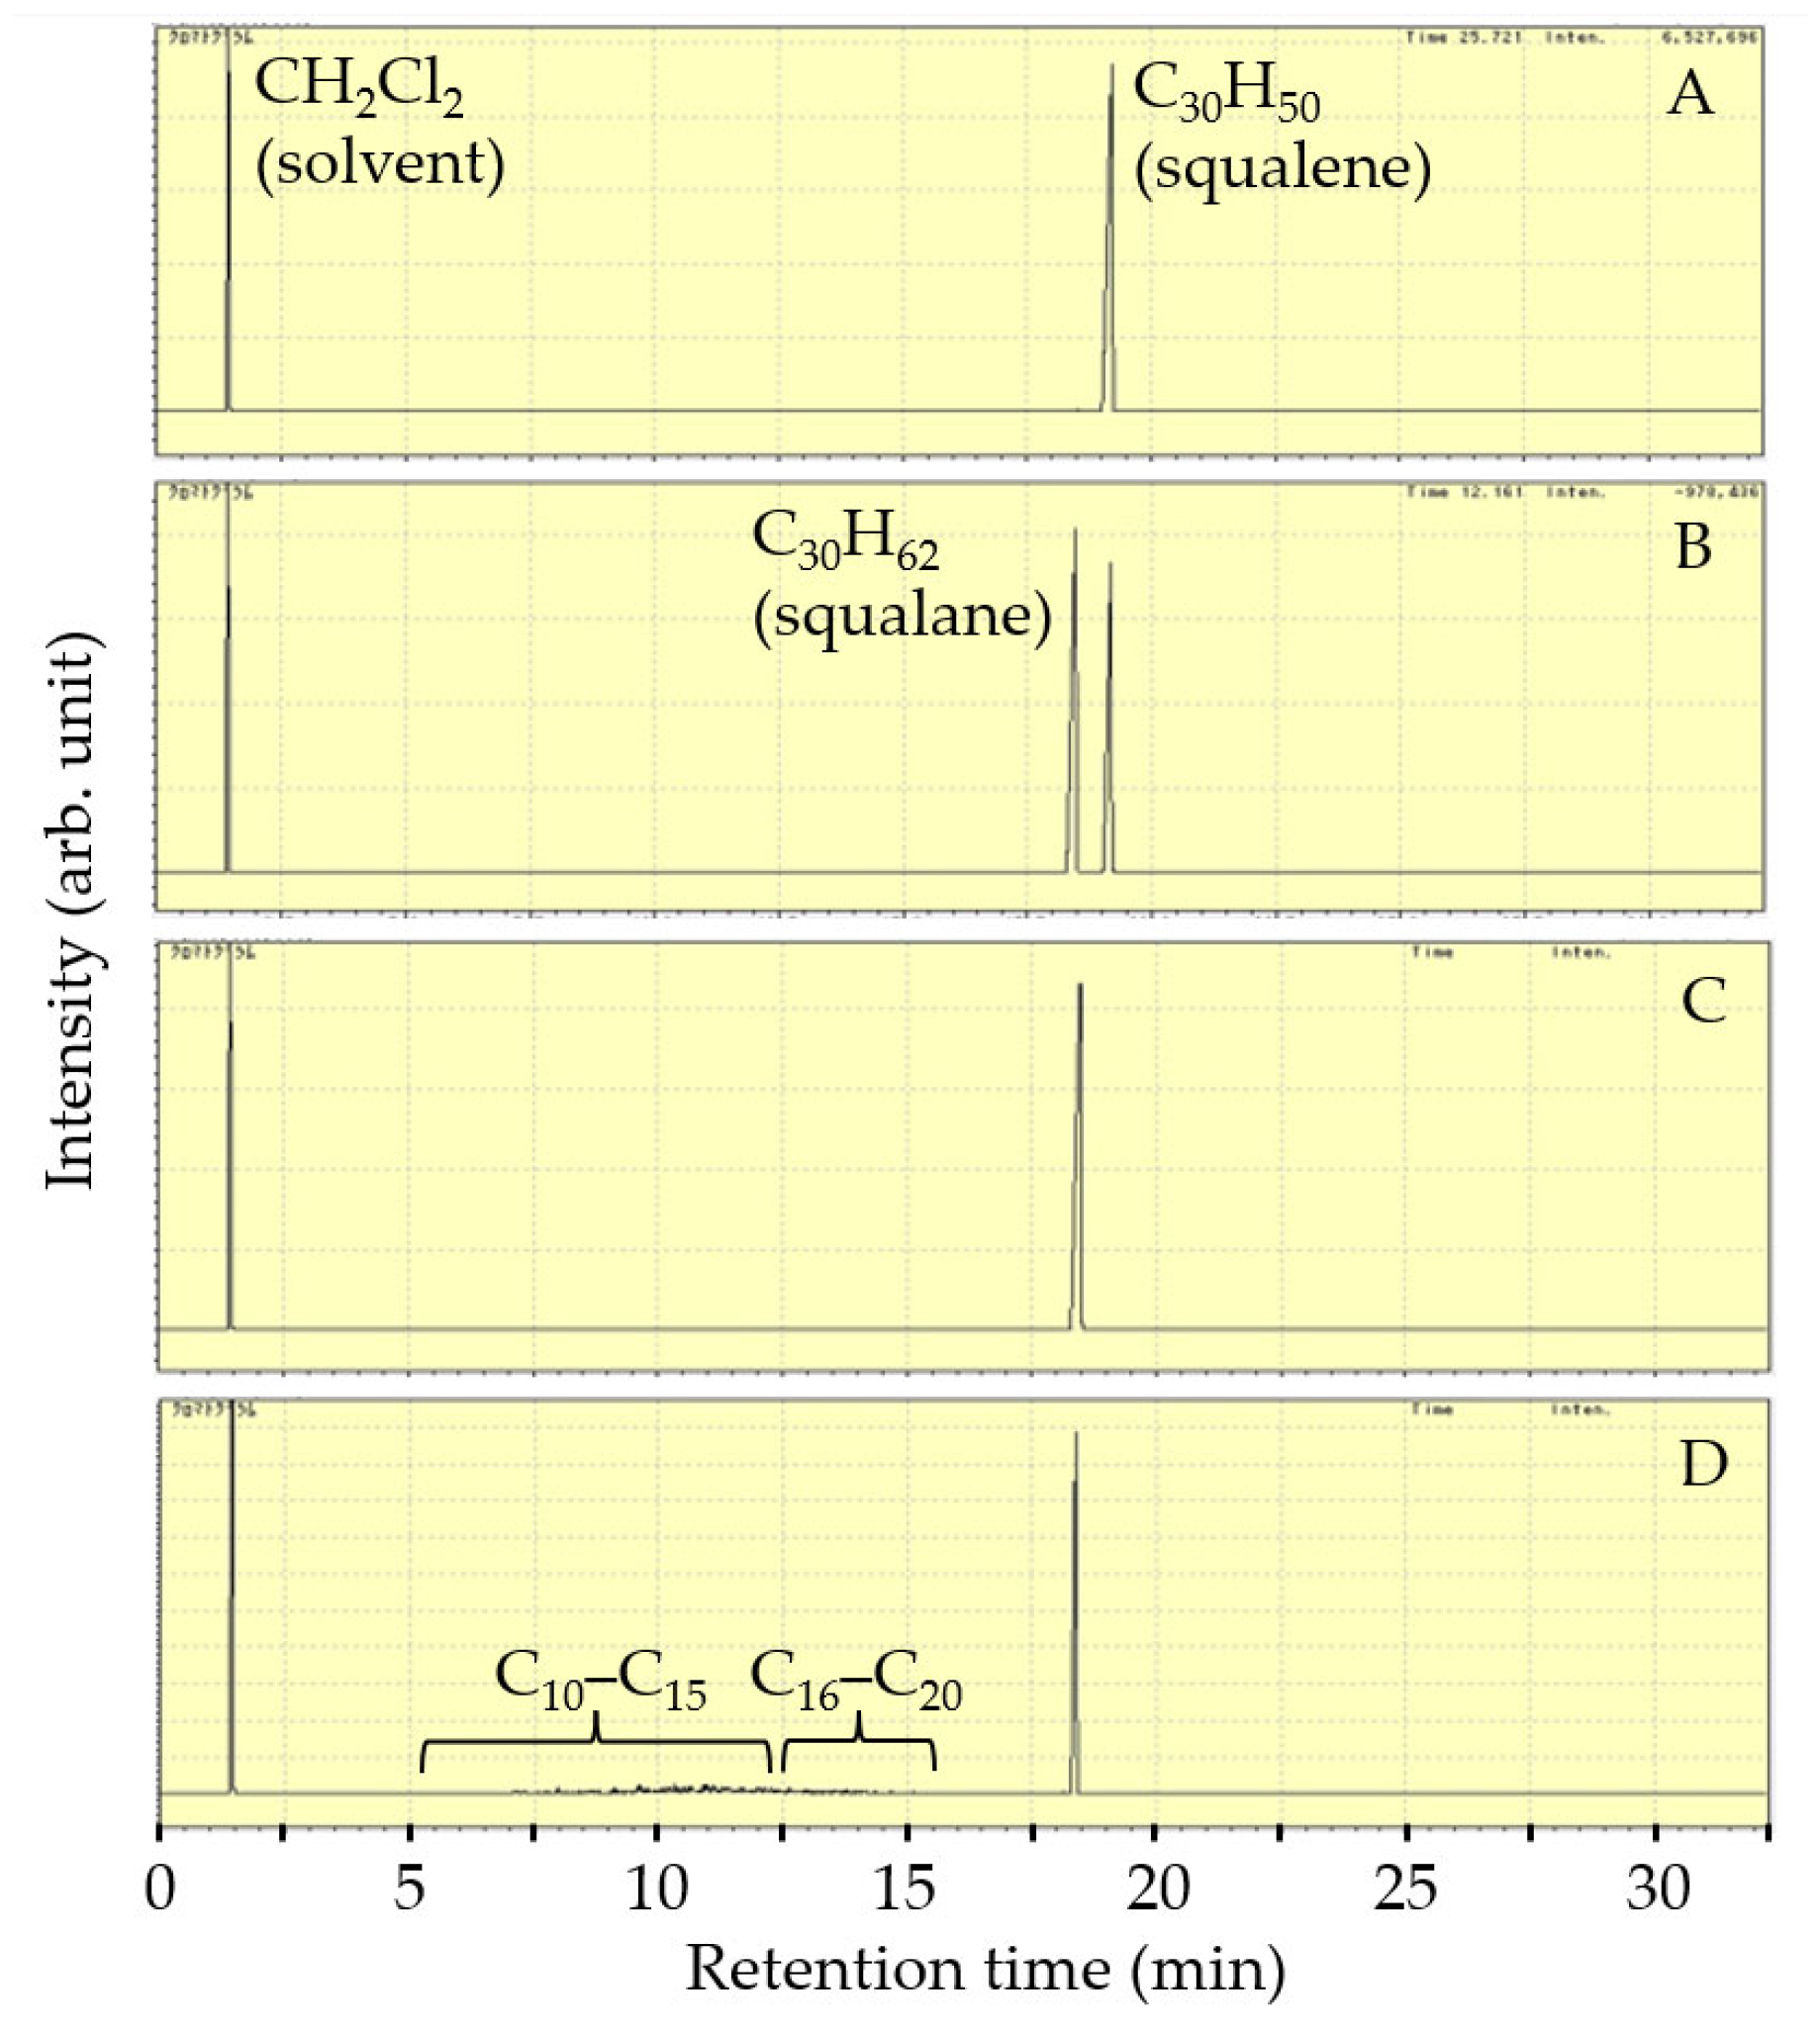
As shown in Figure 8, the peaks of squalene (C30H50) reactant and CH2Cl2 solvent are exhibited in the GC chart before the reaction. The squalene peak disappears, and the squalane (C30H62) peak is the most prominent in the GC chart after 1 h at 623 K. As the reaction time increases from 1 to 3 h, the peak of squalane gets smaller while the levels of cracking products (C5–C20 hydrocarbons) grow in the GC charts. This suggests that the hydrocracking of squalane becomes dominant during the reaction between 1 and 3 h. The results of GC-MS proved that all peaks in Figure 8 (FID-GC) are aliphatic saturated hydrocarbons using the NIST-11 database. Additionally, the peaks of normal alkanes (n-alkanes) were very low in Figure 8 (FID-GC), and the iso-alkanes were the main products in the hydrocracking of squalene.
As shown in Table 4, the squalene conversion reached 100% even after 1 h at 623 K. The proportion of C5−C9 hydrocarbons increased with longer reaction times from 1 to 3 h, indicating that some of the C10–C20 long hydrocarbon products underwent further cracking into smaller C5−C9 hydrocarbons in the reaction system. The ratio of C10–C15 jet-fuel-range hydrocarbons to total C1–C29 cracking products decreased from 0.57 to 0.53 by increasing reaction time from 1 to 3 h.
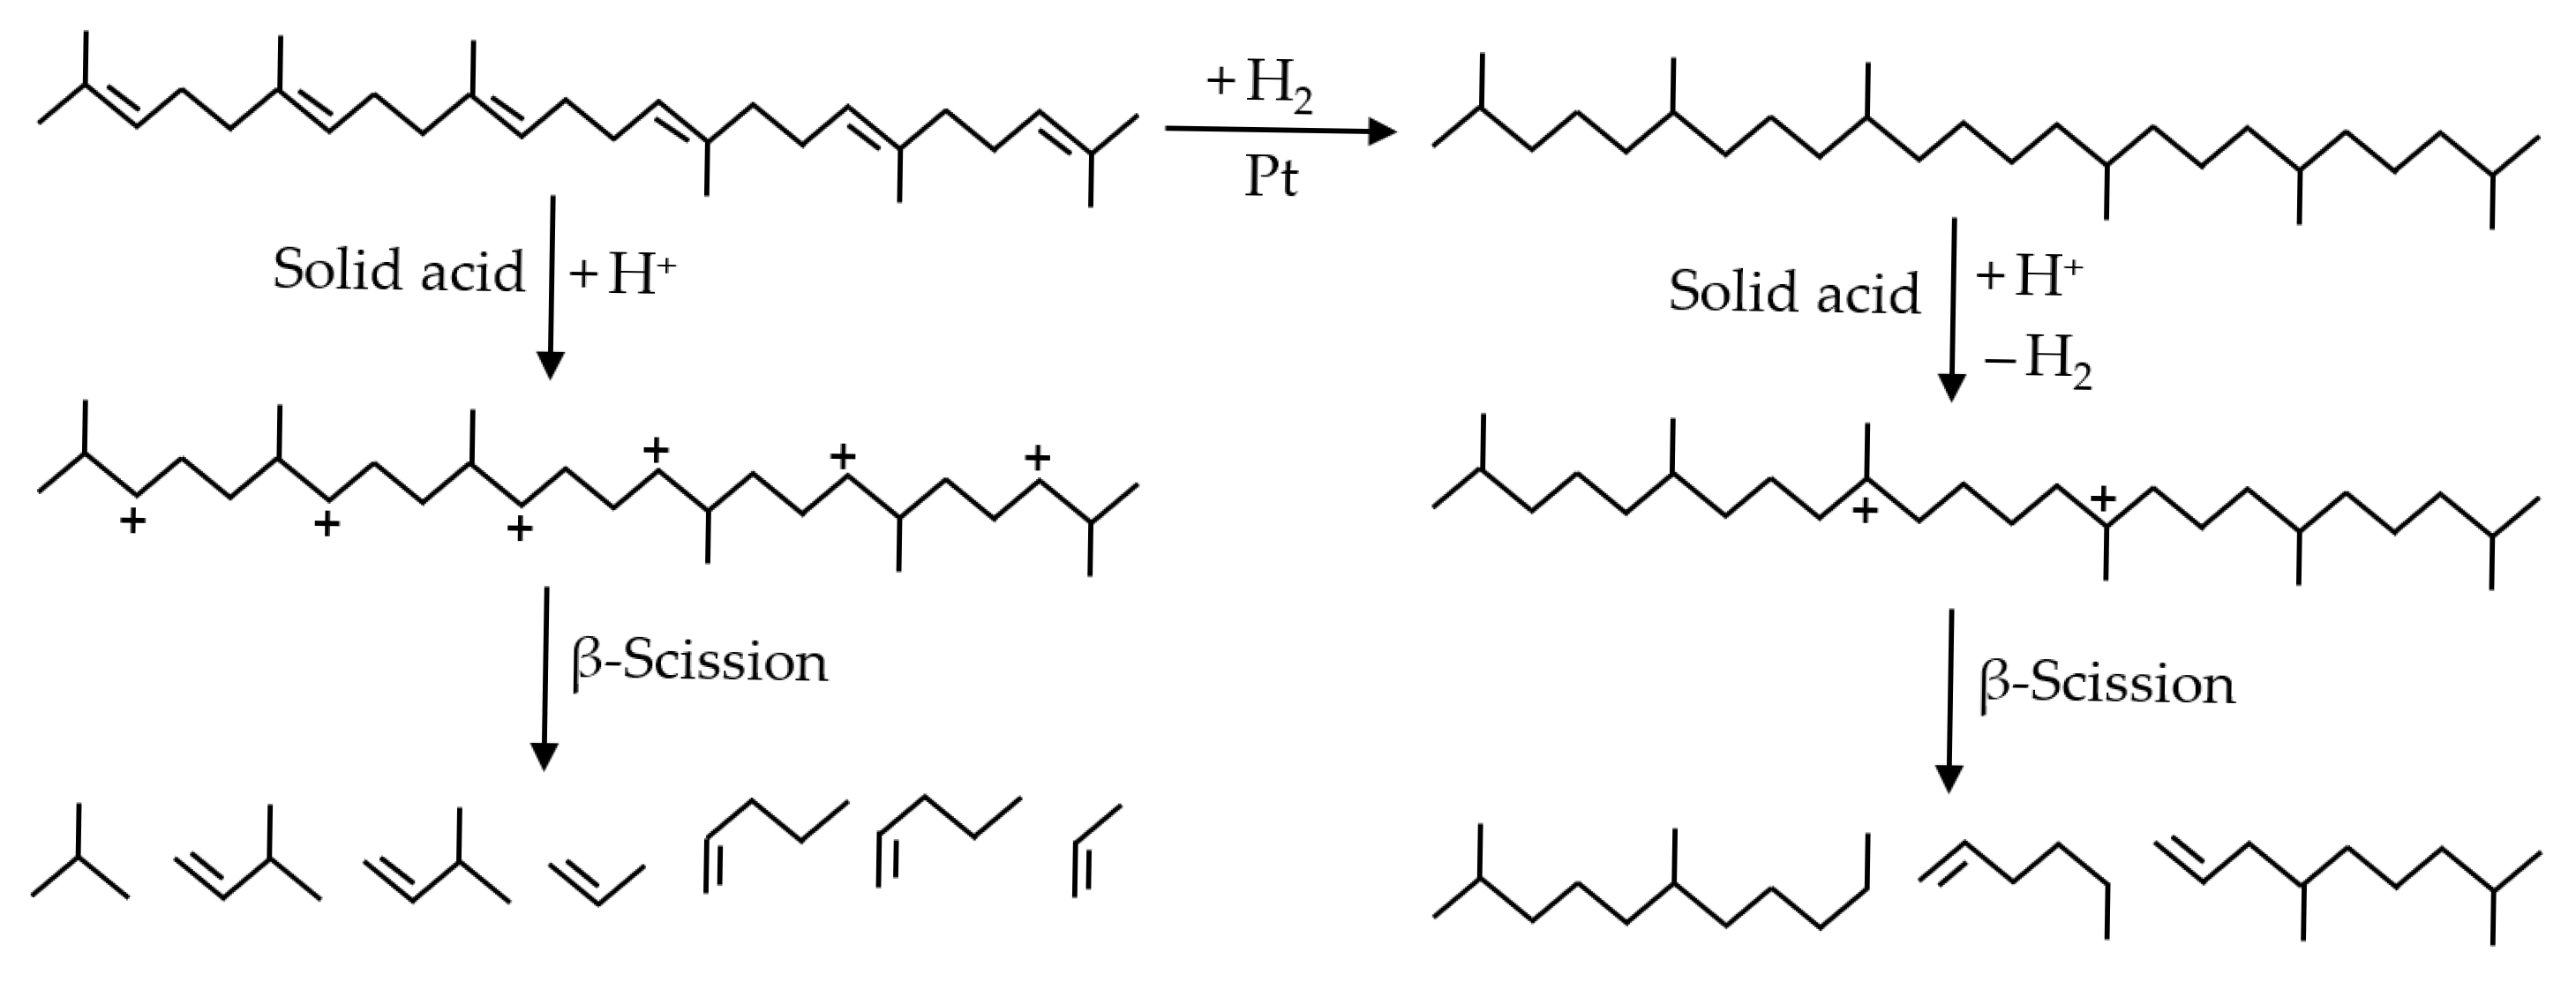
Figure 9 shows the diagram of squalene hydrocracking on acid catalysts and bifunctional catalysts containing Pt and solid acids. Carbenium ions are important intermediates in the hydrocracking of large hydrocarbons [40]. On a solid acid catalyst without Pt, carbenium ions are formed from squalene with protons on the solid acid and then undergo β-scission to enable hydrocracking [40]. These carbenium ions can form at various points in the carbon chain because the squalene molecule has six C=C double bonds. After β-scission of these carbenium ions, the resulting products include large amounts of C1–C4 gas hydrocarbons and C5–C9 gasoline-range hydrocarbons. When a catalyst with Pt and solid acid is used, squalene molecules are rapidly hydrogenated to squalane on the Pt sites. Then, squalane is converted into carbenium ions on the solid acid sites by proton addition and dehydrogenation. The formation of carbenium ions from an alkane (like squalane) is slower than from an alkene such as squalene. The carbenium ions formed from alkanes tend to form at more stable middle points around the center of the carbon chains [40]. Therefore, the selectivity for jet-fuel-range hydrocarbons (C10–C15) increases significantly when Pt is added to the Al2O3-α-ZrP catalyst, as shown in Table 1.
The carbenium ions produced in the reaction system can also undergo isomerization and alkylation during the cracking reaction [40]. Hydroisomerization occurs because isomers are more thermodynamically stable than normal alkanes [40]. Alkylation and cracking involve a disproportionation reaction through a bimolecular mechanism. In this process, an olefin reacts with a carbenium ion to form a larger carbenium ion, which then breaks into two smaller ions [40]. Hence, various hydrocarbons are produced from the hydrocracking of squalene on catalysts containing Pt and solid acids, resulting in many peaks appearing in the FID-GC charts, as shown in Figure 9.
The acidity of the support greatly affects the product distribution in squalene hydrocracking over a Pt-supported catalyst. Carbenium ions cannot form on SiO2 without acid sites because SiO2 cannot supply protons to squalene. The cracking rate is slow on a weak solid acid, which remains squalane in the reaction system over the Pt/α-ZrP catalyst. Conversely, if solid acidity is too strong, the jet-fuel-range hydrocarbon products undergo further cracking to form light hydrocarbons. The strong acid sites in H-ZSM-5 zeolite determined a high C5–C9 hydrocarbon yield from squalene hydrocracking on Pt/H-ZSM-5.
The pore size of the support also affects activity and selectivity in squalene hydrocracking. Since the interlayer space in α-ZrP is only 1.3 Å, large squalene molecules are difficult to enter the interlayer zone during the reaction. Pillaring large polyoxocations into the lamellar α-ZrP is a common method to extend the interlayer spacing, which leads to an enhancement of catalytic activity [41,42,43]. In this study, extending the interlayer spacing through Al-polyoxocations pillaring improved the yield of jet-fuel-range hydrocarbons. Because Al2O3-α-ZrP has suitable acid strength and large pores, Pt/Al2O3-α-ZrP exhibited the highest yield of jet-fuel-range hydrocarbons among various catalysts, as shown in Table 3.

3.3. Designing Reaction Process for Squalene Hydrocracking on Pt/Al2O3-α-ZrP

Squalene hydrocracking on 1 wt.% Pt/Al2O3-α-ZrP at 523 K at various reaction durations: the FID-GC charts of liquid products are shown in Figure 10, and the reaction results are summarized in Table 5.
As shown in Figure 10, the squalene peak appeared at a retention time of 18 min before the reaction. After 0.5 h at 523 K, two peaks corresponding to squalene and squalane were observed with nearly equal intensity in the GC chart, indicating that squalene was hydrogenated to squalane on the Pt/Al2O3-α-ZrP catalyst. After 1 h at 523 K, the squalene peak disappeared, and only the squalane peak remained with CH2Cl2 solvent in the GC chart. Therefore, squalene hydrogenation to squalane is the initial step in squalene hydrocracking, and it can be completed at 523 K within one hour. After 5 h at 523 K, the peaks of C10–C20 cracking products appeared in the FID-GC chart, but their intensities were very weak. These results indicate that squalane cracking is the second step in squalene hydrocracking, and a temperature of 523 K is too low to crack the squalane formed from squalene hydrogeneration. Additionally, the peaks of over-cracked C5–C9 gasoline-range hydrocarbons did not appear in the FID-GC chart after reaction for 5 h at 523 K.
As shown in Table 5, the squalene conversion was 51.1%, with squalane being the only product after 0.5 h. All squalene was converted to squalane without forming any other products after 1 h. Squalene is hydrogenated to squalane on Pt sites, and the formed squalane is cracked into light hydrocarbons on solid acid sites over a bifunctional catalyst, as shown in Figure 9. Therefore, a 1-h reaction at 523 K is sufficient for squalene hydrogenation but not enough for squalane hydrocracking. When the reaction time was extended to 5 h, only a small amount of squalane was cracked into light hydrocarbons. Notably, the ratio of C10–C15 jet-fuel-range hydrocarbons in all cracked products (C1–C29) reached 0.68 after reaction at 523 K for 5 h. This high ratio provides important insight into increasing the yield of C10–C15 hydrocarbons from squalene hydrocracking.
Table 6 shows the reaction results of squalene hydrocracking on 1 wt.% Pt/Al2O3-α-ZrP for 5 h at various temperatures. When the reaction was performed at 523 K for 5 h, the squalane yield reached as high as 97.4%. Conversely, the squalane yield was only 5.1% after reaction at 573 K for 5 h, demonstrating that squalane cracking speeds rise significantly with higher temperatures. Additionally, no squalane was found in the products after the reactions at 623 K and 723 K for 5 h. However, a reaction at 723 K formed gasoline-range hydrocarbons as the main product. The ratio of C10–C15 jet-fuel-range hydrocarbons in all cracked products (C1–C29) decreased from 0.68 to 0.34 as the temperature increased from 523 to 723 K. Higher temperatures encourage further cracking of C10–C15 products, reducing the yield of jet-fuel-range hydrocarbons.
Multi-step reaction processes have been reported to improve reaction activity by balancing the favorable conditions of different reactions [44]. As shown in Figure 9, squalene undergoes two steps in the hydrocracking: hydrogenation (to squalane) and squalane cracking. The break of the C=C double bonds of squalene caused further cracking and decreased the yield of jet-fuel-range hydrocarbons. Therefore, a two-step process was developed for the hydrocracking reactions in this study. As shown in Table 5, squalene was converted totally to squalane at 523 K in one hour. Hence, 523 K is the optimal reaction temperature for squalene hydrogenation. As shown in Table 6, the reaction at 623 K exhibited the highest yield of jet-fuel-range hydrocarbons among various reaction temperatures. Hence, 623 K is the optimal reaction temperature for squalane hydrocracking. A two-step reaction was designed as follows: the first step was carried out at 523 K for 1 h, during which squalene was completely hydrogenated to squalane on Pt/Al2O3-α-ZrP without cracking. The second step involved further reaction at 623 K for 3 h, which hydrocracked the formed squalane into light hydrocarbons. Since one squalene molecule contains six C=C double bonds, it has higher reactivity and more cracking sites than squalane. Squalene cracking occurs faster but is less selective than squalane cracking. Essentially, this two-step process shifts from squalene hydrocracking to squalane hydrocracking, aiming to increase the yield of C10–C15 jet-fuel-range hydrocarbons.
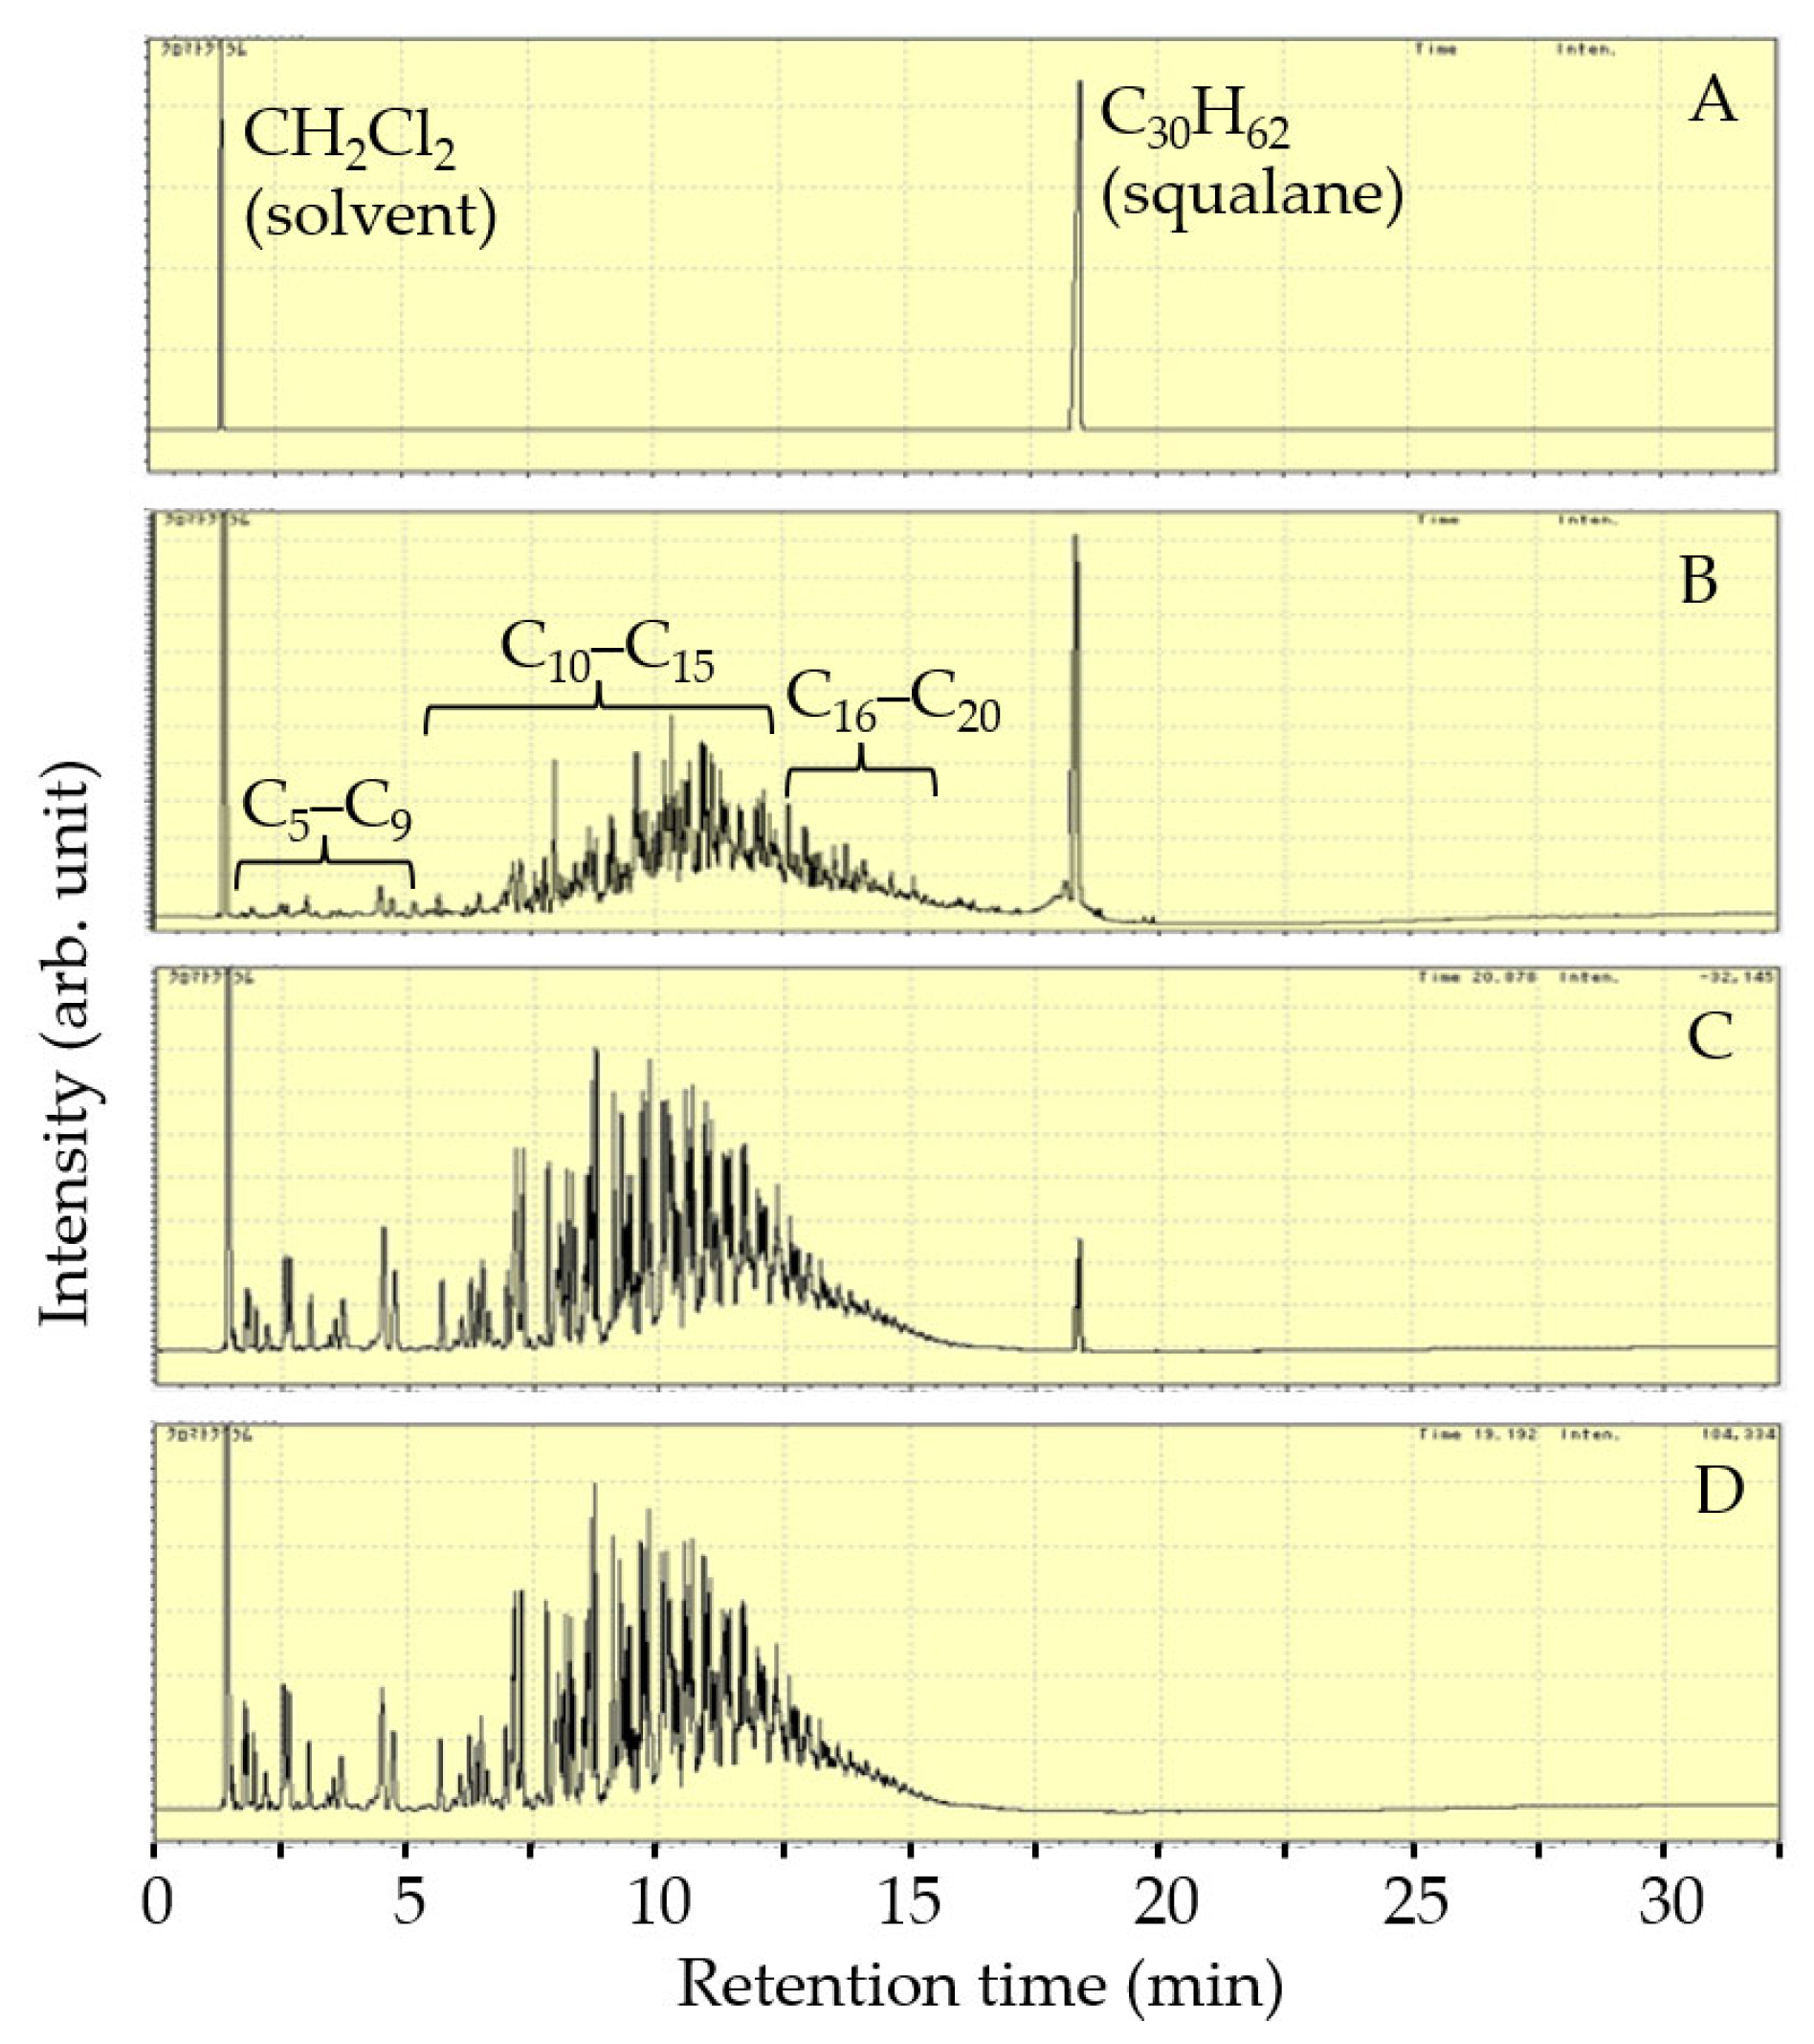
Squalene hydrocracking on 1 wt.% Pt/Al2O3-α-ZrP in a two-step process: the FID-GC charts of liquid products are shown in Figure 11, and the reaction results are summarized in Table 7. The first step was carried out at 523 K for 1 h. Then, the temperature was raised to 623 K, and the second-step reaction continued for 1, 2, or 3 h.
As shown in Figure 11, only squalane was identified as the product after the first step at 523 K for 1 h. Thus, the second step involved cracking the squalane produced earlier. A notable amount of C5–C20 cracking products appeared in the FID-GC chart at 623 K after 1 h in the second step. Increasing the reaction time to 2 h in the second step reduced the squalane peak and nearly eliminated the peaks of C21–C29 waxes. After 3 h in the second step, the squalane peaks disappeared from the FID-GC chart, and the amount of over-cracked C5–C9 gasoline-range hydrocarbons was lower than that in the one-step reaction at 623 K for 3 h, as compared to Figure 11D with Figure 8D.
As shown in Table 7, after 3 h in the second step, the yield of C10–C15 jet-fuel-range hydrocarbons reached 65.0%, significantly higher than the 52.8% C10–C15 yield from the one-step reaction at 623 K for 3 h (as shown in Table 3). Additionally, the ratio of C10–C15 jet-fuel-range hydrocarbons to all cracked products (C1–C29) remained roughly the same regardless of whether the second step lasted 1, 2, or 3 h. The C16–C29 heavy hydrocarbons cracked into C10–C15 during the second step, balancing over-cracking of C10–C15 hydrocarbons and keeping the C10–C15 fraction nearly constant as the second step’s reaction time increased from 1 to 3 h.

3.4. Hydrocracking of Bot-Oil over Pt/Al2O3-α-ZrP in a Two-Step Process

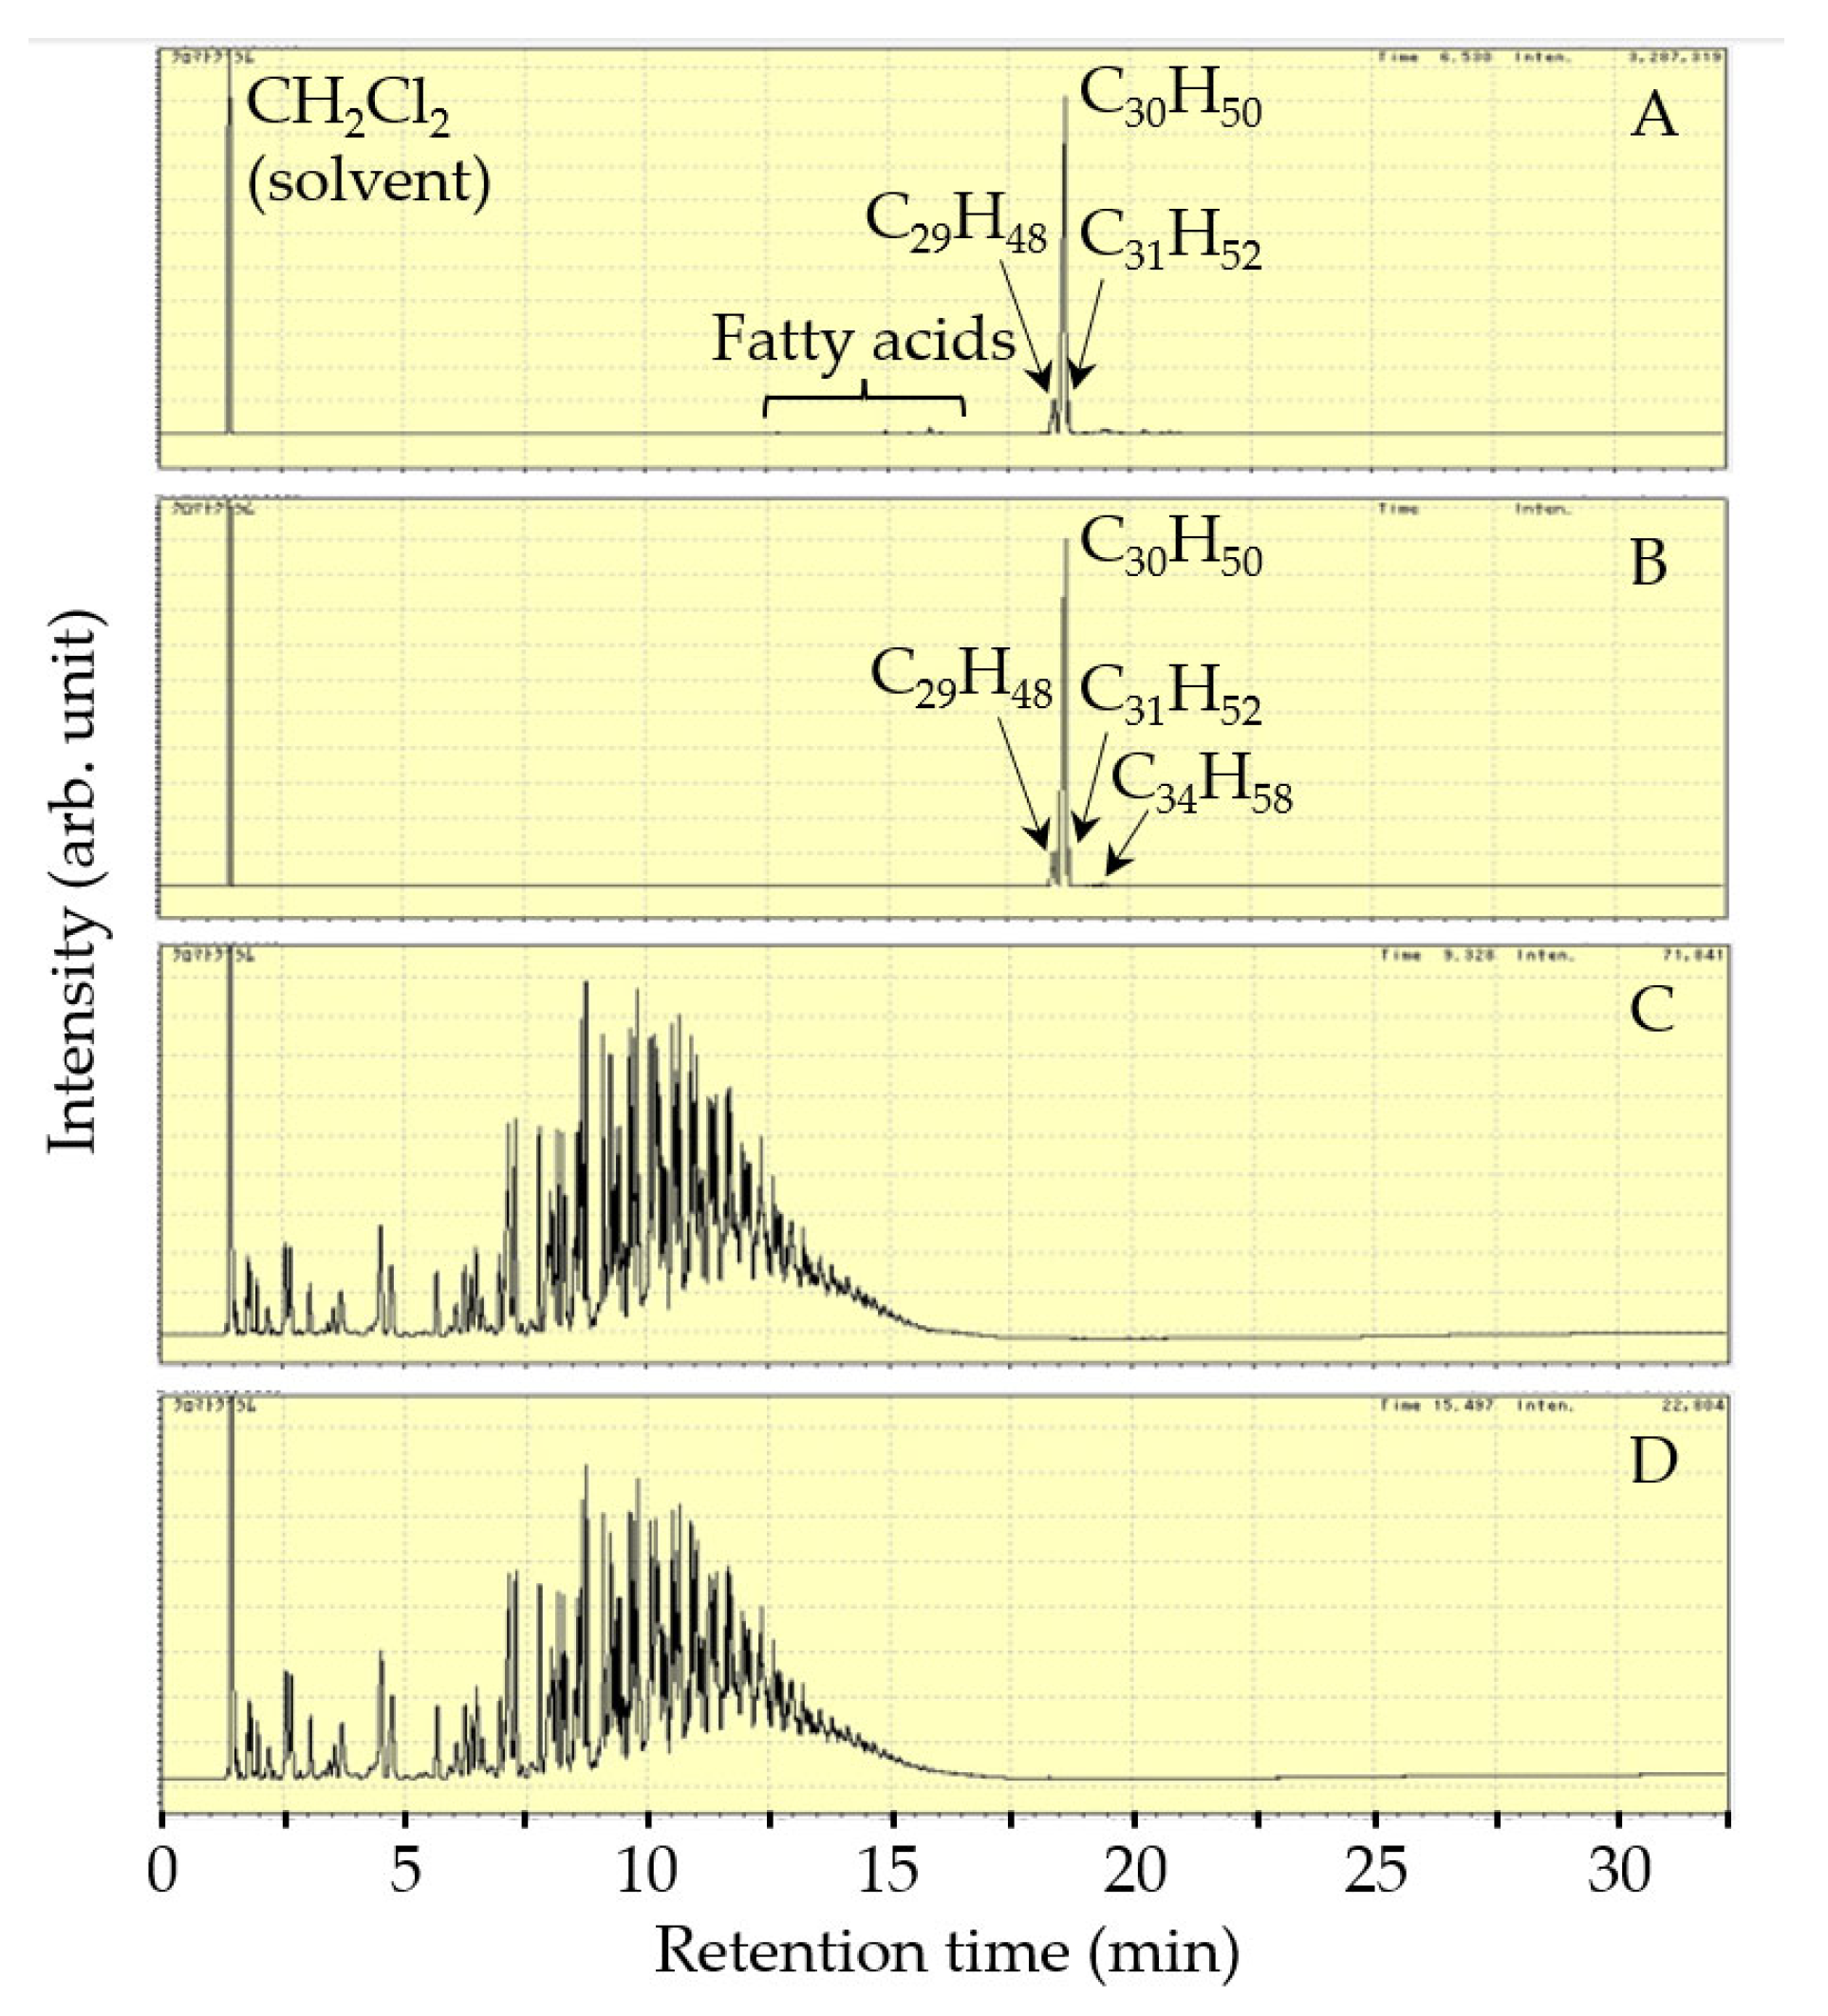
Bot-oil hydrocracking on 1 wt.% Pt/Al2O3-α-ZrP in a two-step reaction: the FID-GC charts of liquid products are shown in Figure 12, and the reaction results are summarized in Table 8. The first step was carried out at 523 K for 1 h. Then, the temperature was raised to 623 K, and the second-step reaction continued for 1, 2, or 3 h. Two types of Bot-oil were used in this study: crude oil (Bot-oil-C) and pure oil (Bot-oil-P). The pure oil was obtained after refining the crude oil with a silica gel column.
As shown in Figure 12, the main components in Bot-oil-C are C30H50 (>90 wt.%), C29H48, and C31H52. The small peaks from 12 to 18 min represent fatty acids with carbon chains from 15 to 20. In the FID-GC chart of Bot-oil-P, the fatty acids’ peaks disappeared, leaving only large hydrocarbons: C30H50 (>90 wt.%), C29H48, C31H52, and a small amount of C34H58. After a two-step reaction (initial at 523 K for 1 h, then at 623 K for 3 h), all Bot-oil-C and Bot-oil-P were cracked, with no remaining Bot-oil peaks in the GC charts. During the reaction, the fatty acids in crude oil Bot-oil-C were deoxygenated to paraffins by H2 on the Pt/Al2O3-α-ZrP catalyst [10].
As shown in Table 8, both the conversions of Bot-oil-C and Bot-oil-P reached 100% because the components of Bot-oil could not be detected in the products after the reaction. The hydrocarbon distribution in the product from Bot-oil-C hydrocracking was nearly identical to that from Bot-oil-P hydrocracking. The ratio of C10–C15 jet-fuel-range hydrocarbons to all cracked products (C1–C29) was over 0.66 in both Bot-oil-C and Bot-oil-P. Therefore, purification is unnecessary when producing jet-fuel-range hydrocarbons from Bot-oil hydrocracking. Skipping the purification step will reduce the overall costs in the bio-jet fuel production process.
Table 9 shows the reusability of 1 wt.% Pt/Al2O3-α-ZrP in the two-step hydrocracking of Bot-oil-C. The reaction with the fresh catalyst was conducted at 523 K for 1 h in the first step, then at 623 K for 3 h in the second step. An iron filter with a 50 nm pore size was placed at the bottom of the autoclave reactor to support the molded catalyst, as shown in Figure 1. After the two-step process, the liquid products flowed out of the autoclave through the bottom outlet, and the solid catalyst remained on the iron filter inside the reactor. Subsequently, 20 g of Bot-oil-C was added to the autoclave via the upper lid line at room temperature. The next two-step reaction started after charging 2 MPa H2 into the autoclave at 523 K. Since the CH2Cl2 solvent could not be used to wash the internal parts of the autoclave in the experiment of reusability, some products were absorbed on the internal wall of the autoclave and the surface of the catalyst after reaction. Hence, a decrease in carbon mass balance before and after the reaction was found in Table 9, especially for the first cycle reaction. The Bot-oil conversion stayed at 100%, and the C10–C15 fraction in the products did not decrease after five runs. These results demonstrate that the Pt/Al2O3-α-ZrP catalyst can be reused with a simple filtration method, and the active components do not leach into the liquid products over five runs. Using a molded catalyst and an iron filter inside the autoclave simplified the separation and reuse of the solid catalyst.

4. Conclusions

Al Polyoxocation was inserted into the interlayer space of α-ZrP through ion exchange. Pt/Al2O3-α-ZrP produced C10−C15 jet-fuel-range hydrocarbons that were higher than those over Pt/α-ZrP and Pt/H-ZSM-5 in a one-step squalene hydrocracking reaction at 623 K for 3 h. Pt/Al2O3-α-ZrP acted as a bifunctional catalyst in squalene hydrocracking: Pt sites provided a hydrogenation function, while the solid acid sites on Al2O3-α-ZrP helped crack main carbon chains. In a two-step process, squalene (C30H50) was hydrogenated to squalane (C30H62) during the first step at 523 K for 1 h, and the resulting squalane was hydrocracked into light hydrocarbons at 623 K for 3 h in the second step. This two-step method increased the yield of C10−C15 jet-fuel-range hydrocarbons because it largely prevented breaking the C=C double bonds in squalene molecules during the reaction. During hydrocracking of Bot-oil in the two-step process, all reactants were converted into light hydrocarbons, with a C10−C15 hydrocarbon yield exceeding 66% on Pt/Al2O3-α-ZrP. The Pt/Al2O3-α-ZrP catalyst could be reused by simple filtration, and its active components did not leach into the liquid during reaction.

Funding

This research received no external funding.

Data Availability Statement

The data supporting the conclusions of this study are supplied by the author.

Acknowledgments

The author thanks Kazuhisa Murata at the National Institute of Advanced Industrial Science and Technology (AIST, Japan) for his cooperation and discussion. The author also thanks Makoto M. Watanabe at Tsukuba University (Japan) for providing algae oils from Botryococcus braunii used in this study.

Conflicts of Interest

The author declares no conflicts of interest.

References

  1. Lee, D.S.; Pitari, G.; Grewe, V.; Gierens, K.; Penner, J.E.; Petzold, A.; Prather, M.J.; Schumann, U.; Bais, A.; Berntsen, T.; et al. Transport Impacts on Atmosphere and Climate: Aviation. Atmos. Environ. 2010, 44, 4678–4734. [Google Scholar] [CrossRef]
  2. Yang, X.; Guo, F.; Xue, S.; Wang, X. Carbon Distribution of Algae-based Alternative Aviation Fuel Obtained by Different Pathways. Renew. Sustain. Energy Rev. 2016, 54, 1129–1147. [Google Scholar] [CrossRef]
  3. Gutiérrez-Antonioa, C.; Gómez-Castrob, F.I.; Lira-Floresa, J.A.; Hernández, S. A review on the Production Processes of Renewable Jet Fuel. Renew. Sustain. Energy Rev. 2017, 79, 709–729. [Google Scholar] [CrossRef]
  4. Ahmed, S.; Khan, M.K.; Kim, J. Revolutionary Advancements in Carbon Dioxide Valorization via Metal-organic Framework-based Strategies. Carbon Capture Sci. Technol. 2025, 15, 100405. [Google Scholar] [CrossRef]
  5. Kieckhäfer, K.; Quante, G.; Müller, C.; Spengler, T.S.; Lossau, M.; Jonas, W. Simulation-Based Analysis of the Potential of Alternative Fuels towards Reducing CO2 Emissions from Aviation. Energies 2018, 11, 186. [Google Scholar] [CrossRef]
  6. Crawford, J.T.; Chan, C.W.; Budsberg, E.; Morgan, H.; Bura, R.; Gustafson, R. Hydrocarbon Bio-jet Fuel from Bioconversion of Poplar Biomass: Techno-economic Assessment. Biotechnol. Biofuels 2016, 9, 141. [Google Scholar] [CrossRef] [PubMed]
  7. Wei, H.; Liu, W.; Chen, X.; Yang, Q.; Li, J.; Chen, H. Renewable Bio-jet Fuel Production for Aviation: A Review. Fuel 2019, 254, 115599. [Google Scholar] [CrossRef]
  8. Wang, M.; Dewil, R.; Maniatis, K.; Wheeldon, J.; Tan, T.; Baeyens, J.; Fang, Y. Biomass-derived Aviation Fuels: Challenges and Perspective. Prog. Energy Combust. Sci. 2019, 74, 31–49. [Google Scholar] [CrossRef]
  9. Swaina, P.K.; Das, L.M.; Naik, S.N. Biomass to Liquid: A Prospective Challenge to Research and Development in 21st Century. Renew. Sustain. Energy Rev. 2011, 15, 4917–4933. [Google Scholar] [CrossRef]
  10. Liu, Y.; Sotelo-Boyás, R.; Murata, K.; Minowa, T.; Sakanishi, K. Hydrotreatment of Vegetable Oils to Produce Bio-hydrogenated Diesel and Liquefied Petroleum Gas Fuel over Catalysts Containing Sulfided Ni-Mo and Solid Acids. Energy Fuel 2011, 25, 4675–4685. [Google Scholar] [CrossRef]
  11. Eagan, N.M.; Kumbhalkar, M.D.; Buchanan, J.S.; Dumesic, J.A.; Huber, G.W. Chemistries and Processes for the Conversion of Ethanol into Middle-distillate Fuels. Nat. Rev. Chem. 2019, 3, 223–249. [Google Scholar] [CrossRef]
  12. Dong, Z.; Chen, W.; Xu, K.; Liu, Y.; Wu, J.; Zhang, F. Understanding the Structure−Activity Relationships in Catalytic Conversion of Polyolefin Plastics by Zeolite-Based Catalysts: A Critical Review. ACS Catal. 2022, 12, 14882–14901. [Google Scholar] [CrossRef]
  13. Georgianna, D.R.; Mayfield, S.P. Exploiting Diversity and Synthetic Biology for the Production of Algal Biofuels. Nature 2012, 488, 329–335. [Google Scholar] [CrossRef]
  14. Yoshida, M.; Tanabe, Y.; Yonezawa, N.; Watanabe, M.M. Energy Innovation Potential of Oleaginous Microalgae. Biofuels 2012, 3, 761–781. [Google Scholar] [CrossRef]
  15. Xu, W.; Ding, K.; Hu, L. A Mini Review on Pyrolysis of Natural Algae for Bio-Fuel and Chemicals. Processes 2021, 9, 2042. [Google Scholar] [CrossRef]
  16. Castellanos-Huerta, I.; Gómez-Verduzco, G.; Tellez-Isaias, G.; Ayora-Talavera, G.; Bañuelos-Hernández, B.; Petrone-García, V.M.; Fernández-Siurob, I.; Garcia-Casillas, L.A.; Velázquez-Juárez, G. Dunaliella salina as a Potential Biofactory for Antigens and Vehicle for Mucosal Application. Processes 2022, 10, 1776. [Google Scholar] [CrossRef]
  17. Metsoviti, M.N.; Papapolymerou, G.; Karapanagiotidis, I.T.; Katsoulas, N. Comparison of Growth Rate and Nutrient Content of Five Microalgae Species Cultivated in Greenhouses. Plants 2019, 8, 279. [Google Scholar] [CrossRef]
  18. Hillen, L.W.; Pollard, G.; Wake, L.V.; White, N. Hydrocracking of the Oils of Botryococcus braunii to Transport Fuels. Biotechnol. Bioeng. 1982, 24, 193–205. [Google Scholar] [CrossRef]
  19. Nakaji, Y.; Oya, S.; Watanabe, H.; Watanabe, M.M.; Nakagawa, Y.; Tamura, M.; Tomishige, K. Production of Gasoline Fuel from Alga-Derived Botryococcene by Hydrogenolysis over Ceria-Supported Ruthenium Catalyst. ChemCatChem 2017, 9, 2701–2708. [Google Scholar] [CrossRef]
  20. Yamamoto, S.; Mandokoro, Y.; Nagano, S.; Nagakubo, M.; Atsumi, K.; Watanabe, M.M. Catalytic Conversion of Botryococcus braunii Oil to Diesel Fuel under Mild Reaction Conditions. J. Appl. Phycol. 2014, 26, 55–64. [Google Scholar] [CrossRef]
  21. Zhang, K.; Zhang, X.; Tan, T. The Production of Bio-jet Fuel from Botryococcus braunii Liquid over a Ru/CeO2 Catalyst. RSC Adv. 2016, 6, 99842–99850. [Google Scholar] [CrossRef]
  22. Murata, K.; Liu, Y.; Watanabe, M.M.; Inaba, M.; Takahara, I. Hydrocracking of Algae Oil into Aviation Fuel-Range Hydrocarbons Using a Pt–Re Catalyst. Energy Fuels 2014, 28, 6999–7006. [Google Scholar] [CrossRef]
  23. Liu, Y.; Murata, K.; Inaba, M. Hydrocracking of Algae Oil to Aviation Fuel-Range Hydrocarbons over NiMo-supported Catalysts. Catal. Today 2019, 332, 115–121. [Google Scholar] [CrossRef]
  24. Asadieraghi, M.; Daud, W.M.A.W.; Abbas, H.F. Heterogeneous Catalysts for Advanced Bio-Fuel Production through Catalytic Biomass Pyrolysis Vapor Upgrading: A Review. RSC Adv. 2015, 5, 22234–22255. [Google Scholar] [CrossRef]
  25. Tiwari, A.; Rajesh, V.M.; Yadav, S. Biodiesel Production in Micro-reactors: A review. Energy Sustain. Dev. 2018, 43, 143–161. [Google Scholar] [CrossRef]
  26. García-Sánchez, M.; Sales-Cruz, M.; Lopez-Arenas, T.; Viveros-García, T.; Pérez-Cisneros, E.S. An Intensified Reactive Separation Process for Bio-Jet Diesel Production. Processes 2019, 7, 655. [Google Scholar] [CrossRef]
  27. Alberti, G.; Casciola, M.; Costantino, U.; Vivani, R. Layered and Pillared Metal (IV) Phosphates and Phosphonates. Adv. Mater. 1996, 8, 291–303. [Google Scholar] [CrossRef]
  28. Sun, L.; Boo, W.J.; Sue, H.J.; Clearfield, A. Preparation of α-Zirconium Phosphate Nanoplatelets with Wide Variations in Aspect Ratios. New J. Chem. 2007, 31, 39–43. [Google Scholar] [CrossRef]
  29. Liu, Y.; Murata, K.; Inaba, M. Synthesis of Mixed Alcohols from Synthesis Gas over Alkali and Fischer–Tropsch Metals Modified MoS2/Al2O3-montmorillonite Catalysts. React. Kinet. Mech. Catal. 2014, 113, 187–200. [Google Scholar] [CrossRef]
  30. Majhi, D.; Das, K.; Bariki, R.; Sahu, P.; Bhoi, Y.P.; Mishra, B.G. Preparation and Catalytic Application of Sulfonated Polyvinyl Alcohol-Al-pillared α-Zirconium Phosphate (SPV-AAZP) Hybrid Material towards Synthesis of 4,6-Diarypyrimidin-2(1H)-ones. J. Porous Mater. 2020, 27, 355–368. [Google Scholar] [CrossRef]
  31. Jones, D.J.; Leloup, J.M.; Ding, Y.; Roziere, J. Enhancement of the Protonic Conductivity of α-M(IV)(HPO4)2·H2O, M (IV) = Zr, Sn, by Intercalation of the Aluminum Keggin Ion, [Al13O4(OH)24·12H2O ]7+. Solid State Ion. 1993, 61, 117–123. [Google Scholar] [CrossRef]
  32. Liu, Y.; Hanaoka, T.; Miyazawa, T.; Murata, K.; Okabe, K.; Sakanishi, K. Fischer–Tropsch Synthesis in Slurry-phase Reactors over Mn- and Zr-modified Co/SiO2 Catalysts. Fuel Process. Technol. 2009, 90, 901–908. [Google Scholar] [CrossRef]
  33. Pica, M. Zirconium Phosphate Catalysts in the XXI Century: State of the Art from 2010 to Date. Catalysts 2017, 7, 190. [Google Scholar] [CrossRef]
  34. Segawa, K. Structure and Surface Chemistry of Crystalline Zirconium Phosphate Catalysts. Mater. Chem. Phys. 1987, 17, 181–200. [Google Scholar] [CrossRef]
  35. Xu, J.; Gao, Z. Alumina-pillared α-Zirconium Phosphate Prepared by in-situ Polymerization Method. Microporous Mesoporous Mater. 1998, 24, 213–222. [Google Scholar] [CrossRef]
  36. Fu, G.; Nazar, L.F.; Bain, A.D. Aging Processes of Alumina Sol-Gels: Characterization of New Aluminium Polyoxycations by 27Al NMR Spectroscopy. Chem. Mater. 1991, 3, 602–610. [Google Scholar] [CrossRef]
  37. Liu, Y.; Murata, K.; Hanaoka, T.; Inaba, M.; Sakanishi, K. Syntheses of New Peroxo-polyoxometalates Intercalated Layered Double Hydroxides for Propene Epoxidation by Molecular Oxygen in Methanol. J. Catal. 2007, 248, 277–287. [Google Scholar] [CrossRef]
  38. Hoppe, R.; Alberti, G.; Costantino, U.; Dionigi, C.; Schulz-Ekloff, G.; Vivani, R. Intercalation of Dyes in Layered Zirconium Phosphates. 1. Preparation and Spectroscopic Characterization of α-Zirconium Phosphate Crystal Violet Compounds. Langmuir 1997, 13, 7252–7257. [Google Scholar] [CrossRef]
  39. Liu, Y.; Murata, K.; Inaba, M.; Mimura, N. Selective Oxidation of Propylene to Acetone by Molecular Oxygen over Mx/2H5–x[PMo10V2O40]/HMS (M = Cu2+, Co2+, Ni2+). Catal. Commun. 2003, 4, 281–285. [Google Scholar] [CrossRef]
  40. Weitkamp, J. Catalytic Hydrocracking—Mechanisms and Versatility of the Process. ChemCatChem 2012, 4, 292–306. [Google Scholar] [CrossRef]
  41. Li, X.; Jiang, Y.; Zhou, R.; Hou, Z. Layer α-Zirconium Phosphate: An Efficient Catalyst for the Synthesis of Solketal from Glycerol. Appl. Clay Sci. 2019, 174, 120–126. [Google Scholar] [CrossRef]
  42. Shimomura, O.; Sasaki, S.; Kume, K.; Kawano, S.; Shizuma, M.; Ohtaka, A.; Nomura, R. Release Behavior of Benzimidazole-Intercalated α-Zirconium Phosphate as a Latent Thermal Initiator in the Reaction of Epoxy Resin. Catalysts 2019, 9, 69. [Google Scholar] [CrossRef]
  43. Jiménez-Jiménez, J.; Algarra, M.; Guimarães, V.; Bobos, I.; Rodríguez-Castellón, E. The Application of Functionalized Pillared Porous Phosphate Heterostructures for the Removal of Textile Dyes from Wastewater. Materials 2017, 10, 1111. [Google Scholar] [CrossRef]
  44. Babu, B.H.; Lee, M.; Hwang, D.W.; Kim, Y.; Chae, H.J. An Integrated Process for Production of Jet-fuel Range Olefins from Ethylene using Ni-AlSBA-15 and Amberlyst-35 Catalysts. Appl. Catal. A-Gen. 2017, 530, 48–55. [Google Scholar] [CrossRef]
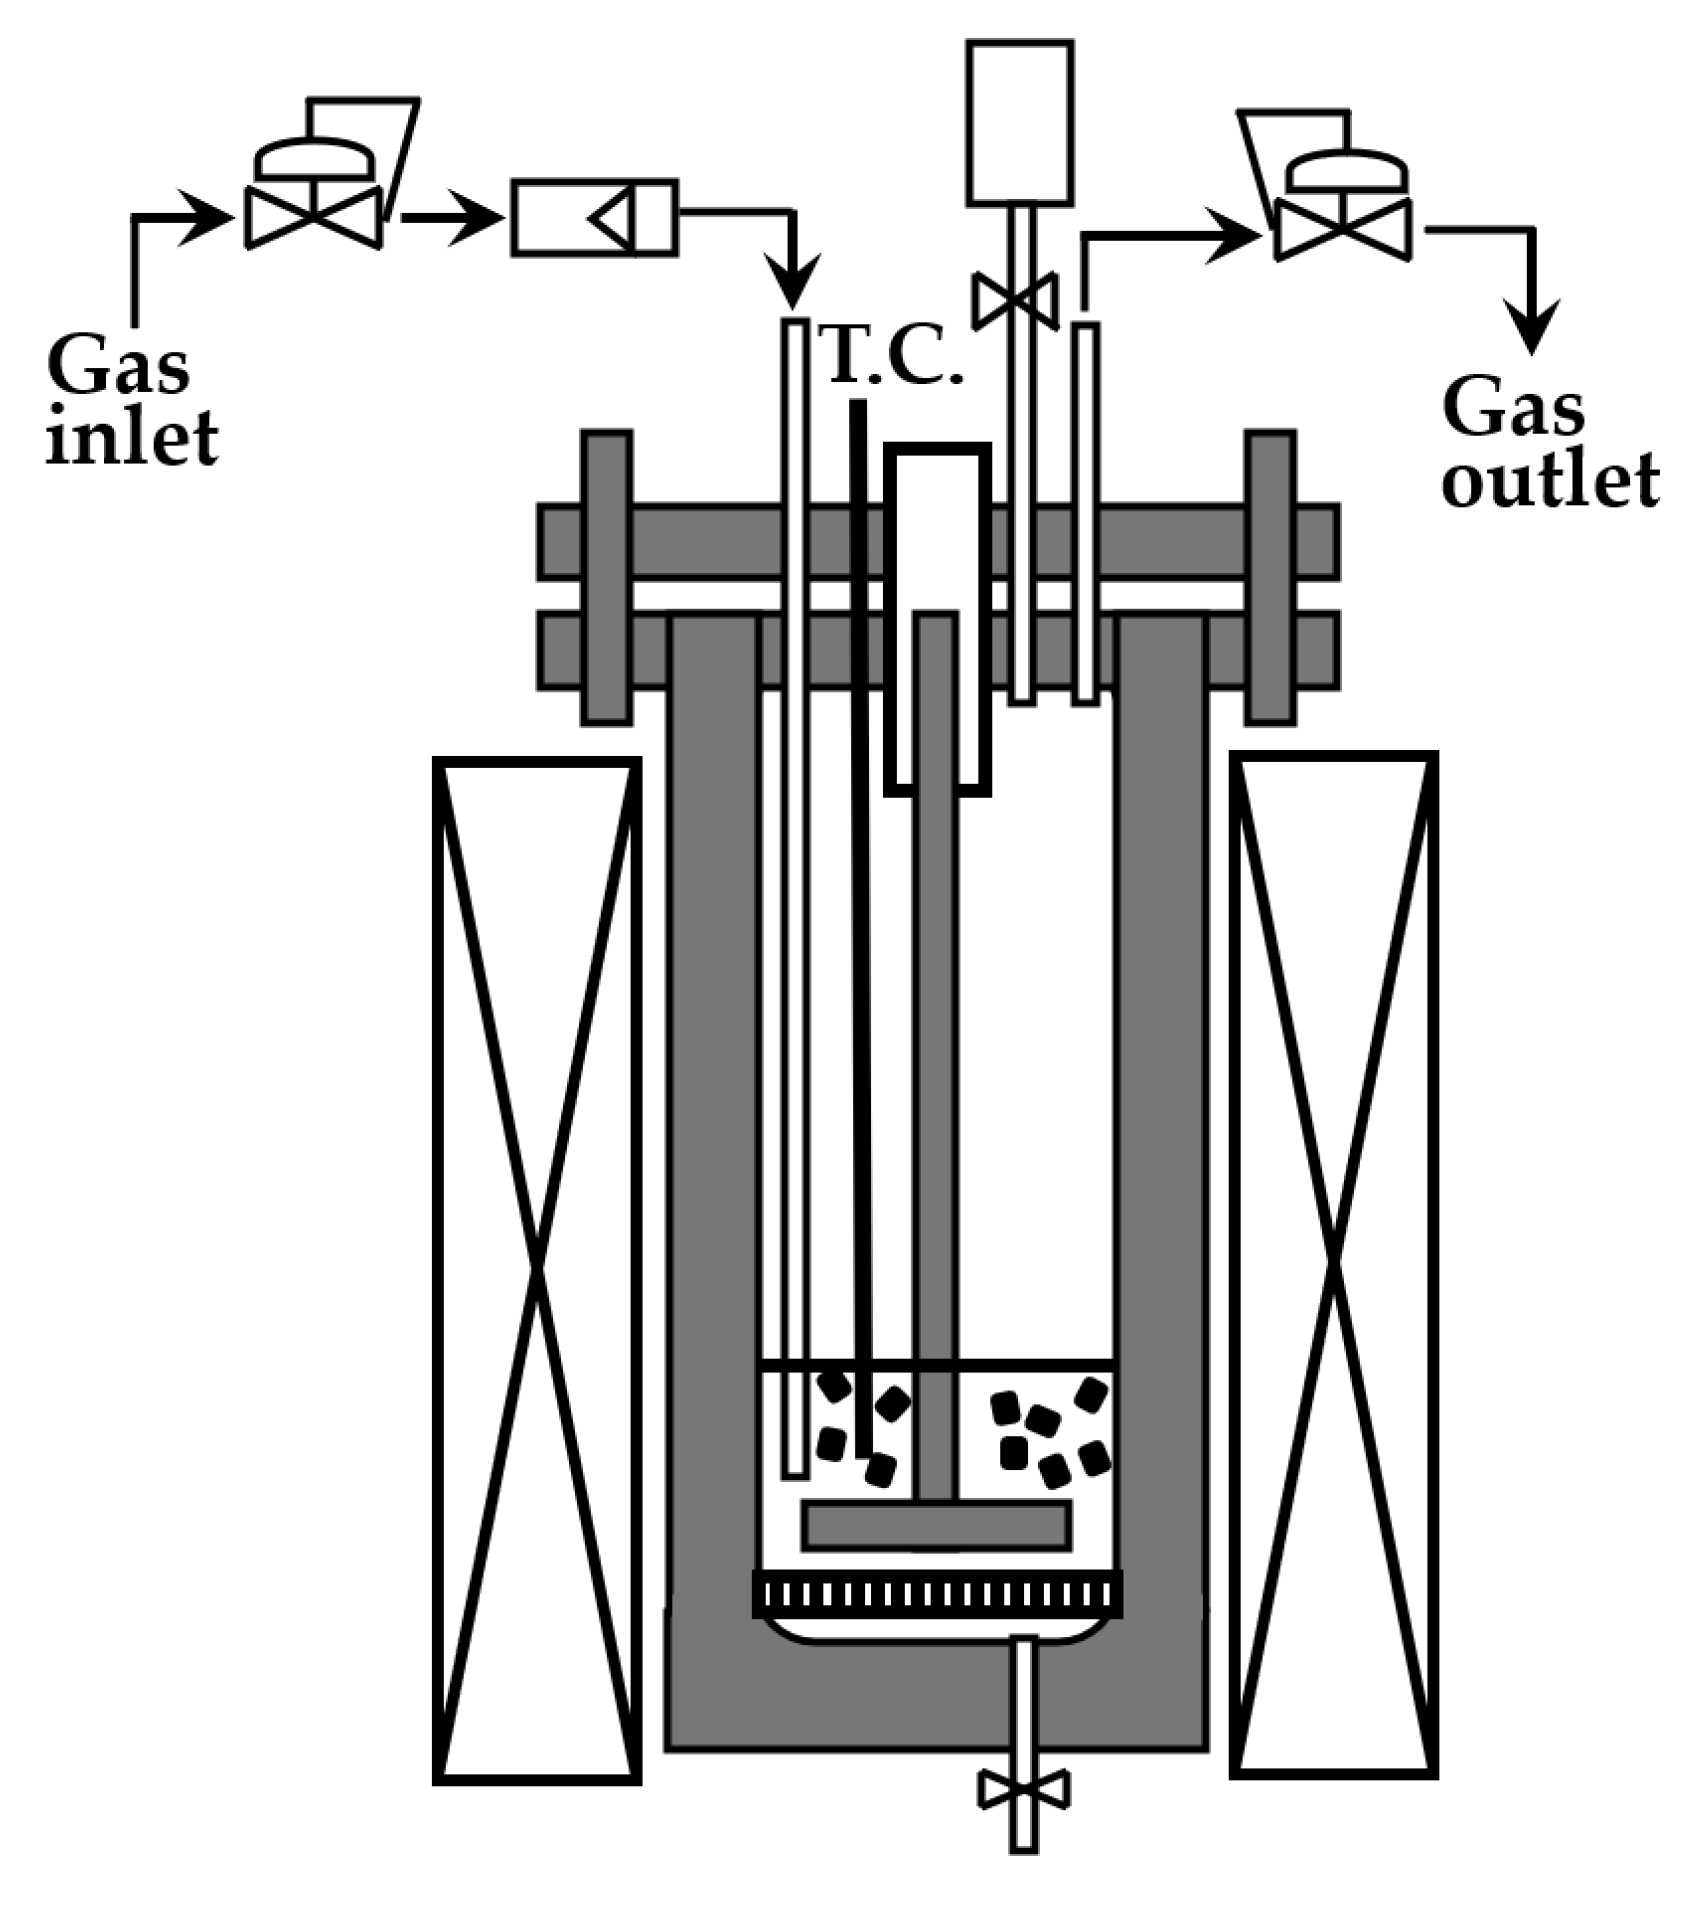
Figure 1. Schematic diagram of the stirred autoclave reaction process used in this study.
Processes 13 03129 g001
Figure 2. XRD patterns of various α-ZrP materials: (A) α-ZrP (dried at 373 K for 10 h); (B) Alpoly-α-ZrP (dried at 373 K for 10 h); (C) Al2O3-α-ZrP (calcined at 673 K for 3 h).
Processes 13 03129 g002
Figure 3. Structural model of the Al polyoxocation-pillared α-ZrP (Alpoly-α-ZrP).
Processes 13 03129 g003
Figure 4. BET surface areas of α-ZrP and Alpoly-α-ZrP after calcination for 3 h at various temperatures (●: α-ZrP; : Alpoly-α-ZrP).
Processes 13 03129 g004
Figure 5. NH3-TPD profiles of various catalyst supports used in this study. A: SiO2; B: α-ZrP; C: Al2O3-α-ZrP; D: H-ZSM-5.
Processes 13 03129 g005
Figure 6. FT-IR spectra of pyridine absorption on α-ZrP and Alpoly-α-ZrP after vacuum exhaust at 423 K for 1 h. a: α-ZrP, b: Alpoly-α-ZrP.
Processes 13 03129 g006
Figure 7. Molecular structures of Bot-oil and its model compound, squalene.
Processes 13 03129 g007
Figure 8. FID-GC charts of liquid products generated from squalene hydrocracking on 1 wt.% Pt/Al2O3-α-ZrP after reacting at 623 K for various durations. Reaction time: 0 h (A), 1 h (B), 2 h (C), and 3 h (D). H2 pressure: 2 MPa; squalene amount: 20 g; catalyst amount: 2 g.
Processes 13 03129 g008
Figure 9. Diagram of squalene hydrocracking on acid catalysts and bifunctional catalysts containing Pt and solid acids.
Processes 13 03129 g009
Figure 10. FID-GC charts of liquid products generated from squalene hydrocracking on 1 wt.% Pt/Al2O3-α-ZrP after reacting at 523 K for various durations. Reaction times: 0 h (A), 0.5 h (B), 1 h (C), and 5 h (D). H2 pressure: 2 MPa; squalene amount: 20 g; catalyst amount: 2 g.
Processes 13 03129 g010
Figure 11. FID-GC charts of the liquid products formed in the squalene hydrocracking on 1 wt.% Pt/Al2O3-α-ZrP in a two-step reaction. The first step at 523 K for 1 h, followed by the second step at 623 K for 0, 1, 2, and 3 h (AD). The first step: reaction at 523 K for 1 h; the second step: reaction at 623 K for various durations. H2 pressure: 2 MPa; squalene amount: 20 g; catalyst amount: 2 g.
Processes 13 03129 g011
Figure 12. FID-GC charts of Bot-oil and liquid products from Bot-oil hydrocracking on 1 wt.% Pt/Al2O3-α-ZrP in a two-step reaction. The first step was at 523 K for 1 h, and the second step was at 623 K for 3 h: (A) Bot-oil-C before reaction; (B) Bot-oil-P before reaction; (C) liquid products from Bot-oil-C hydrocracking; (D) liquid products from Bot-oil-P hydrocracking. H2 pressure: 2 MPa; Bot-oil amount: 20 g; catalyst amount: 2 g.
Processes 13 03129 g012
Table 1. Catalysts and reactors for the hydrocracking of Bot-oil in the literature.
CatalystReactorReaction Temperature (K)H2 Pressure (MPa)Product Yield (%)Reference
GasolineJet FuelDiesel
CoMobatch67320671515[18]
Ru/CeO2batch5136701510[19]
HYFlow5330.18685[20]
Ru/CeO2batch5133.5N.A.4135[21]
PtRe/SiO2–Al2O3batch6035.5175017[22]
NiMo/Claybatch573432525[23]
Pt/Al2O3-α-ZrPbatch623210.666.220.1This study
Table 2. Physical characteristics of α-ZrP and Alpoly-α-ZrP after calcination at various temperatures for 3 h.
SampleTemperature (K)d (002) (Å)BET Surface Area (m2/g)Average Pore Size (Å)Total Vp (cm3/g)Micro Vp (cm3/g)
α-ZrP3737.6227.60.0650.012
5737.4517.30.0780.014
6737.1437.20.0590.011
773310.028
Alpoly-α-ZrP37325.88736.20.2110.136
57325.413834.80.2340.156
67325.314333.60.2510.169
77325.114030.40.2070.132
Table 3. Reaction results of squalene hydrocracking over various catalysts at 623 K for 3 h 1.
CatalystC30H50
Conv. (%)
Yield (%)
C30H62C1–C4C5–C9C10–C15C16–C20C21–C29
Pt/α-ZrP1009.57.248.730.61.70.2
Pt/Al2O3-α-ZrP1000.15.535.652.85.30.2
Al2O3-α-ZrP100044.851.33.400
Pt/SiO210092.43.22.11.20.40.1
Pt/H-ZSM-5100023.849.621.30.20
1 H2 pressure: 2 MPa; squalene amount: 20 g; catalyst amount: 2 g; Pt loading: 1 wt.%.
Table 4. Reaction results of squalene hydrocracking on 1 wt.% Pt/Al2O3-α-ZrP after reacting at 623 K for various durations 1.
Reaction
Time (h)
C30H50
Conv. (%)
Yield (%)C10–C15
/C1–C29
C30H62C1–C4C5–C9C10–C15C16–C20C21–C29
110048.62.316.629.32.90.40.57
21004.75.134.051.14.60.30.54
31000.15.535.652.85.30.20.53
1 H2 pressure: 2 MPa; squalene amount: 20 g; catalyst amount: 2 g.
Table 5. Reaction results of squalene hydrocracking on 1 wt.% Pt/Al2O3-α-ZrP after reacting at 523 K for various durations 1.
Reaction
Time (h)
C30H50
Conv. (%)
Yield (%)C10–C15
/C1–C29
C30H62C1–C4C5–C9C10–C15C16–C20C21–C29
0.551.151.100000
110010000000
510097.40.201.70.600.68
1 H2 pressure: 2 MPa; squalene amount: 20 g; catalyst amount: 2 g.
Table 6. Reaction results of squalene hydrocracking on 1 wt.% Pt/Al2O3-α-ZrP for 5 h at various reaction temperatures 1.
Reaction
Temperature (K)
C30H50
Conv. (%)
Yield (%)C10–C15
/C1–C29
C30H62C1–C4C5–C9C10–C15C16–C20C21–C29
52310097.40.201.70.600.68
5731005.14.636.150.43.50.20.53
62310006.438.950.63.30.10.51
723100010.652.232.51.200.34
1 H2 pressure: 2 MPa; squalene amount: 20 g; catalyst amount: 2 g.
Table 7. Reaction results of squalene hydrocracking on 1 wt.% Pt/Al2O3-α-ZrP in the two-step reaction 1.
Reaction Time in 2nd Step (h)C30H50
Conv. (%)
Yield (%)C10–C15
/C1–C29
C30H62C1–C4C5–C9C10–C15C16–C20C21–C29
110032.51.23.042.819.30.90.64
21004.12.810.162.320.20.30.65
310003.112.465.019.10.20.65
1 The first step: reaction at 523 K for 1 h; the second step: reaction at 623 K for various durations. H2 pressure: 2 MPa; squalene amount: 20 g; catalyst amount: 2 g.
Table 8. Reaction results of Bot-oil hydrocracking on 1 wt.% Pt/Al2O3-α-ZrP in a two-step reaction 1.
Type of Bot-OilConv. (%)Fraction in Total Hydrocarbon Products (%)C10–C15
/C1–C29
C1–C4C5–C9C10–C15C16–C20C21–C29C30+
Bot-oil-C1002.810.666.220.10.300.66
Bot-oil-P1002.910.566.120.20.200.66
1 The first step: reaction at 523 K for 1 h; the second step: reaction at 623 K for 3 h. H2 pressure: 2 MPa; Bot-oil amount: 20 g; catalyst amount: 2 g.
Table 9. Reusability of 1 wt.% Pt/Al2O3-α-ZrP in the two-step hydrocracking of Bot-oil-C 1.
CatalystCycle NumberConversion (%)C10–C15 Fraction in Hydrocarbon Products (%)Carbon Balance
Fresh110066.283.6
Used210066.392.2
310066.193.5
410066.394.1
510066.293.3
1 The first step: reaction at 523 K for 1 h; the second step: reaction at 623 K for 3 h. H2 pressure: 2 MPa; Bot-oil-C amount: 20 g; catalyst amount: 2 g.
Disclaimer/Publisher’s Note: The statements, opinions and data contained in all publications are solely those of the individual author(s) and contributor(s) and not of MDPI and/or the editor(s). MDPI and/or the editor(s) disclaim responsibility for any injury to people or property resulting from any ideas, methods, instructions or products referred to in the content.