Article

Numerical Study on Hydraulic Fracture Propagation in Sand–Coal Interbed Formations

1
CNPC Greatwall Drilling Company Limited, Beijing 100000, China
2
Key Laboratory of Enhanced Oil & Gas Recovery of Ministry of Education, Northeast Petroleum University, Daqing 163318, China
*
Author to whom correspondence should be addressed.
Processes 2025, 13(10), 3128; https://doi.org/10.3390/pr13103128
Submission received: 18 August 2025 / Revised: 22 September 2025 / Accepted: 26 September 2025 / Published: 29 September 2025
(This article belongs to the Section Energy Systems)

Abstract

To investigate hydraulic fracture propagation in multi-layered porous media such as sand–coal interbedded formations, we present a new phase-field-based model. In this formulation, a diffuse fracture is activated only when the local element strain exceeds the rock’s critical strain, and the fracture width is represented by orthogonal components in the x and y directions. Unlike common PFM approaches that map the permeability directly from the damage field, our scheme triggers fractures only beyond a critical strain. It then builds anisotropy via a width-to-element-size weighting with parallel mixing along and series mixing across the fracture. At the element scale, the permeability is constructed as a weighted sum of the initial rock permeability and the fracture permeability, with the weighting coefficients defined as functions of the local width and the element size. Using this model, we examined how the in situ stress contrast, interface strength, Young’s modulus, Poisson’s ratio, and injection rate influence the hydraulic fracture growth in sand–coal interbedded formations. The results indicate that a larger stress contrast, stronger interfaces, a greater stiffness, and higher injection rates increase the likelihood that a hydraulic fracture will cross the interface and penetrate the barrier layer. When propagation is constrained to the interface, the width within the interface segment is markedly smaller than that within the coal-seam segment, and interface-guided growth elevates the fluid pressure inside the fracture.

1. Introduction

China is rich in natural gas reserves in gas-bearing coal formations, which are composed of multiple coal seams and tight sandstones, with an extremely low permeability. To improve the mining efficiency, some researchers have proposed multi-layer fracturing in such reservoirs [1,2,3,4], that is, making hydraulic fractures penetrate multiple layers. However, in multi-layer reservoirs, the mechanical properties and in situ stresses of different layers are different, and the formation interface is a weak structural plane. Therefore, hydraulic fractures may be blocked by the formation interface or propagate along the interface (the geometric morphology of the hydraulic fractures is shown in Figure 1). Thus, understanding how hydraulic fractures propagate in multi-layer reservoirs is helpful for hydraulic fracturing design.
At present, the methods used to study the propagation of hydraulic fractures in multi-layer reservoirs are usually experimental methods and mathematical methods. In experimental studies, Warpinski et al. [5] found that the minimum horizontal stress difference between layers is the main factor affecting the vertical growth of hydraulic fractures in layered rocks, and this conclusion was later confirmed by Teufel and Warpinski [6] and by Teufel and Clark [7]. Recently, researchers [8,9,10,11] have conducted some experimental studies to investigate the effects of in situ stress and obstacle properties on the vertical propagation of hydraulic fractures in coal-bearing formations. Although experimental methods can directly reflect the fracture shape, they still have some limitations, such as the size effect and a high cost. Fortunately, mathematical methods can overcome these limitations.
In recent years, researchers have adopted different mathematical methods to simulate the fracture height growth in multi-layer formations. Zhao and Chen [12] established a judgment criterion using rock fracture mechanics to determine the possible fracture propagation response when hydraulic fractures reach the formation interface. Zhang et al. [13] and Tang et al. [14] used the two-dimensional boundary element method (2D BEM) and the three-dimensional displacement discontinuity method (3D DDM) to respectively study the interaction mechanism between hydraulic fractures and the interface of layered structures. Zhao et al. [12], Guo et al. [15], and Wang et al. [16] used the ABAQUS finite element software to study the propagation of hydraulic fractures in multi-layer reservoirs. Tan et al. [17] used the RFPA2D software to study the effects of in situ stress and interface characteristics on the vertical propagation behavior of hydraulic fractures in layered formations. Abbas et al. [18] used the extended finite element method (XFEM) to study the problem of fracture height growth.
The above-mentioned models encounter some difficulties in dealing with complex fractures, especially when fractures branch. However, this problem can be overcome by the phase-field method (PFM), which was proposed by Bourdin et al. [19], Borden et al. [20], and Miehe et al. [21,22]. In this case, the sharp discontinuity is regularized by the diffusive phase field, so the finite element mesh boundary does not need to coincide with the fracture boundary, and it is easy to simulate complex fracture topologies, including branching and connection [23]. Due to the above advantages, many researchers have adopted the phase-field method to deal with the problem of fracture propagation [24,25,26,27,28,29,30]. Some researchers have established models for hydraulic fracture propagation in porous media based on the phase-field method [28,29,30]. In their studies, the opening direction of the fractures is determined by the gradient of the phase field. The lubrication model and the Darcy model are used to describe the fluid flow in the fracture and the matrix, respectively.
In this paper, a new phase-field model was established to simulate the propagation of hydraulic fractures in multi-layer porous media. The main new points of this study are summarized as follows: (1) The diffusive fracture width of each element is decomposed into the x and y directions, and fractures are formed only when the strain exceeds the critical strain. (2) The permeability of each element is obtained by the weighted sum of the initial rock permeability and the fracture permeability, and the weight coefficients are functions of the fracture width and element size. (3) The initial value of the phase field of the interface element is 0. Based on the proposed new model, we studied the effects of the in situ stress difference, the interface strength, Young’s modulus, Poisson’s ratio, and the injection rate on the propagation of hydraulic fractures in sand-bearing coal interbed formations.
In Table 1, compared with the prevalent PFM (phase-field method) approaches that map the permeability directly from the damage field, our contributions are twofold: (i) a strain-thresholded, direction-wise fracture activation and (ii) an anisotropic permeability tensor built from an aperture-to-element-size weighting, with parallel mixing along, and series mixing across, the fracture.

2. Mathematical Model

2.1. Description of Fractures by Phase-Field Approximation Method

2.1.1. Brief Introduction to Phase-Field Method

The phase-field method is based on the principle of energy Γ minimization, approximating the sharp fracture Γ as the following function Γc(c):
Γ c c = Ω γ c , c d V ,
where γ(c, ∇c) is the fracture surface density, which can also be written as follows:
γ c , c = 1 2 l 0 c 2 + l 0 2 c · c ,
where l0 is the process zone parameter and c is the phase-field value. A schematic diagram of the phase-field method of the figure is shown in Figure 2; c = 1 indicates that the material is completely damaged (black) and c = 0 indicates that the material is intact (white) [35]. For the detailed derivation of Equations (1) and (2), reference can be made to the studies by Miehe et al. [21,22].

2.1.2. Constitutive Energy Function

The total free energy (total pseudo-energy density) per unit volume of a fully saturated porous medium consists of the following three parts:
ψ ε , ζ , c , c = ψ e f f ε + ψ f l u i d ε , ζ + ψ f r a c c , c ,
where Ψeff, Ψfluid, and Ψfrac represent the elastic strain energy, fluid energy, and crack energy densities, respectively.
The elastic strain energy density is divided into tensile and compressive parts, and damage only leads to the degradation of tensile energy. Therefore, the elastic strain energy density can be expressed as follows:
ψ eff ε , c = g c ψ eff + ε + ψ eff ε ,
where
g c = 1 c 2
In the above, g(c) is the degenerate function; ψ eff + is the tensile elastic strain energy; ψ eff is the compressive elastic strain energy; λ is the first Lamé constant; G is the shear modulus; εi (i = 1, 2, 3) are the principal strains; and the step functions are <x>+ = (|x| + x)/2 and <x>− = (|x| − x)/2.
In Equation (3), the contribution of fluid to the total free energy can be expressed as follows [33].
ψ f l u i d ε , ζ = M ζ 1 2 ζ α ε i i ,
where
ζ = P M + α ε ii ,
M = K u K α 2
In the above, M and α are the Biot modulus and Biot coefficient, respectively; ζ is the increment in the fluid volume content; P is the pore fluid pressure; εii is the volumetric strain; Ku is the undrained volume modulus, which can be calculated using Equation (10); and K is the drained volume modulus, which can be calculated using Equation (11).
K u = E 3 1 2 v u ,
K = λ + 2 G 3 ,
where E is Young’s modulus and v u is the undrained Poisson’s ratio.
The contribution of the fracture part to the total free energy in Equation (3) can be calculated using the following formula [21,22]:
ψ f r a c c , c = G c γ c , c = G c 2 l 0 c 2 + l 0 2 c · c ,
where Gc is the Griffith critical fracture energy release rate of the porous medium skeleton.

2.1.3. Phase-Field Evolution

By combining Equations (3)–(12), the total pseudo-energy density Ψ can be obtained, and the evolution of the phase-field variable c can be determined through the variational derivative of Ψ. Under rate-independent conditions, this can be provided by Kuhn Tucker-type equations [28,30]:
c ˙ 0 ; δ c ψ 0 ; c ˙ δ c ψ = 0 ,
yielding
δ c ψ = 2 1 c ψ eff + ε G c l 0 c l 0 2 2 c = 0 ,
Then, the phase-field evolution rule can be rewritten as follows:
G c l 0 c l 0 2 2 c = 2 1 c H x , t ,
Among them, H(x, t) is the historical strain energy function, which can be defined as follows:
H x , t = max t 0 , T ψ eff + x , t ,
where H(x, t) is the strain energy history function.
The phase-field evolution formula (15) must also satisfy a set of boundary conditions, which can be defined as follows:
c = 1 on Γ 0 c · n = 0 on Ω ,
The first term in Equation (17) represents the Dirichlet condition c = 1 applied to the initial crack surface Γ0, and the second term represents the Neumann condition applied to the boundary of the computational domain.

2.2. Stress Balance Equation

In the absence of inertia and body forces, the law of macroscopic force equilibrium can be expressed as follows:
· σ = 0 ,
where σ is the total damaged stress tensor.
According to seepage mechanics theory [36,37], for completely saturated porous media, the relationship between the total damaged stress σ, the damaged effective stress σ eff, and the pore fluid pressure P can be expressed as follows:
σ = σ eff α I P ,
where
σ eff = ψ eff ε , c ε = g c ψ eff + ε ε + ψ eff ε ε = g c σ eff + + σ eff ,
where I is a second-order unit tensor and σ+eff and σeff are the tensile stress and compressive stress, respectively.
Substituting Equations (19) and (20) into Equation (18) yields the following:
· σ = · g c σ eff + + σ eff α I P = 0 ,
Equation (21) needs to be combined with the corresponding boundary conditions, as shown below:
u = u ˜ on Ω u σ · n = t on Ω t ,
The first term of Equation (22) represents the displacement applied at the Dirichlet boundary, while the second term of Equation (22) represents the stress applied at the Neumann boundary. The relationship among the domain total boundary, Dirichlet boundary, and Neumann boundary is as follows:
Ω = Ω u Ω t Ω u Ω t = ,

2.3. Control Equations for Fluid Flow

In porous media, the continuity equation for fluid flow can be expressed as follows [38]:
ζ t + · v = 0 ,
where t is time and v is the fluid flow velocity, which can be calculated using the following formula:
v = k μ P ,
Substituting Equations (8) and (25) into Equation (24) allows us to rewrite the fluid flow continuity equation as follows:
t P M + α ε i i · k μ P = 0 ,
The solution of the continuity equation for fluid flow requires the addition of the following boundary conditions:
p = p ˜ on Ω p k μ P · n = q on Ω q ,
Among them, ǝΩ is the total boundary and ǝΩp and ǝΩq are the Dirichlet boundary and Neumann boundary, respectively. The relationship among the total boundary, Dirichlet boundary, and Neumann boundary is as follows:
Ω = Ω p Ω q Ω p Ω q = ,
In Equations (26) and (27), μ denotes the fluid viscosity and k denotes the anisotropic permeability tensor. In two dimensions, the anisotropic permeability tensor can be expressed as follows:
k = k x 0 0 k y ,
Among them, kx and ky are the permeability in the x and y directions, respectively, both of which are composed of the initial permeability of the rock and the fracture permeability:
k x = k f x W x + 1 W x k 0 x k y = k f y W y + 1 W y k 0 y ,
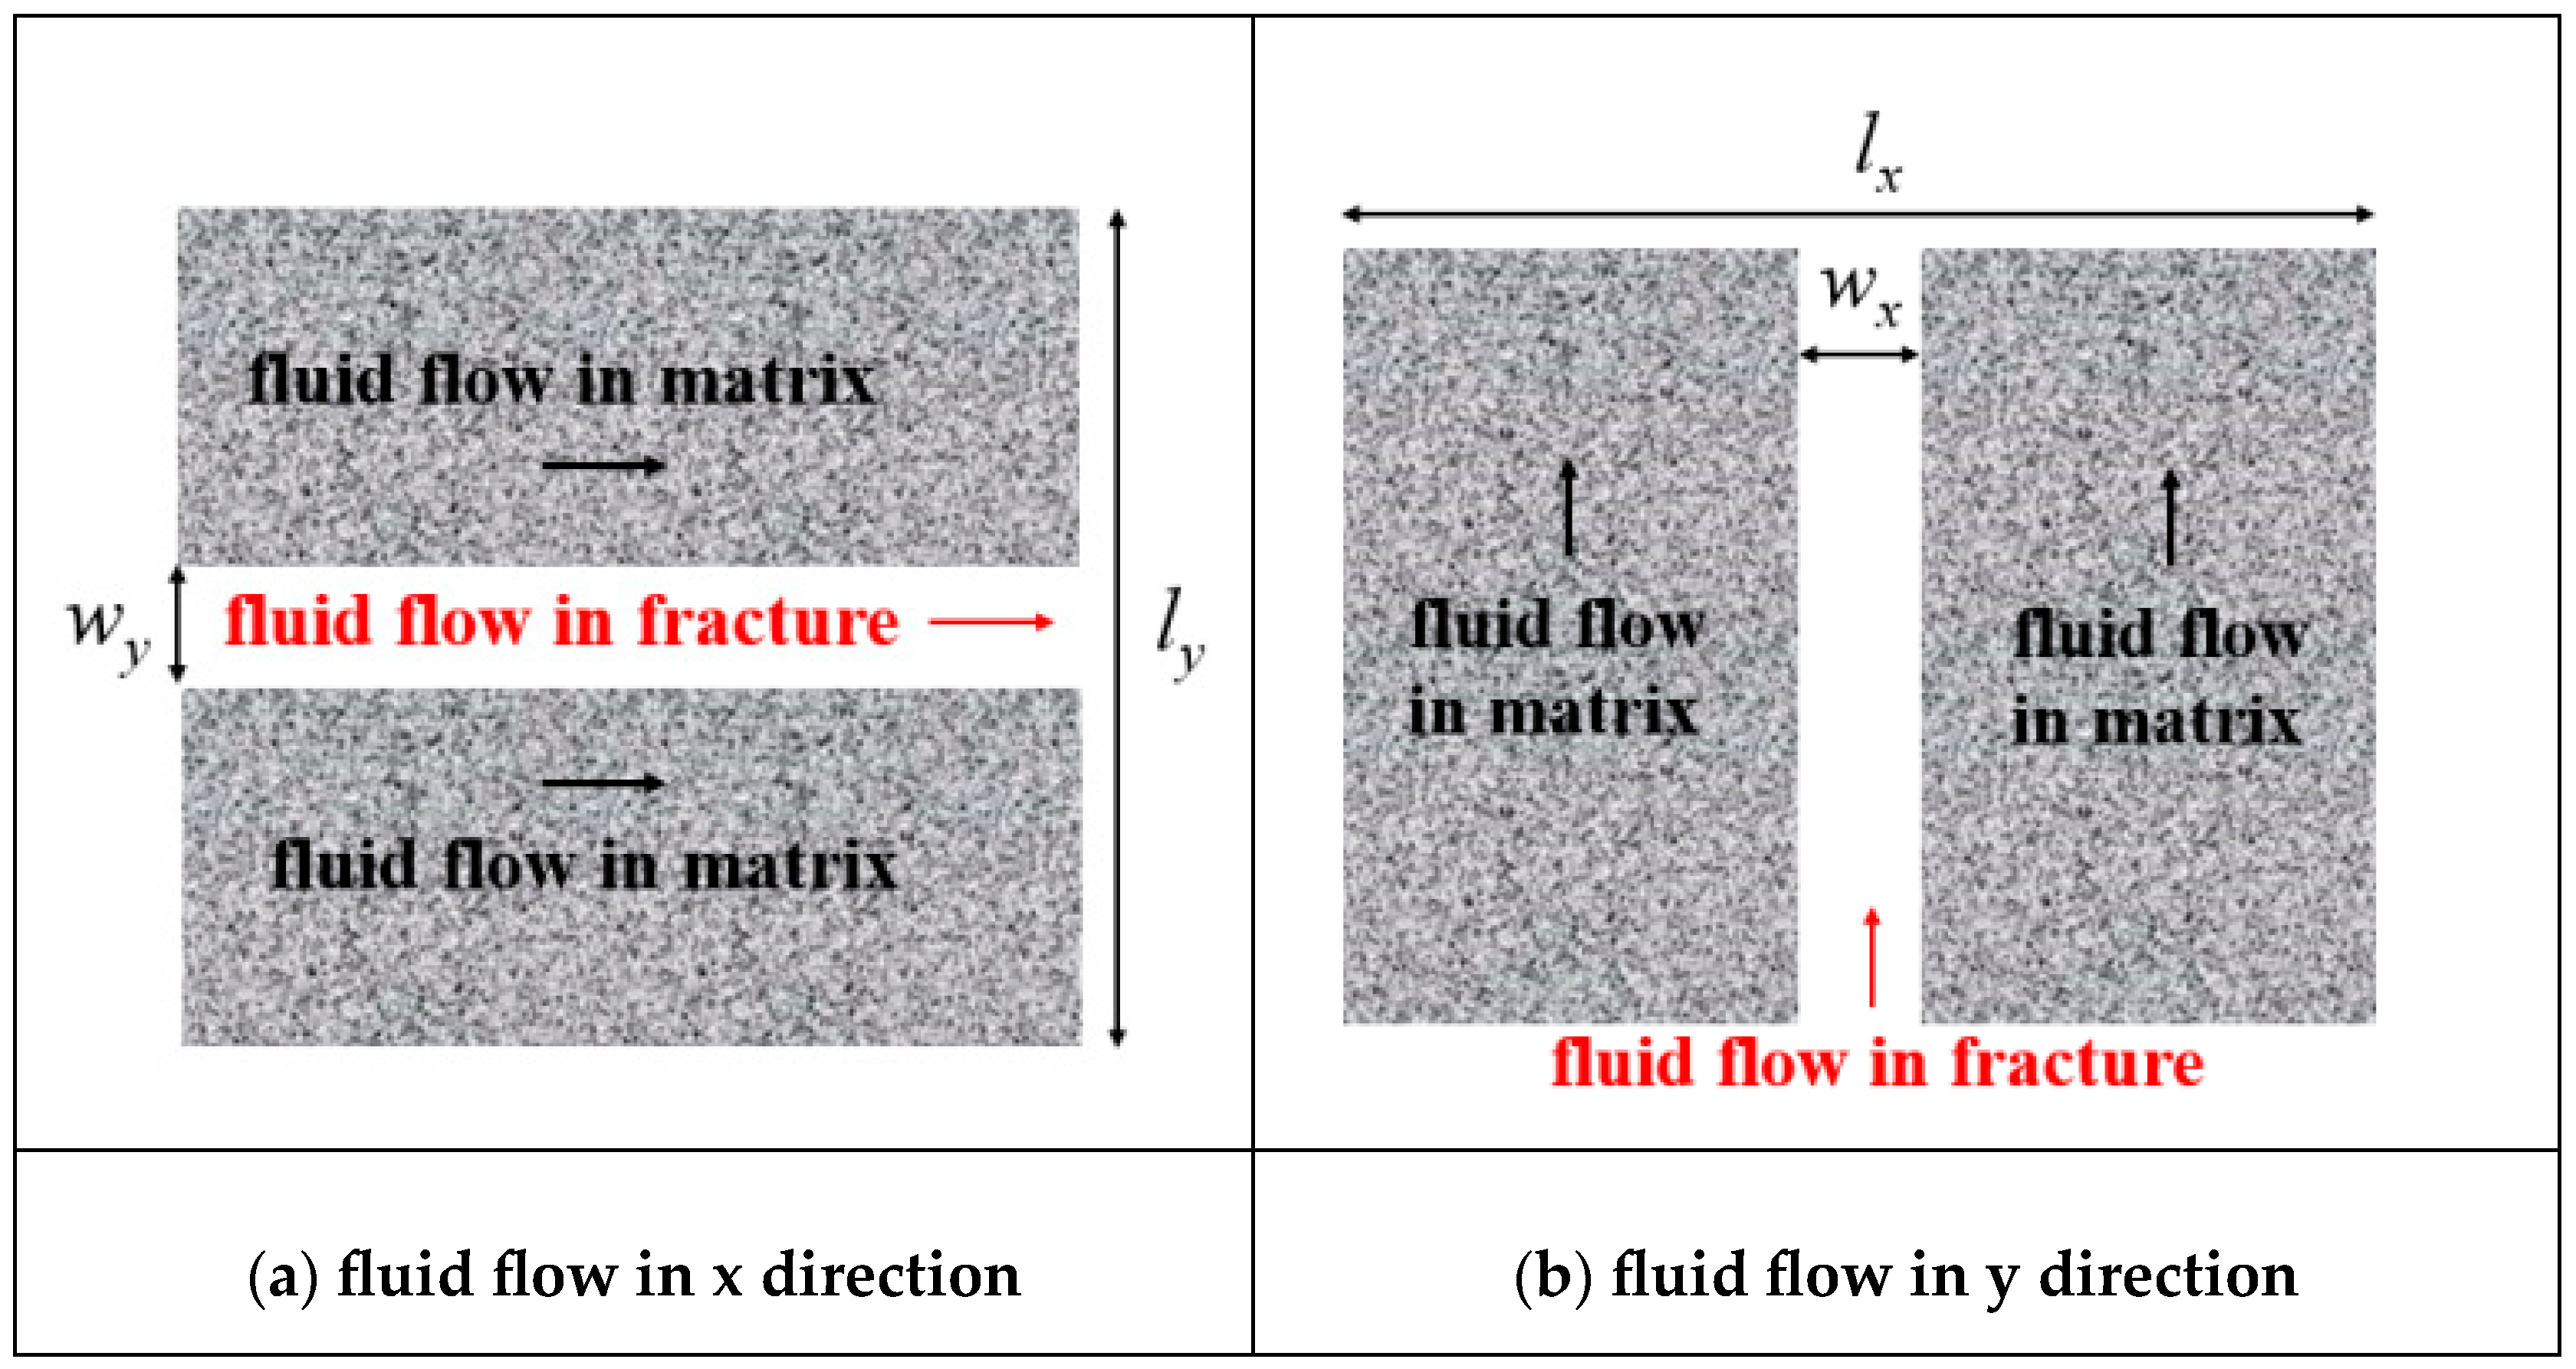
Among these, k0 denotes the isotropic intrinsic permeability of the unfractured matrix (units of permeability). The initial permeability tensor is, therefore, kfx and kfy, which are the fracture permeabilities in the x and y directions, respectively, and which can be calculated using Equation (31). Wx and Wy are the weighted coefficients, representing the contribution of fracture permeability to the element permeability in the x and y directions, respectively. In this study, the weighted coefficients were equal to the ratio of the fracture width to the element length. A schematic diagram of the anisotropic fluid flow in each unit is shown in Figure 3, and the fluid flow can be calculated using Equation (32).
k f x = w y 2 12 η , k f y = w x 2 12 η ,
W x = w y l y , W y = w x l x ,
In Equations (31) and (32), η is the crack shape parameter and wx and wy are the diffusion crack widths in the x and y directions for each element, respectively. It should be noted that, in the phase-field method, the diffusion crack width is defined for all elements, whereas in this study, we assumed that cracks only form in elements when the strain exceeds the critical strain. Therefore, the crack width can be calculated using Equation (33).
w x = ε x ε c + l x , w y = ε y ε c + l y ,
Among them, lx and ly are the lengths of the elements in the x and y directions, respectively; εx and εy are the strains in the x and y directions, respectively; and εc is the critical strain, which can be calculated using Formula (34) according to the research by Borden [20] et al. to obtain the corresponding critical strain and stress values.
σ c = 9 16 E G c 6 l 0 , ε c = G c 6 l 0 E ,

2.4. Numerical Implementation

Equations (15), (21) and (26) above result in a nonlinear system of equations that are mutually coupled. However, to simplify the complexity of the solution, the fracture phase field is fixed at each iteration step. Therefore, the coupled stress balance in Equation (21) and the fluid flow continuity in Equation (26) are solved using the Newton–Raphson (NR) method. The weak form of the residuals of the equilibrium equations and the fluid flow continuity equations is obtained by multiplying the strong forms of Equations (21) and (26) by the test functions wu and wp, integrating the resulting expressions over the problem domain, and then applying the divergence theorem along with the boundary condition in Equations (22) and (27), yielding the following:
R u = Ω w u T · 1 c 2 σ eff + + σ eff α I P d Ω Γ u t w u T · t d Γ = 0 ,
R p = Ω w p T 1 M P t + α ε i i t d Ω + Ω w p T k μ P d Ω Γ p q w p T q d Γ = 0 ,
Similarly, the weak form of the phase-field evolution equation can be obtained by multiplying the strong form of Equation (15) by the test function wc, integrating the resulting expression over the problem domain, and then using the divergence theorem and boundary condition in Equation (17) to obtain the following:
Ω w c T G c l 0 + 2 H c + G c l 0 w c T · c d Ω = Ω 2 w c T H d Ω ,
For each unit, the approximate displacement, the pressure, the phase field, and its gradient are given by the following equations:
u = N u u h , w u = N u w u h , P = N P P h , w P = N P w P h , c = N c c h , w c = N c w c h ,
ε = B u u h , ε i i = B u v o l u h , P = B P P h , c = B c c h , w u = B u w u h , w P = B P w P h , w c = B c w c h ,
In this context, the superscript h denotes the value at the node; Nu, NP, and Nc are the shape functions for the displacement, pressure, and phase field, respectively, with all three shape functions employing bilinear functions based on four-node rectangular elements; Bu, BP, and Bc are the derivatives of the shape functions for the displacement, pressure, and phase field, respectively; and Buvol is the derivative of Nu used to calculate the volume strain εii.
Substituting Equations (38) and (39) into Equations (35)–(37) and using the Voigt representation yields the following:
R u = Ω B u T 1 N c c h 2 σ eff + ε + σ eff ε B u u h d Ω Ω B u T α I N P P h d Ω Γ u t N u T t d Γ = 0 ,
R p = Ω N P T N P M P h t + α B u v o l u h t d Ω + Ω B P T k μ B P P h d Ω Γ p q N P T q d Γ = 0 ,
Ω N c T G c l 0 + 2 H N c c h + G c l 0 B c T B c c h d Ω = Ω 2 N c T H d Ω ,
Adopting a backward Euler scheme to interpolate the time derivative in Equation (41) resulted in the following:
P h t = P n + 1 h P n h Δ t ,
u h t = u n + 1 h u n h Δ t ,
For notational convenience, the subscripts of all the functions in Equation (43) evaluated at the n + 1 time step were removed; therefore, Equation (41) can be rewritten as follows:
R p = Ω N P T N P M P h + α B u v o l u h d Ω + Ω B P T k μ B P P h Δ t d Ω Γ p q N P T q Δ t d Γ Ω N P T N P M P n h + α B u v o l u n h d Ω ,
In this study, the Newton–Raphson method was used to solve the coupled nonlinear Equations (40) and (44). Therefore, at the equilibrium iteration step i, the linearized system was obtained by discretizing the residual Equations (40) and (44) as follows:
J u u J u p J p u J p p i δ u h δ P h + R u R p i = 0 ,
In Equation (45), the Jacobian matrix J is expressed as follows:
J u u = R u u = Ω B u T 1 N c c h 2 σ eff + ε + σ eff ε B u d Ω ,
J u p = R u p = Ω B u T α I N P d Ω ,
J p u = R p u = Ω N P T α B u v o l d Ω ,
J p p = R p p = Ω N P T N P M d Ω + Ω B P T k μ B P Δ t d Ω ,
Since the displacement increment δuh and pressure increment δPh are known, the correction of the displacement and pressure in iteration step i + 1 can be expressed as follows:
u i + 1 h = u i h + δ u h , P i + 1 h = P i h + δ P h ,
Then, the strain energy history function H(x, t) can be obtained in the i + 1 iteration step. The phase field can be calculated using the following discrete system:
K c c i + 1 h = f c ,
where
K c = Ω N c T G c l 0 + 2 H i + 1 N c + G c l 0 B c T B c d Ω ,
f c = Ω 2 N c T H i + 1 d Ω ,
At each time step, the solution can only move to the next time step when the displacement, pressure, and phase field all satisfy the following convergence conditions.
R u t o l R u 0 , R p t o l R p 0 , c i + 1 c i t o l R c 0 ,
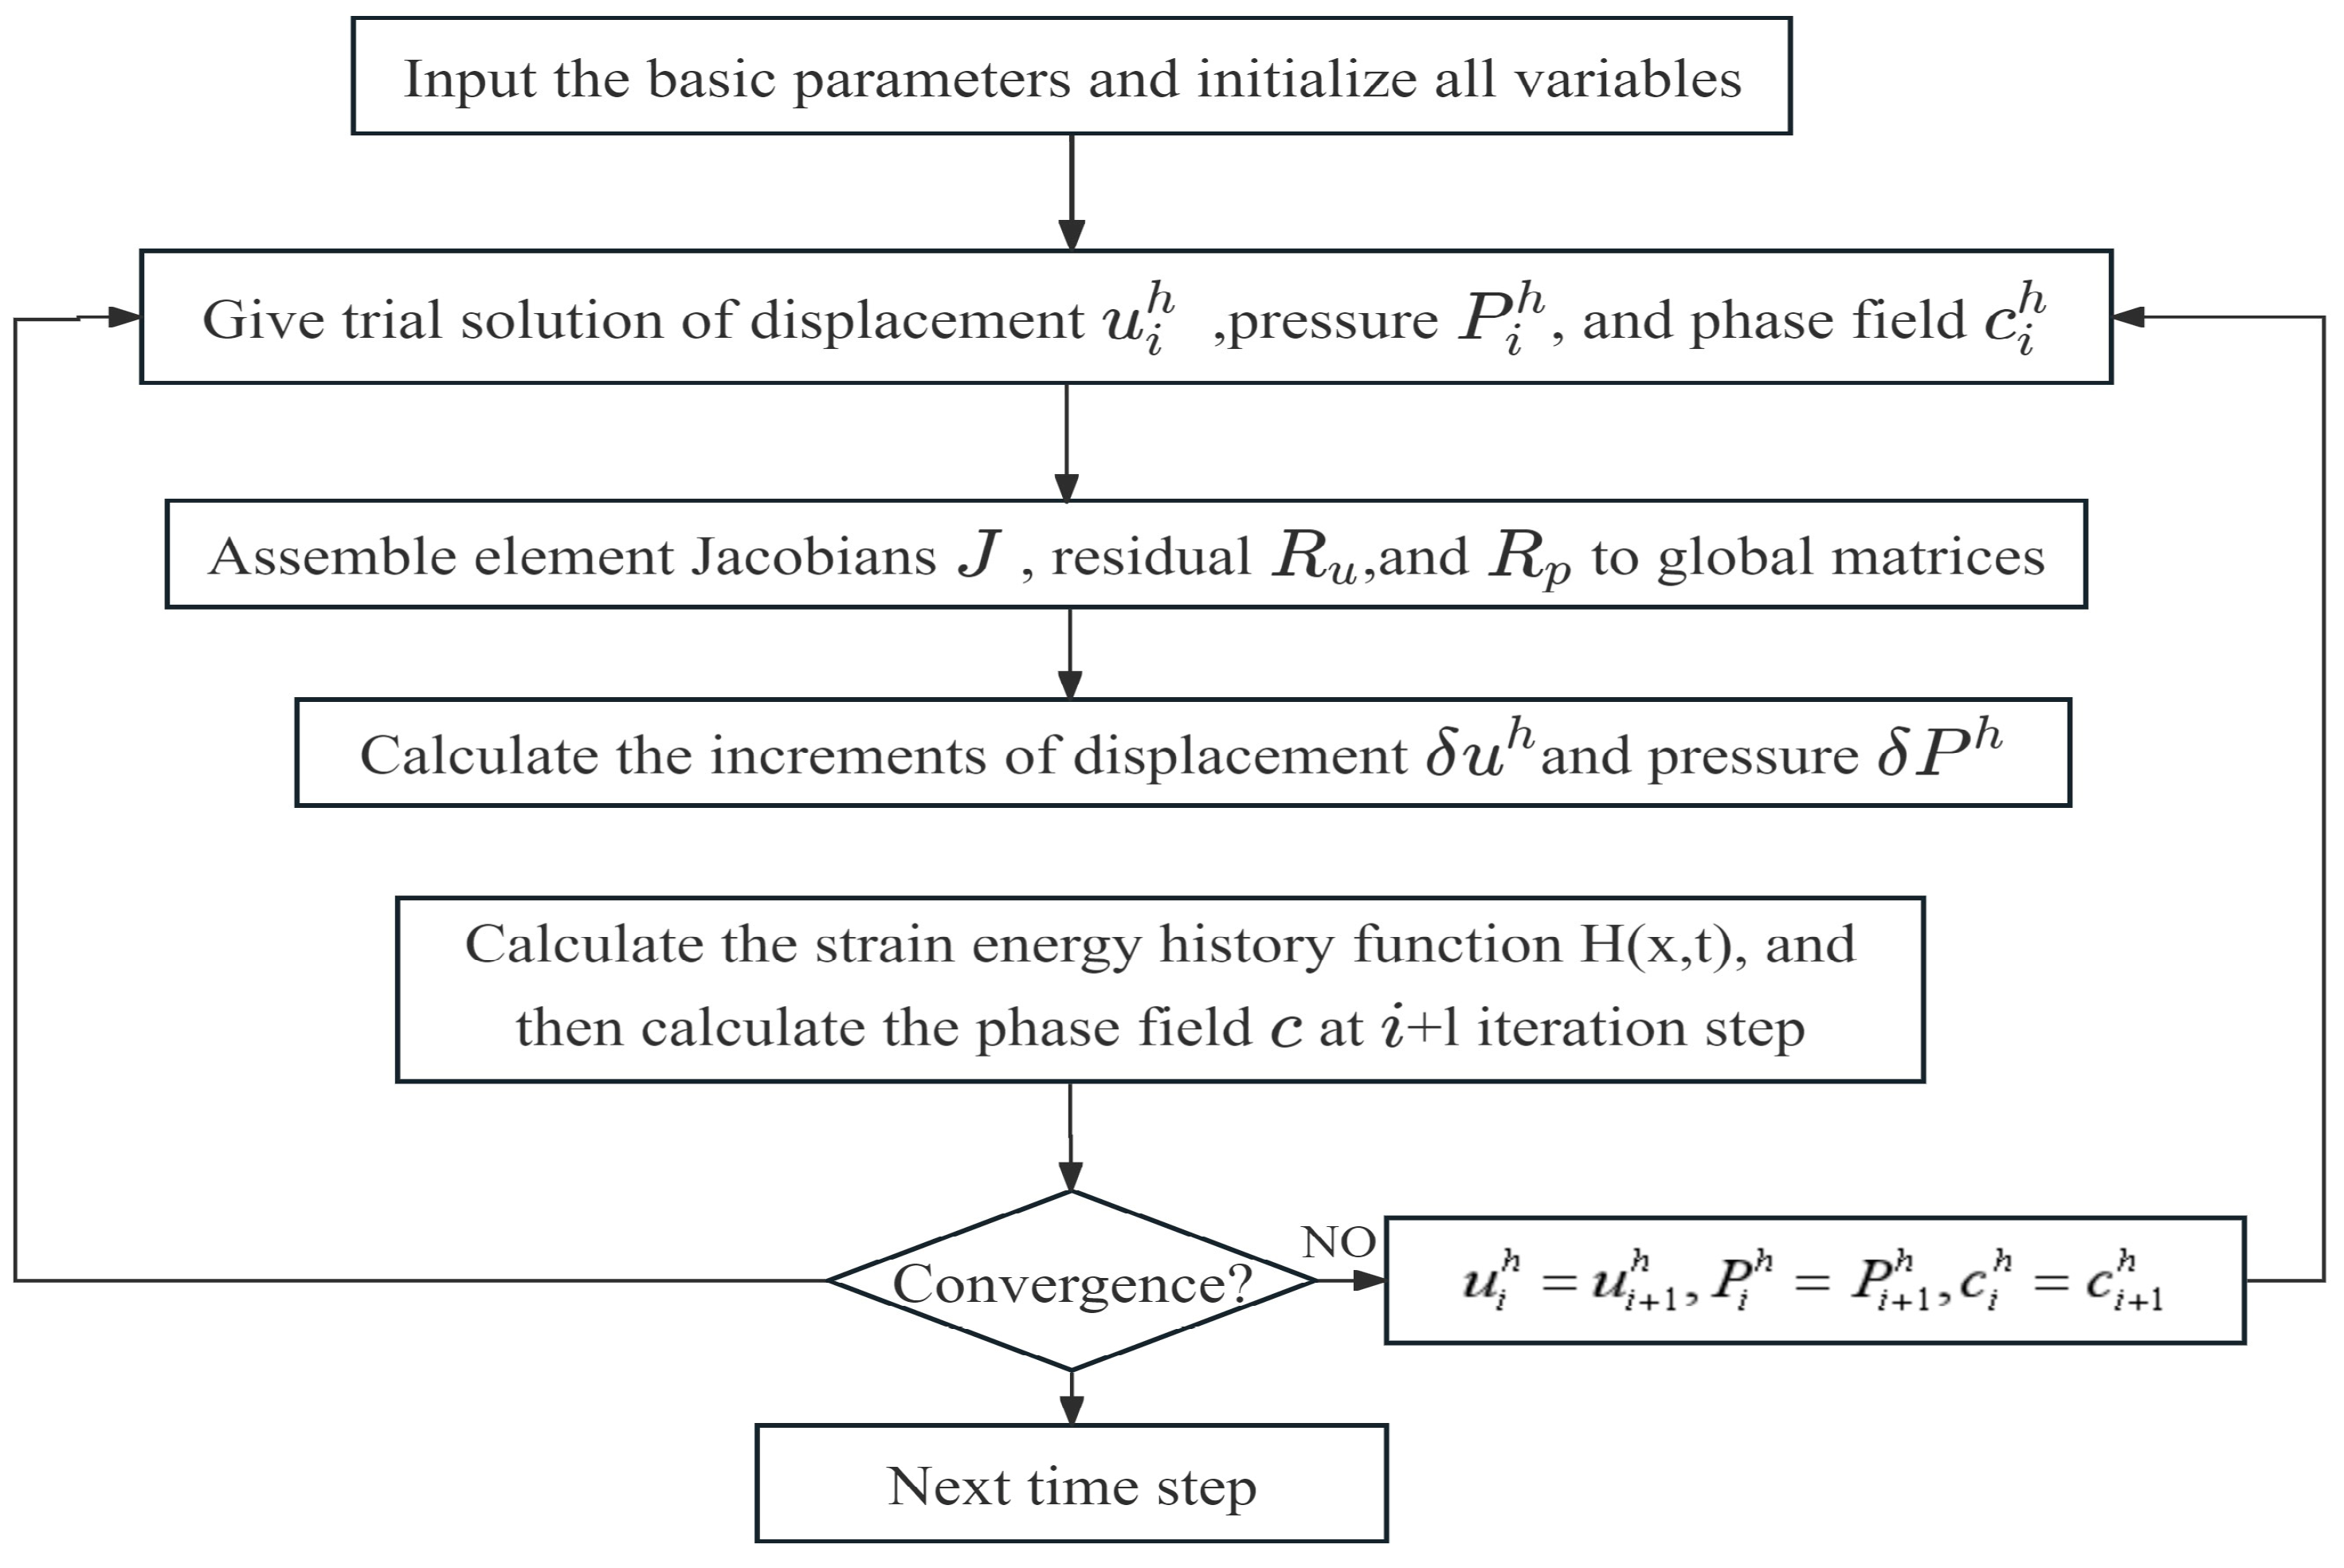
See Figure 4 below for detailed solution steps.

3. Study on Model Convergence and Stability

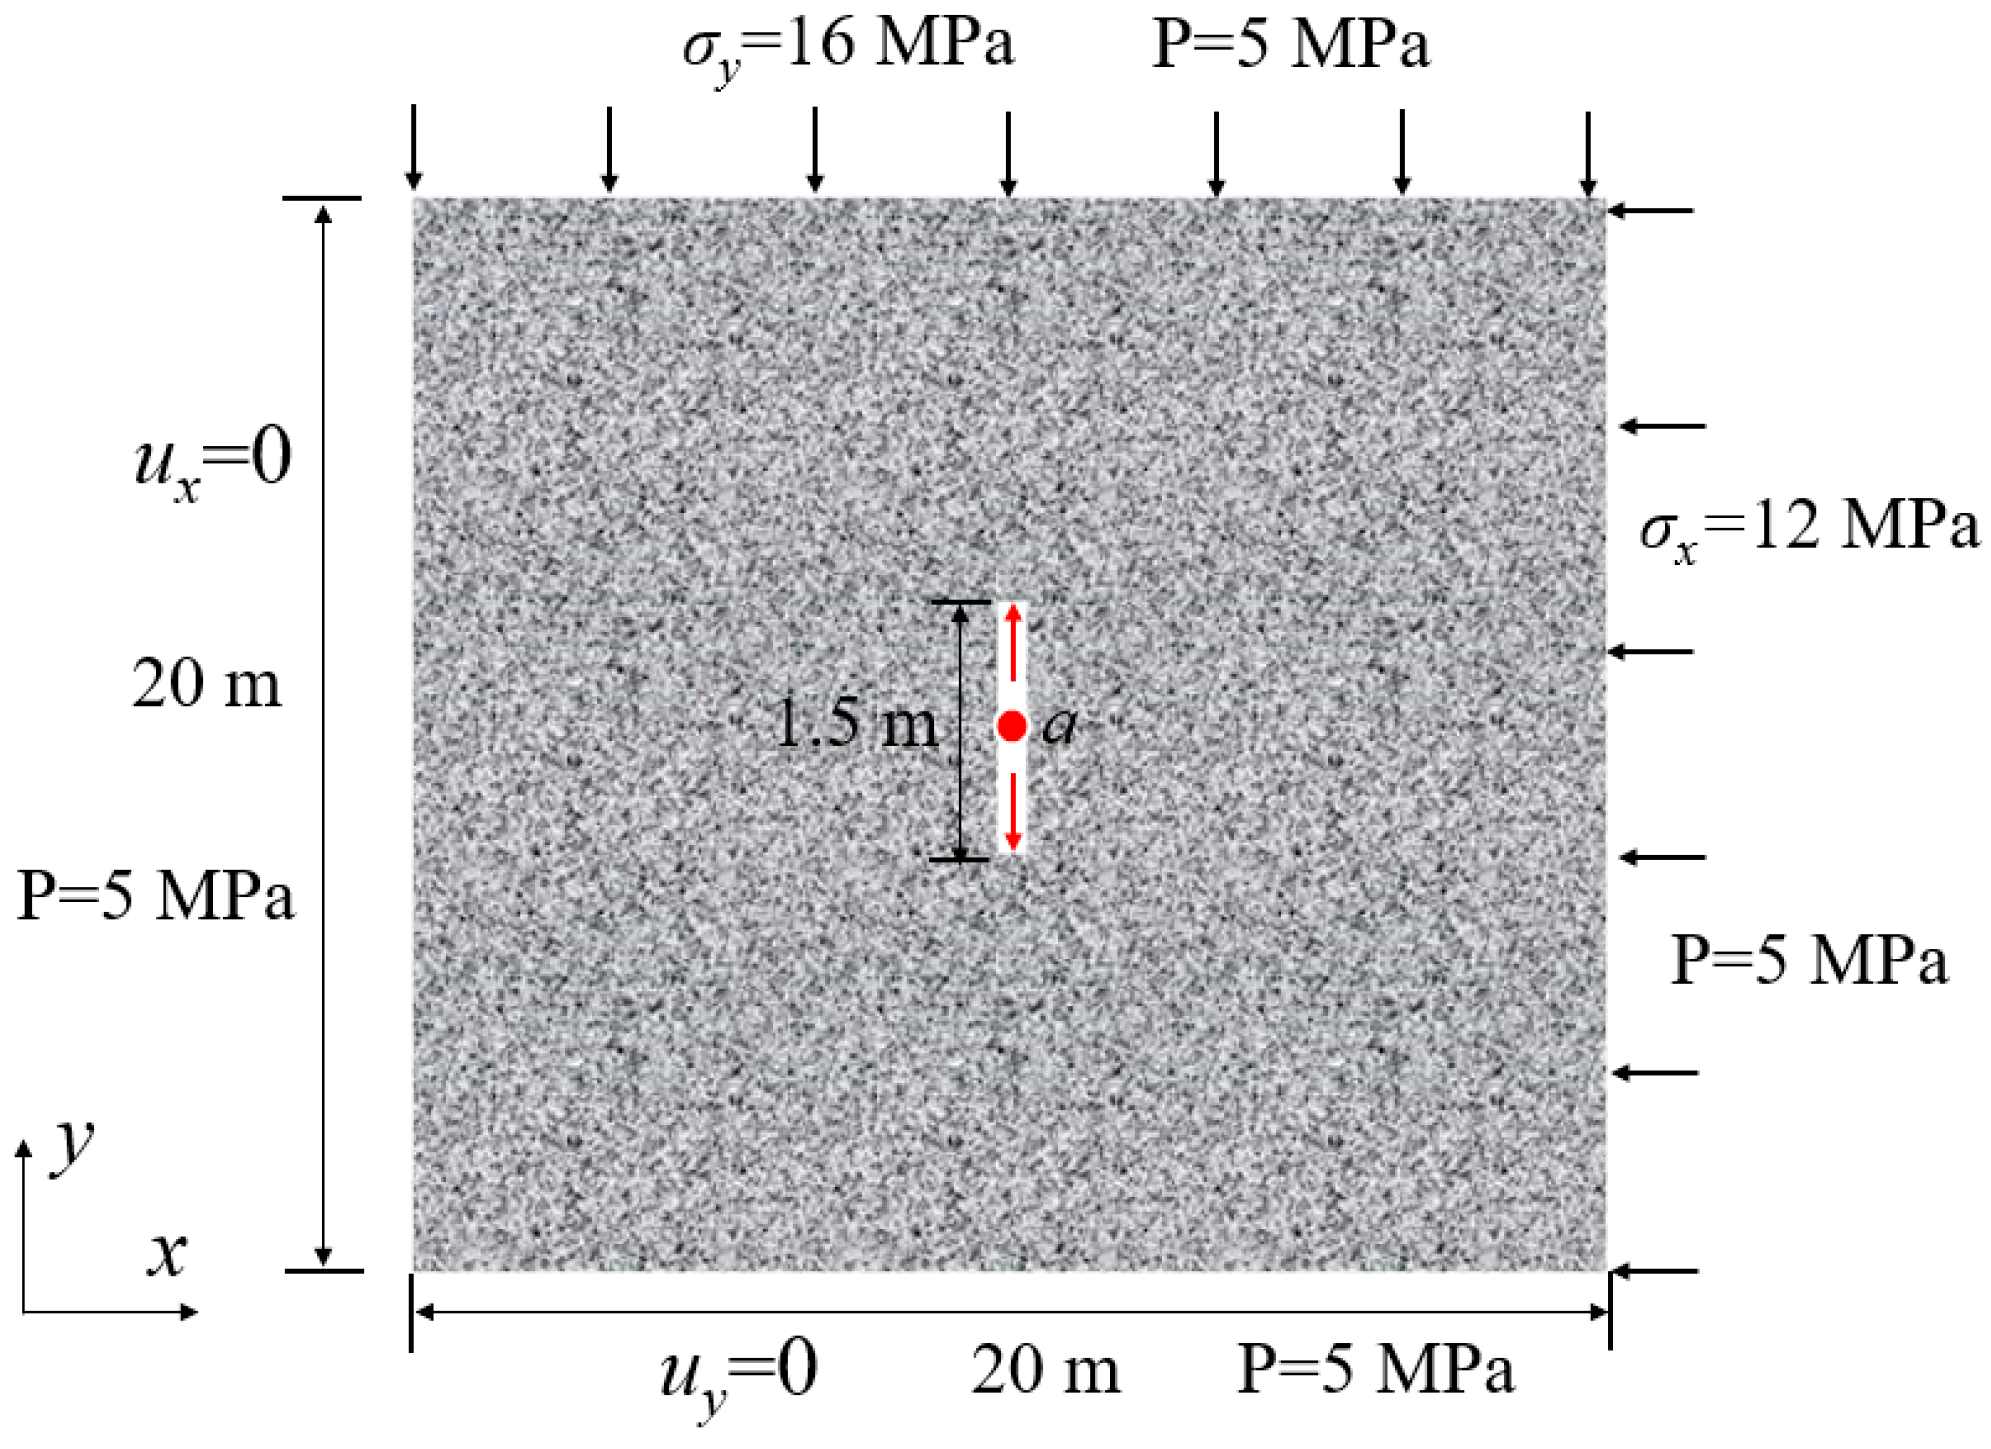
To verify the convergence and stability of our model, this section compares three different time step scenarios. As shown in Figure 5, the region was a square with a side length and width of 20 m, with an initial crack of 1.5 m in length at its center. The three different time steps were 6 s, 4.5 s, and 3 s. The displacement of the left boundary was fixed in the x direction, and the displacement of the bottom boundary was fixed in the y direction. A compressive stress of 12 MPa was applied to the right boundary in the x direction, and a compressive stress of 16 MPa was applied to the upper boundary in the y direction. The initial pore fluid pressure [33] and the fluid pressure at the outer boundaries were both set to 5 MPa. Fluid was injected at a constant velocity of 2.5 × 10⁻³ m2/s from the center, with a total injection time of 36 s. The process zone parameter l0 was set to 0.5 m, and the grid size he was 0.25 m. The reservoir parameters for the simulation are listed in Table 2.
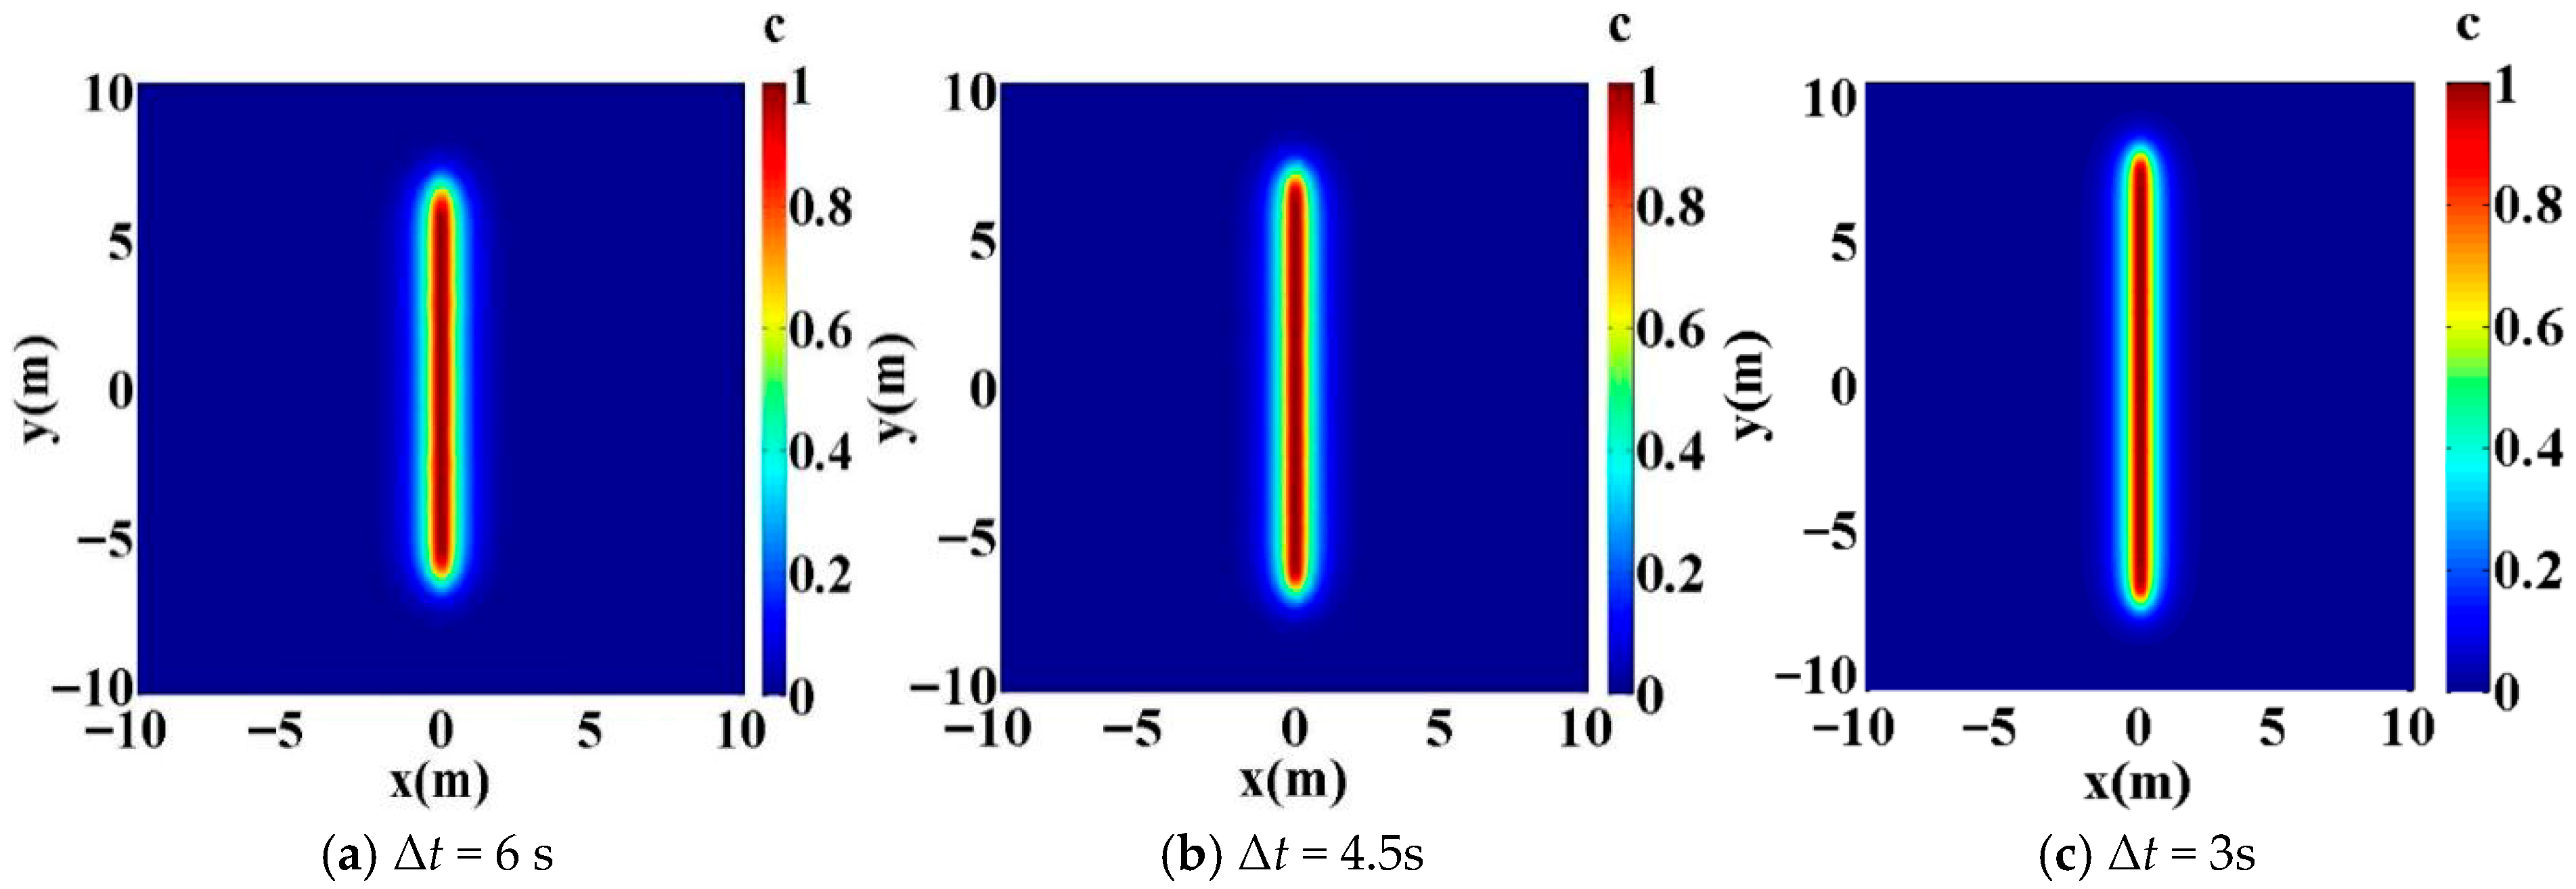
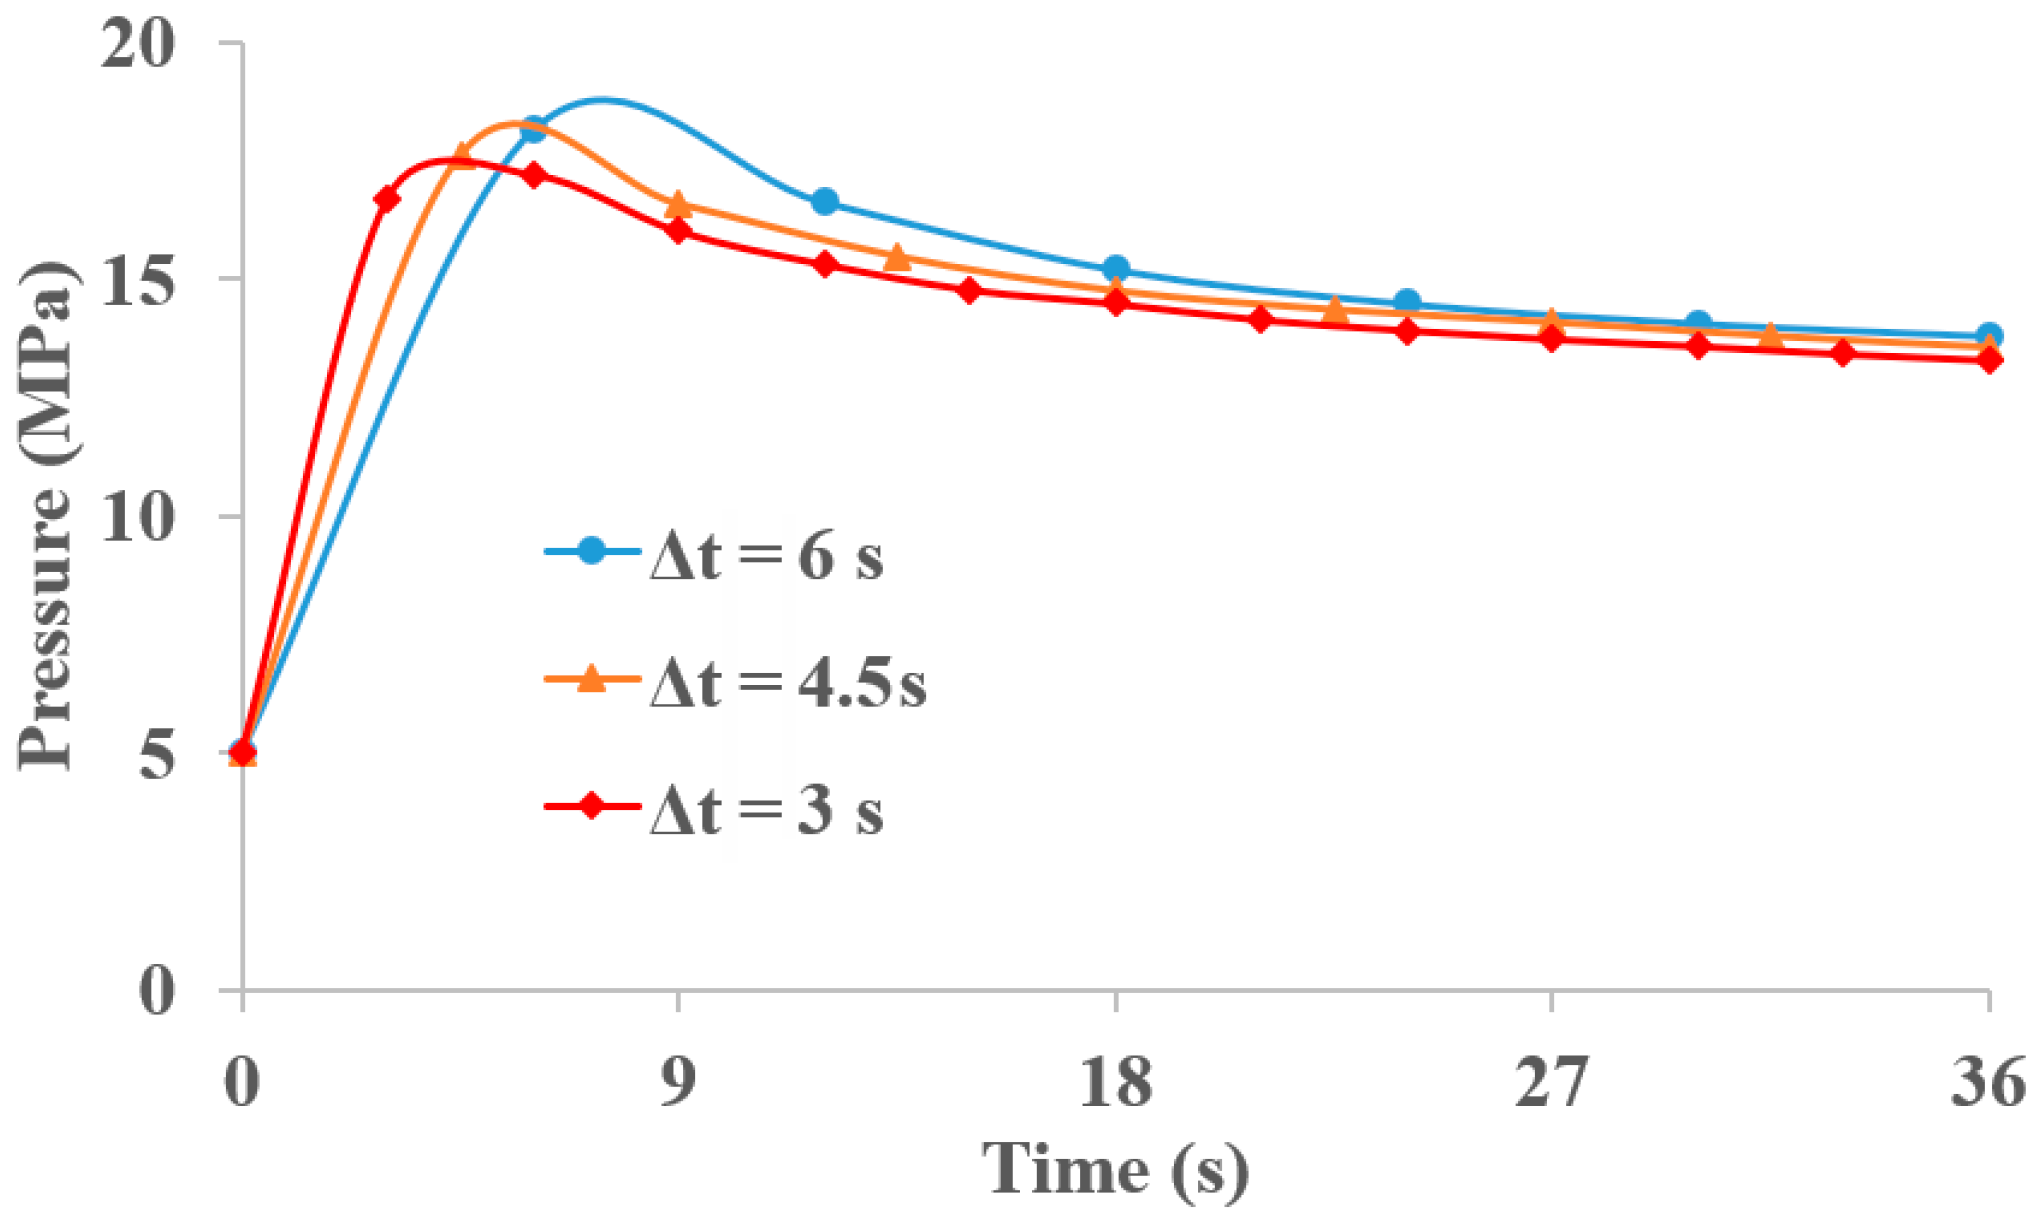
Figure 6 shows the phase-field distribution contour plots at the end of injection for three different time step lengths. It can be seen that the phase-field distribution contours for the three different time step lengths were almost identical, with the phase field primarily evolving along the y direction. For a clearer comparison, Figure 7 plots the pressure variation over time at point a (see Figure 5), with results for the three different time step lengths compared. It can be seen that, during the initial stage of injection, there were significant differences in the pressure at point a under the three different time step conditions. However, after the injection time exceeded 9 s, the pressure differences gradually decreased, and by the end of injection, the relative error was only 1.6%. These results validate the convergence and stability of our model.
Published true-triaxial hydraulic-fracturing experiments on tight sandstone have consistently reported a characteristic pressure–time evolution comprising (i) a rapid ramp-up to breakdown, (ii) a sharp drop at fracture initiation, and (iii) a gradual decline during stable propagation. These features have been documented for both slickwater and supercritical-CO2 injections and are largely insensitive to the specimen size or bedding angle (She et al. [39]; Wu et al. [40]). Our simulated pressure history at point a (Figure 7) reproduced this three-stage profile: a single dominant peak followed by post-peak relaxation and a near-steady tail, consistent with the laboratory observations.
We further compared the simulated pressure response with a published fracturing construction curve from a tight-sandstone gas reservoir in China (Su et al. [41]). The field record reported treating pressure together with slurry rate and proppant concentration, and it exhibited the standard sequence during a single treatment: (i) an early ramp-up to breakdown, (ii) a sharp pressure drop upon fracture initiation, and (iii) a quasi-steady propagation plateau with superposed “humps’’ associated with rate/proppant-schedule changes.

4. Numerical Simulation

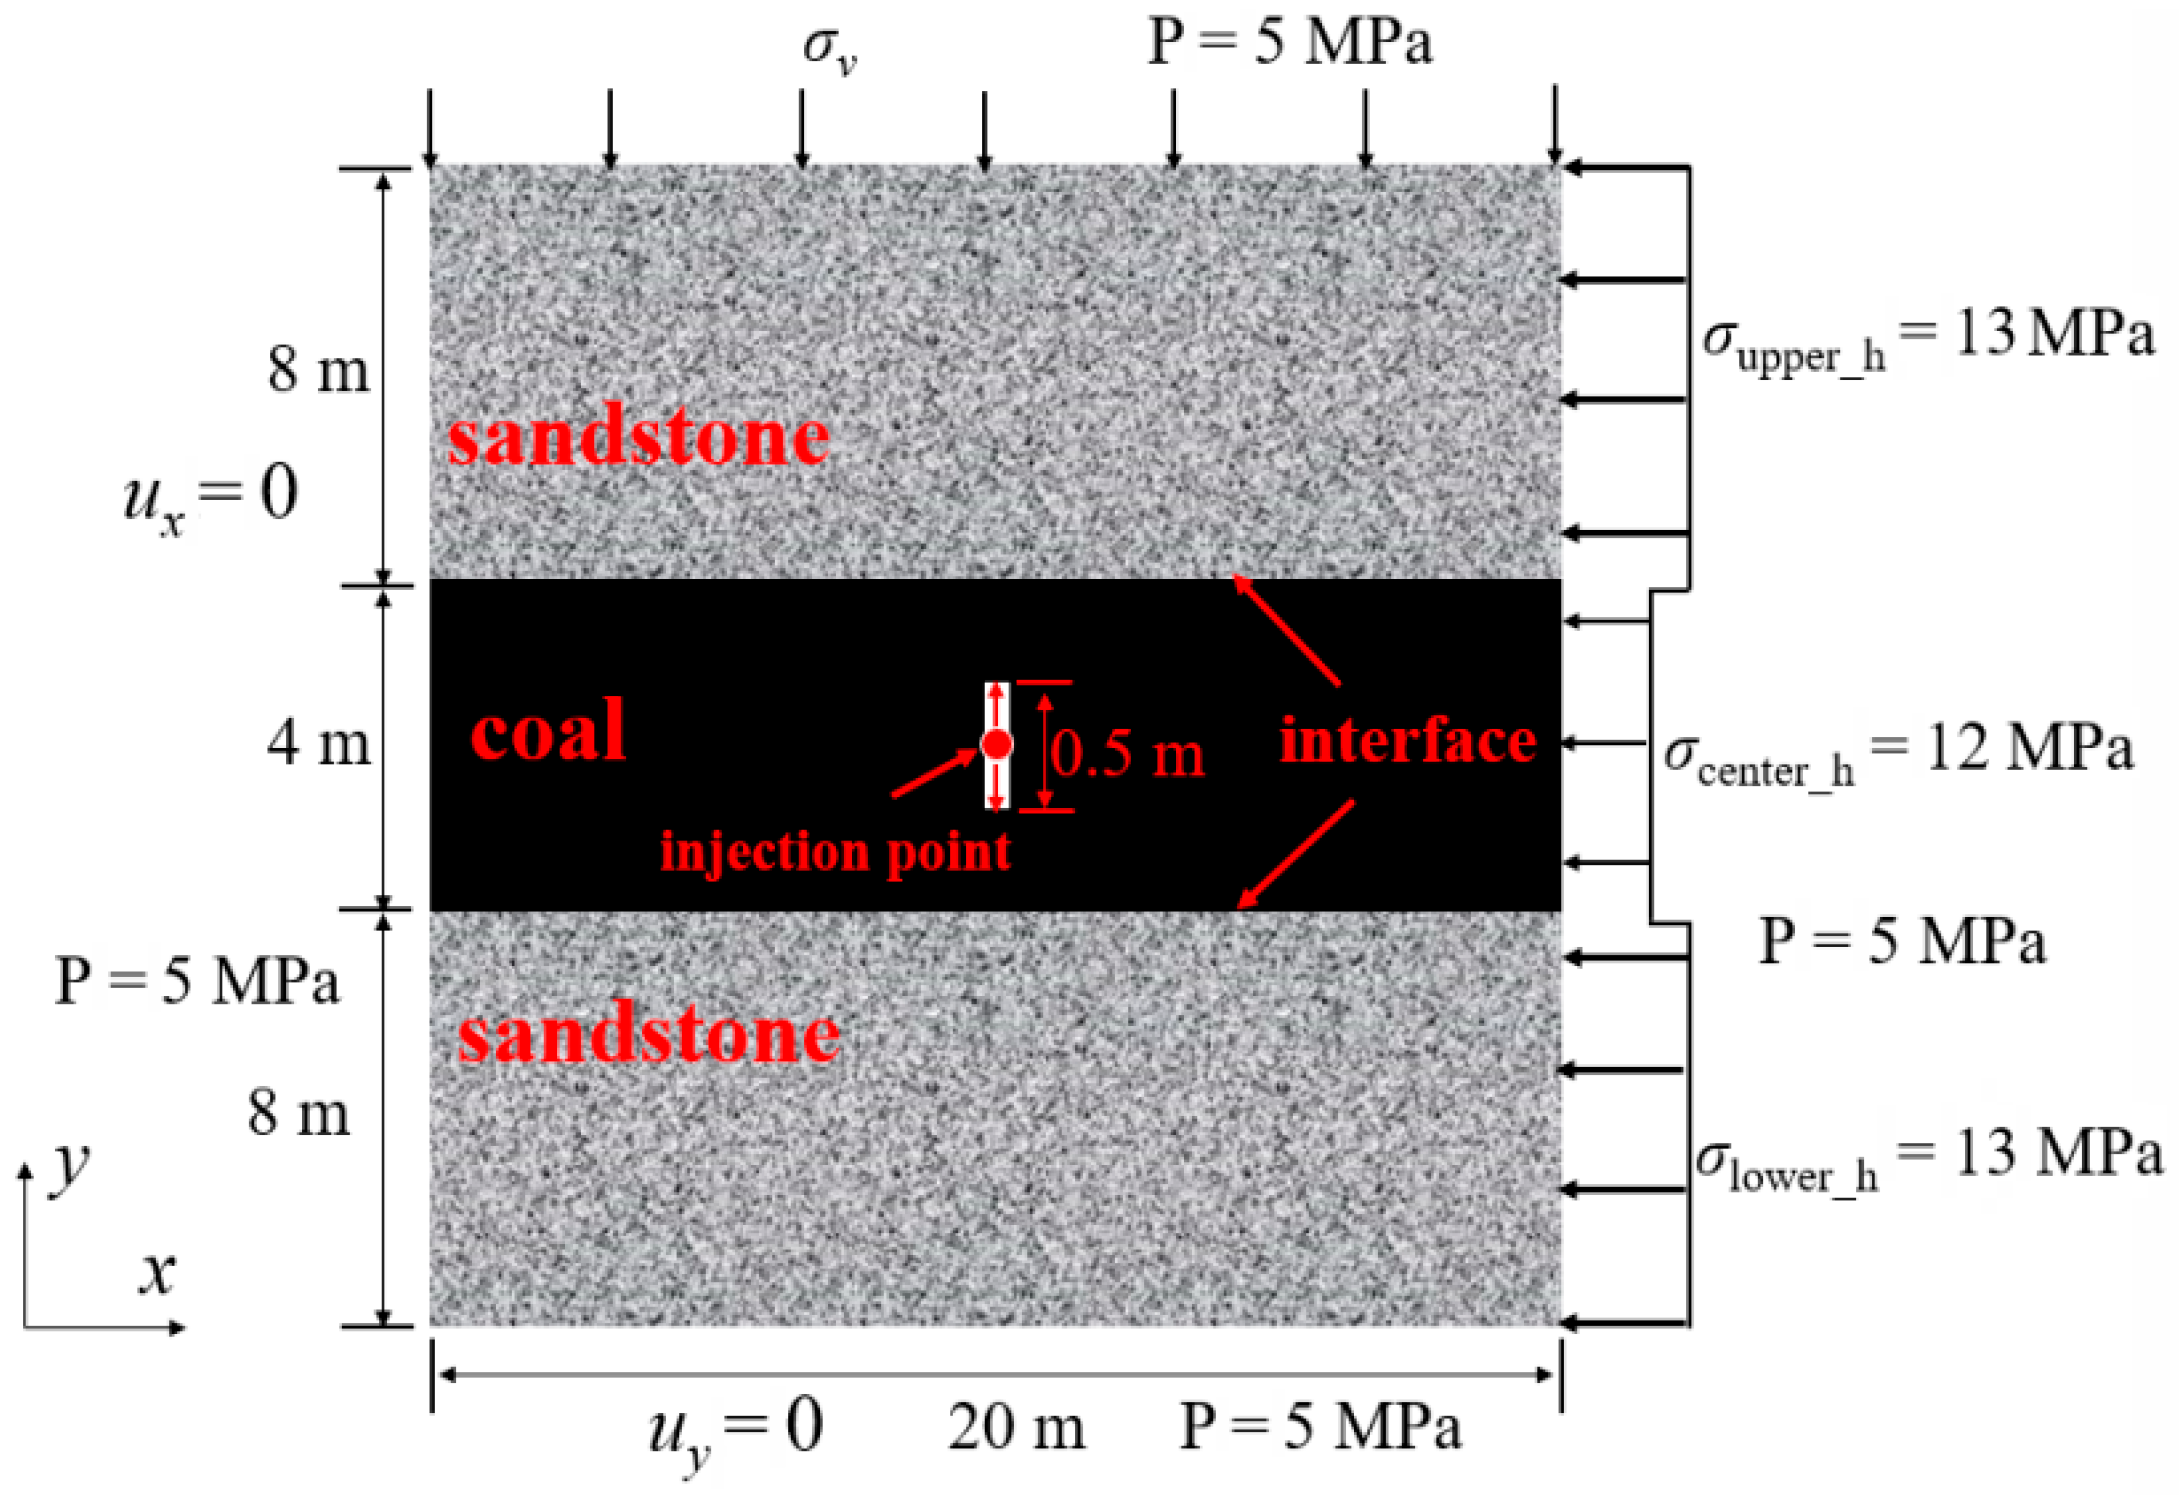
In this section, we examine several key factors influencing the propagation of hydraulic fracturing in sandstone–coal interlayers: in situ stress differences, the interface strength, Young’s modulus, Poisson’s ratio, and the injection rate. The computational domain and boundary conditions are shown in Figure 8, where the central layer is the coal layer and the upper and lower layers (barrier layers) are sandstone. Here, σv represents the vertical in situ stress, while σupper_h, σcenter_h, and σlower_h denote the minimum horizontal in situ stresses of the upper, middle, and lower layers, respectively. In this study, the parameters were selected from a well in Southwest China, as detailed in Table 3.

4.1. Effects of Ground Stress Differences

In this subsection, we investigate the effect of in situ stress differences on the geometry of hydraulic fracturing. The minimum horizontal stress is shown in Figure 9. Simulations were also conducted for vertical in situ stresses of 15 MPa, 16 MPa, and 17 MPa. Other input parameters are listed in Table 3.
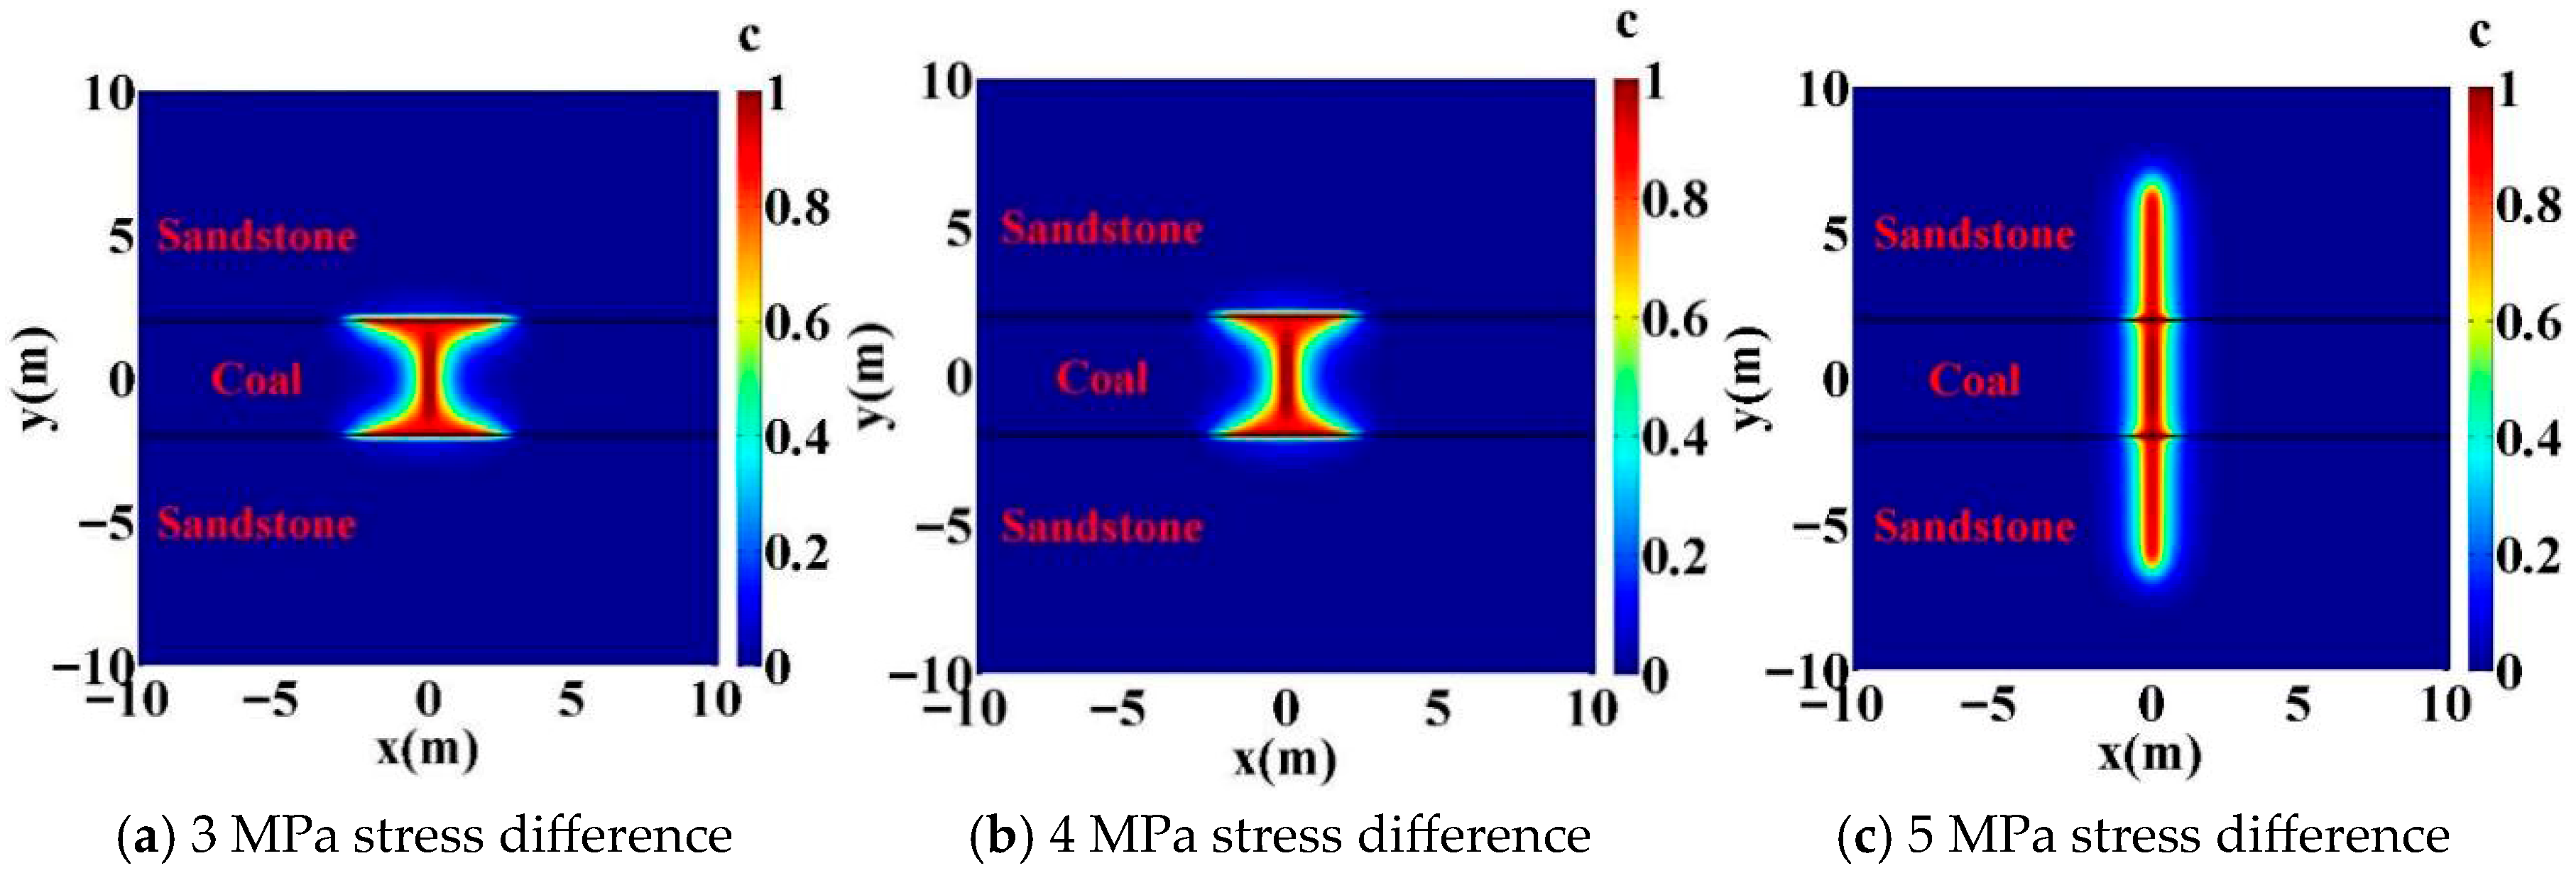
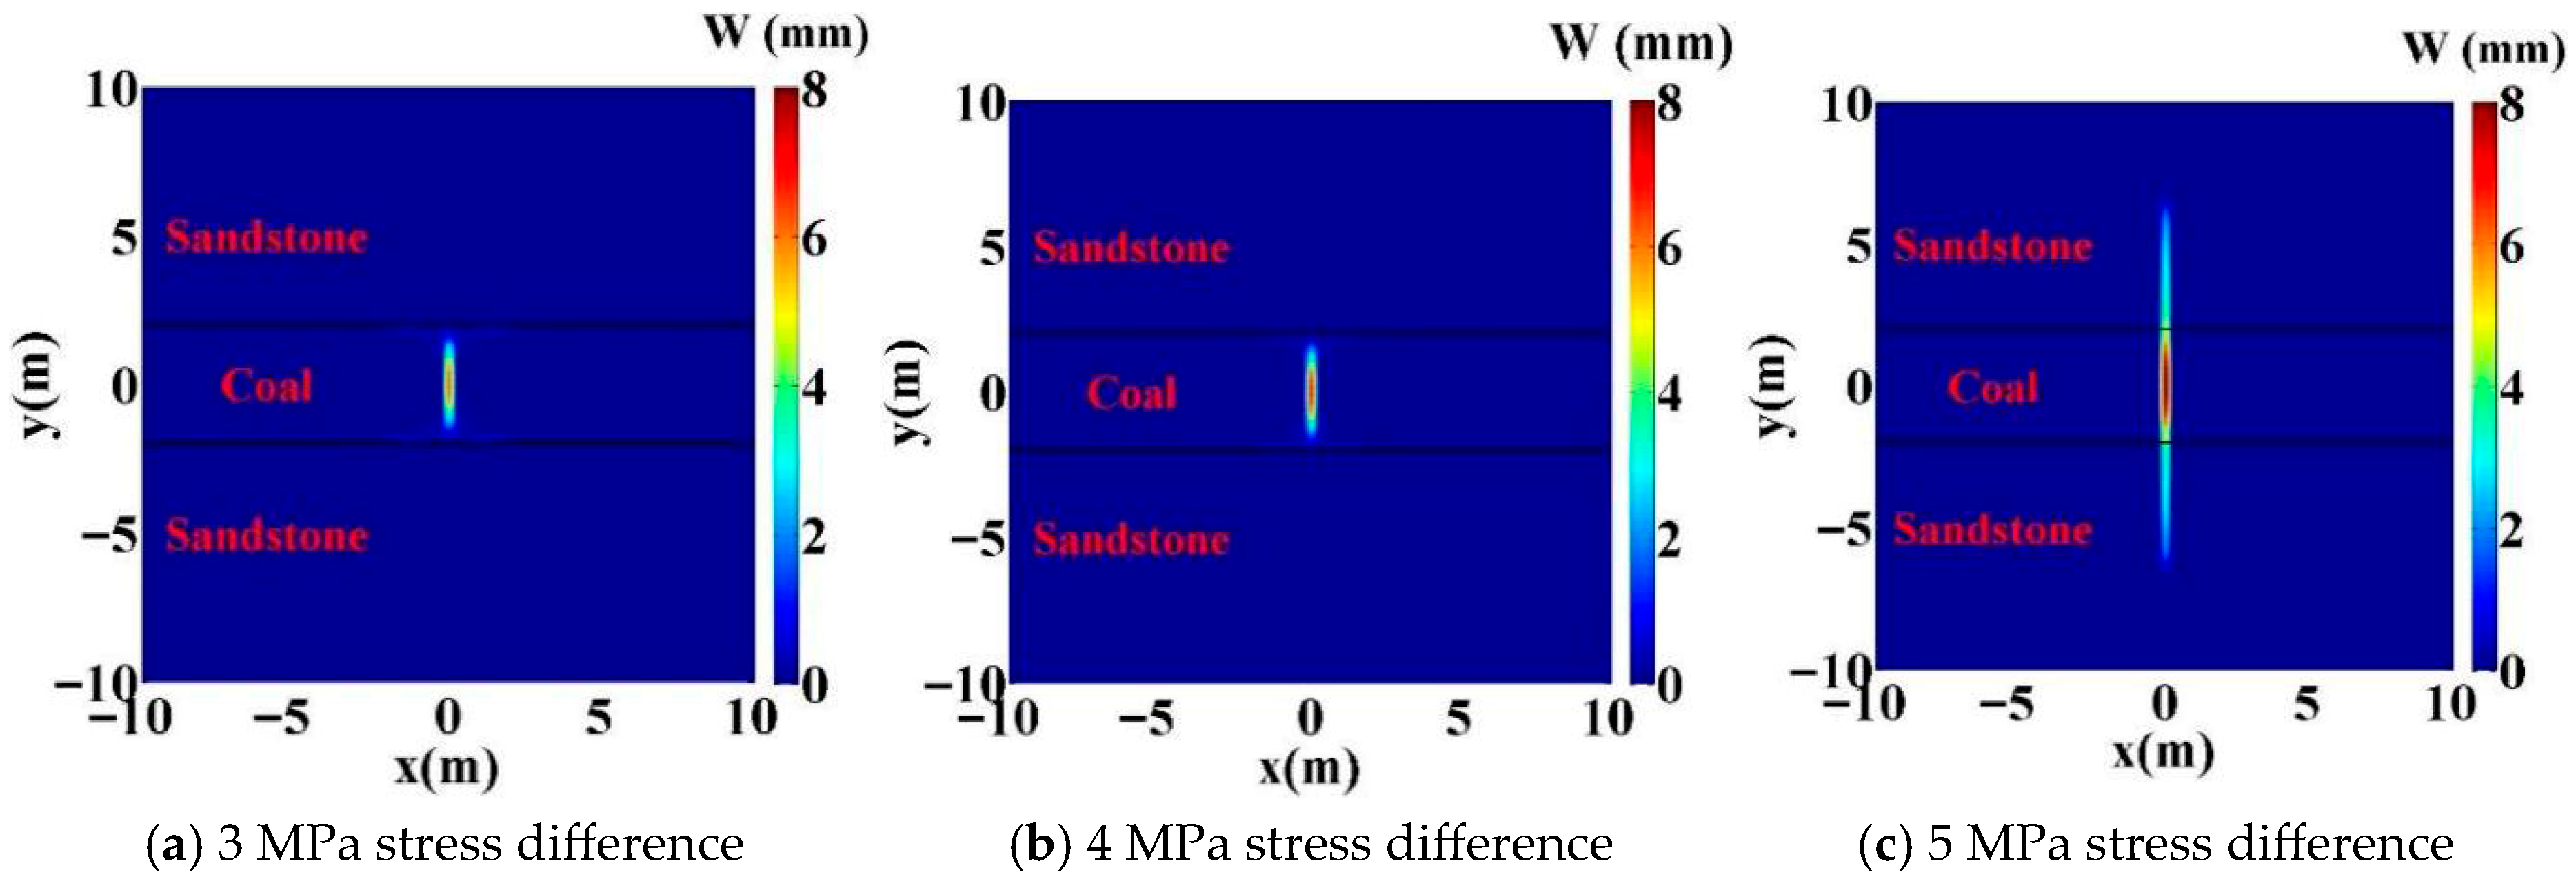
The phase-field distribution profiles for the three different in situ stress scenarios are compared in Figure 10. Note that the black lines in all the following figures represent the interface. It can be observed that, under small in situ stress differences (Figure 10a,b), hydraulic fracturing opens the interface and propagates along it. However, under a 5 MPa in situ stress difference, hydraulic fracturing directly penetrates through the interface. The fracture width distribution profiles for the three different in situ stress difference scenarios are shown in Figure 11. It can be observed that, under the 3 MPa and 4 MPa geological stress differences (Figure 11a,b), although hydraulic fracturing opened the interface, the fracture width in the interface region was significantly smaller than that in the coal seam region. This is because the normal direction of the fracture surface in the interface region experienced greater geological stress than the normal direction in the coal seam region. It can also be observed that, under a 5 MPa stress difference (Figure 11c), the fracture width in the coal layer was much larger than that in the sandstone layer. Two factors contribute to this phenomenon: first, the Young’s modulus of sandstone is greater than that of the coal layer; second, the minimum horizontal stress in the sandstone layer is greater than that in the coal layer.
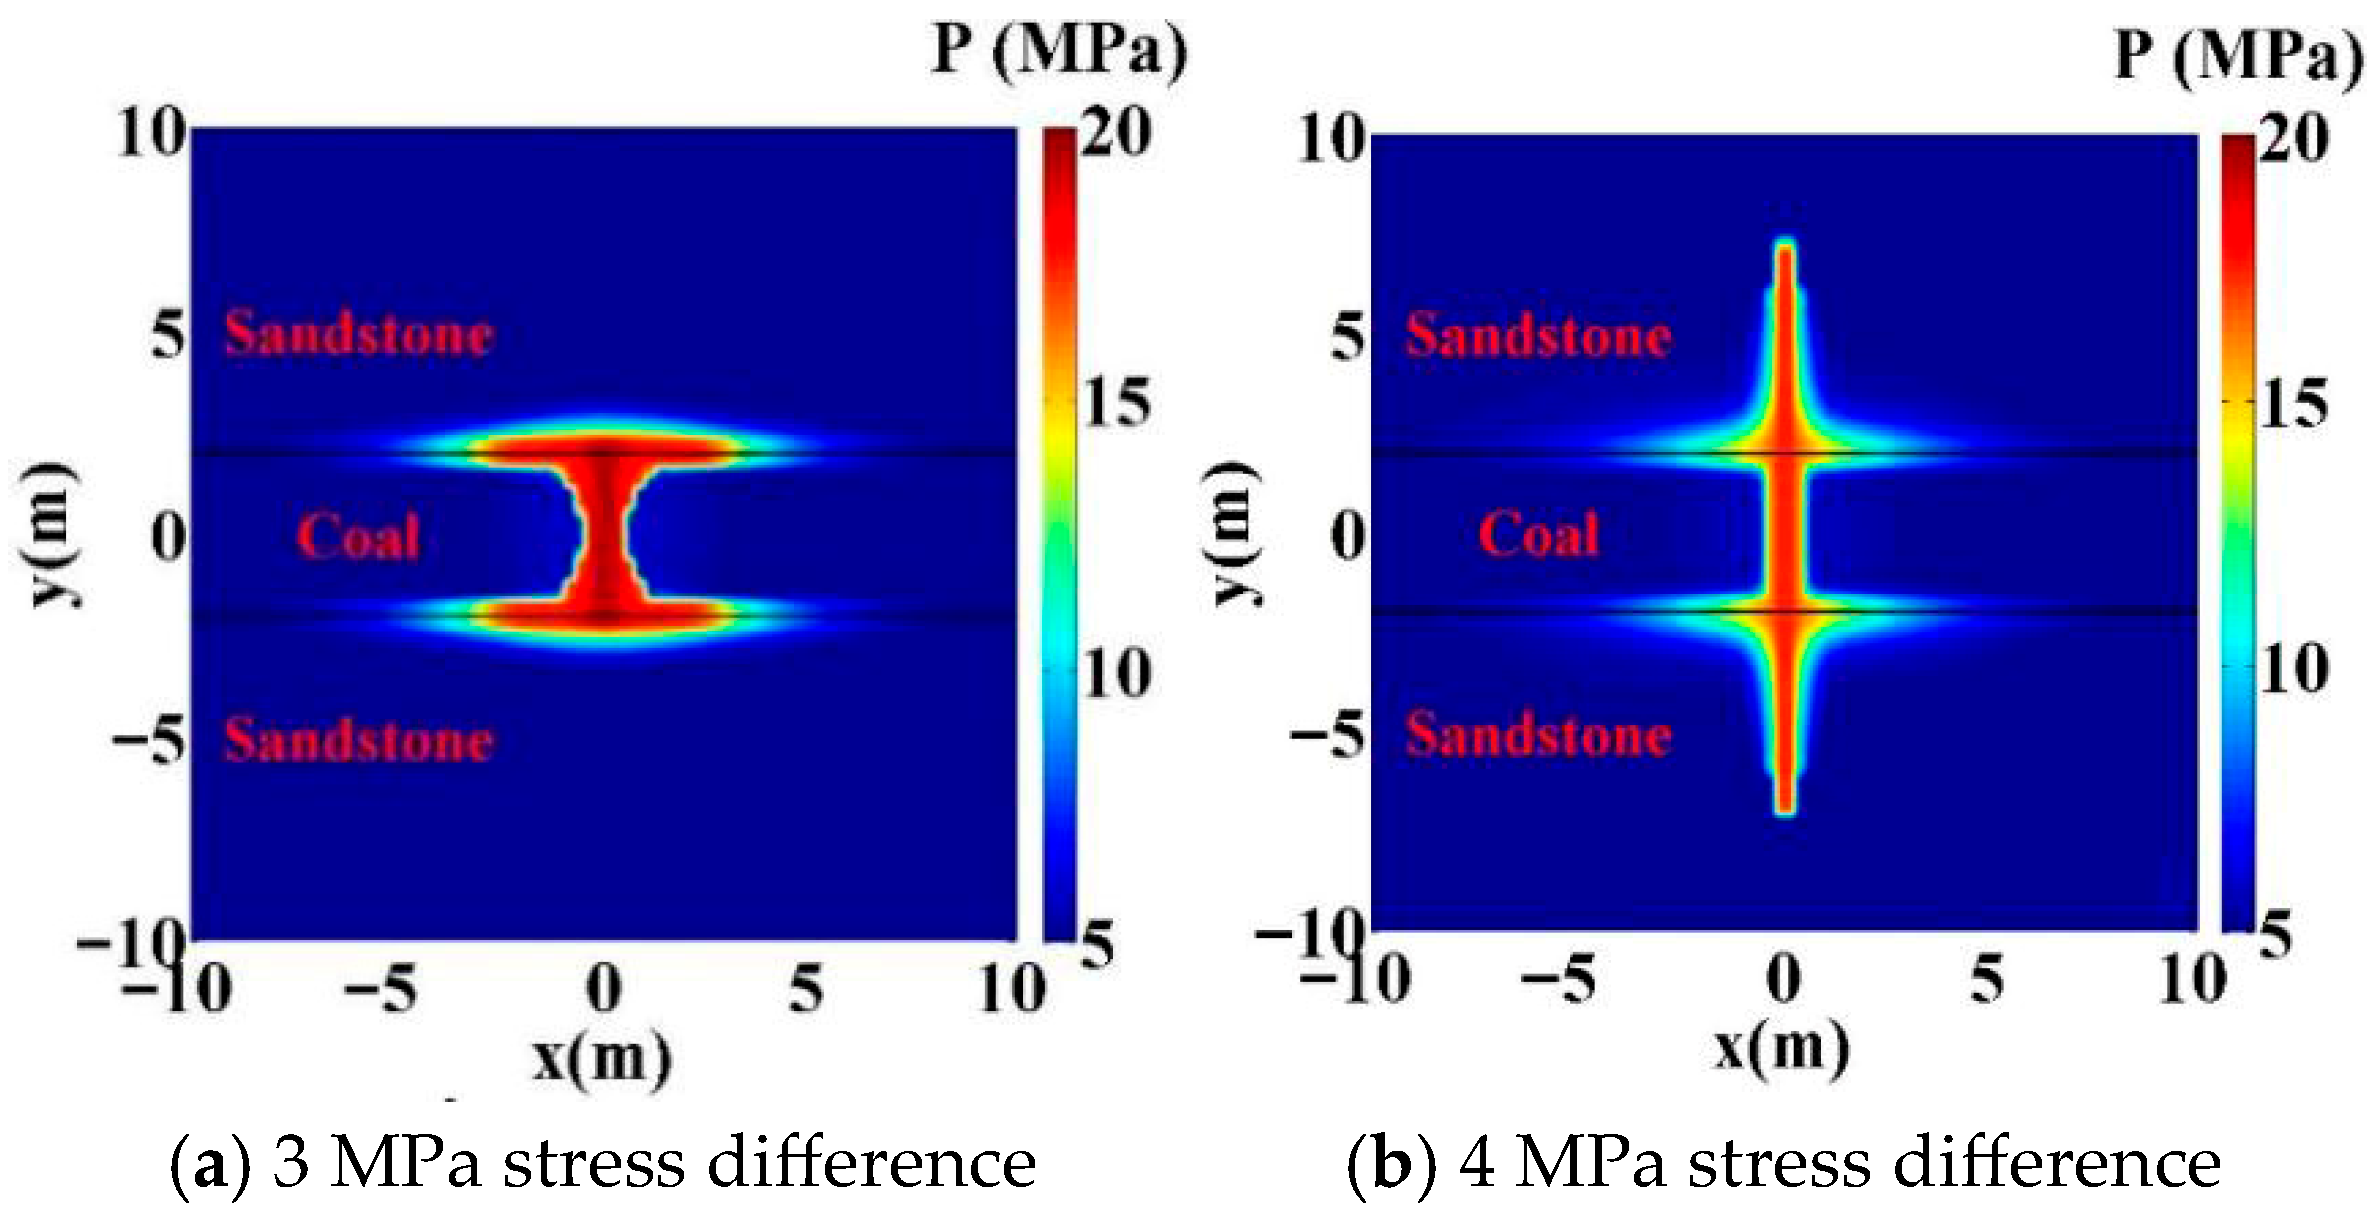
Figure 12 shows the pressure distribution profiles at the end of the jet under three different in situ stress conditions. It can be observed that the geometric shape of the pressure distribution is similar to that of the phase-field distribution. The hydraulic fracturing pressure propagating along the interface is greater than the hydraulic fracture directly crossing the interface. In other words, in field operations, the increase in the injection pressure may not only be due to proppant blocking the fracture, but also due to the opening of the interface. Under a 5 MPa in situ stress difference, although the hydraulic fracture did not activate the interface, the interface became the primary pathway for fluid leakage due to its higher permeability compared to the matrix.
Therefore, in sand–coal interbedded formations with reservoir parameters similar to those of the case well, an in situ stress difference of 5 MPa allows a hydraulic fracture to traverse the interface from the coal seam and extend into the sandstone.

4.2. Influence of Interface Strength

In this section, we investigate the effect of the interface strength on the geometry of hydraulic fracturing. The vertical in situ stress was set to 16 MPa. In the previous sections, we simulated cases with an interface strength of 0.5 MPa (as shown in Figure 10b, Figure 11b and Figure 12b). For comparison, this section examines cases with interface strengths of 0.75 MPa and 1 MPa. Other input parameters can be found in Table 3.
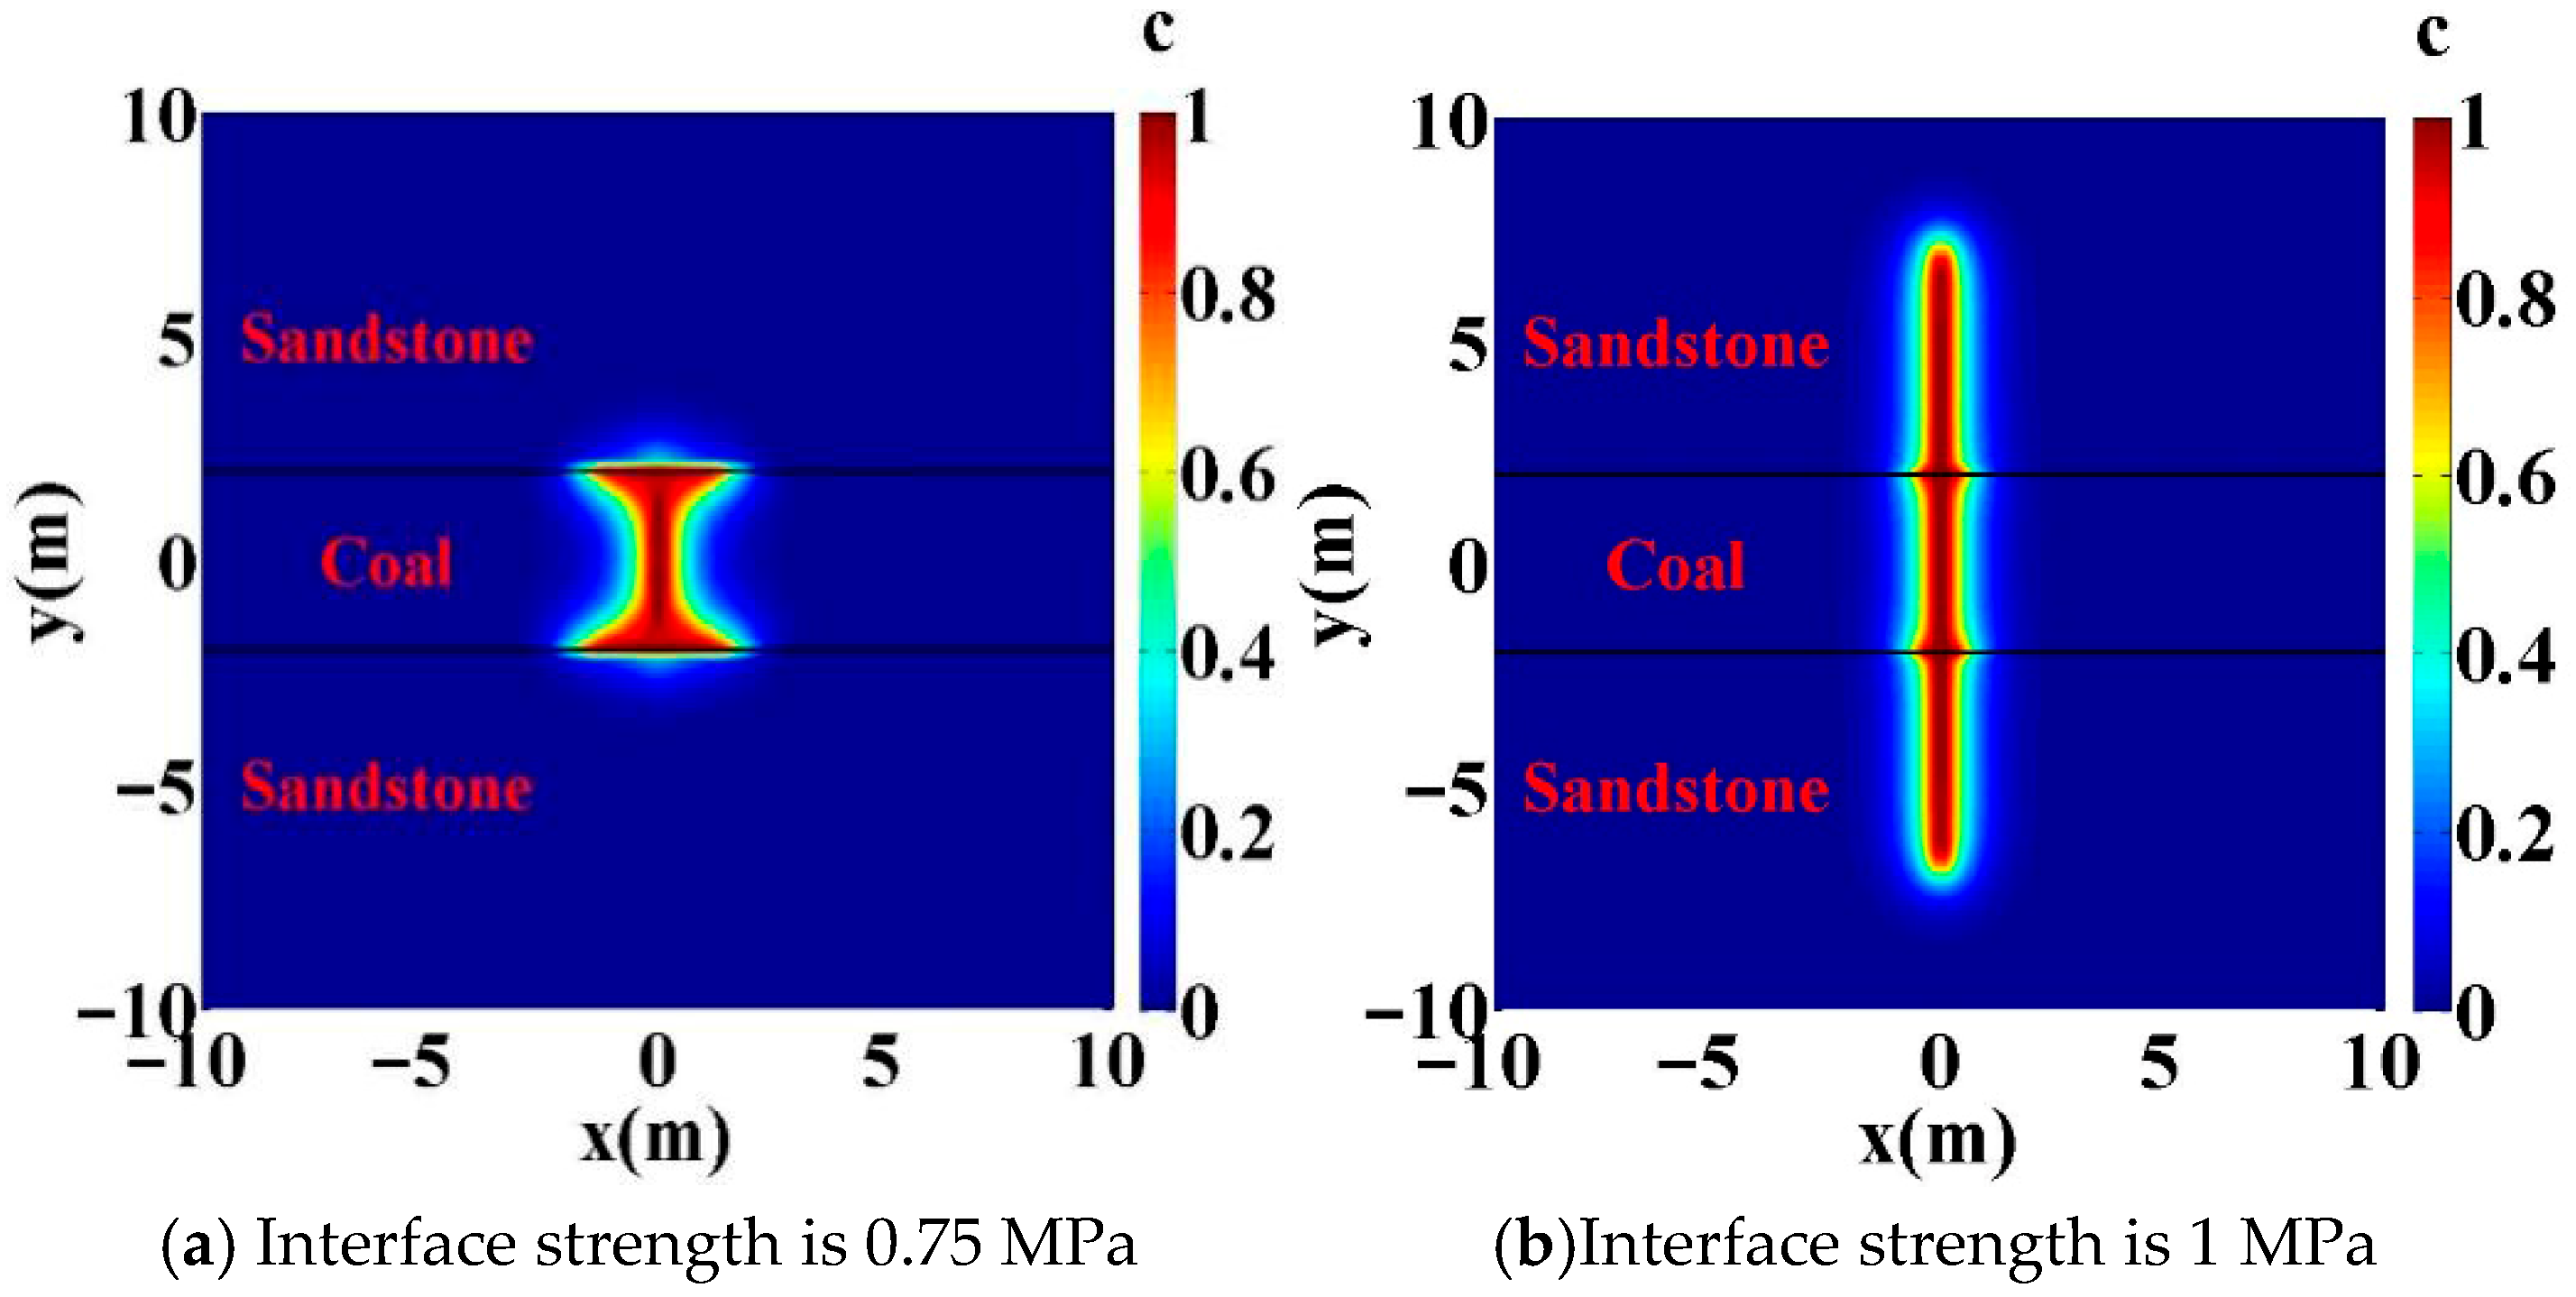
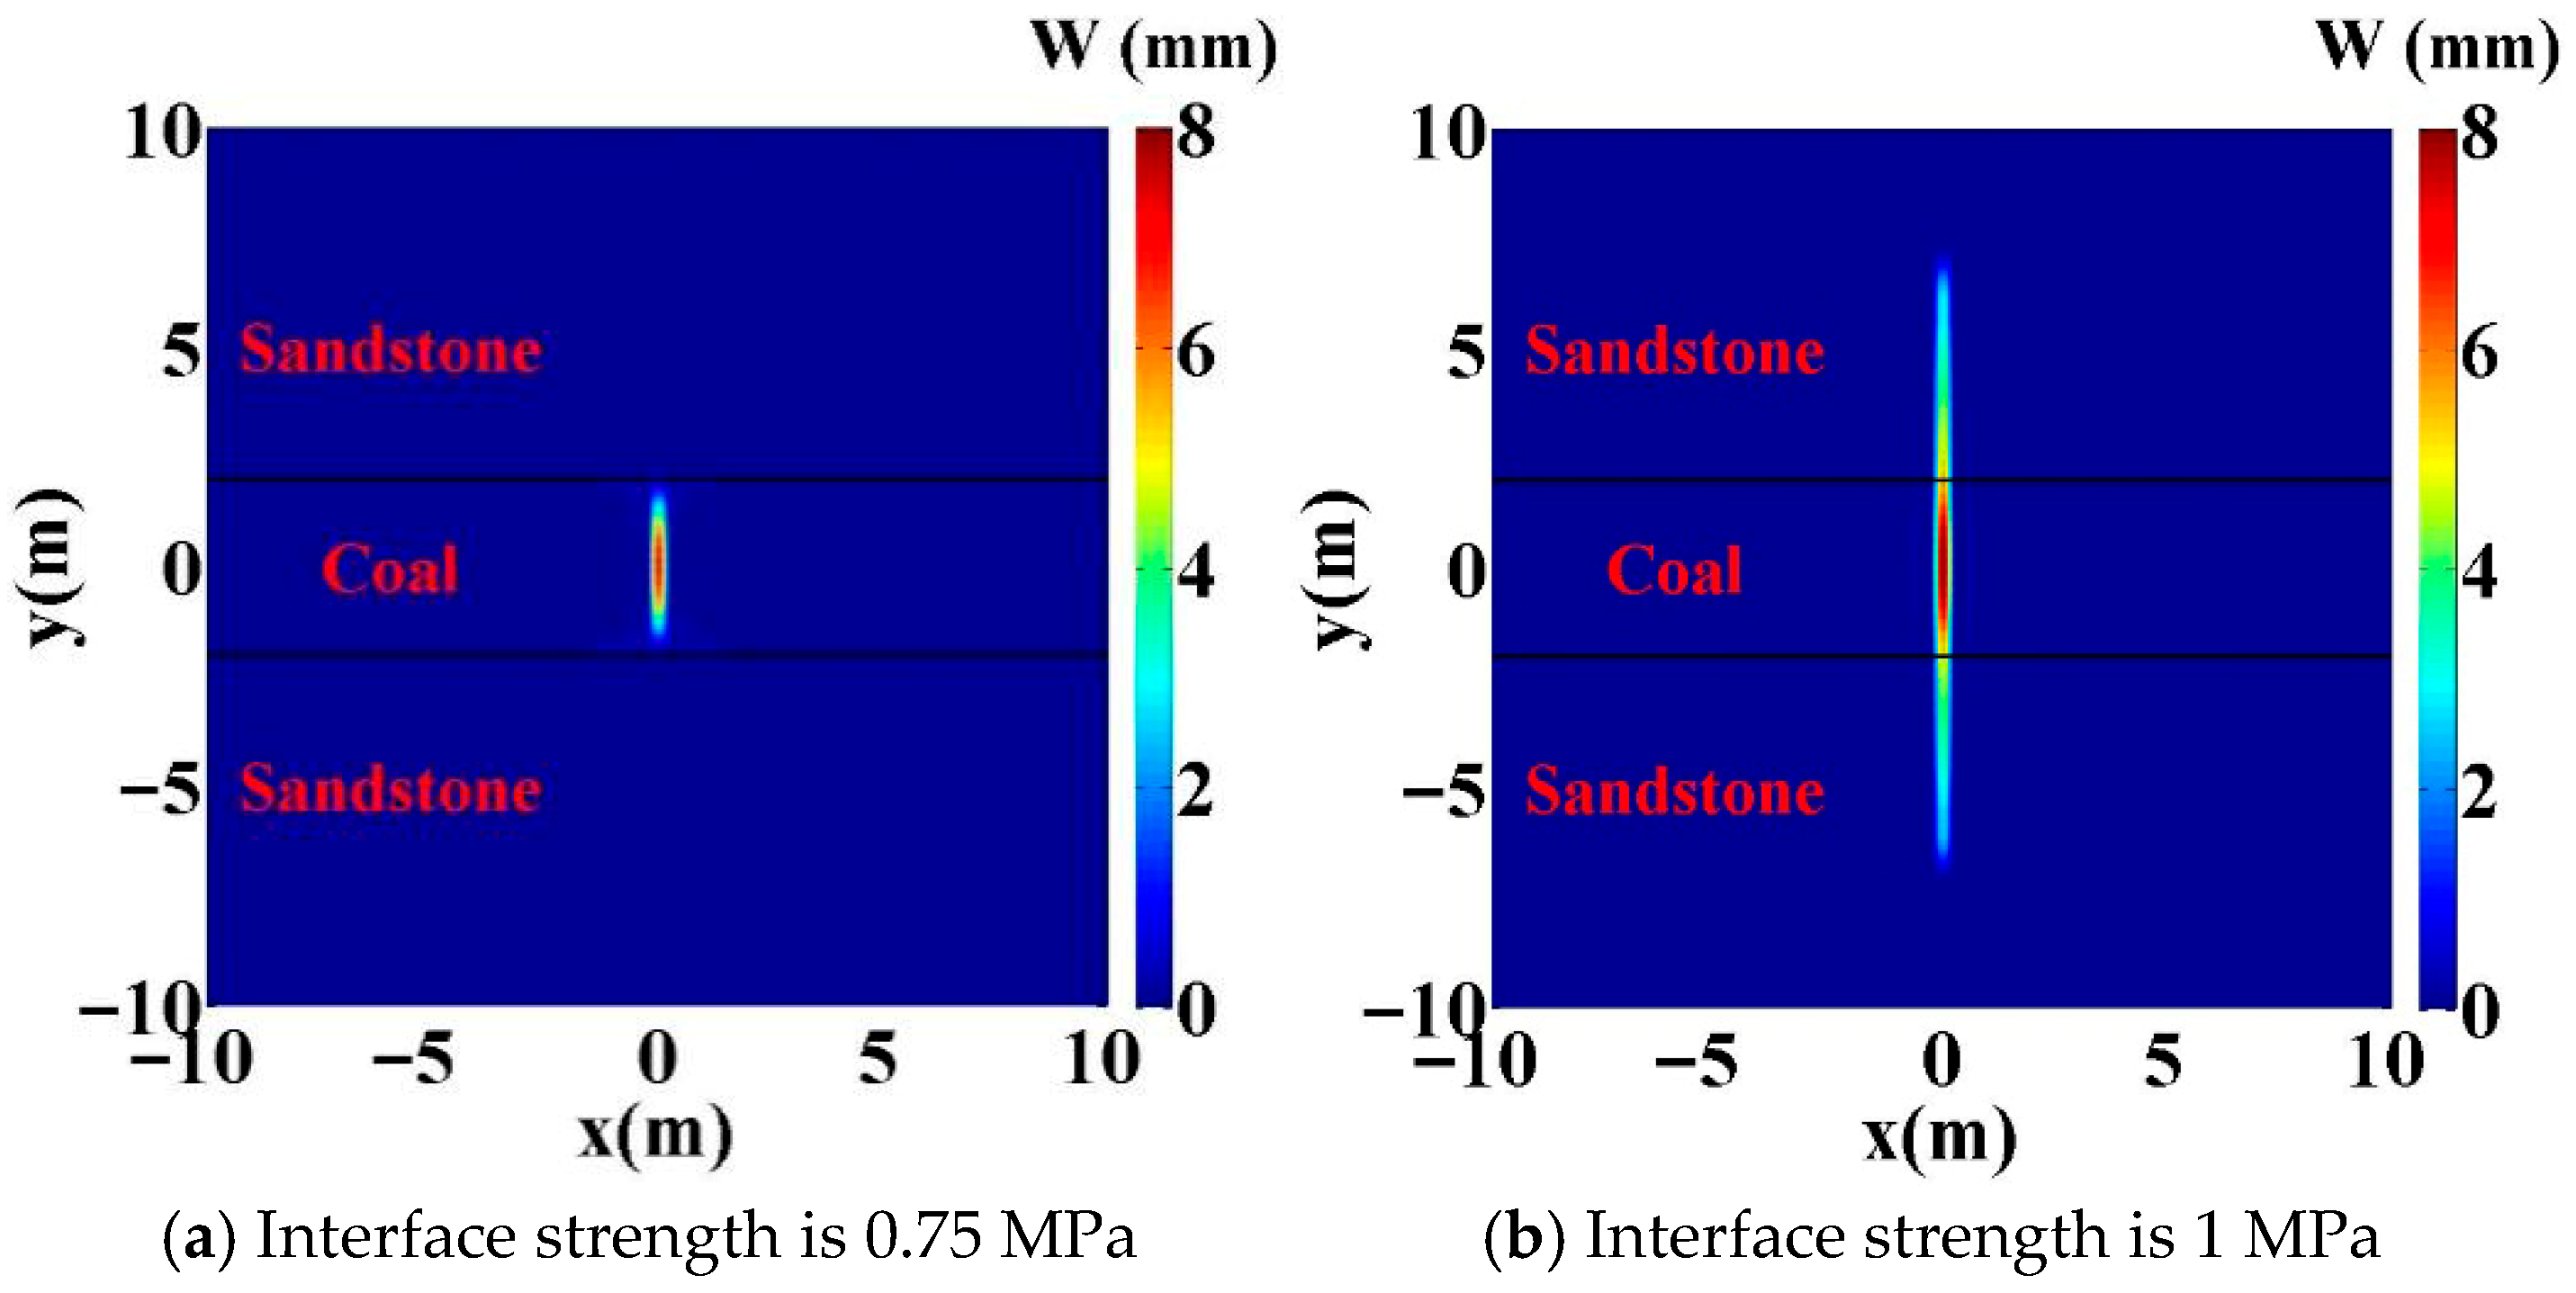
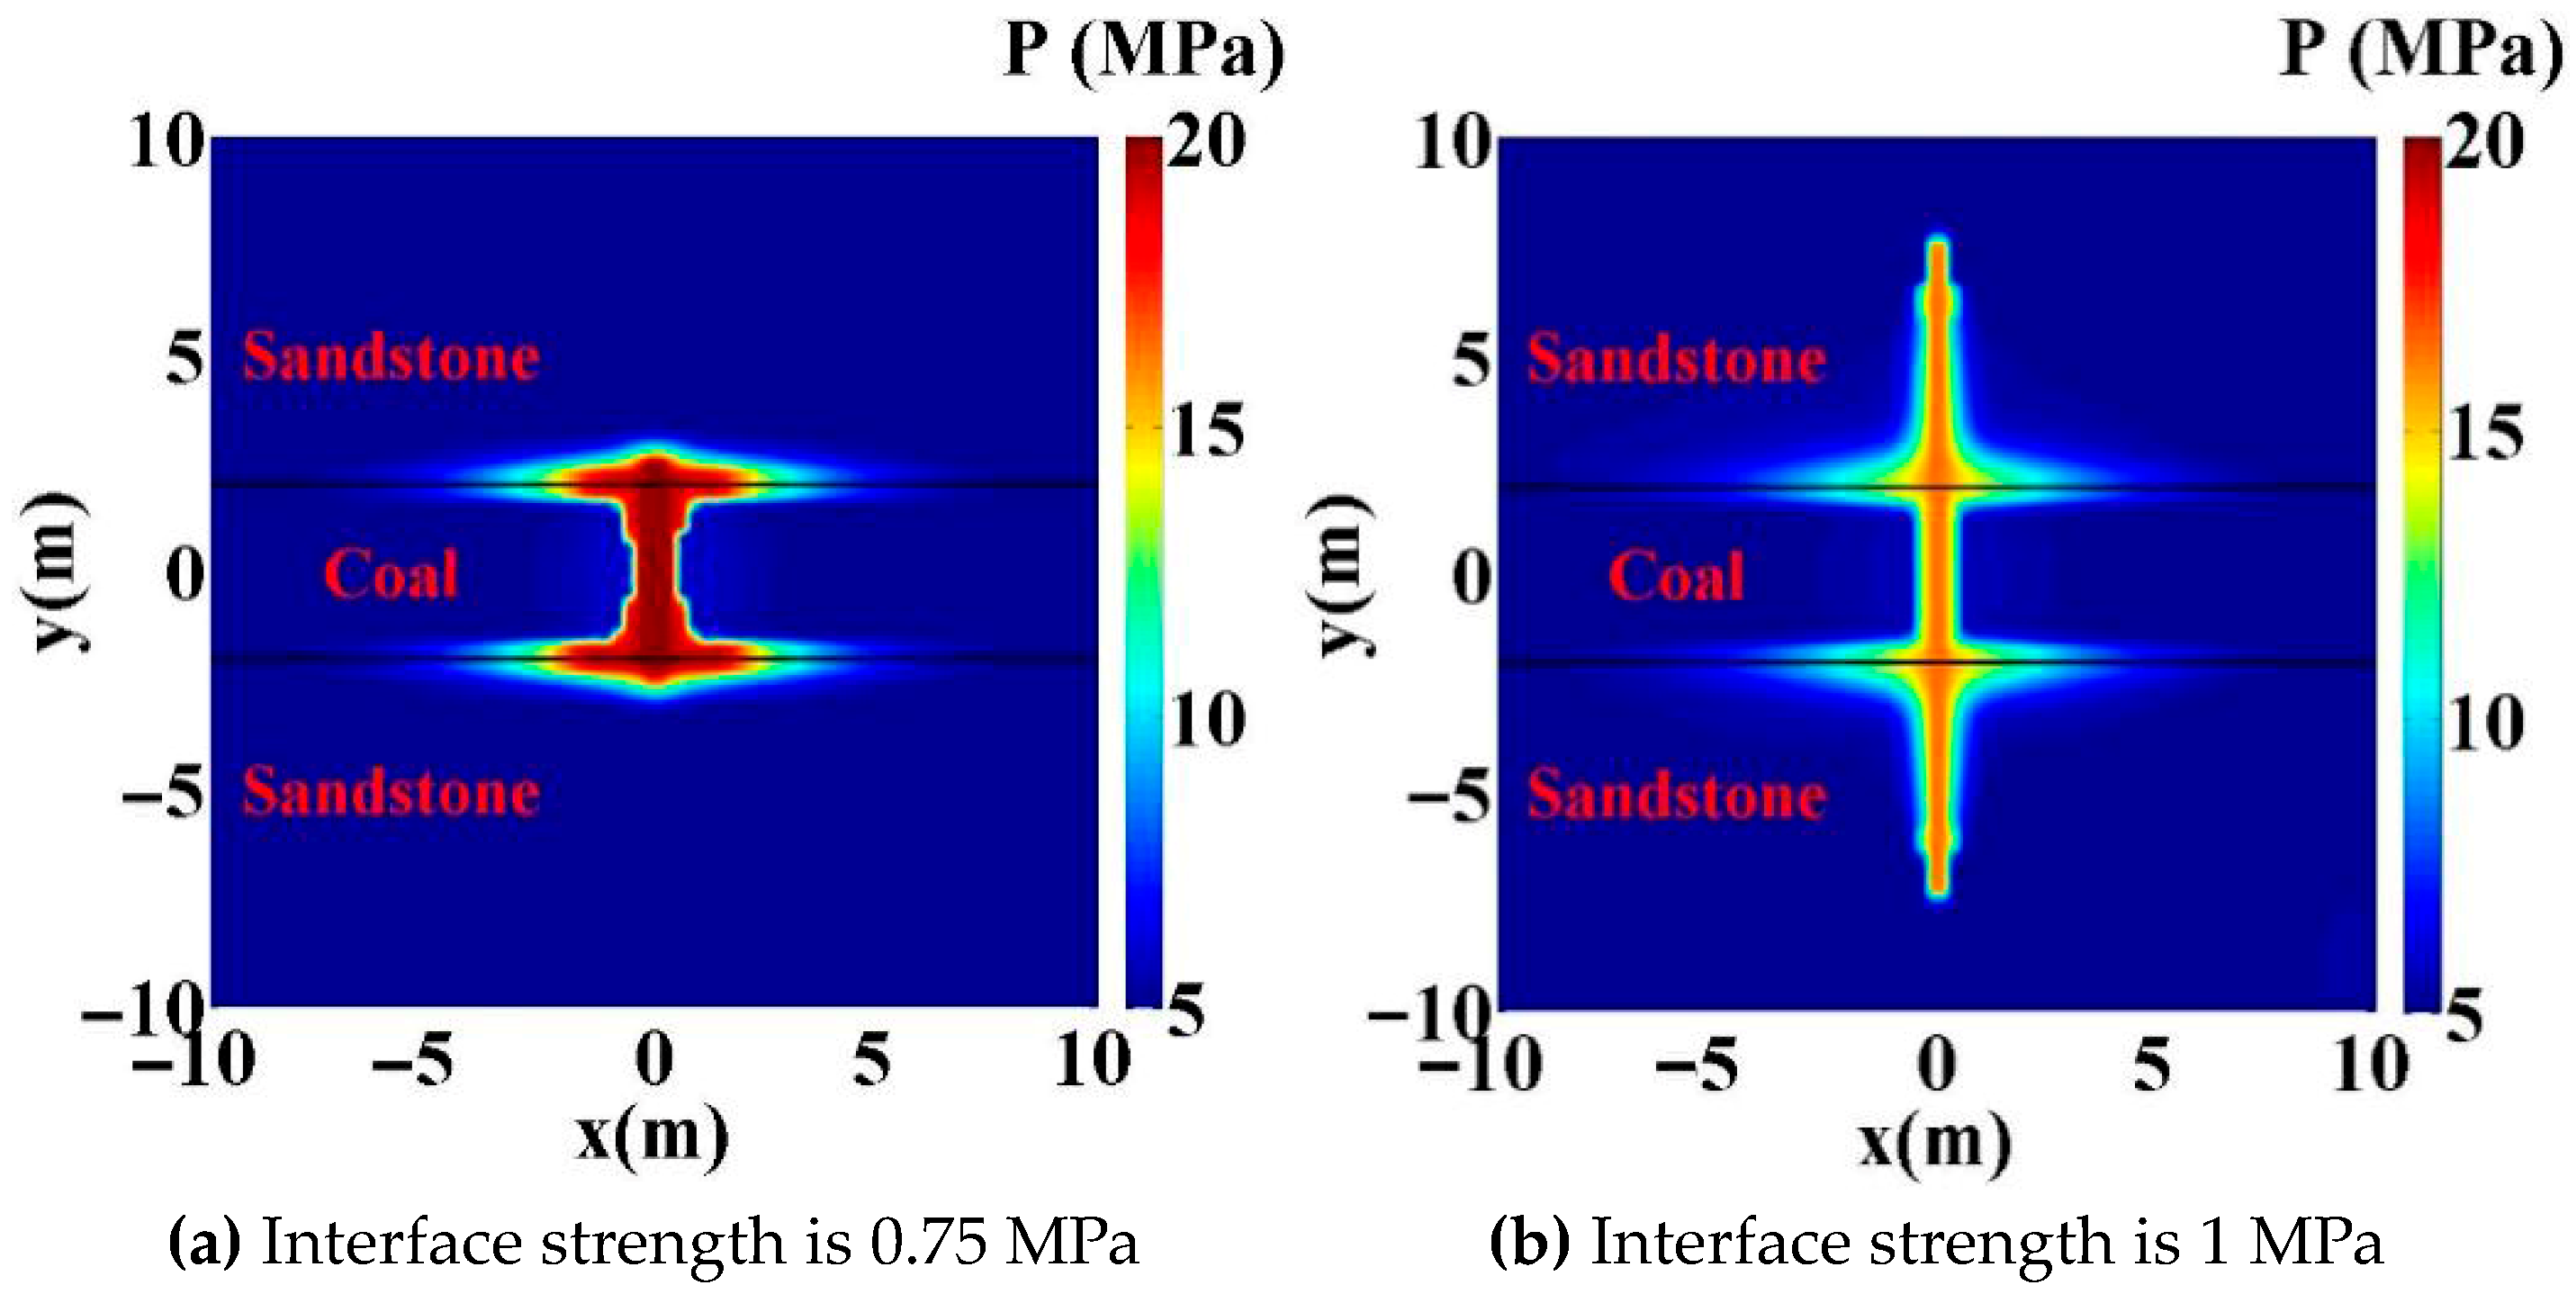
Figure 13 shows the phase-field distribution profiles at the end of injection for the two different interface strengths. As can be seen from Figure 10b and Figure 13, the higher the interface strength, the shorter the hydraulic fracturing distance along the interface. At an interface strength of 0.75 MPa, hydraulic fracturing will diverge toward the interface and propagate along it; however, when the interface strength increases to 1 MPa, hydraulic fracturing will directly penetrate the interface. In other words, a higher interface strength facilitates the hydraulic fracturing penetration through the interface and propagation toward the barrier layer. Figure 14 and Figure 15 show the fracturing width and pressure distribution profiles at the end of injection for two different interface strengths, respectively. As expected, the geometric shapes of the fracturing width and pressure distribution align with those of the phase-field distribution.

4.3. Influence of Young’s Modulus and Poisson’s Ratio

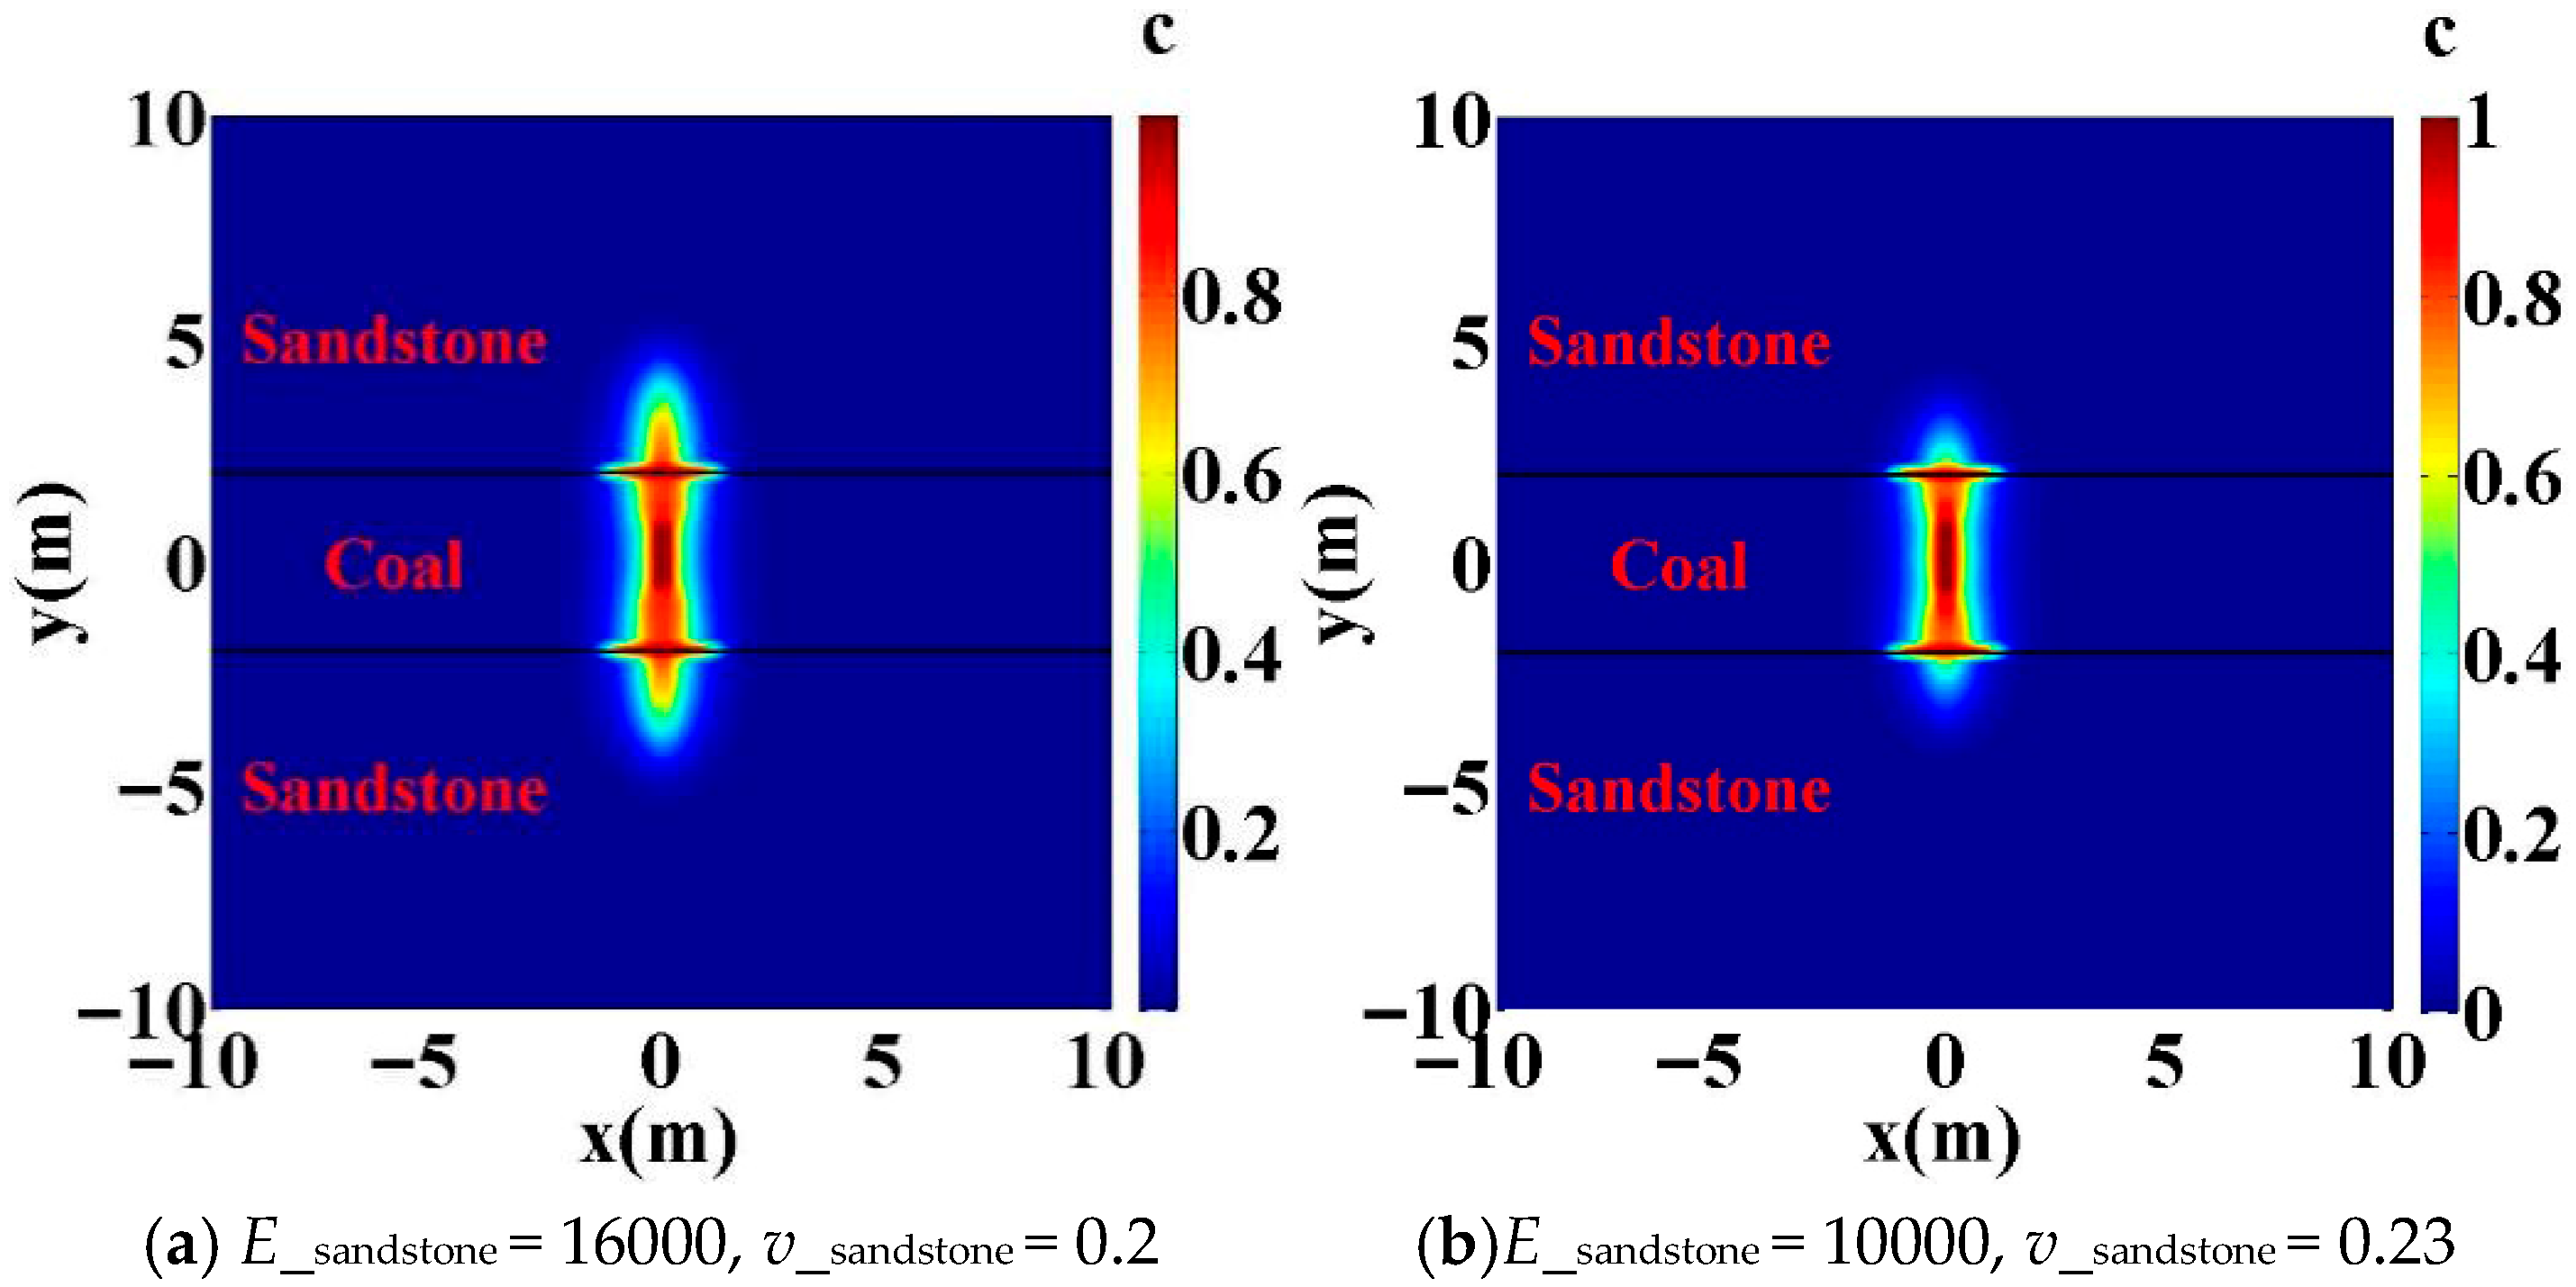
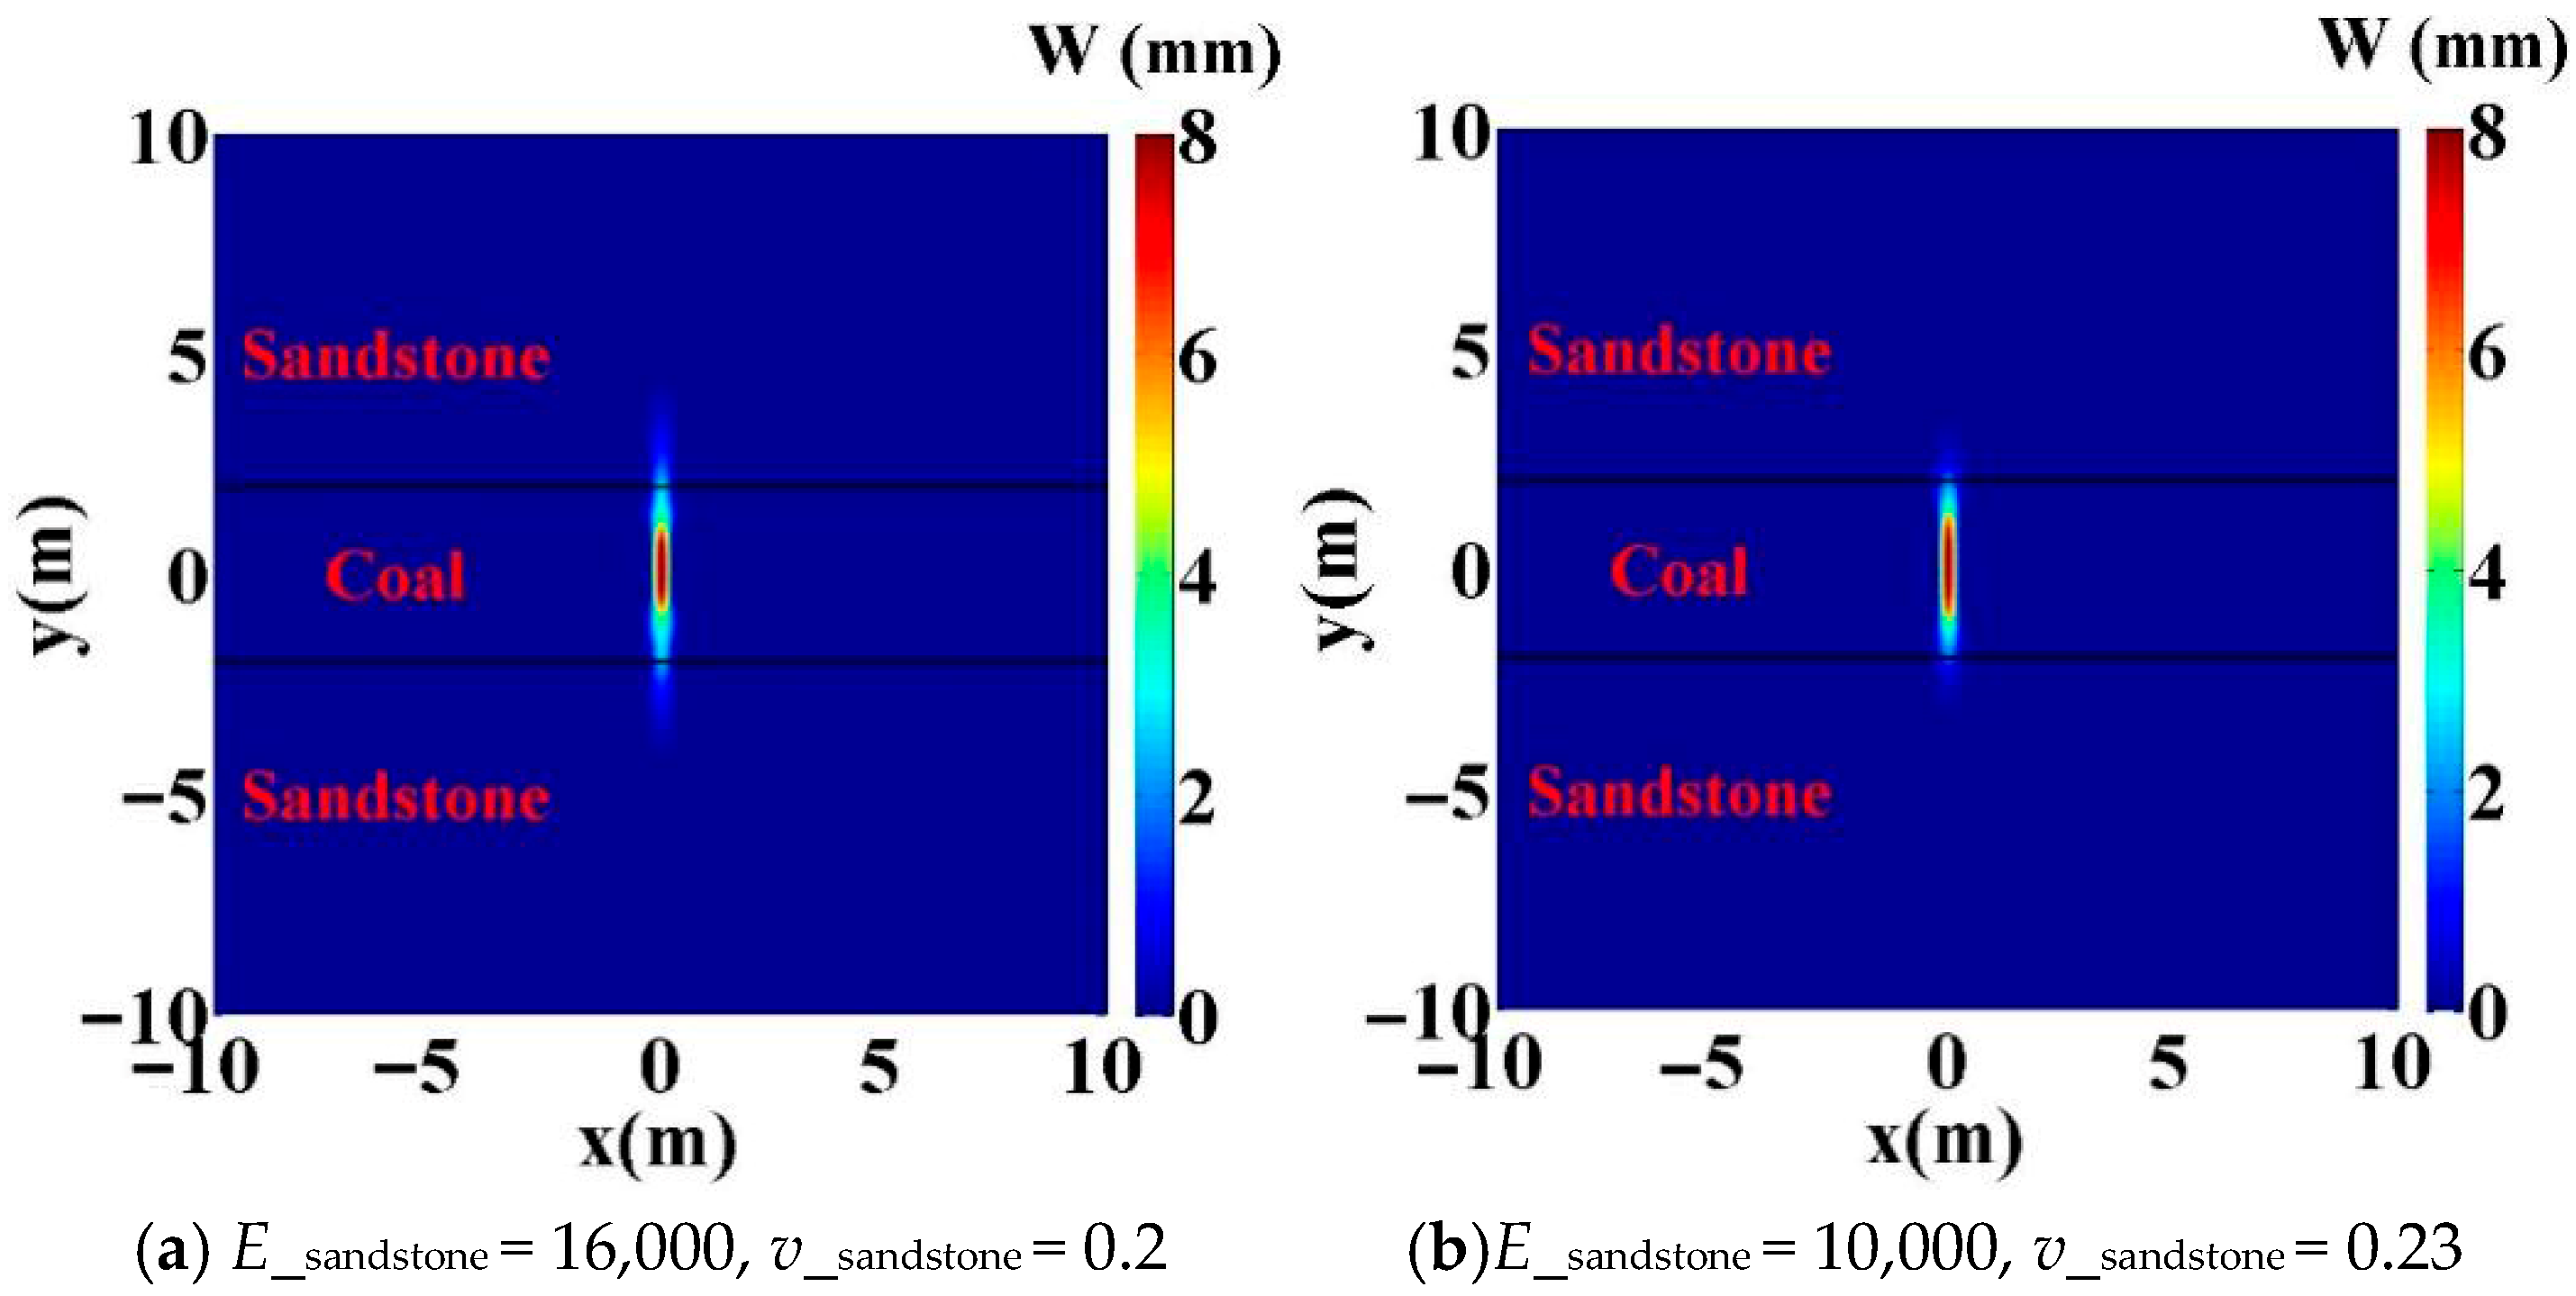
In this subsection, we will analyze the effects of Young’s modulus and Poisson’s ratio of the wall layer on the geometric morphology of cracks. The vertical stress was set to 17 MPa. In Section 4.1, we already simulated cases where Young’s modulus and Poisson’s ratio of the wall layer were both 22,000 MPa and 0.17, respectively (as shown in Figure 10c, Figure 11c, and Figure 12c). For comparison, we investigated cases where the Young’s modulus of the wall layer was 16,000 MPa and 10,000 MPa in this section. Generally, Poisson’s ratio of rock is inversely proportional to its Young’s modulus, so Poisson’s ratio of the wall layer was set to 0.2 and 0.23, respectively. All other input parameters can be found in Table 2.
Figure 16, Figure 17 and Figure 18 show the phase field, fracture width, and pressure distribution contours for the two different Young’s modulus and Poisson’s ratio scenarios. By combining Figure 10, Figure 11, Figure 12, Figure 16, Figure 17 and Figure 18, we can observe that, as Young’s modulus of the barrier layer decreases, the fracture height decreases, and the likelihood of hydraulic fracturing activating the interface increases.
Although Young’s modulus dominated the response, Poisson’s ratio influenced the outcome through the plane-strain modulus.
E = E 1 v 2
where E ′ is the plane-strain modulus.
Across the three barrier-layer settings used here, the plane-strain modulus monotonically decreased, which explains the reduced height containment and the enhanced tendency for interface opening as Young’s modulus decreased. If Young’s modulus were held fixed, increasing Poisson’s ratio from 0.17 to 0.23 would raise the plane-strain modulus by only about 2.5%, slightly reducing the aperture and hindering interface activation. Thus, Poisson’s ratio affects lateral confinement and opening compliance via the plane-strain modulus, but its influence here is secondary to that of Young’s modulus.

4.4. Effect of Injection Speed

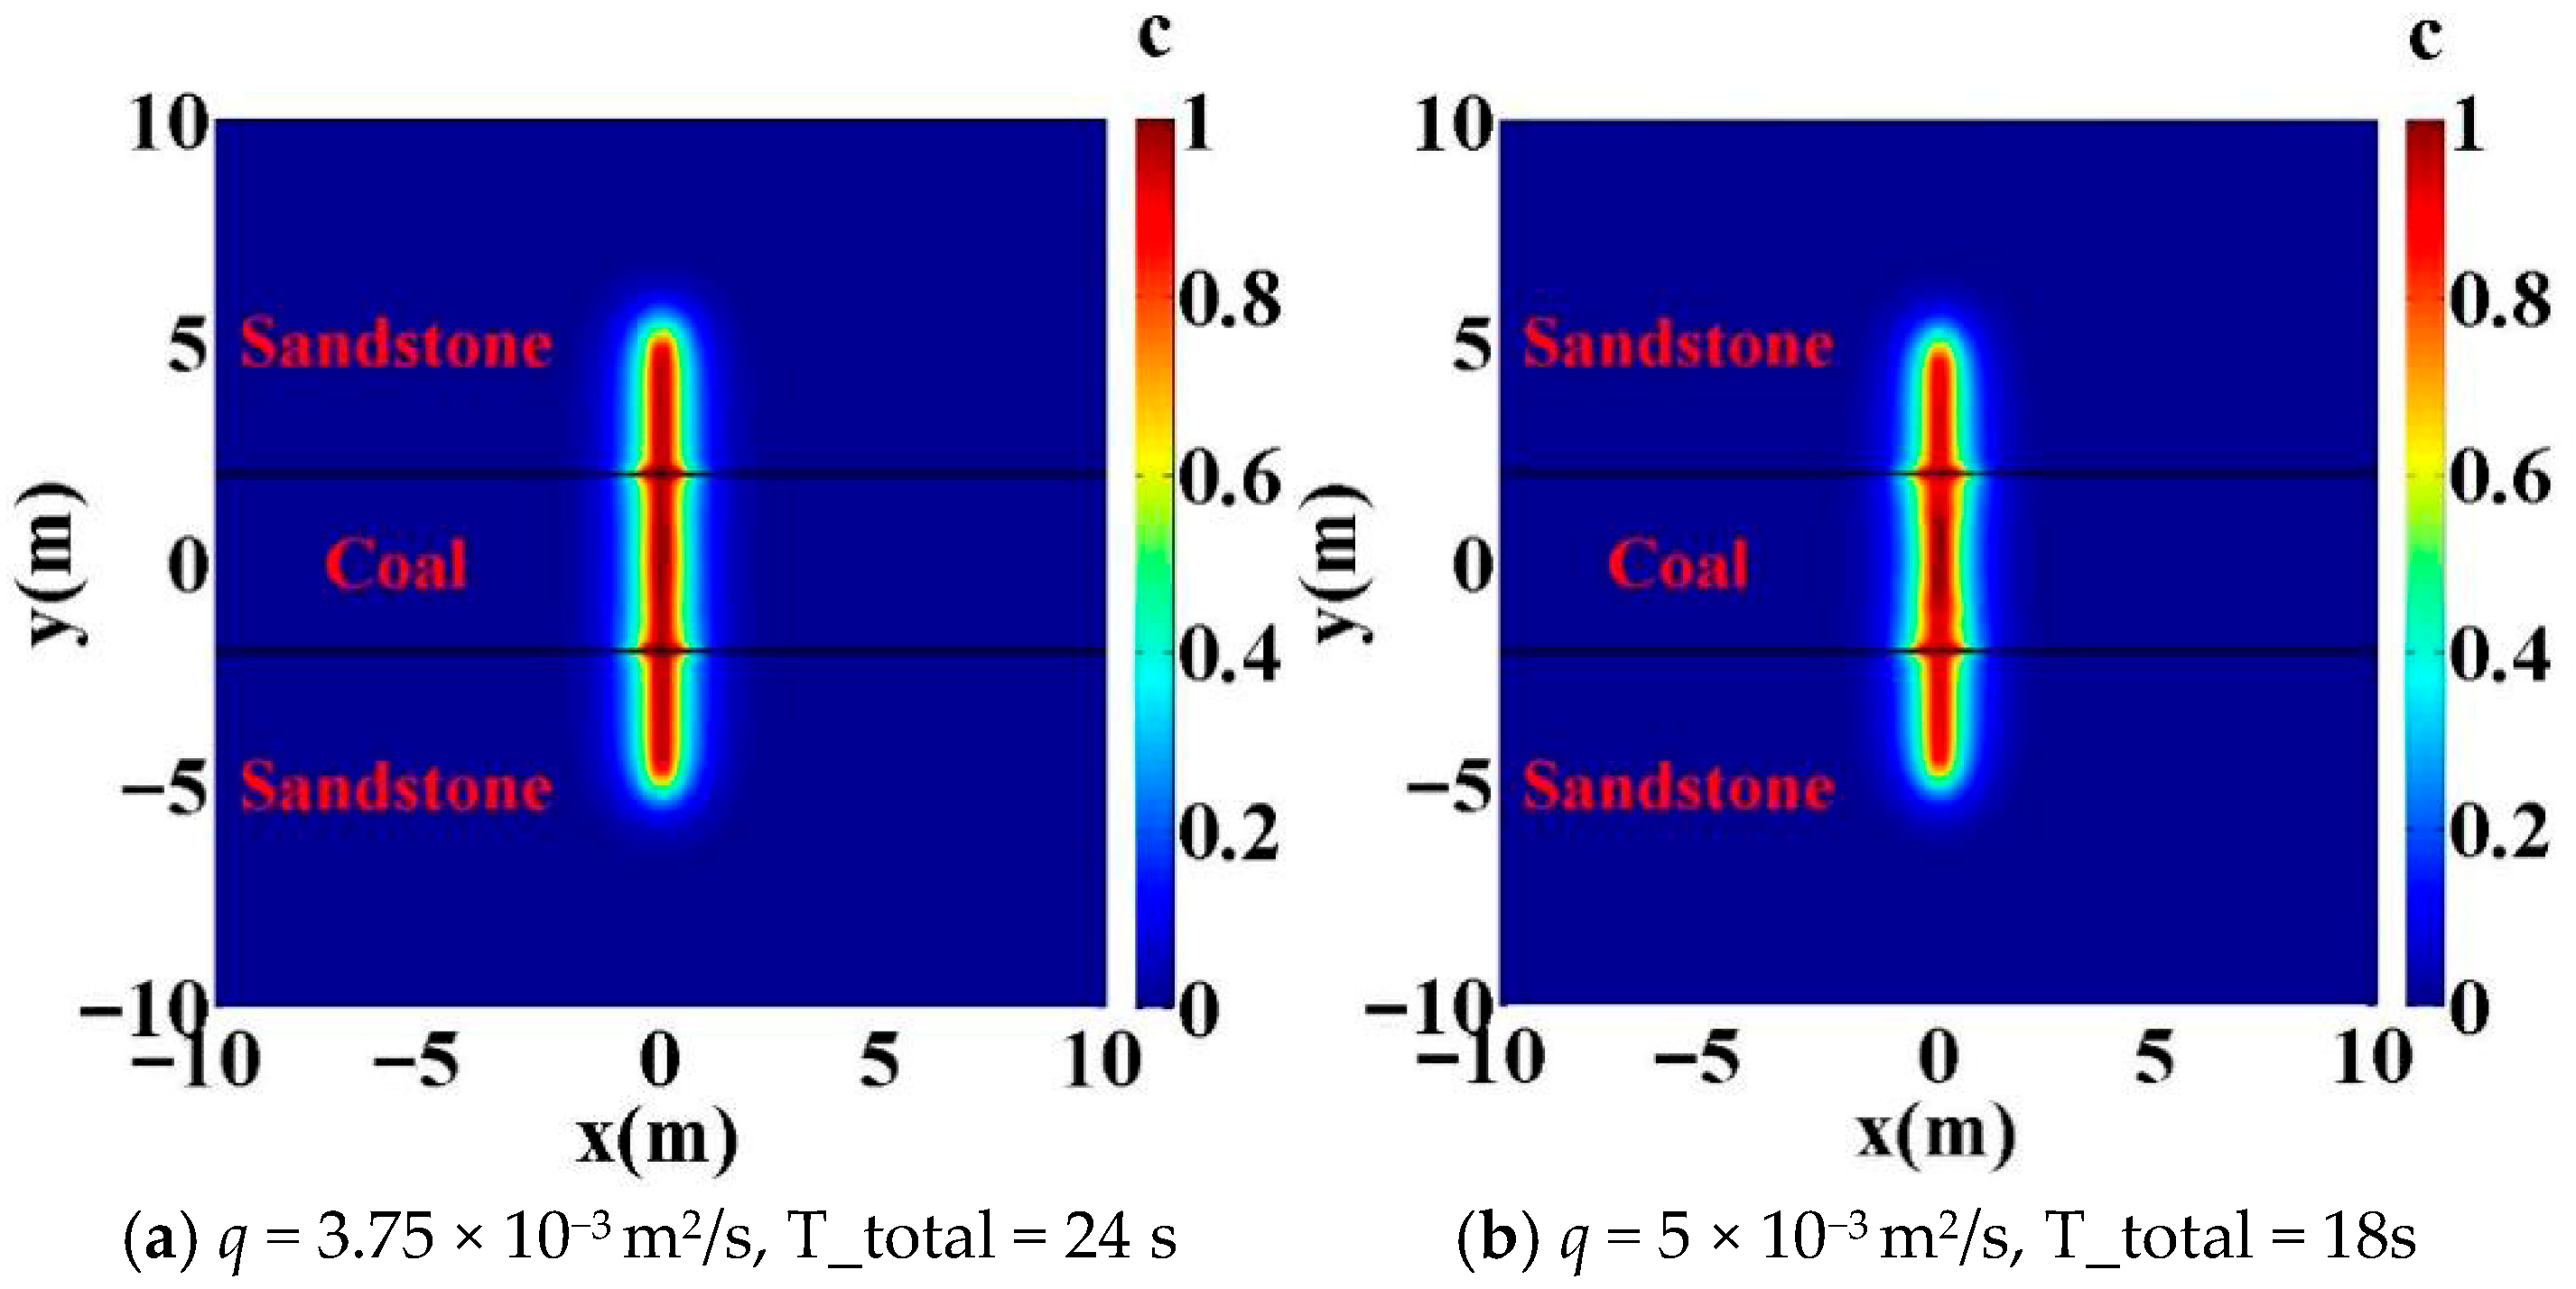
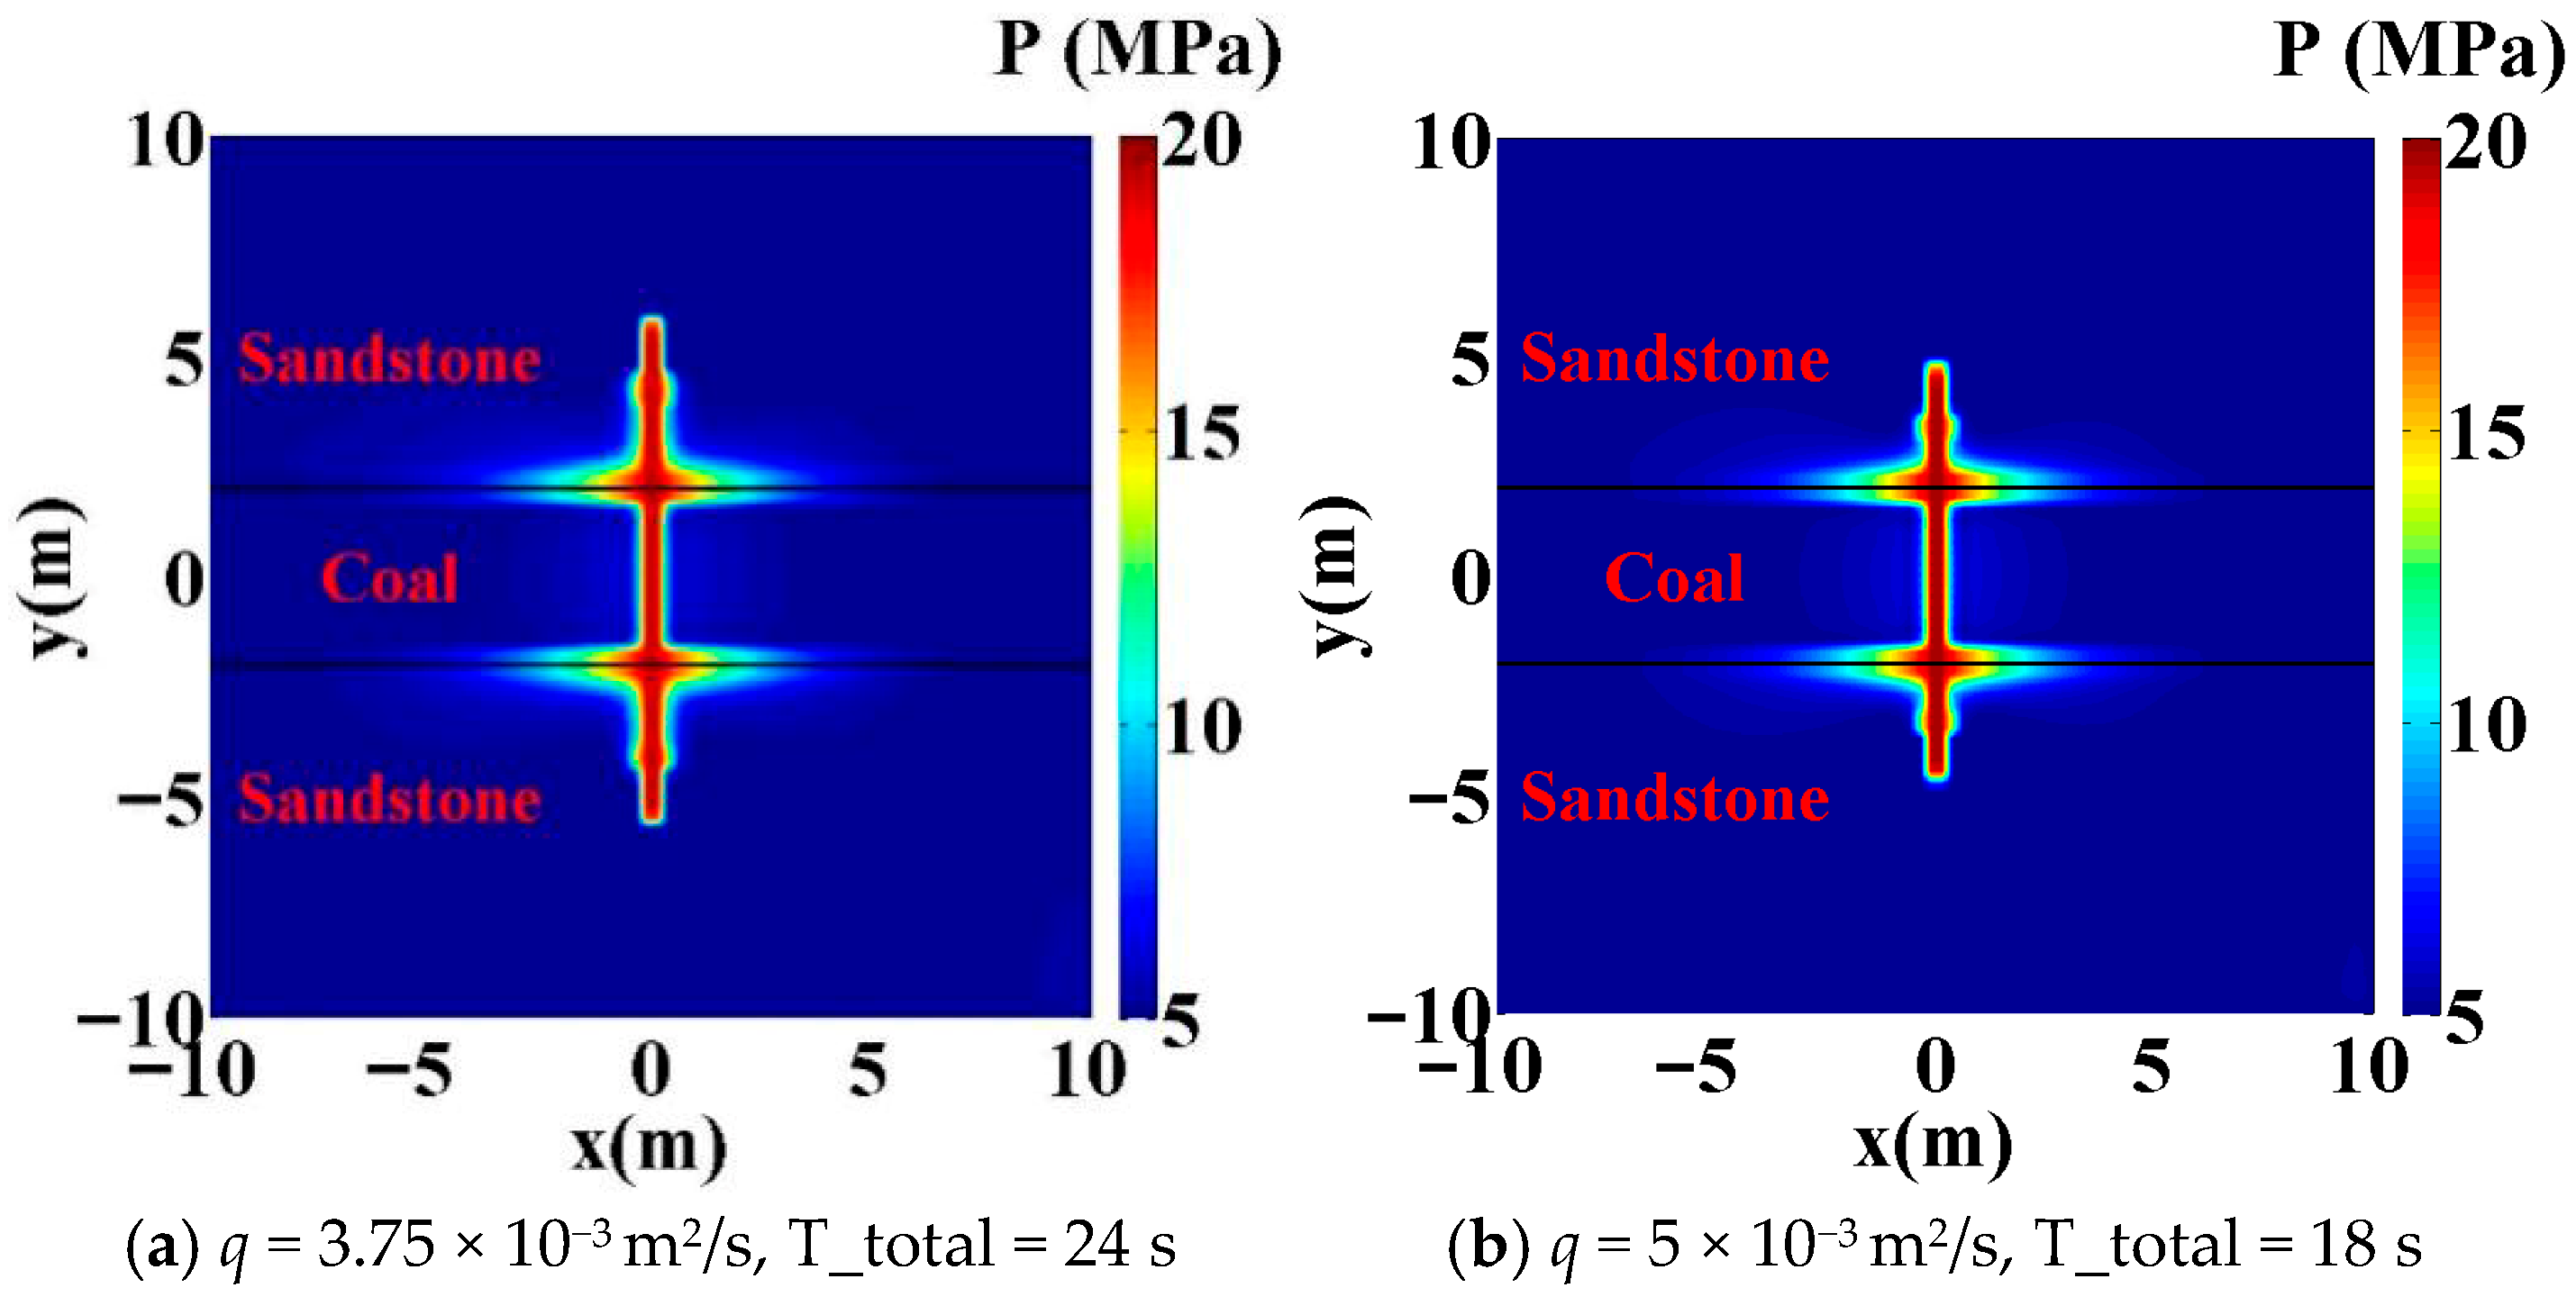
In the above three subsections, we discussed the influence of three formation parameters on fracture propagation, which are unchangeable for a given reservoir. In this subsection, we investigate the effect of the injection rate on fracture propagation, which is a parameter that we can modify. The vertical stress was set to 16 MPa. In Section 4.1, we already simulated the case with an injection rate of 2.5 × 10⁻³ m2/s (see Figure 10b, Figure 11b, and Figure 12b). For comparison, we investigated cases with injection rates of 3.75 × 10⁻³ m2/s and 5 × 10⁻³ m2/s. To ensure that the total injected volume was the same for all three examples, the corresponding total injection times T_(total) were set to 24 s and 18 s, respectively. Other input parameters can be found in Table 2.
Figure 19 shows the displacement field distribution contours for the two different injection rates. As can be seen from Figure 10b and Figure 19, increasing the injection rate facilitated hydraulic fracturing through the interface. Upon closer inspection of Figure 19, we can observe that increasing the injection rate slightly reduced the fracturing height when both rates pass through the interface. Figure 20 and Figure 21 plot the fracturing width and pressure distribution contours for the two different injection rates, respectively. It can be observed that increasing the injection rate increased the fracture width and fluid pressure within the fracture. The maximum fracture width values under the two different injection rates were 11.1 mm and 11.9 mm, respectively. The maximum fluid pressure at the end of fracturing under the two different injection rates was 19.13 MPa and 19.57 MPa, respectively.

5. Conclusions

This study proposes a new fracture phase-field evolution model for investigating hydraulic fracturing propagation in sandstone–shale interbedded formations. The key features of this model are summarized as follows: (a) Fractures only form when the element strain exceeds the rock’s critical strain. (b) The element permeability is calculated as the weighted sum of the rock’s initial permeability and the fracture permeability, with weighting coefficients that are functions of the fracture width and element size. (c) At the initial state, the interface is intact (phase-field value equals 0). The model’s convergence and stability were verified using different time steps. Based on the established model, a series of case studies were conducted to investigate the effects of in situ stress differences, the interface strength, Young’s modulus, Poisson’s ratio, and the injection rate on hydraulic fracturing propagation in sandstone–shale interbedded formations. The following conclusions can be drawn:
(1)
Higher in situ stress differences, interface strengths, Young’s moduli, and injection rates facilitate hydraulic fracturing propagation through the interface and into the barrier layer. Quantitatively, for wells with geological characteristics similar to those examined here, crossing occurred at either an in situ stress difference of 5 MPa with an injection rate ≥ 2.5 × 10⁻³ m2/s or 4 MPa with an injection rate ≥ 3.5 × 10⁻³, provided that the barrier-layer Young’s modulus was >10,000 MPa (10 GPa) and the interface strength was >1.0 MPa.
(2)
Although hydraulic fracturing may open the interface in some cases, the fracture width in the interface region is significantly smaller.
(3)
The pressure during hydraulic fracturing propagation along the interface is higher than that during direct propagation through the interface.
Implications for practice
These findings provide actionable guidance for optimizing hydraulic fracturing in sand–coal interbedded formations in China. In particular, the stage placement and treatment design can be tailored to in situ stress differences in order to either encourage controlled crossing or maintain containment along the coal seam. Injection rate selection and the real-time monitoring of the pressure signature can help diagnose interface activation and enable the adjustment of proppant and fluid schedules accordingly.
Limitations and future work
The present model assumes linear elasticity and does not incorporate plasticity, time-dependent damage evolution, or heterogeneity beyond the elastic moduli and permeability. Under high-pressure injection, actual rock behavior can be more complex due to inelastic deformation, interface frictional/cohesive behavior, permeability–stress coupling, and non-Newtonian fluid effects. Future work will relax these assumptions by (i) introducing elastoplastic or viscoelastic-damage constitutive laws for the matrix and interfaces, (ii) accounting for spatial heterogeneity in the stiffness and strength beyond the elastic moduli and permeability, and (iii) coupling to more realistic flow physics (stress-dependent permeability, non-Newtonian rheology, and proppant transport/leakoff).

Author Contributions

Methodology, X.L. and X.G.; software, L.X. and M.Z.; validation, M.Z.; formal analysis, X.G. and M.Z.; investigation, L.X.; resources, L.X.; data curation, X.G.; writing—review and editing, X.L. and Y.B.; project administration, X.L.; funding acquisition, Y.B. All authors have read and agreed to the published version of the manuscript.

Funding

This research was funded by the 2024 Heilongjiang Province “Basic Research Support Program for Outstanding Young Teachers” (grant number: YQJH2024045), the National Natural Science Foundation of China (grant number: 52474035), and the CNPC Innovation Fund (grant number: 2024DQ02-0114).

Data Availability Statement

The original contributions presented in this study are included in the article. Further inquiries can be directed to the corresponding author.

Conflicts of Interest

Authors Xuanyu Liu, Liangwei Xu, and Xianglei Guo were employed by the CNPC Great Wall Drilling Company. The remaining authors declare that the research was conducted in the absence of any commercial or financial relationships that could be construed as potential conflicts of interest.

References

  1. Zhao, H.F.; Wang, X.H.; Liu, Z.Y.; Yan, Y.J.; Yang, H.X. Investigation on the hydraulic fracture propagation of multi-layers-commingled fracturing in coal measures. J. Petrol. Sci. Eng. 2018, 167, 774–784. [Google Scholar] [CrossRef]
  2. He, J.; Zhang, X.; Ma, L.; Wu, H.; Ashraf, M. Geological Characteristics of Unconventional Gas in Coal Measure of Upper Paleozoic Coal Measures in Ordos Basin, China. Earth Sci. Res. J. 2016, 20, 1–5. [Google Scholar] [CrossRef]
  3. Zhang, Z.; Qin, Y.; Bai, J.; Fu, X.; Liu, D. Evaluation of favorable regions for multi-seam coalbed methane joint exploitation based on a fuzzy model: A case study in southern Qinshui Basin, China. Energy Explor. Exploit. 2016, 34, 400–417. [Google Scholar] [CrossRef]
  4. Hou, X.W.; Zhu, Y.M.; Fu, C.Q.; Liu, J. Fractures distribution of Qinshui basin and its indicative significance to unconventional gas co-exploration in coal measures. J. China Uni. Min. Technol. 2016, 45, 729–738. [Google Scholar]
  5. Warpinski, N.R.; Schmidt, R.A.; Northrop, D.A. In-Situ Stresses: The Predominant Influence on Hydraulic Fracture Containment. J. Pet. Technol. 1982, 34, 653–664. [Google Scholar] [CrossRef]
  6. Teufel, L.W.; Warpinski, N.R. In-situ stress variations and hydraulic fracture propagation in layered rock-observations from a mineback experiment. In Proceedings of the 5th ISRM Congress, Melbourne, Australia, 10–15 April 1983. [Google Scholar]
  7. Teufel, L.W.; Clark, J.A. Hydraulic Fracture Propagation in Layered Rock: Experimental Studies of Fracture Containment. Soc. Pet. Eng. J. 1984, 24, 19–32. [Google Scholar] [CrossRef]
  8. Meng, S.Z.; Hou, B.; Zhang, J.; Peng, T. Experimental research on hydraulic fracture propagation through mixed layers of shale, tight sand and coal seam. J. China Coal Soc. 2016, 41, 221–227. (In Chinese) [Google Scholar]
  9. Yang, J.S.; Wang, Y.B.; Li, A.Q.; Chen, Z.H. Experimental study on propagation mechanism of complex hydraulic fracture in coal-bed. J. China Coal Soc. 2012, 37, 73–77. (In Chinese) [Google Scholar]
  10. Li, D.Q.; Zhang, S.C.; Zhang, S.A. Experimental and numerical simulation study on fracturing through interlayer to coal seam. J. Nat. Gas Sci. Eng. 2014, 21, 386–396. [Google Scholar] [CrossRef]
  11. Tan, P.; Jin, Y.; Han, K.; Zheng, X.; Hou, B.; Gao, J.; Chen, M.; Zhang, Y. Vertical propagation behavior of hydraulic fractures in coal measure strata based on true triaxial experiment. J. Pet. Sci. Eng. 2017, 158, 398–407. [Google Scholar] [CrossRef]
  12. Zhao, H.; Chen, M. Extending behavior of hydraulic fracture when reaching formation interface. J. Pet. Sci. Eng. 2010, 74, 26–30. [Google Scholar] [CrossRef]
  13. Zhang, X.; Jeffrey, R.G.; Thiercelin, M. Deflection and propagation of fluid-driven fractures at frictional bedding interfaces: A numerical investigation. J. Struct. Geol. 2007, 29, 396–410. [Google Scholar] [CrossRef]
  14. Tang, J.; Wu, K.; Li, Y.; Hu, X.; Liu, Q.; Ehlig-Economides, C. Numerical investigation of the interactions between hydraulic fracture and bedding planes with non-orthogonal approach angle. Eng. Fract. Mech. 2018, 200, 1–16. [Google Scholar] [CrossRef]
  15. Guo, J.; Luo, B.; Lu, C.; Lai, J.; Ren, J. Numerical investigation of hydraulic fracture propagation in a layered reservoir using the cohesive zone method. Eng. Fract. Mech. 2017, 186, 195–207. [Google Scholar] [CrossRef]
  16. Wang, H.; Liu, H.; Wu, H.A.; Wang, X.X. A 3D numerical model for studying the effect of interface shear failure on hydraulic fracture height containment. J. Pet. Sci. Eng. 2015, 133, 280–284. [Google Scholar] [CrossRef]
  17. Tan, P.; Jin, Y.; Xiong, Z.; Mian, C.; Hou, B. Effect of interface property on hydraulic fracture vertical propagation behavior in layered formation based on discrete element modeling. J. Geophys. Eng. 2018, 15, 1542–1550. [Google Scholar] [CrossRef]
  18. Abbas, S.E.; Gordeliy, E.; Peirce, A.; Lecampion, B.; Chuprakov, D.; Prioul, R. Limited height growth and reduced opening of hydraulic fractures due to fracture offsets: An XFEM application. In Proceedings of the SPE Hydraulic Fracturing Technology Conference, The Woodlands, TX, USA, 4–6 February 2014. [Google Scholar]
  19. Bourdin, B.; Francfort, G.A.; Marigo, J.J. The variational approach to fracture. J. Elasticity 2008, 91, 5–148. [Google Scholar] [CrossRef]
  20. Borden, M.J.; Verhoosel, C.V.; Scott, M.A.; Hughes, T.J.; Landis, C.M. A phase-field description of dynamic brittle fracture. Comput. Methods Appl. Mech. Eng. 2012, 217–220, 77–95. [Google Scholar] [CrossRef]
  21. Miehe, C.; Welschinger, F.; Hofacker, M. Thermodynamically consistent phase-field models of fracture: Variational principles and multi-field FE implementations. Int. J. Numer. Methods Eng. 2010, 83, 1273–1311. [Google Scholar] [CrossRef]
  22. Miehe, C.; Hofacker, M.; Welschinger, F. A phase field model for rate-independent crack propagation: Robust algorithmic implementation based on operator splits. Comput. Methods Appl. Mech. Eng. 2010, 199, 2765–2778. [Google Scholar] [CrossRef]
  23. Guo, J.; Lu, Q.; Chen, H.; Wang, Z.; Tang, X.; Chen, L. Quantitative phase field modeling of hydraulic fracture branching in heterogeneous formation under anisotropic in-situ stress. J. Nat. Gas Sci. Eng. 2018, 56, 455–471. [Google Scholar] [CrossRef]
  24. Nguyen, T.; Yvonnet, J.; Zhu, Q.-Z.; Bornert, M.; Chateau, C. A phase field method to simulate crack nucleation and propagation in strongly heterogeneous materials from direct imaging of their microstructure. Eng. Fract. Mech. 2015, 139, 18–39. [Google Scholar] [CrossRef]
  25. Nguyen, T.; Yvonnet, J.; Zhu, Q.-Z.; Bornert, M.; Chateau, C. A phase-field method for computational modeling of interfacial damage interacting with crack propagation in realistic microstructures obtained by microtomography. Comput. Methods Appl. Mech. Eng. 2016, 312, 567–595. [Google Scholar] [CrossRef]
  26. Miehe, C.; Schänzel, L.-M.; Ulmer, H. Phase field modeling of fracture in multi-physics problems. Part I. Balance of crack surface and failure criteria for brittle crack propagation in thermo-elastic solids. Comput. Methods Appl. Mech. Eng. 2015, 294, 449–485. [Google Scholar] [CrossRef]
  27. Miehe, C.; Hofacker, M.; Schänzel, L.-M.; Aldakheel, F. Phase field modeling of fracture in multi-physics problems. Part II. Coupled brittle-to-ductile failure criteria and crack propagation in thermo-elastic–plastic solids. Comput. Methods Appl. Mech. Eng. 2015, 294, 486–522. [Google Scholar] [CrossRef]
  28. Miehe, C.; Mauthe, S. Phase field modeling of fracture in multi-physics problems. Part III. Crack driving forces in hydro-poro-elasticity and hydraulic fracturing of fluid-saturated porous media. Comput. Methods Appl. Mech. Eng. 2016, 304, 619–655. [Google Scholar] [CrossRef]
  29. Mauthe, S.; Miehe, C. Hydraulic fracture in poro-hydro-elastic media. Mech. Res. Commun. 2017, 80, 69–83. [Google Scholar] [CrossRef]
  30. Xia, L.; Yvonnet, J.; Ghabezloo, S. Phase field modeling of hydraulic fracturing with interfacial damage in highly heterogeneous fluid-saturated porous media. Eng. Fract. Mech. 2017, 186, 158–180. [Google Scholar] [CrossRef]
  31. Mikelić, A.; Wheeler, M.F.; Wick, T. A Phase-Field Method for Propagating Fluid-Filled Fractures in a Poroelastic Medium. Multiscale Model. Simul. 2015, 13, 367–398. [Google Scholar] [CrossRef]
  32. Lee, S.; Wheeler, M.F.; Wick, T. Pressure and Fluid-Driven Fracture Propagation in Porous Media Using an Adaptive Finite Element Phase Field Model. Comput. Methods Appl. Mech. Eng. 2016, 305, 111–132. [Google Scholar] [CrossRef]
  33. Chukwudozie, C.; Bourdin, B.; Yoshioka, K. A Variational Phase-Field Model for Hydraulic Fracturing in Porous Media. Comput. Methods Appl. Mech. Eng. 2019, 347, 957–982. [Google Scholar] [CrossRef]
  34. Yoshioka, K.; Naumov, D.; Kolditz, O. On Crack Opening Computation in Variational Phase-Field Models for Fracture. Comput. Methods Appl. Mech. Eng. 2020, 369, 113210. [Google Scholar] [CrossRef]
  35. Yoshioka, K.; Mollaali, M.; Kolditz, O. Variational Phase-Field Fracture Modeling with Interfaces. Comput. Methods Appl. Mech. Eng. 2021, 384, 113951. [Google Scholar] [CrossRef]
  36. Arriaga, M.; Waisman, H. Stability analysis of the phase-field method for fracture with a general degradation function and plasticity induced crack generation. Mech. Mater. 2018, 116, 33–48. [Google Scholar] [CrossRef]
  37. Shen, R.; Waisman, H.; Guo, L. Fracture of viscoelastic solids modeled with a modified phase field method. Comput. Methods Appl. Mech. Eng. 2019, 346, 862–890. [Google Scholar] [CrossRef]
  38. Adim, A.; Riahi, M.; Bagheri, M. Estimation of Pore Pressure by Eaton and Bowers Methods Using Seismic and Well Survey Data. J. Appl. Geophys. Res. 2018, 4, 267–275. [Google Scholar]
  39. She, C.; Peng, H.; Yang, J.; Peng, J.; Han, H.; Yang, X.; Peng, Y. Experimental study on the true triaxial fracturing of tight sandstone with supercritical CO2 and slickwater. Geoenergy Sci. Eng. 2023, 228, 211977. [Google Scholar] [CrossRef]
  40. Wu, X.; Guo, Y.; Chang, X.; Bi, Z.; Zhao, G.; Yang, H.; Guo, W. Experimental Study on Cyclic Hydraulic Fracturing of Tight Sandstone under High-Stress Conditions. Processes 2023, 11, 875. [Google Scholar] [CrossRef]
  41. Su, H.; Li, R.; Deng, H.; Qin, Y.; Fu, M.; He, J.; Zeng, Q.; Song, L.; Zhang, J. Comprehensive Evaluation of Geological and Engineering Factors Affecting Fracturing Effectiveness in Tight Sandstone Reservoirs. Pet. Geol. Exp. 2024, 46, 1349–1361. [Google Scholar] [CrossRef]
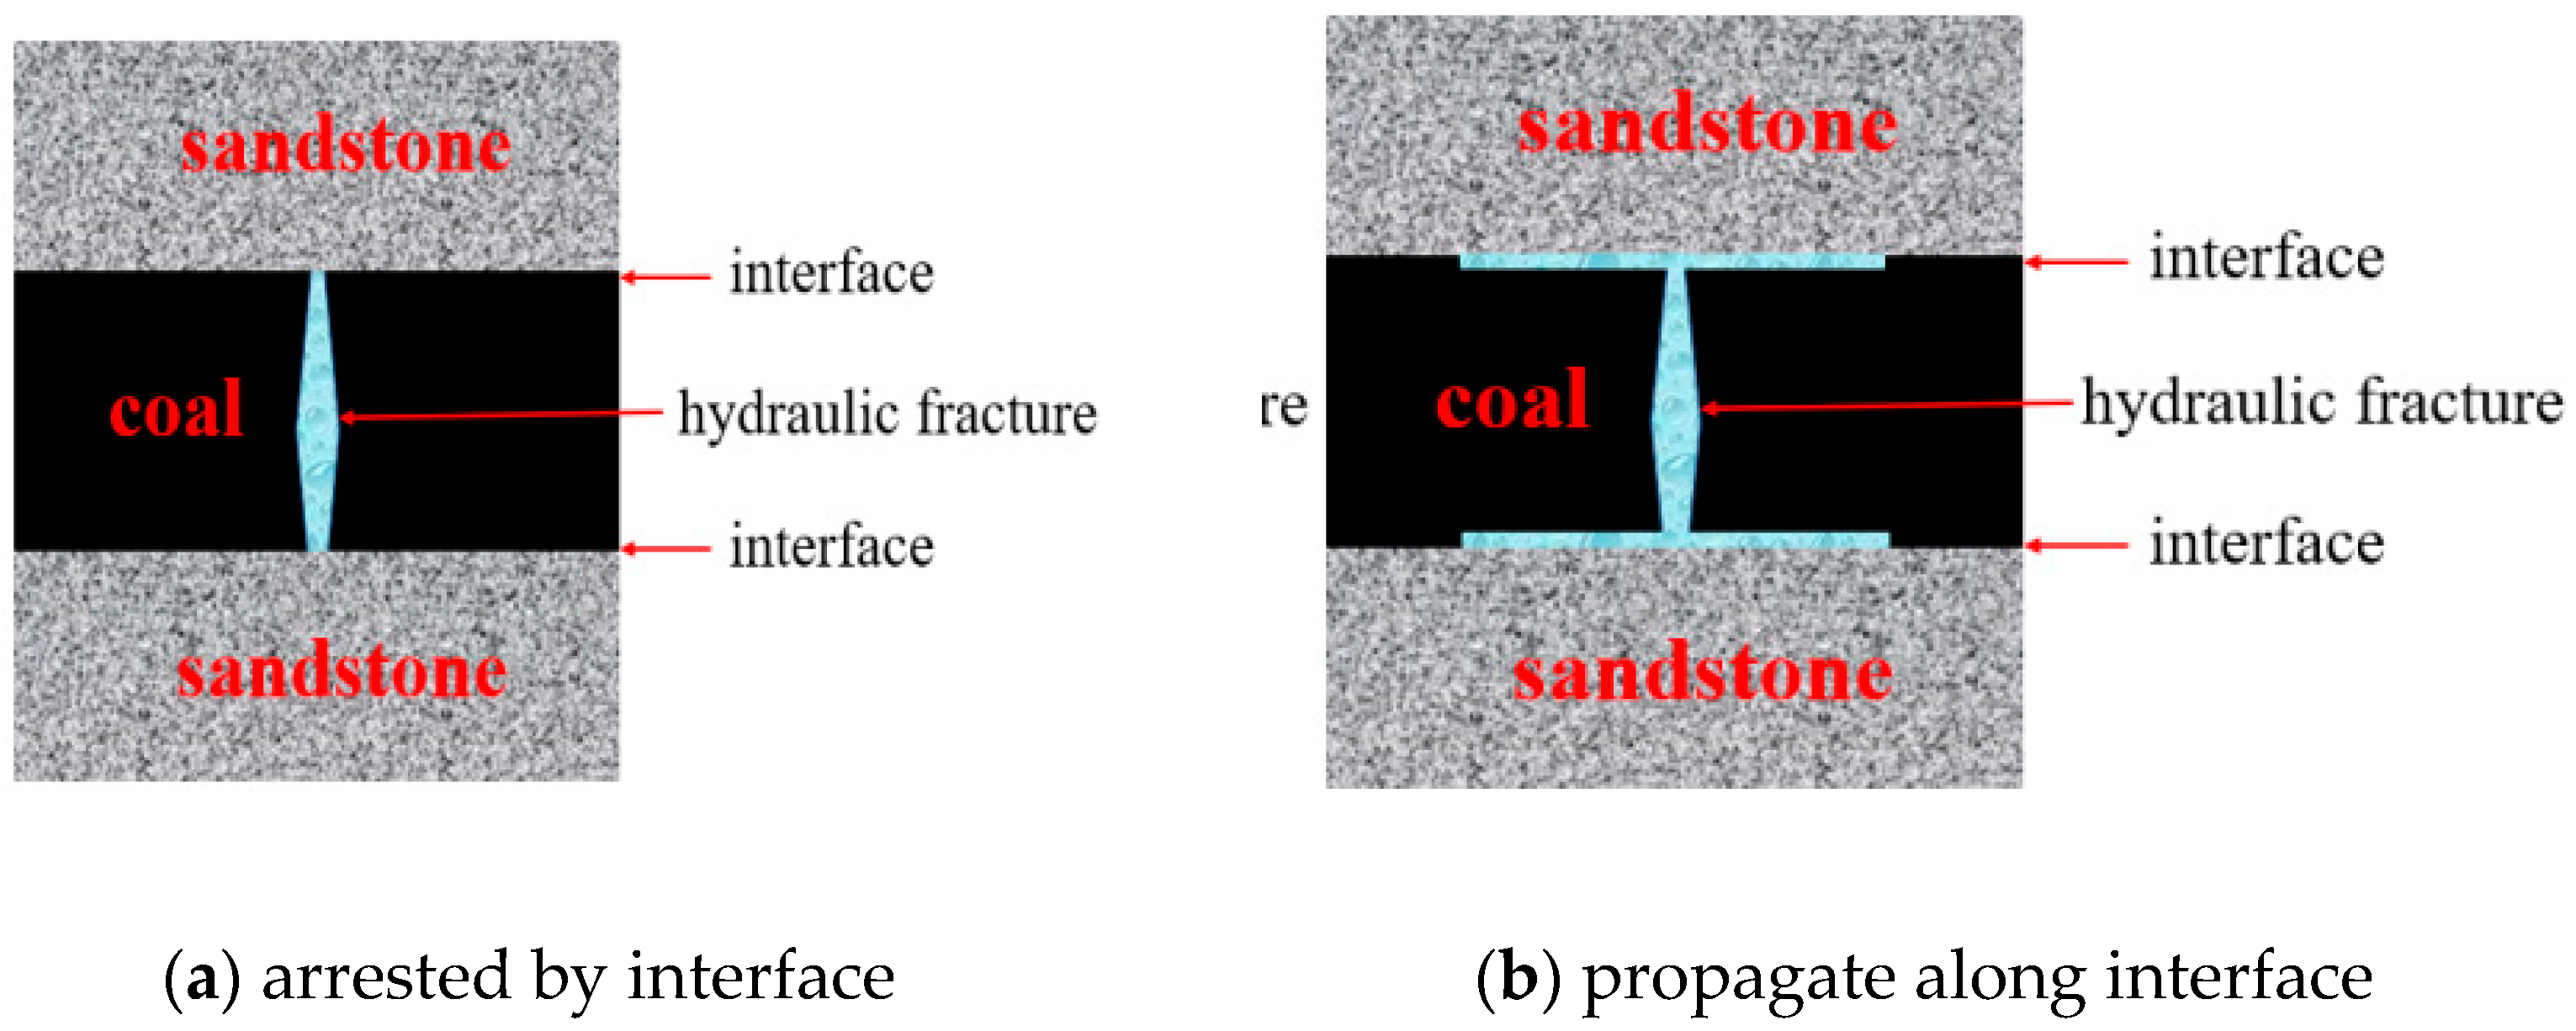
Figure 1. Geometric morphology of hydraulic fractures being blocked by the interface and propagating along the interface.
Processes 13 03128 g001
Figure 2. Schematic diagram of the phase-field method [31,32].
Processes 13 03128 g002
Figure 3. Schematic diagram of anisotropic fluid flow in each unit.
Processes 13 03128 g003
Figure 4. Flowchart of the calculation program.
Processes 13 03128 g004
Figure 5. Schematic diagram of the computational domain and boundary conditions used in the model convergence and stability study example.
Processes 13 03128 g005
Figure 6. Phase-field distribution profiles at the end of injection for three different time steps.
Processes 13 03128 g006
Figure 7. Changes in pressure at point a (as shown in Figure 5) over time for three different time steps.
Processes 13 03128 g007
Figure 8. Changes in pressure at point a (as shown in Figure 5) over time for three different time steps.
Processes 13 03128 g008
Figure 9. Computational domain and boundary conditions used in the example.
Processes 13 03128 g009
Figure 10. Phase-field distribution profiles at the end of injection under three different ground stress conditions.
Processes 13 03128 g010
Figure 11. Curves showing the distribution of crack widths at the end of injection under three different ground stress conditions.
Processes 13 03128 g011
Figure 12. Pressure distribution curves at the end of injection under three different ground stress conditions.
Processes 13 03128 g012
Figure 13. Pressure-phase-field distribution curves injected at two different interface strengths.
Processes 13 03128 g013
Figure 14. Crack width distribution curves at the end of injection under two different interface strengths.
Processes 13 03128 g014
Figure 15. Pressure distribution curves at the end of injection under two different interface strengths.
Processes 13 03128 g015
Figure 16. Phase-field distribution profiles at the end of injection for two different Young’s moduli and Poisson’s ratios.
Processes 13 03128 g016
Figure 17. Crack width distribution at the end of injection under two different Young’s moduli and Poisson’s ratios.
Processes 13 03128 g017
Figure 18. Pressure distribution curves at the end of injection under two different Young’s moduli and Poisson’s ratios.
Processes 13 03128 g018
Figure 19. Phase-field distribution profiles at the end of injection under two different injection speeds.
Processes 13 03128 g019
Figure 20. Curve showing the distribution of the fracture width at the end of fracturing under two different injection rates.
Processes 13 03128 g020
Figure 21. Pressure distribution curves at the end of injection under two different injection rates.
Processes 13 03128 g021
Table 1. Comparison of phase-field-based hydraulic fracturing models.
RepresentativeFracture Normal and CriterionFlow in FracturePermeability Mapping
Andro Mikelić [31]Normal from phase-field gradient; variational energy frameworkLubrication/PoiseuilleOften treats fracture flow as a separate channel; not a direct k(d) mapping
Sanghyun Lee [32]Phase field normal; embedded in porous matrixLubrication or equivalent Darcy along the fractureFrequently derives transmissivity from aperture; some variants use damage-based k(d)
Chukwudozie [33]Variational phase field; path from energy minimizationLubrication coupled consistently to the fracture setEmphasizes energy-consistent fracture description rather than isotropic k(d)
Yoshioka et al. (≈2019–2021) [34]Phase-field framework; extracts aperture from displacement/phase fieldLubrication requires stable, explicitly computed apertureWarns that direct damage-to-permeability mapping can be distortive; favors width-based coupling
Table 2. Stratigraphic parameters used in examples of convergence and stability studies.
Parameter NameParametersNumerical Value
Critical stressσc1 MPa
Young’s modulusE6000 MPa
Undrained Poisson’s ratiovu0.3
Poisson’s ratiov0.25
Matrix permeabilitykmatrix0.1 mD
Viscosity of fluidsμ1 × 10⁻³ Pa·s
Table 3. Numerical simulation case input parameters.
Parameter NameParameterNumerical Value
Critical stress of sand particlesσc_sandstone3 MPa
Critical stress of coalσc_coal1 MPa
Interfacial critical stressσc_interface0.5 MPa
Young’s modulus of sandstoneE_sandstone22,000 MPa
Young’s modulus of coalE_coal6000 MPa
Poisson’s ratio of sandstonev_sandstone0.17
Poisson’s ratio of coalv_coal0.25
Permeability of sandstonek0_sandstone1 mD
Permeability of coalk0_coal0.1 mD
Interface permeabilityk0_interface50 mD
Initial pore fluid pressurepinitial5 MPa
Fluid viscosityμ1 × 10⁻³ Pa·s
Time stepΔt3 s
Total injection timeT_total36 s
Injection rateq2.5 × 10−3 m2/s
Mesh sizehe0.25 m
Process area parametersl00.5 m
Disclaimer/Publisher’s Note: The statements, opinions and data contained in all publications are solely those of the individual author(s) and contributor(s) and not of MDPI and/or the editor(s). MDPI and/or the editor(s) disclaim responsibility for any injury to people or property resulting from any ideas, methods, instructions or products referred to in the content.