Article

A Holistic Assessment of Water Quality in the Lake and Rivers of Lake Chaohu Basin, China

1
State Key Laboratory of Water Cycle and Water Security, China Institute of Water Resources and Hydropower Research, Beijing 100038, China
2
Key Laboratory of Water Safety for Beijing-Tianjin-Hebei Region of Ministry of Water Resources, Beijing 100038, China
3
College of Ecology and Natural Resources Environment, Dezhou University, Dezhou 253023, China
*
Author to whom correspondence should be addressed.
Processes 2025, 13(10), 3125; https://doi.org/10.3390/pr13103125
Submission received: 1 September 2025 / Revised: 26 September 2025 / Accepted: 27 September 2025 / Published: 29 September 2025
(This article belongs to the Special Issue Advances in Hydrodynamics, Pollution and Bioavailable Transfers)

Abstract

The Lake Chaohu Basin (LCB) represents a focal point for water pollution control in China, and its water quality status has drawn substantial attention. We conducted a holistic assessment of water quality using the water quality index (WQI) in the LCB based on monthly measurements of 13 water quality parameters at 16 stations during 2016–2020. We observed a general upward trend in the annual average WQI for Lake Chaohu, suggesting an improvement in water quality. A notable shift in the spatial pattern of water quality was observed. The annual average WQI for inflowing rivers also exhibited an overall upward trend. The WQIs of the lake and inflowing rivers, particularly in the western lake, exhibited a significant positive correlation, suggesting that the water quality of the inflowing rivers is a crucial factor influencing the water quality of Lake Chaohu. The crucial water quality parameters influencing the WQI of the LCB included ammonia nitrogen, total phosphorus, total nitrogen, dissolved oxygen, and permanganate index, which were used to construct a minimum WQI (WQImin). The WQImin showed outstanding performance in the LCB. The findings of this study could deepen the understanding of water quality patterns and the response of lake water quality to inflowing river water quality within lake-type basins.

1. Introduction

Lakes are critical components of the global ecosystem with substantial ecological and societal value [1,2,3]. However, the effects of human activities and climate change threaten the water quality of lakes worldwide [4,5,6]. To maintain the ecological, societal, and economic functions of lakes, effective strategies are urgently needed to safeguard lake water quality [7,8,9,10]. Inflowing rivers within the watershed are crucial sources of lake water [11,12]; however, these rivers can transport pollutants, such as nutrients and organic matter, which can impact the hydrology, water quality, and nutrient status of the lake. Watershed pollutants serve as crucial external sources leading to lake water pollution, with inflowing rivers being the primary channels through which these pollutants enter lakes [13,14,15]. Therefore, a systematic evaluation of water quality across both lakes and inflowing rivers at the watershed scale is needed to effectively deal with the challenges of pollution in the watershed.
The analysis of water quality parameters can quantitatively reveal the status, spatiotemporal patterns, and trends in water quality; aid in identifying key drivers; and inform the development of appropriate policies and management strategies for pollution control [11,12]. Various methods exist for evaluating water quality based on water quality parameters, including single-factor assessment and the water quality index (WQI) [16,17,18,19]. The WQI has been widely employed since the 1960s due to its advantages in effectively integrating water quality metrics and quantitatively estimating water quality [20,21,22,23]. Hou et al. [21] used the WQI in an assessment of five reservoirs in the lower reaches of the Yellow River. Qu et al. [24] employed the WQI to analyze the spatiotemporal changes in the water quality of key lakes affected by water diversion in the Eastern Route of the South-to-North Water Diversion Project. Nong et al. [25] applied the WQI to investigate the spatiotemporal patterns in the water quality of the main canal in the Central Route of the South-to-North Water Diversion Project. Wu et al. [11] employed the WQI to examine the spatiotemporal features of water quality in Lake Hulun and identified areas sensitive to changes in water quality. Ni et al. [26] used the WQI to assess the water quality status of the Muling-Xingkai watershed and proposed water management suggestions. Faruq et al. [27] investigated the effects of land use on the water quality of urban water bodies by using the WQI. The WQImin, an adaptation of the WQI, represents a simplified and effective modern approach for water quality assessment. WQImin has gained considerable attention and has been successfully applied [28,29], for example, in assessing the rivers within the Lake Taihu [30], Lake Chaohu basins (LCB) [31], and the Yangtze River [32]. The WQImin relies on a limited set of representative parameters to eliminate redundant information and improve assessment turnaround and accuracy while reducing costs [33]. However, holistic assessments of lake and river water quality at the watershed scale are limited, with most studies focusing on either lakes or rivers, but not both [24,30].
Lake Chaohu, an important lake in China, has been the focus of water pollution control efforts in China [34,35]. The LCB has 33 rivers, among which nine are major inflowing and outflowing rivers. The inflowing rivers include the Nanfeihe, Shiwulihe, Paihe, Hangbuhe, Zhegaohe, Shuangqiaohe, Zhaohe, and Baishitianhe, while the Yuxi River is outflowing [36]. With the increasing population and rapid development of industrial and agricultural production, increasing amounts of urban industrial wastewater and domestic sewage are released into the watershed. This pollution has severely degraded the water quality of the Nanfei, Shiwuli, and Pai rivers. Consequently, an increase in nutrient salts and organic matter has been observed in Lake Chaohu, which promotes eutrophication [37,38,39]. Recent efforts in water pollution control in the LCB have made some improvements to the overall water quality in the watershed, but they have also led to substantial variation in the spatiotemporal patterns of water quality [40,41]. Some studies have analyzed the spatiotemporal patterns of water quality in the rivers of the LCB. Using water quality data from rivers in the LCB in 2018, Wu et al. [31] analyzed the spatiotemporal variations in river water quality based on a WQImin. They showed that the WQImin effectively and rapidly estimated river water quality in the LCB. However, further investigation is needed to elucidate the long-term dynamics of water quality in complex lake-type basins at the watershed scale. To characterize the relationships between water bodies in the LCB, it would be necessary to examine the spatial, interannual, and seasonal patterns in the water quality of both the lake and its inflowing rivers. Only through this holistic approach can adequate and effective support be provided for watershed water pollution prevention and control efforts. Therefore, the novelty of this study is to attempt to reveal the impact of the inflowing rivers’ water quality on Lake Chaohu by using the WQI method and propose targeted solutions for water pollution control in the LCB.
This study used monthly water quality data collected from 16 stations in the LCB during 2016–2020 to comprehensively evaluate the water quality of both the lake and inflowing rivers by using WQI and WQImin. Our primary objectives were to (1) characterize the spatiotemporal patterns in water quality in Lake Chaohu and the inflowing rivers; (2) reveal the relationship between the lake and inflowing rivers regarding water quality; (3) identify crucial drivers of water quality and establish a WQImin for rapid water quality evaluation; and (4) provide recommendations for water pollution control in the LCB. Our findings elaborate on the spatiotemporal patterns of water quality in lake-type basins and offer essential empirical support for the development of watershed protection and management policies.

2. Materials and Methods

2.1. Study Area

The LCB is situated in the middle and lower reaches of the Yangtze River, Anhui Province, China (Figure 1). The LCB covers an area of 9258 km2, with the lake itself spanning 787 km2. The lake is typically divided into the eastern part, the central part, and the western part [42]. Among the major inflowing rivers, the Hangbu, Nanfei, Baishitian, and Pai rivers collectively contribute 85% of the total inflow. The Hangbu River alone contributes 55%, while the Nanfei, Baishitian, and Pai rivers each contribute 10% [43]. The LCB falls under a subtropical humid monsoon climate, characterized by a yearly average temperature of 16 °C, an average evaporation rate of 1400–1650 mm, and annual precipitation of 1032 mm. These are 16 water quality monitoring points—8 within the lake area and 8 along the inflowing rivers (the outflowing Yuxi River has one monitoring point, but is not within the scope of our study). Monitoring points above are routine and official, which were established and maintained by the environmental authorities of Anhui Province. Monitoring points L1–L3 are located in the western lake, L4 and L5 in the central lake, and L6–L8 in the eastern lake, which can represent the water quality of the lake. Monitoring points R1–R8 are located in the Nanfeihe, Shiwulihe, Paihe, Hangbuhe, Baishitianhe, Zhaohe, Shuangqiaohe, and Zhegaohe, respectively. Monitoring points R1–R8 are the closest river measurement points to the entrance of the lake, which can reflect the water quality of the rivers accurately.

2.2. Data Collection

To conduct a holistic assessment, we collected monthly water quality measured data of all 16 monitoring point stations from 2016 to 2020, considering the accessibility and representativeness of data. The data were sourced from the environmental authorities of Anhui Province. The measured parameters included pH, DO (mg/L), CODMn (mg/L), 5-d biochemical oxygen demand (BOD5, mg/L), ammonia nitrogen (NH3-N, mg/L), total phosphorus (TP, mg/L), total nitrogen (TN, mg/L), copper (Cu, μg/L), zinc (Zn, μg/L), fluoride (F, mg/L), selenium (Se, μg/L), arsenic (As, μg/L), and mercury (Hg, μg/L). Water sample collection and analysis was performed in line with the Environmental Quality Standards for Surface Water [44]. pH was measured by using glass electrode method, DO by electrochemical probe method, CODMn by acidic titration method, BOD5 by dilution inoculation method, NH3-N by salicylic acid spectrophotometry method, TP by ammonium molybdate spectrophotometry method, TN by UV spectrophotometry method, Cu by atomic absorption spectrophotometry method, Zn by atomic absorption spectrophotometry method, F by fluorine reagent spectrophotometry method, Se by atomic absorption spectrophotometry method, As and Hg by cold atomic fluorescence method.

2.3. WQI and WQImin Calculations

The WQI was calculated as shown in Equation (1) [29]. The monthly-scale WQI was computed using measured monthly data, applying Equation (1). Based on the annual or multi-year averages of the monthly data, we also calculated the annual- or multi-year-scale WQI using Equation (1).
W Q I = i = 1 n ( C i P i ) i = 1 n P i
where W Q I is the score of water quality, a dimensionless value, the range of it is 0–100; n represents the total number of water quality parameters; C i and P i are the normalized value and weight of parameter i , respectively. The range of P i is between 1 and 4, with the specific values determined as previously described [25,31,45], which were determined mainly based on the importance of parameters for water quality. DO, CODMn, BOD5, NH3-N, TP, TN are the important parameters. DO is an important indicator of whether a water body can maintain ecosystem balance and can provide a lot of information about water quality, so its P i value is the highest. TP and TN can reflect the overall nutritional status of a water body, so their values are relatively high. CODMn and BOD5 can reflect the pollution level of organic matter, and NH3-N is the preferred form of nitrogen for algae growth; therefore, their values are higher than the remaining 6 parameters. So, P i of pH, DO, CODMn, BOD5, NH3-N, TP, TN, Cu, Zn, F, Se, As, Hg is 1, 4, 2, 2, 2, 3, 3, 1, 1, 1, 1, 1, respectively. C i was calculated using Equation (2) [21,25].
C i = 100 T i S i , k ( S i , k + n S i , k ) × 20 j + I i , k , T i [ S i , k , S i , k + n ) 100 T i S i , k + n × 20 j   , T i [ 0   , S i , k )
where T i is the monitored concentration for water quality parameter i ; S i , k and S i , k + n are the thresholds of parameter i at level k and k + j in the Environmental Quality Standards for Surface Water [44], respectively; I i , k is the normalized value of parameter i at level k ; and j is the number of same values of the threshold; if no same threshold existed then n = 1 . The water quality status was divided into five levels according to the WQI value [46]: bad, <25; low, ≥25 and <50; moderate, ≥50 and <70; good, ≥70 and <90; and excellent, ≥90.
The WQI was treated as the dependent variable, while the C i for each parameter was considered an independent variable. A stepwise multiple linear regression [25,30] was employed to identify the key drivers of changes in the WQI, from which the WQImin model was constructed using Equation (1).

2.4. Statistical Analysis

SPSS v27 software was used to analyze the water quality data. Results are presented as the mean ± standard deviation. Spearman’s correlation test was adopted to assess the correlation between non-parametric variables. In this study, the response relationship between the water quality of Lake Chaohu and that of its inflowing rivers was investigated employing the Spearman correlation analysis technique via the SPSS software.

3. Results

3.1. Features of Water Quality Metrics in the LCB

The annual average pH in Lake Chaohu indicated alkaline conditions (Table 1). DO surpassed the Class I water standard (7.5 mg/L). CODMn showed an overall decreasing trend and consistently remained below the Class III standard (6.0 mg/L). BOD5 was below the Class I standard (3.0 mg/L). NH3-N showed an overall decreasing trend and consistently remained below the Class II standard (0.5 mg/L). TP was below the Class V standard (0.2 mg/L). TN was below the Class V standard (2.0 mg/L). F concentrations were below the Class I standard (1.0 mg/L). Cu concentrations were below the Class II standard (1000.0 μg/L). Zn concentrations were below the Class I standard (50.0 μg/L). Se concentrations were below the Class I standard (10.0 μg/L). As concentrations were below the Class I standard (50.0 μg/L). Hg concentrations were below the Class I standard (0.05 μg/L). These findings suggest that TP and TN are the important water quality drivers in the lake. Additionally, the particle contents were higher in the inflowing rivers than in the lake (Table 1).

3.2. Spatiotemporal Patterns of Water Quality in Lake Chaohu Using the WQI

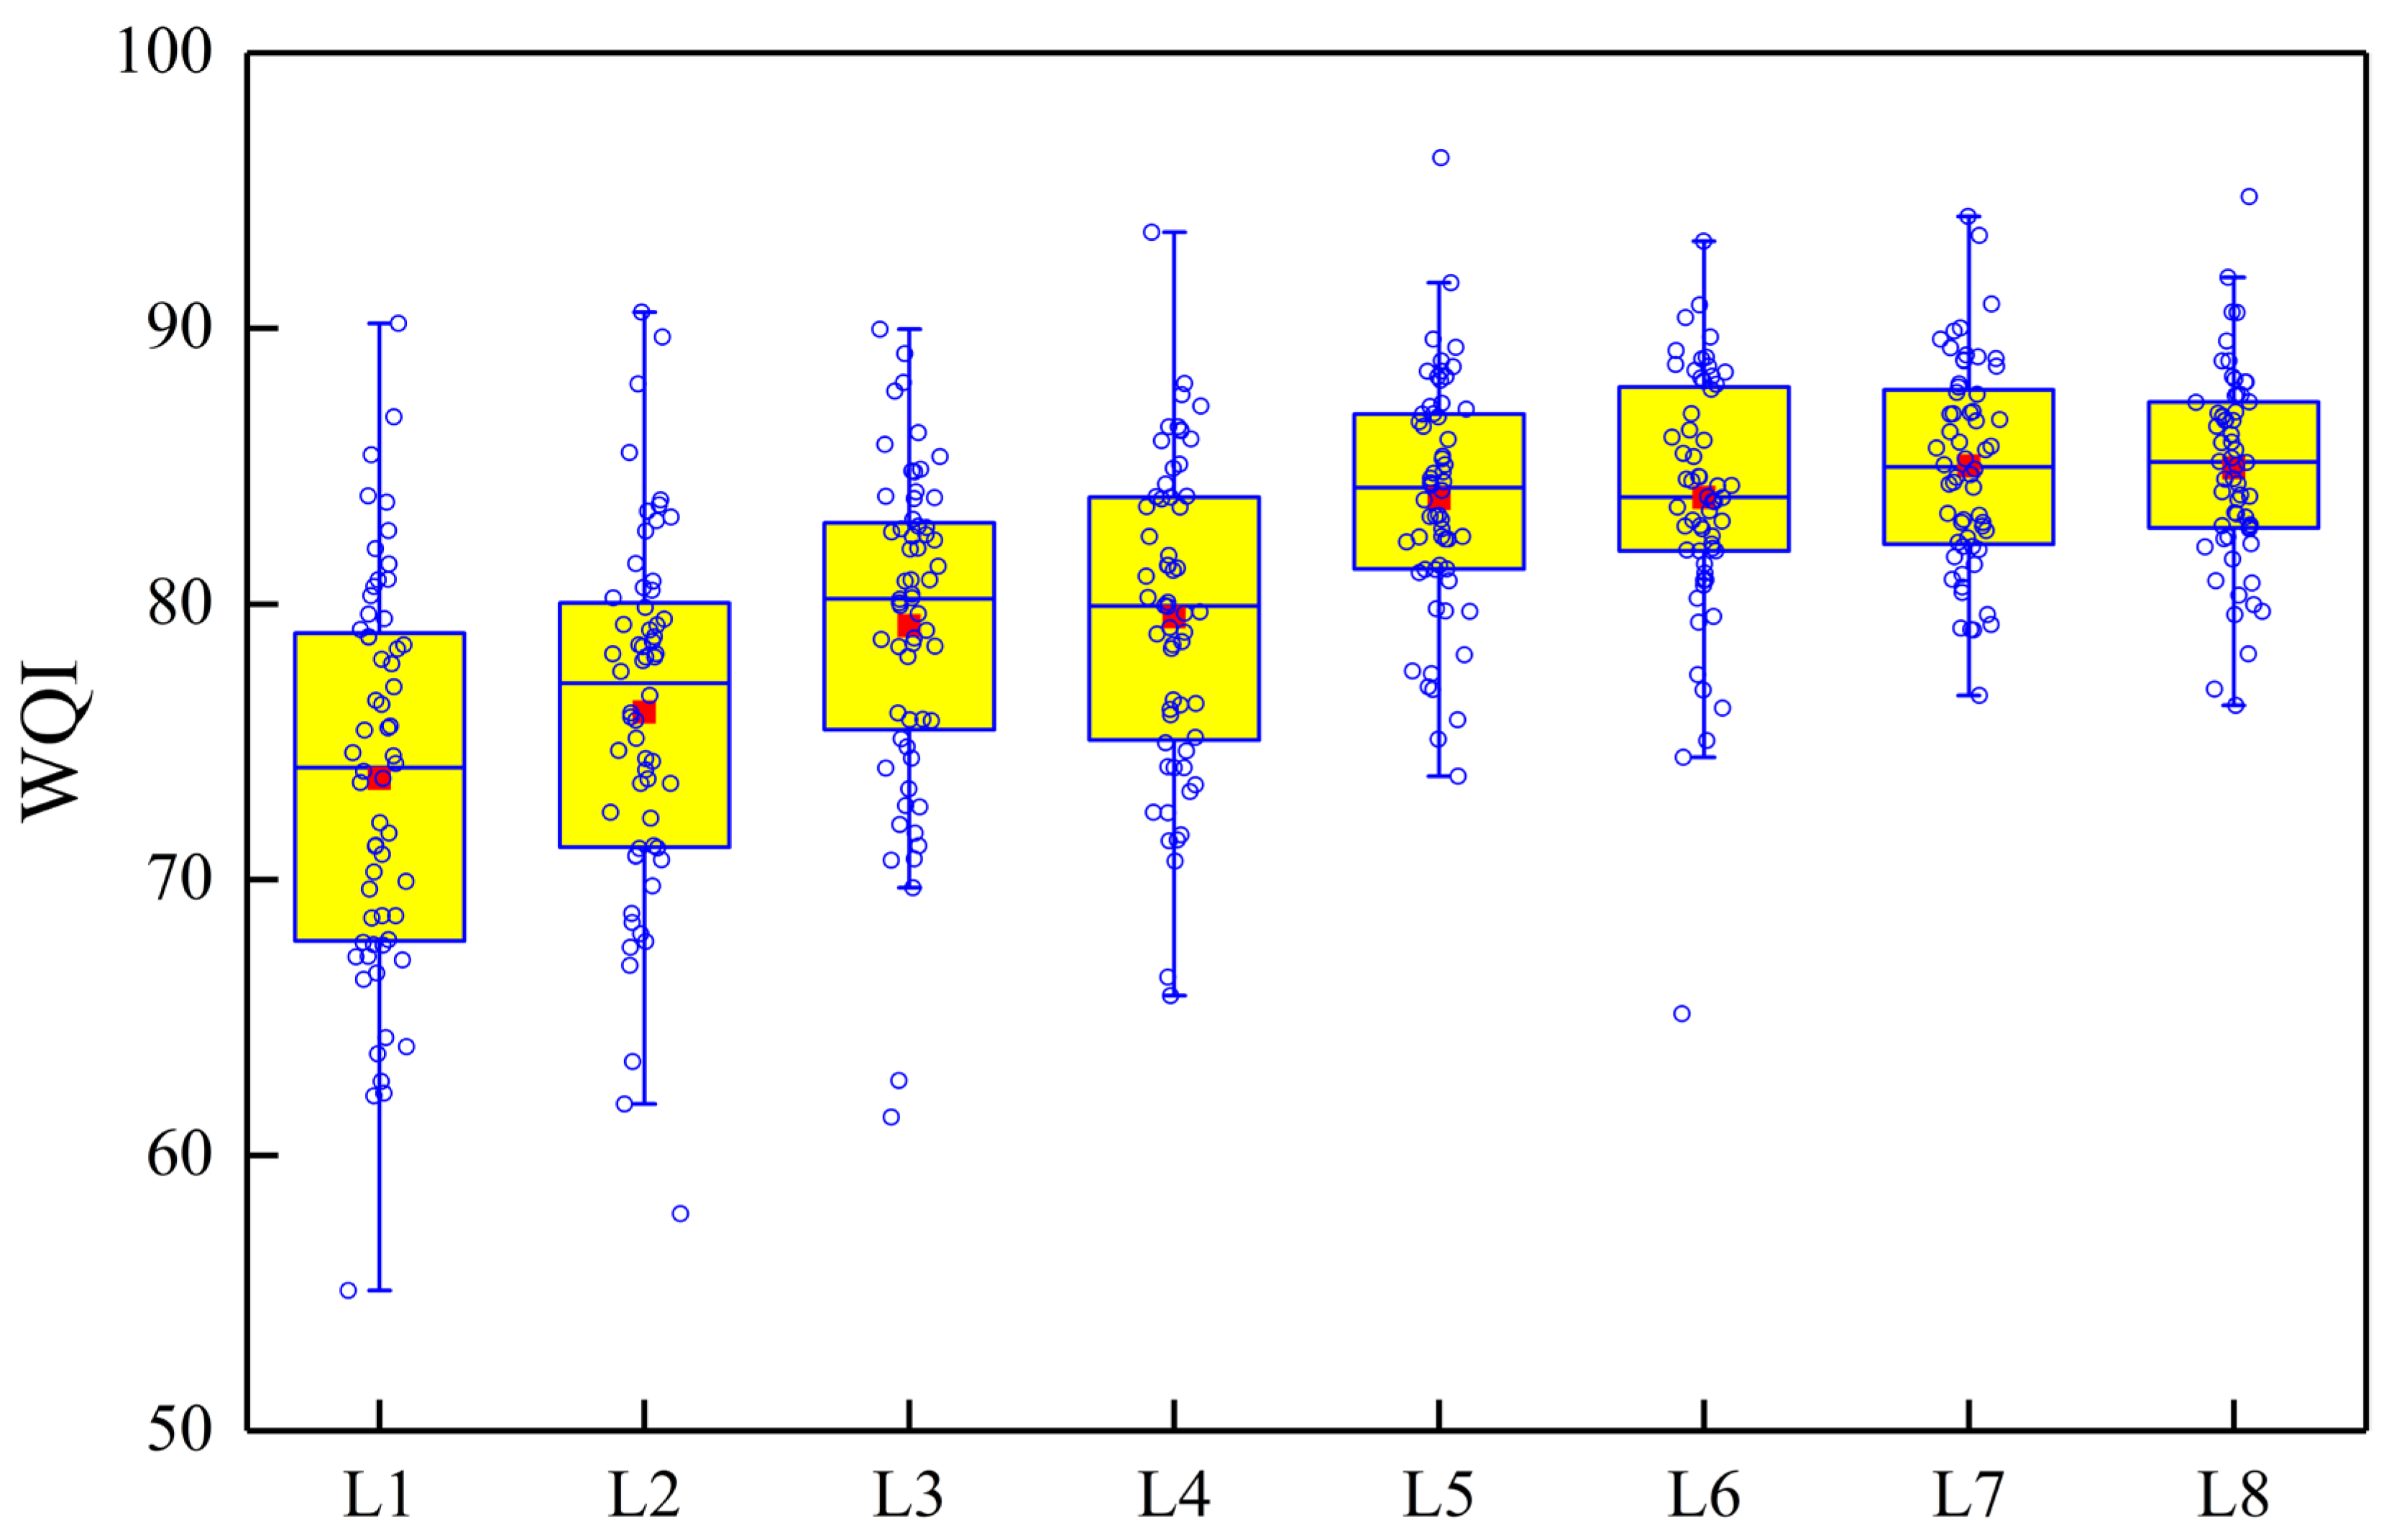
The multi-year average WQI across monitoring points in the lake was 70.9–85.4 during 2016–2020 (Figure 2 and Figure 3); the average WQI for the entire lake was 80.6, indicating good water quality for all monitoring points and the entire lake. Notably, the WQI for L1 was just above the lower limit at 70.9. L1 and L8 were associated with the minimum and maximum WQIs, respectively. The WQIs for L1–L3 in the western lake were lower, those for L6–L8 in the eastern lake were higher, while those for L4–L5 in the central lake fell between the two. Consequently, the lake’s water quality exhibited significant spatial heterogeneity, with the poorest quality observed in the western lake.
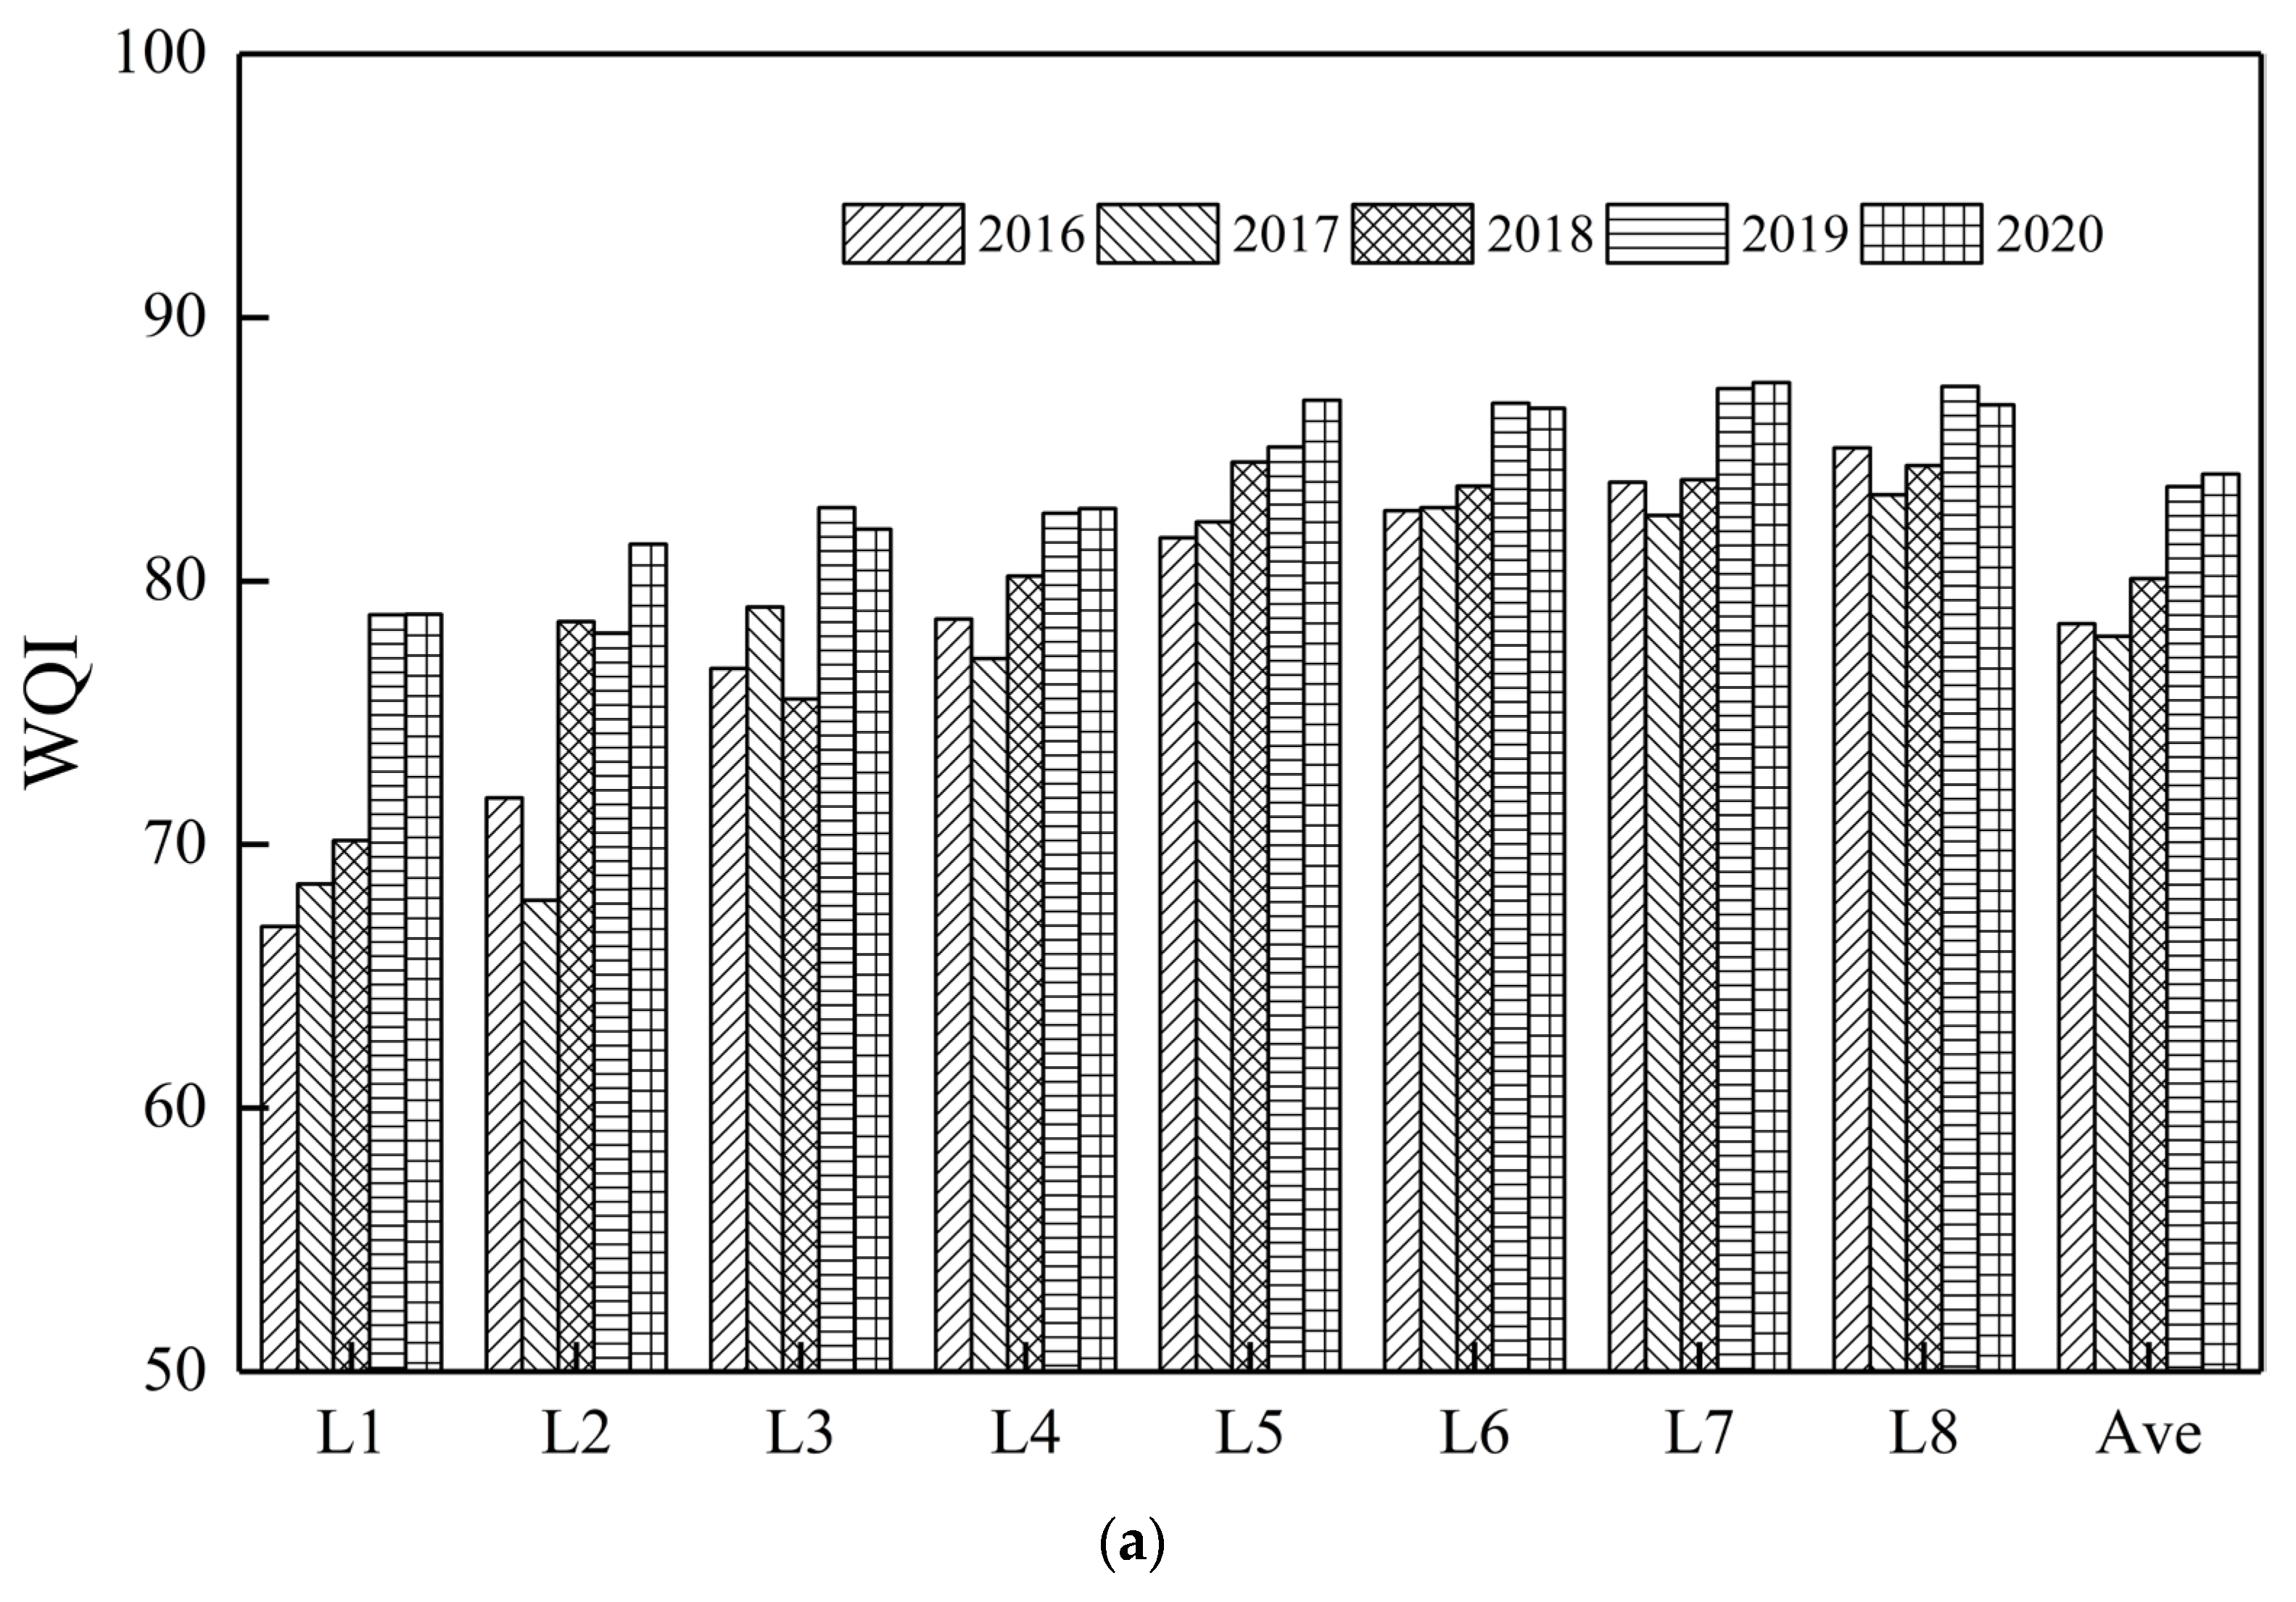
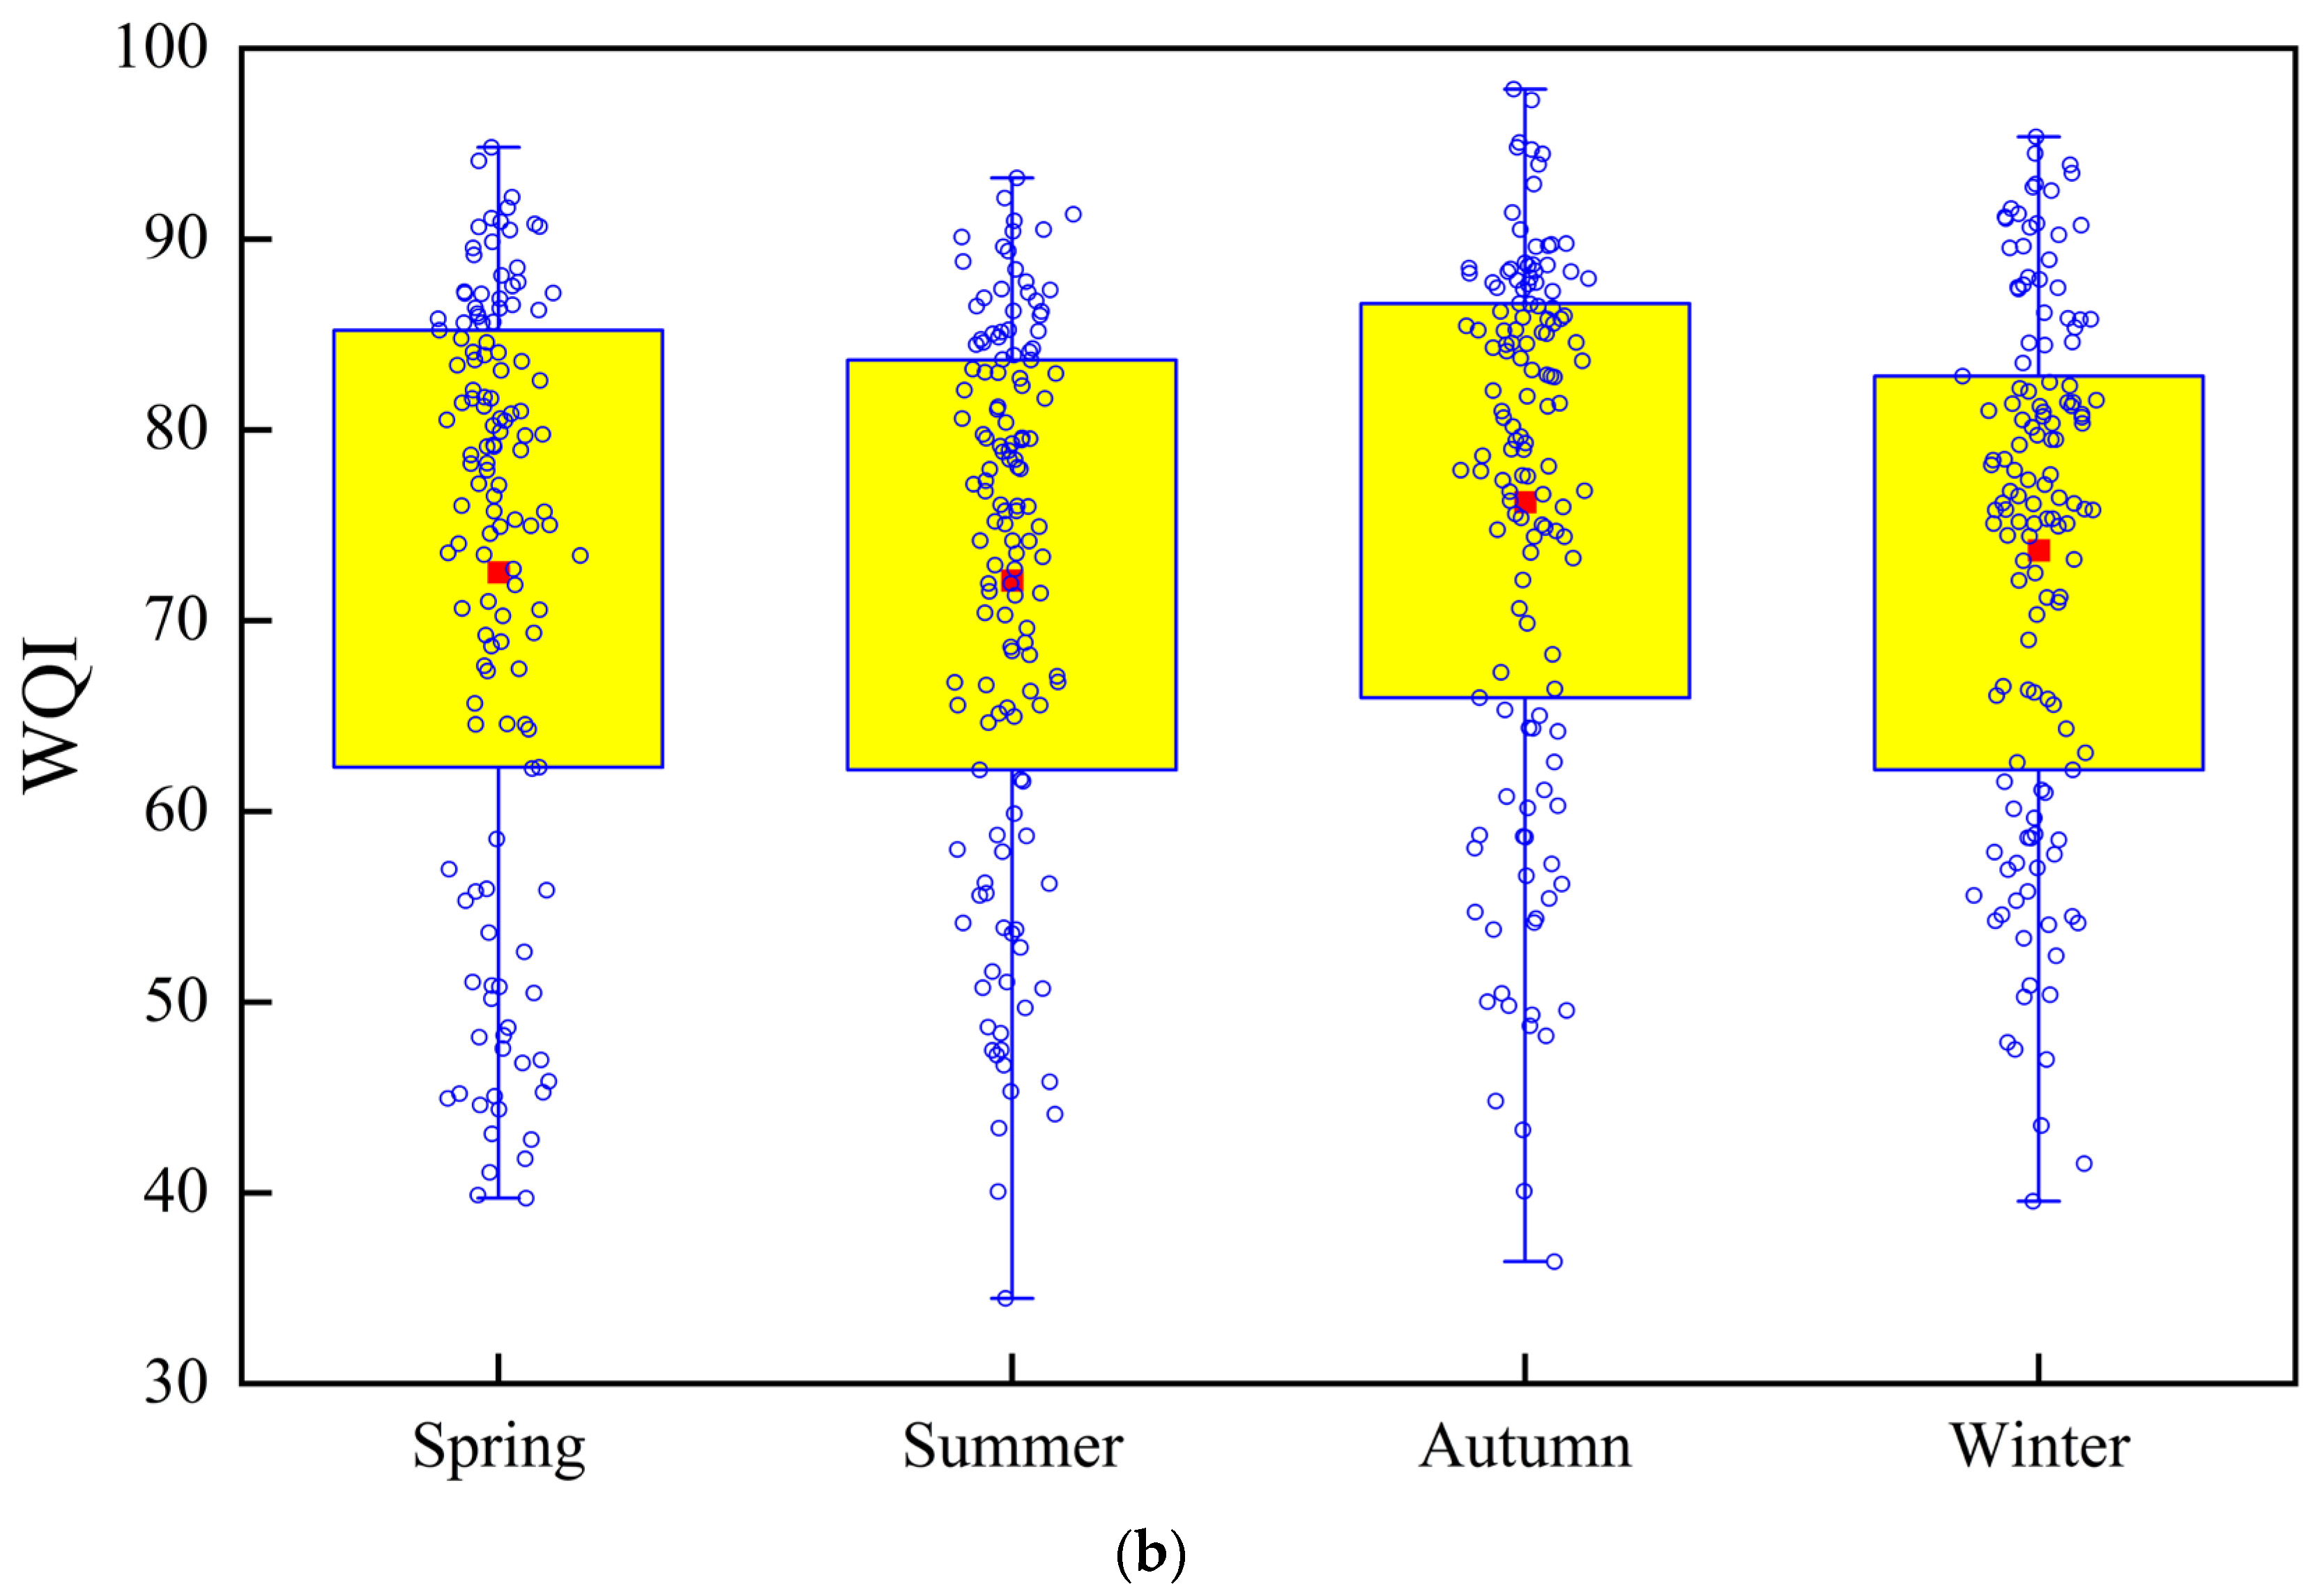
From 2016 to 2020, the annual average WQI tended to increase for each monitoring point as well as the entire lake (Figure 2 and Figure 4a), indicating an improvement in water quality. The lake-wide average WQI showed a 5.7-point improvement. Notably, L1 showed the greatest increase in WQI, which substantially improved the water quality status from moderate in 2016 to good in 2020. In contrast, L8 maintained a consistently high WQI, with a modest increase from 85.1 to 86.7, suggesting relatively stable water quality in this area. The average WQIs for spring, summer, autumn, and winter were 79.9, 81.5, 81.7, and 80.0, respectively (Figure 4b), indicating good water quality throughout the seasons. The highest WQI occurred in autumn, while the lowest occurred in spring; however, the seasonal differences in the water quality of Lake Chaohu were not significant.

3.3. Spatiotemporal Patterns in Water Quality of Inflowing Rivers Based on the WQI

During 2016–2020, the multi-year average WQI for the inflowing rivers was 50.0–86.7 (Figure 2 and Figure 5), with an average of 73.0. The water quality status of R1–R3 was categorized as moderate, while that for the remaining five rivers was good, reflecting an overall good water quality across rivers. R1 had the lowest WQI (~50.0), corresponding precisely to the lower WQI limit for moderate water quality. In contrast, R8 had the highest WQI (~86.7), near the lower WQI limit corresponding to good water quality. The WQIs of R1–R3 in the northwestern LCB were significantly lower than those of other rivers. This likely contributes to the worse water quality in the western lake compared with the other lake areas. Therefore, rivers in the northwest of Lake Chaohu had the poorest water quality.
The annual average WQI of inflowing rivers to Lake Chaohu tended to increase from 2016 to 2020 (Figure 2 and Figure 6a), indicating improvement in the water quality of inflowing rivers, consistent with the trend observed in the lake. The average annual WQI for all rivers increased from 67.4 in 2016 to 76.0 in 2020. Water quality improved significantly at R1–R3 in the northwestern LCB. Specifically, the WQI for R1 increased by 10.3 points, though its water quality status remained moderate. At R2, the WQI increased by a substantial 24.6 points, leading to an improvement from moderate to good water quality. The WQI for R3 increased by 5.6 points, but the water quality status remained moderate. The WQI of R4–R5 in the southwestern, R6 in the southeastern, and R7–R8 in the northeastern LCB initially increased and then decreased. With the exception of R7, all other rivers exhibited a slight upward trend in WQI. The WQIs of the inflowing rivers in spring, summer, fall, and winter were 72.8, 71.7, 75.7, and 73.8, respectively (Figure 6b), indicating good water quality. Although WQI peaked in the fall and dipped in the summer, the differences were not significant, suggesting stable water quality for the inflowing rivers of Lake Chaohu. LCB has a rapidly developing economy and dense population; therefore, point source pollution is the main source of pollution, with a greater impact than non-point-source pollution. These point source pollutions are continuously and stably discharged through sewage outlets, and their water quantity and quality are relatively less affected by the season.

3.4. Relationship Between Lake and Inflowing River Water Quality

Polluted inflowing rivers constitute the primary sources of lake contamination, with potent and far-reaching impacts on water quality [47]. We employed the Spearman correlation analysis to investigate the relationship in water quality between Lake Chaohu and the inflowing rivers (Figure 7) and found that the WQI of Lake Chaohu had a significant positive correlation with that of the inflowing rivers, highlighting the pivotal role of inflowing river water quality in determining lake water quality.
The Spearman correlation coefficients between the WQI at L1 in the western lake and R1, R2, and R3 in the northwestern inflowing rivers were 0.18, 0.49 (p < 0.05), and 0.25 (p < 0.05), respectively. For L2, the coefficients with R1, R2, and R3 were 0.30, 0.60, and 0.36, respectively (all p < 0.05). As for L3, the coefficients with R1, R2, R3, as well as the southwestern R4 and R5 were –0.14, 0.45 (p < 0.05), 0.06, 0.18, and 0.41 (p < 0.05), respectively. Therefore, R1, R2, and R3 were the most severely contaminated inflowing rivers. In recent years, local authorities have implemented a series of remediation measures, including the construction of sewage disposal works, the prevention of non-point-source pollution, and the optimization of industrial infrastructure, which have gradually improved the water quality. Consequently, the WQIs for L1 and L2 in the western lake have also gradually increased, indicating effective improvement in water quality. L3 in the western lake is influenced by a combination of inflowing rivers, including R1, R2, and R3 from the northwest and R4 and R5 from the southwest. The WQIs of R1, R2, and R3 gradually increased, while the WQIs of R4 and R5 exhibited only a slight increase. Although the WQI of L3 showed an increasing trend, it was not as pronounced as for L1 and L2. The WQI at L4 in the central lake showed a strong positive correlation with that at R4 and R5. Likewise, the WQI at L5 exhibited a strong positive correlation with that at R2 and R3, indicating that the water quality in the central lake was also affected by inflowing rivers in both the northwest and southwest. Notably, before entering Lake Chaohu, river R6 needs to pass through the Zhao River Sluice Gate, which regulates the inflow discharge to L6, resulting in a relatively small inflow volume. Therefore, despite the spatial proximity between R6 and L5, there was no significant correlation between them. The WQIs for L6 and L7 in the eastern lake were positively correlated with those at R2, R3, R7, and R8, indicating that water quality in the eastern lake was influenced by the combined impact of inflowing rivers from the northwestern and northeastern LCB. L8, located near the outlet of Lake Chaohu, was influenced by all inflowing rivers collectively but did not exhibit a clear relationship with any individual inflowing river.

4. Discussion

4.1. Crucial Parameters Affecting Water Quality and the WQImin

The stepwise multiple linear regression analysis of monthly WQIs for both Lake Chaohu and its inflowing rivers revealed that NH3-N contributed most to the changes in WQI ( R 2 = 0.758; p < 0.001 ), which is in line with existing literature on rivers in the LCB [31]. We further demonstrated that NH3-N not only significantly influenced the WQI of rivers but also that of Lake Chaohu. Sequentially building the regression model with TP, TN, DO, 5-d BOD5, and CODMn significantly improved the R 2 estimate, with values of 0.826, 0.905, 0.970, 0.992, and 0.998, respectively. Finally, introducing pH and Hg concentration into the regression model improved R 2 slightly to 0.999 and 0.999, respectively. Therefore, pH and Hg concentration did not have a significant impact on the WQI in the LCB. F, Cu, and the other remaining water quality parameters did not have a significant effect, likely due to their low and stable concentrations, often resulting in a C i of 100. These findings indicated that the WQI in the LCB is specifically influenced by the concentrations of NH3-N, TP, TN, DO, BOD5, and CODMn.
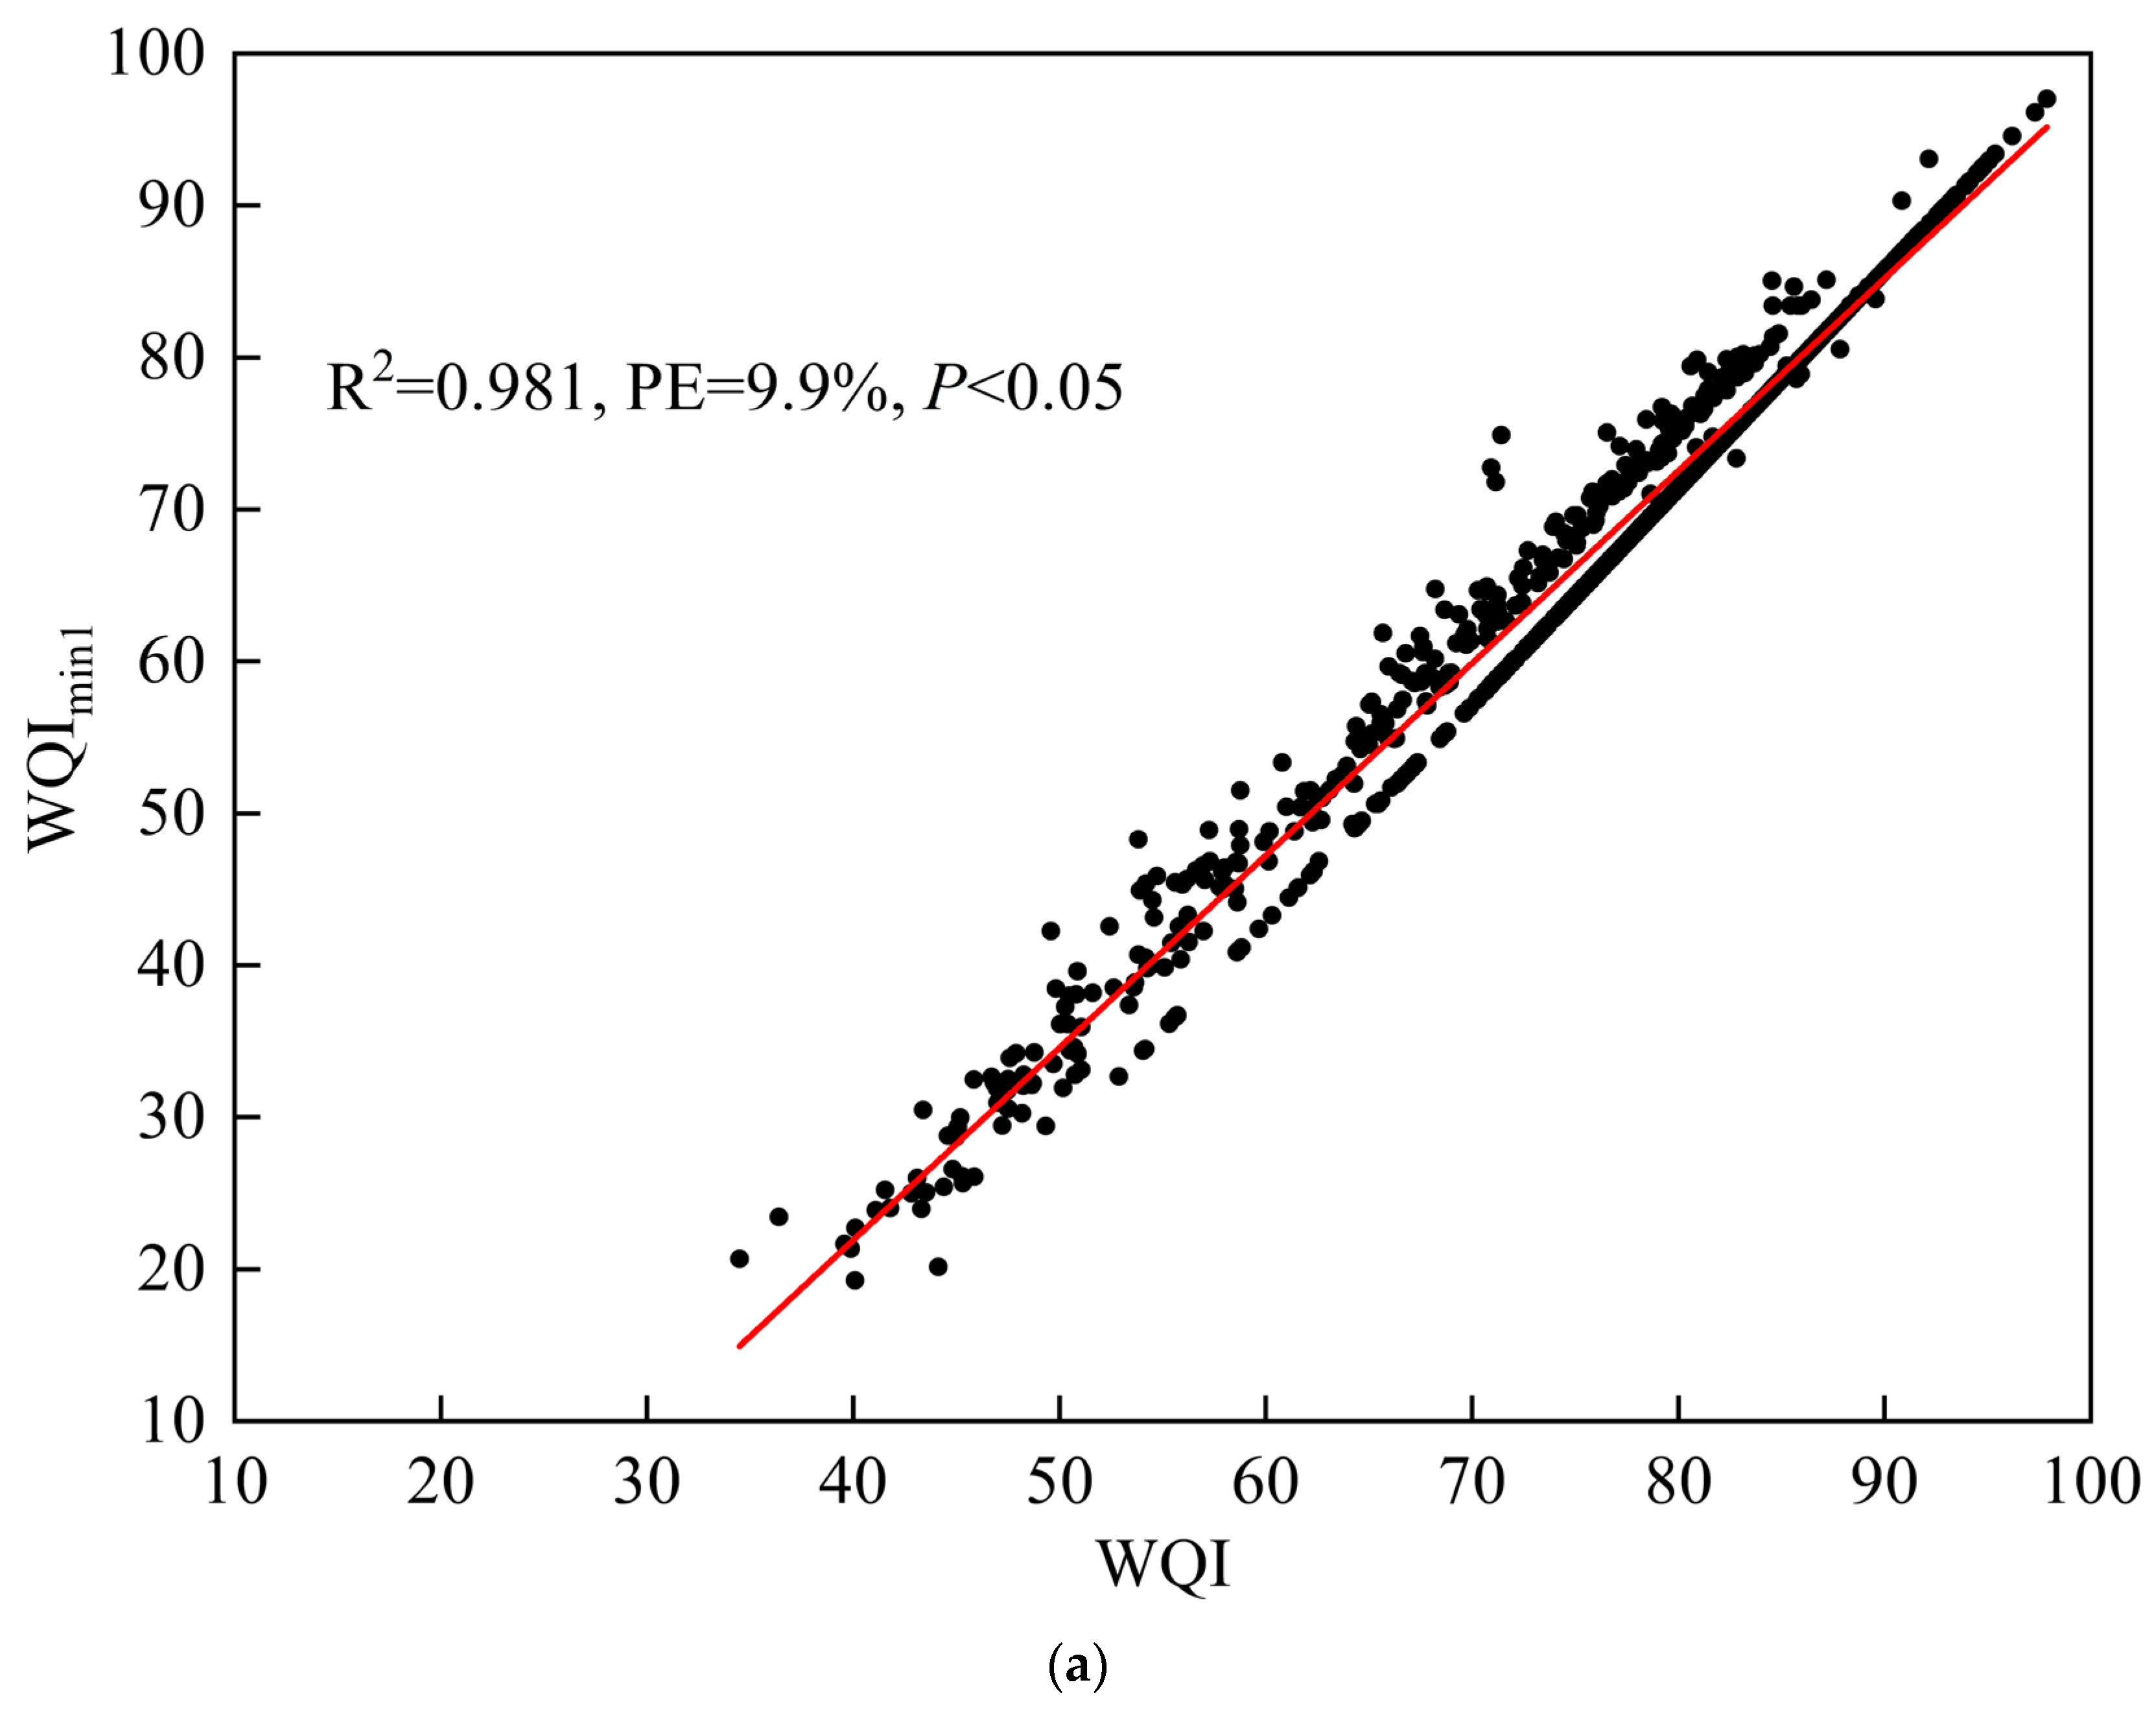
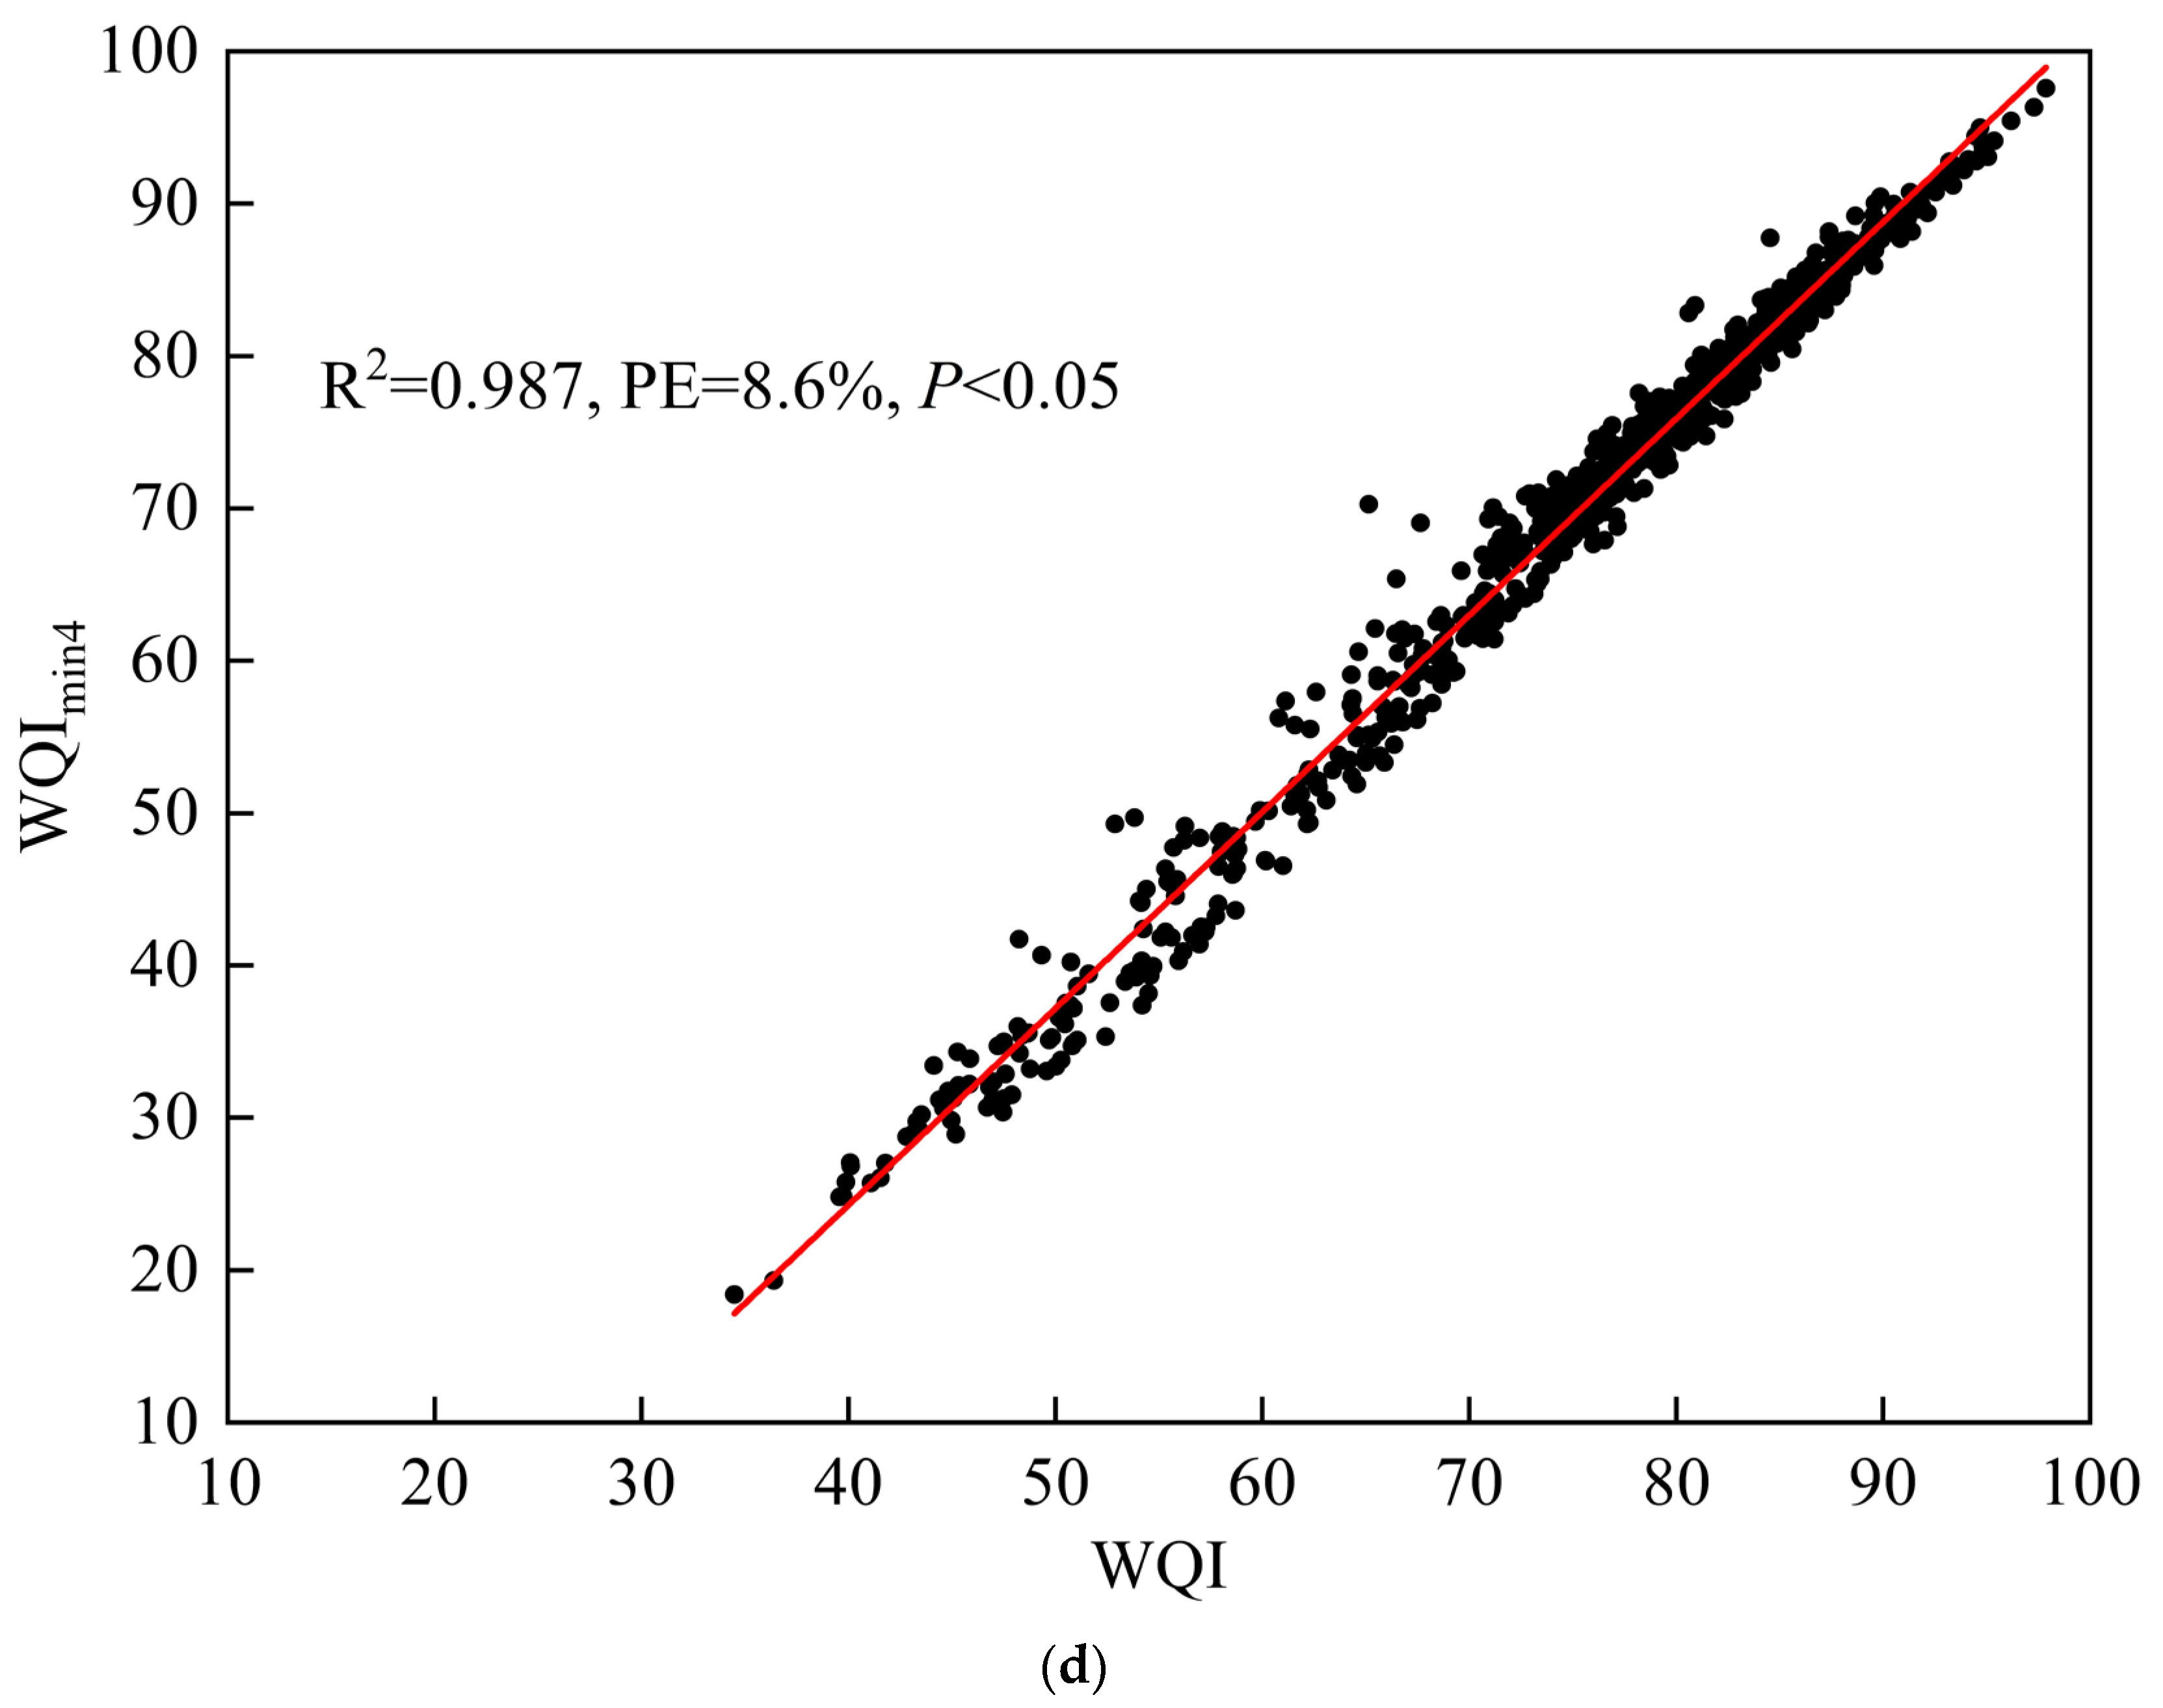
The water quality parameters for the WQImin model should ideally be easy to monitor [28,29,32]. Among the six significant parameters, BOD5 had a longer detection time, making it unsuitable for the WQImin model. Considering the potential impact of the weight C i on model fit [23,25,32], we established four WQImin models and assessed their fit compared with that of WQI based on R 2 , relative error (PE), and significant difference (p) (Table 2, Figure 8). For WQImin1, we selected NH3-N, TP, TN, DO, and CODMn, considering the same weights as WQI. WQImin1 exhibited a good fit ( R 2 = 0.981, PE = 9.9%, p < 0.05). WQImin2, using the same parameters but without considering weights, showed a lower R 2 (0.978) and higher PE (10.3%), suggesting inferior model fit when neglecting the effect of weights. WQImin3, incorporating BOD5 along with the WQImin1 parameters, achieved an excellent fit ( R 2 = 0.998, PE = 8.4%), superior to that of WQImin1. The comparison between WQImin4 and WQImin3 further highlighted the enhancement in model performance when considering weights. Nevertheless, WQImin1 showed satisfactory results and was considered the optimal model for the LCB, given the detection limits and complexities of BOD5. Our findings demonstrated that WQImin1 represents a rapid, cost-effective method for assessing water quality in this region, especially because all five parameters are easily monitored. In the previous study for the rivers of LCB [31], WQImin consisted of 5 parameters, namely turbidity, DO, NH4-N, NO3-N, and CODMn. Actually, NH4-N and NO3-N were not regular water quality monitoring parameters for the management department, which reduced the practicality of these two parameters. Turbidity was not included in the Environmental Quality Standards for Surface Water [44], which made it difficult to calculate the C i of Equation (2) for turbidity. In this study, five parameters in WQImin1 (i.e., NH3-N, TP, TN, DO, and CODMn) were regular water quality monitoring parameters and included in the Environmental Quality Standards for Surface Water, which may be more practical for LCB.

4.2. Recommendations for Water Pollution Control in the LCB

The responsive relationship between the water quality of the lake and inflowing rivers, along with the key parameters in the WQImin, provides a comprehensive empirical basis for developing adaptive long-term water pollution control strategies for protecting the socioecological integrity of the LCB. Although the WQIs for R1, R2, and R3 showed an increasing trend during 2016–2020, the water quality statuses of R1 and R3 remained moderate in 2020, representing a considerable gap from the water quality of the other rivers [48]. Despite the overall good water quality in the western lake during 2020, the concentrations of TN and TP remained at higher levels than the accepted environmental standard. These high nutrient salt levels in the western lake pose severe risks of cyanobacterial blooms [40]. Therefore, future policies should focus on strengthening control measures for these rivers by specifically addressing the high levels of nitrogen and phosphorus pollution upstream of the western lake. Although the other five rivers showed good water quality, the decline in WQIs from 2019 to 2020 should prompt further action from local authorities.
We recommended implementing the following control measures for the inflowing rivers of Lake Chaohu: (1) Further optimizing the infrastructure of the urban sewage treatment plants and intensifying operational supervision. (2) Promote the prevention of non-point-source pollution, construct river–pond and farmland wetlands in rural areas to minimize, retain, and eliminate rural domestic sewage, and promote the interception of nutrient pollution. (3) Advance the restoration of river channels and surrounding natural wetlands into ecologically functional networks that filter pollutants from the rivers. These measures are expected to further reduce the nitrogen and phosphorus pollution loads carried into Lake Chaohu by rivers. This will lead to further improvement in Lake Chaohu’s water quality and alleviate the risk of cyanobacterial blooms.

5. Conclusions

Our holistic assessment of water quality in the LCB using the WQI indicated considerable spatiotemporal heterogeneities in the water quality of both Lake Chaohu and the inflowing rivers. We demonstrated that the water quality of the lake was sensitive to pollution in the inflowing rivers and devised a rapid, cost-effective water quality assessment method, WQImin, integrating key parameters.
(1) The average annual WQI for Lake Chaohu from 2016 to 2020 indicated an overall improvement in water quality, with no pronounced seasonal variations in WQI. The water quality in the western lake region was inferior to that in the central and eastern regions, though improvements to water quality in the western region gradually reduced this disparity. Similar to the trend in the lake, the average annual WQI for the inflowing rivers showed an improvement in water quality, though considerable spatial heterogeneity was observed between rivers, with the three northwest rivers exhibiting the poorest water quality. Although there has been some improvement, further efforts are needed to meet acceptable environmental standards.
(2) Our findings validated the essential role of inflowing rivers in determining the water quality of lake-type basins. We observed a significant positive correlation between the WQIs of the lake and the inflowing rivers, especially between the western region and the inflowing rivers. The improvement in water quality in the western region was primarily attributed to the improved water quality in the three northwest inflowing rivers.
(3) NH3-N, TP, TN, DO, and CODMn were crucial factors affecting the WQI in the LCB. The corresponding WQImin demonstrated excellent performance in assessing water quality in the LCB.
(4) The water quality of the three northern inflowing rivers into Lake Chaohu showed some improvement from 2016 to 2020, but as of 2020, the water quality status of two of these rivers still remains at the moderate level. In the future, it is recommended to implement further measures to redouble pollution control efforts in these three rivers. On the other hand, the impacts of climate change (such as temperature and precipitation extremes) and land use features of the watershed on the future water quality of LCB deserve further research.

Author Contributions

Conceptualization, A.H.; data curation, Y.L.; formal analysis, W.W.; funding acquisition, X.L.; investigation, X.Y.; methodology, A.H. and X.L.; project administration, W.P.; resources, B.M.; software, F.D.; supervision, X.L.; validation, W.P.; visualization, X.Y. and Z.W.; writing—original draft, A.H.; writing—review and editing, X.L. All authors have read and agreed to the published version of the manuscript.

Funding

This research was funded by the National Natural Science Foundation of China (52409110), National Key Research and Development Program (2021YFC3200903, 2022YFC3201804, 2022YFC3204002).

Data Availability Statement

Data are available from the corresponding author upon reasonable request.

Conflicts of Interest

The authors declare no conflicts of interest.

Abbreviations

The following abbreviations are used in this manuscript:
LCBLake Chaohu Basin
WQIWater quality index
WQIminMinimum WQI

References

  1. Mammides, C. A Global Assessment of the Human Pressure on the World’s Lakes. Glob. Environ. Change 2020, 63, 102084. [Google Scholar] [CrossRef]
  2. Jiang, X.; Liu, C.; Cai, J.; Hu, Y.; Shao, K.; Tang, X.; Gong, Y.; Yao, X.; Xu, Q.; Gao, G. Relationships between Environmental Factors and N-cycling Microbes Reveal the Indirect Effect of Further Eutrophication on Denitrification and DNRA in Shallow Lakes. Water Res. 2023, 245, 120572. [Google Scholar] [CrossRef]
  3. Li, J.; Ma, R.; Xue, K.; Loiselle, S. Drivers to Spatial and Temporal Dynamics of Column Integrated Phytoplankton Biomass in the Shallow Lake of Chaohu, China. Ecol. Indic. 2020, 109, 105812. [Google Scholar] [CrossRef]
  4. Zuo, J.; Xiao, P.; Heino, J.; Tan, F.; Soininen, J.; Chen, H.; Yang, J. Eutrophication Increases the Similarity of Cyanobacterial Community Features in Lakes and Reservoirs. Water Res. 2024, 250, 120977. [Google Scholar] [CrossRef]
  5. Wang, J.; Wei, Z.-P.; Chu, Y.-X.; Tian, G.; He, R. Eutrophication Levels Increase Sulfur Biotransformation and Emissions from Sediments of Lake Taihu. Sci. Total Environ. 2023, 887, 164054. [Google Scholar] [CrossRef]
  6. Glibert, P.M. Eutrophication, Harmful Algae and Biodiversity—Challenging Paradigms in a World of Complex Nutrient Changes. Mar. Pollut. Bull. 2017, 124, 591–606. [Google Scholar] [CrossRef]
  7. Liu, Z.; Wang, X.; Jia, S.; Mao, B. Eutrophication Causes Analysis Under the Influencing of Anthropogenic Activities in China’s Largest Fresh Water Lake (Poyang Lake): Evidence from Hydrogeochemistry and Reverse Simulation Methods. J. Hydrol. 2023, 625, 130020. [Google Scholar] [CrossRef]
  8. Qin, B.; Zhang, Y.; Zhu, G.; Gao, G. Eutrophication Control of Large Shallow Lakes in China. Sci. Total Environ. 2023, 881, 163494. [Google Scholar] [CrossRef] [PubMed]
  9. Den Uyl, P.A.; Thompson, L.R.; Errera, R.M.; Birch, J.M.; Preston, C.M.; Ussler, W.; Yancey, C.E.; Chaganti, S.R.; Ruberg, S.A.; Doucette, G.J.; et al. Lake Erie Field Trials to Advance Autonomous Monitoring of Cyanobacterial Harmful Algal Blooms. Front. Mar. Sci. 2022, 9, 1021952. [Google Scholar] [CrossRef]
  10. Yindong, T.; Xiwen, X.; Miao, Q.; Jingjing, S.; Yiyan, Z.; Wei, Z.; Mengzhu, W.; Xuejun, W.; Yang, Z. Lake Warming Intensifies the Seasonal Pattern of Internal Nutrient Cycling in the Eutrophic Lake and Potential Impacts on Algal Blooms. Water Res. 2021, 188, 116570. [Google Scholar] [CrossRef]
  11. Wu, R.; Zhang, S.; Liu, Y.; Shi, X.; Zhao, S.; Kang, X.; Quan, D.; Sun, B.; Arvola, L.; Li, G. Spatiotemporal Variation in Water Quality and Identification and Quantification of Areas Sensitive to Water Quality in Hulun Lake, China. Ecol. Indic. 2023, 149, 110176. [Google Scholar] [CrossRef]
  12. Gitau, M.W.; Chen, J.; Ma, Z. Water Quality Indices as Tools for Decision Making and Management. Water Resour. Manag. 2016, 30, 2591–2610. [Google Scholar] [CrossRef]
  13. Duan, T.; Feng, J.; Chang, X.; Li, Y. Evaluation of the Effectiveness and Effects of Long-term Ecological Restoration on Watershed Water Quality Dynamics in Two Eutrophic River Catchments in Lake Chaohu Basin, China. Ecol. Indic. 2022, 145, 109592. [Google Scholar] [CrossRef]
  14. Nyenje, P.M.; Foppen, J.W.; Uhlenbrook, S.; Kulabako, R.; Muwanga, A. Eutrophication and Nutrient Release in Urban Areas of Sub-Saharan Africa—A Review. Sci. Total Environ. 2010, 408, 447–455. [Google Scholar] [CrossRef] [PubMed]
  15. Yang, X.; Li, J.; Liu, X.; Gao, J.; Dong, F.; Huang, A.; Lei, Y.; Wang, W.; Tong, Z.; Long, J. Research on Water Quality Assessment Using the Water Quality Index for the Eastern Route of the South-to-North Water Diversion Project. Water 2023, 15, 842. [Google Scholar] [CrossRef]
  16. Xu, J.; Bai, Y.; You, H.; Wang, X.; Ma, Z.; Zhang, H. Water Quality Assessment and the Influence of Landscape Metrics at Multiple Scales in Poyang Lake Basin. Ecol. Indic. 2022, 141, 109096. [Google Scholar] [CrossRef]
  17. Akkoyunlu, A.; Akiner, M.E. Pollution Evaluation in Streams Using Water Quality Indices: A Case Study from Turkey’s Sapanca Lake Basin. Ecol. Indic. 2012, 18, 501–511. [Google Scholar] [CrossRef]
  18. Noori, R.; Berndtsson, R.; Hosseinzadeh, M.; Adamowski, J.F.; Abyaneh, M.R. A Critical Review on the Application of the National Sanitation Foundation Water Quality Index. Environ. Pollut. 2019, 244, 575–587. [Google Scholar] [CrossRef] [PubMed]
  19. Akhtar, N.; Ishak, M.I.; Ahmad, M.I.; Umar, K.; Md Yusuff, M.S.; Anees, M.T.; Qadir, A.; Ali Almanasir, Y.K. Modification of the Water Quality Index (WQI) Process for Simple Calculation Using the Multi-Criteria Decision-Making (MCDM) Method: A Review. Water 2021, 13, 905. [Google Scholar] [CrossRef]
  20. Ding, F.; Zhang, W.; Cao, S.; Hao, S.; Chen, L.; Xie, X.; Li, W.; Jiang, M. Optimization of Water Quality Index Models Using Machine Learning Approaches. Water Res. 2023, 243, 120337. [Google Scholar] [CrossRef]
  21. Hou, W.; Sun, S.; Wang, M.; Li, X.; Zhang, N.; Xin, X.; Sun, L.; Li, W.; Jia, R. Assessing Water Quality of Five Typical Reservoirs in Lower Reaches of Yellow River, China: Using a Water Quality Index Method. Ecol. Indic. 2016, 61, 309–316. [Google Scholar] [CrossRef]
  22. Uddin, M.G.; Nash, S.; Olbert, A.I. A Review of Water Quality Index Models and Their Use for Assessing Surface Water Quality. Ecol. Indic. 2021, 122, 107218. [Google Scholar] [CrossRef]
  23. Ji, X.; Dahlgren, R.A.; Zhang, M. Comparison of Seven Water Quality Assessment Methods for the Characterization and Management of Highly Impaired River Systems. Environ. Monit. Assess. 2015, 188, 15. [Google Scholar] [CrossRef]
  24. Qu, X.; Chen, Y.; Liu, H.; Xia, W.; Lu, Y.; Gang, D.-D.; Lin, L.-S. A Holistic Assessment of Water Quality Condition and Spatiotemporal Patterns in Impounded Lakes Along the Eastern Route of China’s South-to-North Water Diversion Project. Water Res. 2020, 185, 116275. [Google Scholar] [CrossRef]
  25. Nong, X.; Shao, D.; Zhong, H.; Liang, J. Evaluation of Water Quality in the South-to-North Water Diversion Project of China Using the Water Quality Index (WQI) method. Water Res. 2020, 178, 115781. [Google Scholar] [CrossRef]
  26. Ni, B.; Liu, X.; Wu, Y.; Jiang, M.; Zou, Y. A comprehensive water quality assessment for a typical river–lake watershed in Northeast China: Implications for the water management of boundary lake. Ecol. Indic. 2025, 178, 113942. [Google Scholar] [CrossRef]
  27. Faruq, O.; Malak, M.A.; Hossain, N.J.; Sami, M.S.; Sajib, A.M. Investigating the relationship between land use and water quality in urban water bodies. Clean. Water 2025, 3, 100070. [Google Scholar] [CrossRef]
  28. Wu, J.; Cheng, S.-P.; He, L.-Y.; Wang, Y.-C.; Yue, Y.; Zeng, H.; Xu, N. Assessing Water Quality in the Pearl River for the Last Decade Based on Clustering: Characteristic, Evolution and Policy Implications. Water Res. 2023, 244, 120492. [Google Scholar] [CrossRef] [PubMed]
  29. Pesce, S.F.; Wunderlin, D.A. Use of Water Quality Indices to Verify the Impact of Córdoba City (Argentina) on Suquía River. Water Res. 2000, 34, 2915–2926. [Google Scholar] [CrossRef]
  30. Wu, Z.; Wang, X.; Chen, Y.; Cai, Y.; Deng, J. Assessing River Water Quality Using Water Quality Index in Lake Taihu Basin, China. Sci. Total Environ. 2018, 612, 914–922. [Google Scholar] [CrossRef] [PubMed]
  31. Wu, Z.; Lai, X.; Li, K. Water Quality Assessment of Rivers in Lake Chaohu Basin (China) Using Water Quality Index. Ecol. Indic. 2021, 121, 107021. [Google Scholar] [CrossRef]
  32. Xiao, W.; Ren, B.; Wu, B.; Deng, X. Spatiotemporal dynamics and optimization of water quality assessment in the Nantong section of the Yangtze River Basin: A WQImin approach. J. Hydrol. Reg. Stud. 2025, 57, 102106. [Google Scholar] [CrossRef]
  33. Simões, F.d.S.; Moreira, A.B.; Bisinoti, M.C.; Gimenez, S.M.N.; Yabe, M.J.S. Water Quality Index as a Simple Indicator of Aquaculture Effects on Aquatic Bodies. Ecol. Indic. 2008, 8, 476–484. [Google Scholar] [CrossRef]
  34. Chen, P.; Luo, J.; Xiong, Z.; Wan, N.; Ma, J.; Yuan, J.; Duan, H. Can the Establishment of a Protected Area Improve the Lacustrine Environment? A Case Study of Lake Chaohu, China. J. Environ. Manag. 2023, 342, 118152. [Google Scholar] [CrossRef] [PubMed]
  35. Huang, J.; Yan, R.; Gao, J.; Zhang, Z.; Qi, L. Modeling the Impacts of Water Transfer on Water Transport Pattern in Lake Chao, China. Ecol. Eng. 2016, 95, 271–279. [Google Scholar] [CrossRef]
  36. Gao, J.; Liu, G.; Li, X.; Tang, M.; Cao, X.; Zhou, Y.; Song, C. Organic Carbon Quantity and Composition Jointly Modulate the Differentiation of Nitrate Reduction Pathways in Sediments of the Chinese Eutrophic Lake, Lake Chaohu. Water Res. 2022, 220, 118720. [Google Scholar] [CrossRef] [PubMed]
  37. Zhou, T.; Li, Y.; Jiang, B.; Alatalo, J.M.; Li, C.; Ni, C. Tracking Spatio-temporal Dynamics of Harmful Algal Blooms Using Long-term MODIS Observations of Chaohu Lake in China from 2000 to 2021. Ecol. Indic. 2023, 146, 109842. [Google Scholar] [CrossRef]
  38. Ren, M.; Zhang, M.; Fan, F.; Yang, J.; Yang, Z.; Chen, K.; Li, Y.C.; Shi, X. Difference in Temporal and Spatial Distribution Pattern of Cyanobacteria between the Sediment and Water Column in Lake Chaohu. Environ. Pollut. 2021, 291, 118163. [Google Scholar] [CrossRef]
  39. Yang, C.; Yang, P.; Geng, J.; Yin, H.; Chen, K. Sediment Internal Nutrient Loading in the Most Polluted Area of a Shallow Eutrophic Lake (Lake Chaohu, China) and its Contribution to Lake Eutrophication. Environ. Pollut. 2020, 262, 114292. [Google Scholar] [CrossRef]
  40. Wei, Z.; Yu, Y.; Yi, Y. Spatial Distribution of Nutrient Loads and Thresholds in Large Shallow Lakes: The Case of Chaohu Lake, China. J. Hydrol. 2022, 613, 128466. [Google Scholar] [CrossRef]
  41. Hu, M.; Zhang, Y.; Ma, R.; Xue, K.; Cao, Z.; Chu, Q.; Jing, Y. Optimized Remote Sensing Estimation of the Lake Algal Biomass by Considering the Vertically Heterogeneous Chlorophyll Distribution: Study Case in Lake Chaohu of China. Sci. Total Environ. 2021, 771, 144811. [Google Scholar] [CrossRef]
  42. Peng, Z.; Hu, W.; Zhang, Y.; Liu, G.; Zhang, H.; Gao, R. Modelling the Effects of Joint Operations of Water Transfer Project and Lake Sluice on Circulation and Water Quality of a Large Shallow Lake. J. Hydrol. 2021, 593, 125881. [Google Scholar] [CrossRef]
  43. Peng, Z.; Hu, W.; Liu, G.; Zhang, H.; Gao, R.; Wei, W. Development and Evaluation of a Real-time Forecasting Framework for Daily Water Quality Forecasts for Lake Chaohu to Lead Time of Six Days. Sci. Total Environ. 2019, 687, 218–231. [Google Scholar] [CrossRef] [PubMed]
  44. GB 3838-2002Environmental Quality Standards for Surface Water; Ministry of Ecology and Environment: Beijing, China, 2002.
  45. Koçer, M.A.T.; Sevgili, H. Parameters Selection for Water Quality Index in the Assessment of the Environmental Impacts of Land-based Trout Farms. Ecol. Indic. 2014, 36, 672–681. [Google Scholar] [CrossRef]
  46. Jonnalagadda, S.B.; Mhere, G. Water Quality of the Odzi River in the Eastern Highlands of Zimbabwe. Water Res. 2001, 35, 2371–2376. [Google Scholar] [CrossRef] [PubMed]
  47. Huang, J.; Zhang, Y.; Huang, Q.; Gao, J. When and Where to Reduce Nutrient for Controlling Harmful Algal Blooms in Large Eutrophic Lake Chaohu, China? Ecol. Indic. 2018, 89, 808–817. [Google Scholar] [CrossRef]
  48. Zheng, L.; Jiang, C.; Chen, X.; Li, Y.; Li, C.; Zheng, L. Combining hydrochemistry and hydrogen and oxygen stable isotopes to reveal the influence of human activities on surface water quality in Chaohu Lake Basin. J. Environ. Manag. 2022, 312, 114933. [Google Scholar] [CrossRef]
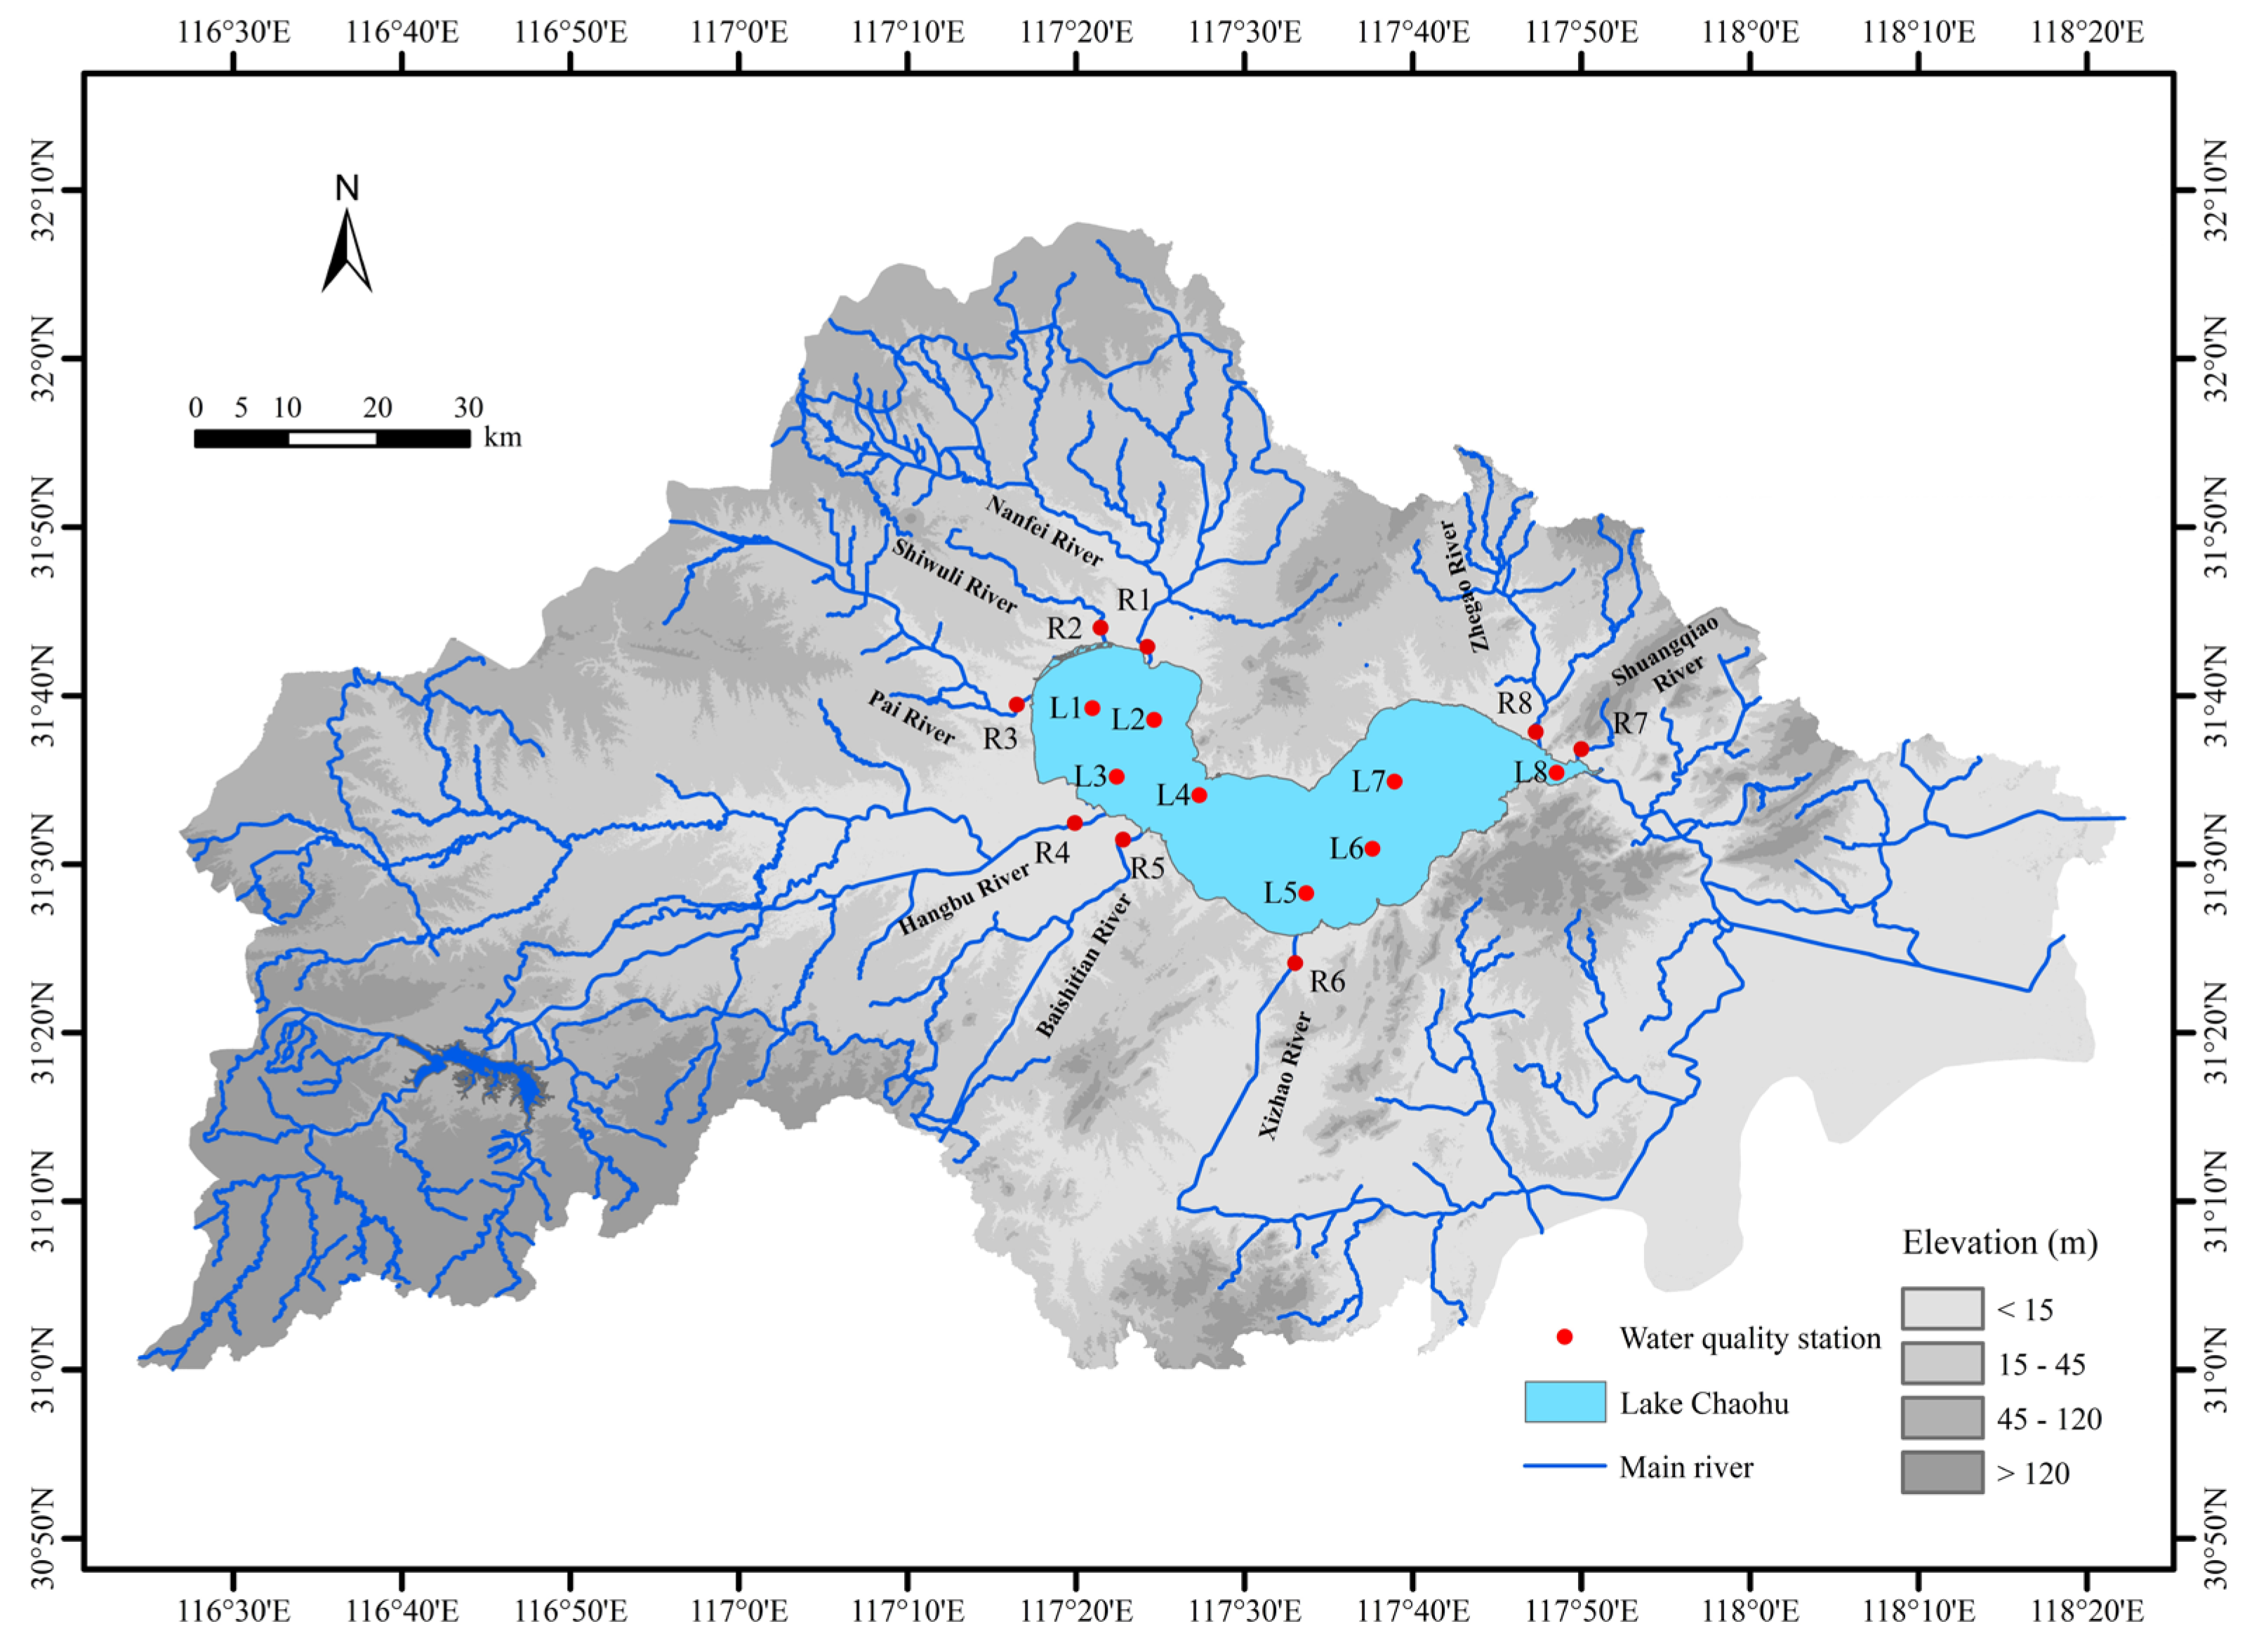
Figure 1. Hydrological map of Lake Chaohu Basin (LCB).
Processes 13 03125 g001
Figure 2. Spatial patterns of the WQI in the LCB: (a) Multi-year average WQI for 2016–2020. (bf) Annual WQI for 2016, 2017, 2018, 2019, and 2020, respectively.
Processes 13 03125 g002
Figure 3. Comparison of WQIs between monitoring points in Lake Chaohu. WQI data are presented on a monthly scale. The red square in the figure represents the average value.
Processes 13 03125 g003
Figure 4. Interannual and seasonal variations in WQI in Lake Chaohu: (a) Average annual WQI across lake monitoring stations. (b) Seasonal WQI. The red square in the figure represents the average value.
Processes 13 03125 g004aProcesses 13 03125 g004b
Figure 5. Comparison of WQIs between the inflowing rivers. The red square in the figure represents the average value.
Processes 13 03125 g005
Figure 6. Interannual and seasonal patterns in WQI of inflowing rivers: (a) Average annual WQI across river monitoring stations. (b) Seasonal WQI. The red square in the figure represents the average value.
Processes 13 03125 g006aProcesses 13 03125 g006b
Figure 7. Correlation analysis of WQIs between the lake and inflowing rivers.
Processes 13 03125 g007
Figure 8. Fitting performance of WQImin to WQI. (ad) represent WQImin1, WQImin2, WQImin3, and WQImin4, respectively.
Processes 13 03125 g008aProcesses 13 03125 g008bProcesses 13 03125 g008c
Table 1. Annual measures of environmental parameters in the LCB. Letter I to V is the water quality class according to the water quality standard, and it should be noted that TN of rivers does not have water quality classification [44].
ParameterLake
20162017201820192020
pH8.19 ± 0.33, I8.25 ± 0.31, I8.22 ± 0.38, I8.16 ± 0.50, I8.25 ± 0.69, I
DO (mg/L)10.11 ± 2.04, I9.83 ± 1.77, I9.71 ± 2.07, I10.09 ±2.30, I9.58 ± 2.29, I
CODMn (mg/L)4.52 ± 0.99, III4.23 ± 1.10, III3.50 ± 1.07, II3.50 ± 0.67, II3.47 ± 0.92, II
BOD5 (mg/L)2.44 ± 1.01, I2.37 ± 0.86, I1.53 ± 0.83, I1.90 ± 0.93, I1.83 ± 0.95, I
NH3-N (mg/L)0.27 ± 0.41, II0.23 ± 0.33, II0.25 ± 0.55, II0.17 ± 0.20, II0.10 ± 0.13, I
TP (mg/L)0.09 ± 0.05, IV0.11 ± 0.06, V0.10 ± 0.04, IV0.08 ± 0.04, IV0.07 ± 0.03, IV
TN (mg/L)1.65 ± 0.82, V1.64 ± 0.91, V1.44 ± 1.06, IV1.18 ± 0.70, IV1.36 ± 0.73, IV
F- (mg/L)0.46 ± 0.08, I0.41 ± 0.07, I0.37 ± 0.07, I0.41 ± 0.06, I0.41 ± 0.04, I
Cu (μg/L)2.95 ± 1.69, I2.88 ± 0.22, I8.73 ± 8.02, I20.00 ±0.00, II20.00 ±0.00, II
Zn (μg/L)5.72 ± 9.37, I14.52 ± 29.41, I5.41 ± 4.74, I5.42 ± 2.56, I9.32 ±12.72, I
Se (μg/L)0.26 ± 0.16, I0.38 ± 0.34, I0.20 ± 0.00, I0.20 ± 0.00, I0.20 ± 0.00, I
As (μg/L)0.73 ± 0.70, I2.37 ± 2.41, I2.37 ± 1.92, I1.29 ± 1.34, I1.01 ± 0.70, I
Hg (μg/L)0.03 ± 0.00, I0.03 ± 0.01, I0.02 ± 0.00, I0.02 ± 0.01, I0.02 ± 0.01, I
ParameterRivers
20162017201820192020
pH7.91 ± 0.37, I7.83 ± 0.38, I7.63 ± 0.44, I7.54 ± 0.44, I7.29 ± 0.46, I
DO (mg/L)8.53 ± 2.74, I7.75 ± 2.42, I7.11 ± 2.49, II7.22 ± 2.45, II7.11 ± 3.21, II
CODMn (mg/L)5.11 ± 1.13, III4.87 ± 1.42, III4.30 ± 1.08, III4.10 ± 1.07, III4.75 ± 1.36, III
BOD5 (mg/L)3.54 ± 1.41, III3.35 ± 1.98, III2.84 ± 1.98, I2.64 ± 1.91, I2.58 ± 1.01, I
NH3-N (mg/L)2.60 ± 3.22, V2.07 ± 2.43, V1.39 ± 1.83, IV1.00 ± 1.56, III0.68 ± 0.63, II
TP (mg/L)0.23 ± 0.22, IV0.21 ± 0.21, IV0.15 ± 0.13, III0.11 ± 0.10, III0.15 ± 0.30, III
TN (mg/L)4.40 ± 3.874.14 ± 3.393.63 ± 3.222.92 ± 2.413.40 ± 2.64
F- (mg/L)0.49 ± 0.12, I0.45 ± 0.11, I0.38 ± 0.12, I0.40 ± 0.11, I0.42 ± 0.14, I
Cu (μg/L)2.95 ± 1.61, I2.88 ± 0.22, I9.61 ± 9.02, I20.00 ± 0.00, II21.07 ± 8.69, II
Zn (μg/L)5.03 ± 11.14, I31.92 ± 84.51, I28.56 ± 71.04, I12.34 ± 12.90, I13.47 ± 15.78, I
Se (μg/L)0.31 ± 0.25, I0.35 ± 0.27, I0.28 ± 0.27, I0.23 ± 0.10, I0.21 ± 0.04, I
As (μg/L)0.70 ± 1.44, I2.24 ± 2.53, I1.64 ± 1.29, I1.28 ± 1.38, I1.20 ± 0.91, I
Hg (μg/L)0.03 ± 0.00, I0.03 ± 0.01, I0.02 ± 0.01, I0.02 ± 0.01, I0.02 ± 0.01, I
Table 2. Water quality parameters and fitting performance of WQImin models.
ModelsParameters IncludedWeights Considered R 2 PEp
WQImin1NH3-N, TP, TN, DO, CODMnYes0.9819.9%<0.05
WQImin2NH3-N, TP, TN, DO, CODMnNo0.97810.3%<0.05
WQImin3NH3-N, TP, TN, DO, CODMn, BOD5Yes0.9988.4%<0.05
WQImin4NH3-N, TP, TN, DO, CODMn, BOD5No0.9878.6%<0.05
Disclaimer/Publisher’s Note: The statements, opinions and data contained in all publications are solely those of the individual author(s) and contributor(s) and not of MDPI and/or the editor(s). MDPI and/or the editor(s) disclaim responsibility for any injury to people or property resulting from any ideas, methods, instructions or products referred to in the content.