Abstract
Anaerobic digestion (AD) is an environmentally friendly, promising solution for the recycling of agro-industrial wastes. However, overloading an anaerobic digester with substrate may cause the inhibition of the AD process. The present study investigated the effects of the substrate/inoculum (S/I) ratio on the AD of potato chip processing (PCP) waste from the potato chip processing industry (PCPI). The PCP waste included expired potato chips (EPCs), recovered potato starch (RPS), and potato peel (PP). Mesophilic AD was carried out in batch-wise static reactors at 35 ± 1 °C using four different S/I ratios (0.5, 1.0, 1.5, and 2.0 g VS/g VS) for each type of waste. Different optimum S/I ratios were obtained for the different wastes; however, the pH ranges were comparable (7.0 to 7.5) for all batches. The optimum S/I ratios for EPCs, RPS, and PP were 1.0, 1.5, and 2.0, respectively. The cumulative biogas yields for EPCs, RPS, and PP were 367.5 ± 6.3, 310.0 ± 5.5, and 202.5 ± 4.9 mL/g VS added, respectively. The methane content of the biogas yields ranged between 60% and 70%. There was a variable remarkable shift in the microbial population at the optimum S/I ratio of each type of waste. The abundance of Firmicutes increased in the case of EPCs and RPS but decreased in the case of PP. Conversely, Proteobacteria increased when using PP as a substrate and decreased in the case of EPCs. Herein, the results of the AD of PCP wastes confirm its potential for the onsite production of renewable bioenergy and reductions in energy bills in the PCPI. In addition, this study provides guidance for optimizing the AD of PCP wastes for large-scale applications.
1. Introduction
Recently, global energy demand has increased faster than usual throughout all geographical regions, driven by accelerated industrialization and rapid population growth [1]. As reported, fossil fuels, including oil, natural gas, and coal, currently provide around 80% of the world’s energy supply [2]. The over-use of fossil fuels has resulted in many problems, and the environmental implications of pollution have prompted significant interest in clean and sustainable energy sources [3,4]. Many countries, like Egypt, have started depending on renewable sources of energy to fulfill the growing demand for power. The energy sector represents the most important aspect among the 10 features of Egypt’s Vision 2030 agenda [5]. The Vision suggests that energy resources should be used effectively and domestically, and there should be sufficient diversity in the power generation between fossil fuels and renewable resources [5]. Thus, suitable substitutes have drawn researchers’ attention toward producing renewable energy from different resources. Biofuels derived from biomass represent a viable option for renewable fuels since biomass is a sustainable source of organic matter obtained from animal and plant sources [6], and biomass-based biofuels have excellent environmental impacts.
Biogas is considered one of these renewable energy sources; however, a negligible portion of global renewable energy (6.3%) is produced from biogas, which is derived from the biomass of plants, animals, and microorganisms [7]. Several initiatives and programs in Europe and, more recently, worldwide encourage the use of biomass to produce renewable energy. The worldwide biogas industry increased by more than 90% between 2010 and 2018, making it one of the world’s fastest-growing sectors [8]. Biodegradable organic matter is converted into energy-dense biogas, which is mostly composed of methane, carbon dioxide, hydrogen, and hydrogen sulfide under anaerobic digestion processes [9].
The anaerobic digestion of organic wastes has gained interest as a potential dual-benefit process for producing renewable energy and safely disposing of organic waste. The uncontrolled decomposition of organic waste in landfills releases a substantial volume of methane that has 20 times the global warming potential of carbon dioxide [10]. Anaerobic digestion is a complex multistage process in which hydrolysis is the first key component. Hydrolytic bacteria hydrolyze complicated insoluble substrate macromolecules to produce simple and more soluble intermediates [11]. A vast number of microbial species work together on organic substrates like carbohydrates, proteins, and lipids to generate volatile fatty acids (VFAs), which are subsequently handled by methanogenic bacteria to produce methane and carbon dioxide. Bacteria produce extracellular enzymes to hydrolyze particulate substrates into tiny transportable molecules that can pass through the cell membrane. Once these basic molecules enter the cell, they are utilized to generate energy and assemble biological components [12].
Recently, the AD process has become widely used for the remediation of many organic solid wastes. Potato, a starchy tuberous crop, is the third most important crop for human consumption and its use as a staple food is steadily increasing [13]. Germany, France, the Netherlands, the UK, and Belgium are the largest potato-producing countries in northwestern Europe, with a total potato crop accounting for around 60% of EU-28 production before Brexit [14]. Potato peels are the most common byproduct of potato processing, accounting for around 15% to 40% of waste by weight depending on the peeling method, and their disposal is becoming a serious challenge [15]. In 2021, Egypt’s potato production was estimated to be 6.9 million metric tons, a small increase compared to 2020, in which around 6.8 million metric tons were produced [16]. Achinas et al. (2019) [17] examined the performance of the anaerobic digestion of potato peels and impacts of different pre-treatments and co-digestion with different percentages of cow manure. It was found that the co-digestion of potato peel waste and cow manure yielded up to 237.4 mL CH4/g VS added, whereas the maximum methane yield from the mono-digestion of potato peels was 217.8 mL CH4/g VS added. However, Fang et al. (2011) [18] used potato juice as a byproduct from potato starch processing for biogas production in an up-flow anaerobic sludge blanket (UASB) and found that the maximum methane potential of the potato juice was 470 mL CH4/g VS added. The difference in degradation efficiency is related to the microbial consortium, which consists of highly diverse communities within different trophic groups such as fermenting bacteria, syntrophic bacteria, and methanogens. Groups such as Firmicutes, Proteobacteria, and Chloroflexi will vary mainly due to pH change, substrate change, and toxicity [19].
The potato chip processing industry (PCPI) produces large amounts of different types of solid waste. This solid waste could represent a sustainable source of renewable energy when processed using anaerobic digestion (AD). The AD and biodegradation of organic solid waste is an eco-friendly method for energy recovery and the stabilization of organic waste. There are different laboratory methods to estimate/determine the rate of the anaerobic biodegradation of organic wastes, both liquid and solid. The elemental composition of organic solid waste was recently used as an innovative method for the theoretical determination of potential methane production from organic solid waste [20,21]. However, the traditional lab method used to measure the anaerobic biodegradability and biochemical methane potential (BMP) of the anaerobic digestion of organic waste under test conditions remains the most trusted approach [22,23]. Thus the aim of the current study was to measure the BMP and AD of potato chip processing (PCP) waste. The anaerobic digestion and biogas production from three different types of waste from the PCPI were investigated at different substrate/inoculum (S/I) ratios. The organic solid waste included expired potato chips (EPCs), recovered potato starch (RPS) from wastewater streams, and potato peel (PP) from the wastewater screening process. So far, the application of an inoculum to begin the anaerobic digestion process has been arbitrary [24]. Therefore, there is a need to determine the optimum quantity of inoculum required for maximum specific biogas yield. Furthermore, to the best of our knowledge, the scientific information on the best S/I ratio for maximum biogas production from the anaerobic digestion of these wastes is scarce in the literature. Establishing an optimum S/I ratio for enhanced anaerobic biodegradability and maximum biogas yield from PCP waste was the target of the current study. The production and degradation of volatile fatty acids during the AD of PCP waste were assessed. Moreover, microbial community shifts during the AD of PCP waste compared with the initial sludge inoculum were assessed and used to map the proposed mechanisms of the biodegradation process.
2. Materials and Methods
2.1. Anaerobic Biodegradability and Methane Production with Experimental Setup
Most anaerobic digestion and biodegradability assays are carried out using mesophilic sludge or bacteria within the temperature range of 30–40 °C [22,23] and, more specifically, at a temperature range of 35–37 °C under stirring or stagnant conditions [25,26]. The duration of the experiment is also important: it is recommended to last for at least 21 days, with most lasting for 100 days for solid wastes [27].
Batch anaerobic digestion bioassays were carried out to assess bioremediation and biogas production from three different potato chip processing wastes inoculated with mesophilic anaerobic sludge at different S/I ratios. The experiments were carried out in duplicate under mesophilic conditions (37 °C). Graduated serum bottles with 100 mL volumetric capacity were used for each sample, with 20 mL headspace left in each bottle to accommodate the generated biogas. Four different S/I ratios were used for each substrate. The S/I ratios were 0.5, 1.0, 1.5, and 2.0, as shown in Table 1. In addition, control bottles containing only demi-water and sludge inoculum were used to measure the potential biogas production of the sludge inoculum. Phosphorus from KH2PO4 and nitrogen from NH4Cl were added according to the following ratio: 200 (COD): 5 (N): 1 (P) or 142.9 (g volatile solids): 5 (N): 1 (P), assuming 1 g VS has 1.4 g COD.

Table 1.
Different batches used in the anaerobic digestion experiment with different S/I ratios.
2.2. Source of the Sludge Inoculum
The sludge inoculum was sampled from the anaerobic digester of excess sludge at Al-Gabal Al-Asfar wastewater treatment plant, the largest activated sludge municipal wastewater treatment plant in Egypt. The sludge sample was subjected to the laboratory analysis of total solids (TS), volatile solids (VS), total Kjeldahl nitrogen (TKN), and total phosphorus (TP) according to standard methods (APHA 2023) [28].
The characteristics of the anaerobic sludge inoculum are presented in Table 2. The experiment continued until the end or until the cessation of biogas production.
Table 2.
Laboratory analyses of the anaerobic sludge inoculum *.
2.3. Sampling of PCP Wastes
PCP wastes including EPCs, RPS, and PP were collected from one of the largest potato chip processing factories in Egypt. The factory is located in the industrial city of 6th of October. Figure 1 shows a diagram of the industrial process, including types of generated solid wastes and wastewater streams. Speed washing and dehydration processes generate wastewater laden with a high concentration of potato starch, which should be recovered to reduce pollution. The process of starch recovery from the wastewater stream is carried out using rotating drums partially or half submerged in the wastewater tank, where the starch is deposited on their surface and automatically removed from the drum surface with skimmer. The RPS was collected from the starch recovery machine. PP was obtained from a curved wastewater screen used to separate the potato peel from the wastewater generated from the peeling process. EPC waste was collected from the factory and included expired products returned from the market, products rejected during the inspection process, and products that had fallen on the ground during the production and packaging process. The potato peel was washed several times with tap water to remove mud and then dried at 70 °C before use. The RPS was dried in an oven at 70 °C before use. All solid wastes were ground using an electric grinder.
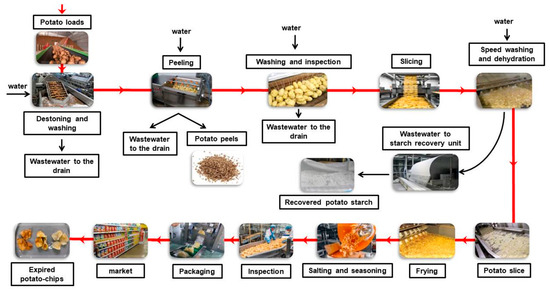
Figure 1.
Schematic diagram of the PCPI showing sources of organic solid wastes.
2.4. Analytical Methods
The pH value was measured using a JENWAY 3510 device (Jenway or Cole-Parmer, Stone, Staffordshire, UK); chemical oxygen demand (COD) was measured by the HACH method; and ammonia–nitrogen (NH4-N) (steam distillation, Behr S-1, Behr Labor-Technik GmbH, Düsseldorf, Germany), TKN (Macro Kjeldahl digestion followed by steam distillation, Behr S-1, Behr Labor-Technik GmbH, Düsseldorf, Germany), TS (drying oven, DHG-9055A, Guangdong GRANDE Automatic Test Equipment Limited, Guangdong, China), and VS (muffle furnace, Vulcan A-550, Dentsply NeyTech, Minnesota, USA) were measured according to the standard methods for the examination of water and wastewater [28]. TP was analyzed using the potassium persulfate digestion method followed by colorimetric measurement using the vanadomolybdate method (APHA 2023) [28]. For solid wastes, crude protein was calculated using the TKN method (Crude protein = Organic nitrogen or TKN × 6.25) as described by [29], while lipids, crude fiber, and carbohydrates were measured using the methods described in [30]. All chemicals used in this study were of analytical reagent (AR) grade.
Biogas composition was determined using a portable biogas 5000 gas analyzer (Geotech, Geotechnical Instruments (UK) Ltd., London, UK). VFAs in terms of propionate (HPr), acetate (HAc), and butyrate (HBu) were determined using a high-performance liquid chromatography (HPLC) instrument (Agilent 1260, Agilent Technologies, Santa Clara, California, USA). HPLC analysis was performed using InertSustain manufactured by GL Science Incorporation, Tokyo, Japan. Separation was carried out using the Eclipse AQ-C18 HP column (4.6 mm × 150 mm i.d., 3 μm) manufactured by GL Science Incorporation, Tokyo, Japan. The mobile phase comprised 0.005-N sulfuric acid. The mobile phase was programmed consecutively in a linear gradient for the following flow rates: 0–4.5 min (0.8 mL/min); 4.5–4.7 min (1 mL/min); 4.7–4.71 min (1 mL/min); 4.71–8.8 min (1.2 mL/min); 8.8–9 min (1.3 mL/min); 9–23 min (1.3 mL/min); and 23–25 min (0.8 mL/min). A diode array detector was fixed at 210 nm. The injection volume was 5 μL for each sample solution. The column temperature was maintained at 55 °C.
2.5. Microbial Community Analysis: DNA Extraction and Metataxonomic Analysis
Samples from the sludge inoculum (I) and from the reactors at the optimum S/I ratios of EPCs, RPS, and PP were collected for microbial analysis. About 0.5 mL from the sample was used for DNA extraction using the PureLink™ Microbiome DNA Purification Kit (Invitrogen™, ThermoFisher Scientific, Waltham, MA, USA) according to the manufacturer’s instructions. High-throughput sequencing was performed using the 16S rRNA gene on an Illumina platform using the Nextera XT Index Kit (Illumina, San Diego, CA, USA) according to the methods described elsewhere [4].
3. Results and Discussion
3.1. Physicochemical Characteristics of PCP Waste
The physicochemical characteristics of the organic solid waste (EPCs, RPS, and PP) from the PCPI are shown in Table 3. The results showed great variation in the total carbohydrates, crude protein, and fat and lipid content of the three solid wastes. This variation is expected to affect the biogas yield of the wastes [31]. As shown by the results, RPS has limited nitrogen and phosphorous content; both are necessary for microbial growth, but a high protein content in the waste may cause the excessive release of ammonia during the anaerobic digestion process. This ammonia may cause a rise in the pH with a subsequent increase in the fraction of free ammonia, which inhibits the AD process at excessive concentrations [32,33]. Anaerobic sludge inoculum is added as a source of microbial consortium to reduce the lag phase and enhance biogas yield. Additionally, anaerobic sludge inoculum acts as a source of nitrogen and phosphorous and compensates for their deficiency in RPS. However, in this study, nitrogen and phosphorus from chemical sources were added to neutralize nitrogen and to address the phosphorous deficiency in the solid wastes, as mentioned in the Materials and Methods (Section 2.1).
Table 3.
Laboratory analyses of solid wastes collected from the potato chip processing industry (PCPI) *.
3.2. Impact of S/I Ratio on Biogas Yield
Figure 2 shows the results for the cumulative biogas at the different S/I ratios for EPCs, RPS, and PP. The results confirm the importance of optimizing the appropriate inoculum dosage to enhance the microbial anaerobic digestion of organic wastes. The experiments were run using four different S/I ratios ranging from 0.5 to 2.0. There was a distinct variation in the initial biogas yield during the first week of the EPC, RPS, and PP AD process compared to the control batch (CB).
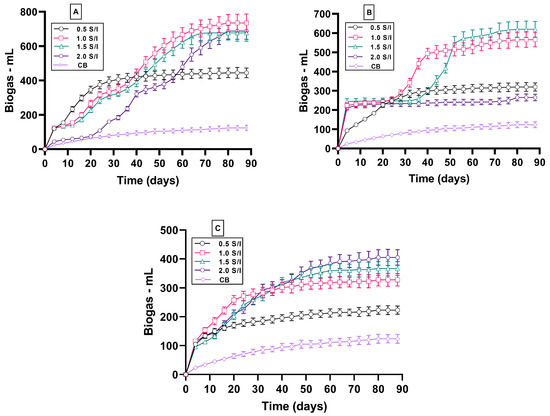
Figure 2.
Cumulative biogas yield for EPCs (A), RPS (B), and PP (C) at different S/I ratios.
Figure 2A shows that the initial production of biogas for the lower EPC S/I ratios, i.e., EPC-0.5, EPC-1.0, and EPC-1.5, exhibits better performance than the higher S/I ratio, i.e., EPC-2.0, while the start-up performance for PP exhibited the same amount of produced biogas for all S/I ratios (Figure 2B). The lower initial biogas production at an S/I ratio of 2 in the case of EPCs could be attributed to the high content of fat and lipids in the waste. In the case of RPS, the initial biogas production for the S/I ratios of 1.0, 1.5, and 2.0 exhibits better performance than for the S/I ratio of 0.5 (Figure 2C). This observation was attributable to a consequent increase in the active methanogen population caused by increased organic load. The same observation was made by Owamah and his colleagues [34], who reported that the start-up using higher S/I ratios was much better than with lower S/I ratios for the digestion of food waste and maize husk. On the other hand, during the anaerobic digestion of potato peel waste, increasing the inoculum-to-substrate ratio significantly improved the biogas yield [17]. The variation between the observations made by Achinas [17] and those in the current study may be attributed to the variation in the solid content of the reactor, since Achinas and his colleagues [17] used 1% solid content in contrast to the 2% used in the current study. Determining the optimum S/I ratio is crucial to enhance biogas production and is essential for further large-scale anaerobic digestion operations, as reported by Raposo et al. (2009) [35]. However, the differences in performance shown in Figure 2 and a direct comparison of biogas production from EPCs, RPS, and PP have not previously been documented. After 90 days of the AD of EPCs, RPS, and PP, the cumulatively produced biogas from the anaerobic digestion of EPC-0.5 was higher than that of the CB by a factor of 3.5; however, the produced biogas increased 5.9-, 5.4-, and 5.5-fold for EPC-1.0, EPC-1.5, and EPC-2.0, as shown in Figure 2A. To our knowledge, no previous study has been found to use this substrate-to-inoculum ratio to enhance biogas production from EPCs to make a comparison.
Regarding the AD of RPS, the produced biogas increased from 124 mL for the CB to 318 mL, 566 mL, 620 mL, and 265 mL for RPS-0.5, RPS-1.0, RPS-1.5, and RPS-2.0. The results confirmed that the optimum S/I ratio for the AD of RSP was RSP-1.5. In the last comparison of the AD of PP, the produced biogas of PP-2.0 was the optimum as the produced biogas reached 3.2 times greater than the CB. However, the biogas produced by PP-0.5 was only 1.7 times greater than the CB, and this increased to 2.6 for PP-1.0 and 2.9 for PP-1.5. These results regarding the mono-digestion of PP and EPCs differed from those of Zhang et al. (2019) [36], who compared the mono-digestion of PP and potato waste at only two S/I ratios of 0.5 and 1.0, reporting that the optimum S/I for both substrates was 0.5. The methane content of the biogas was 75%, 73%, and 71% for EPCs, RSP, and PP. These percentages were higher than those found by Liang et al. (2015) [22], who reported that the methane content of biogas ranged from 60% to 70% for an anaerobic digester inoculated with PP and lactic acid fermentation residue.
Figure 3 shows the biogas yield for the control and different S/I ratios of EPCs, RPS, and PP. The biogas yield was 62.0 mL/g VS added for CB, and this value increased by a factor of 2.5, 4.9, 4.4, and 4.5 for EPC-0.5, EPC-1.0, EPC-1.5, and EPC-2.0, as shown in Figure 3A. The optimum biogas yield using EPCs as a substrate was EPC-1.0, and the yield reached 338 mL/g VS added. This result was better than that reported by Jacob et al. (2016) [37], who used potato processing waste as a substrate for the dry anaerobic digestion process using 5 g TS/L and reported that the biogas yield only reached 239 L/kg VS added. Figure 3B shows that the biogas yield for the CB increased by factors of 1.5, 3.5, 4.0, and 1.1 for RPS-0.5, RPS-1.0, RPS-1.5, and RPS-2.0. However, using PP as a feedstock with different S/I ratios increased the biogas yield by a factor of 0.7, 1.6, 1.9, and 2.2 for PP-0.5, PP-1.0, PP-1.5, and PP-2.0, as shown in Figure 3C. The optimum biogas yields for EPCs, RPS, and PP were 338 mL/g VS added, 310 mL/g VS added, and 202 mL/g VS added. The better results obtained by EPCs and RPS in comparison to PP could be attributed to the higher content of lipids and fats in the case of EPCs (Table 3). It is well known that fat and lipids have a higher carbon content than protein and carbohydrates, leading to a greater biogas yield under anaerobic digestion. Moreover, RPS contains more digestible carbohydrates (starch) than PP, which contains more fiber and ash (Table 3). The biogas yield in this study was lower than for Zhang et al. (2019) [36], who reported 439 mL and 348 mL CH4/g VS via the mono-digestion of parts of potato and PP, respectively. The results of the biogas yields confirm that there is no ideal S/I ratio for all substrates, as the optimum S/I ratio for EPCs was 1.0, for RPS was 1.5, and for PP was 2.0.
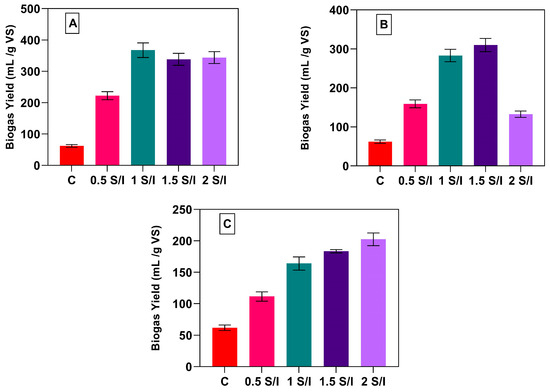
Figure 3.
Biogas yield in mL/g VS added for EPCs (A), RPS (B), and PP (C) at different S/I ratios.
3.3. Effect of Using Different S/I Ratios on Treatment Efficiency and VFA Degradation for EPCs, RPS, and PP
Figure 4A shows the TS degradation for the different S/I ratios. The TS degradation ranged from 29.9% for S/I 0.5 to 42.1% for S/I 1.0 using EPCs as the substrate. The removal of TS for RPS after using S/I ratios of 1.5 and 2.0 was comparable, indicating that the behavior of the bacteria was very similar for both S/I ratios. Using RPS as a substrate changed the behavior of the bacterial community regarding to the digestion of TS. The degradation of TS was 16.1% after using an S/I ratio of 0.5 for RPS, and this degradation doubled to 32.9% after doubling the S/I ratio to 1.0. Increasing the S/I ratio to 1.5 resulted in the degradation of TS reaching 57.6%, and a further increase in the S/I ratio to 2.0 led to a decrease in degradation to 41.8%. This indicates that increasing the ratio beyond a certain point caused toxicity, confirming that there is no constant S/I ratio for all substrates.
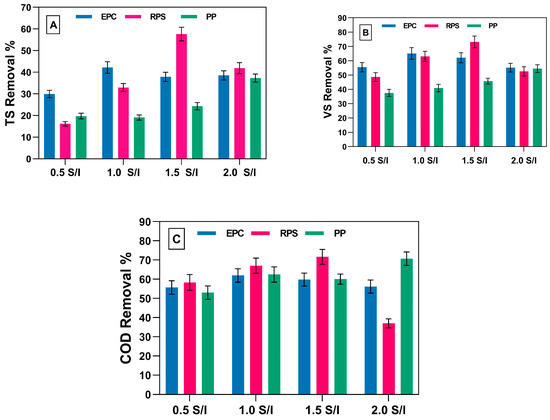
Figure 4.
Biodegradation of TS (A), VS (B), and COD (C) of EPCs, RPS, and PP at different S/I ratios.
The degradation of TS after using PP increased gradually: 19.0%, 19.7%, 24.2%, and 37.2% for S/I ratios of 0.5, 1.0, 1.5, and 2.0. This finding differed from those of Liang et al. (2015) [22], who used only one ratio of S/I (1.0) and reported that the TS degradation reached 74.5%. As shown in Figure 4B, the optimum degradation for VS after using EPCs, RPS, and PP was achieved with S/I ratios of 1.0, 1.5, and 2.0. This was the same as the trend observed for the degradation of TS, indicating that the degradation of VS was comparable to the best biogas yield, as shown in Figure 2. The degradation of VS by PP reached 57.5% at an S/I ratio of 2.0; this result was better than Liang et al.’s (2015) [22], who reported that VS removal reached 35.5% for an S/I ratio of 1.0. Figure 4C shows COD degradation for the three different types of waste at different S/I ratios. COD degradation, after using EPCs as a substrate, was very close for all S/I ratios, ranging from 55.6% to 61.9%. The optimum COD removal was achieved with an S/I ratio of 1.0, which differed from the findings of Zhang et al. (2019) [36], who reported an optimum S/I ratio of 0.5. COD degradation using RPS varied widely, ranging from 37% for an S/I ratio of 2.0 to 67% for an S/I ratio of 1.5. This result was lower than Antwi et al.’s (2017) [38], who reported the removal of COD using an up-flow anaerobic sludge blanket (UASB) at an organic loading rate (OLR) ranging from 2.7 kg COD/m3.d to 13.27 kg COD/m3.d for various hydraulic retention times (72 h, 48 h, and 36 h). Using this scheme, COD degradation ranged from 92.1% to 97.7%. Using PP as a substrate, 53%, 62.4%, 60%, and 70.7% of COD was removed with S/I ratios of 0.5, 1.0, 1.5, and 2.0. The total volatile fatty acid (T.VFA) groups varied significantly after treatment with all substrates and different S/I ratios, as shown in Table 4. The table shows that the total volatile fatty acids produced after digestion were 187 mg/L for EPC-0.5 and 165 mg/L for EPC-1.0. For EPC-1.5 and EPC-2.0, the final T.VFA concentrations were 135 mg/L and 274 mg/L, respectively. These findings indicate that lower substrate-to-inoculum (S/I) ratios in EPCs do not significantly enhance T.VFA degradation during the anaerobic digestion process. The high degradation rate confirms that the microorganisms utilized different acetic, propionic, and butyric acid groups. Furthermore, the optimization of S/I ratios accelerated the transfer of electrons from acetogens as an energy source for the methanogens, resulting in a more significant conversion of T.VFAs to bio-methane. Regarding T.VFA production using PP as a substrate, there were differences in the amount of certain acids in the fermenters compared to other substrates, as shown in Table 4. Some studies have attributed the increased VFA yields to the involvement of organic matter and the microbial community [39,40]. For example, when adding different types of substrates, some major phyla, such as Firmicutes, Chlorolipids, and Proteobacteria, significantly changed, as also observed by Ma et al. (2017) [41].
Table 4.
The main VFAs produced by EPCs, RPS, and PP at different S/I ratios in mg/L.
3.4. Microbial Community Shifts for AD of PCP Waste at Optimum S/I Ratios
At the phylum level, there was a significant difference between the inoculum sludge, ECP-1.0, RPS-1.5, and PP-2.0, as shown in Figure 5. Firmicutes, Proteobacteria, and Chloroflexi were the dominant phyla in the four samples. Figure 5 shows that the inoculum sludge was dominated by representatives of the bacteria Firmicutes (42.0%) and Proteobacteria (16.5%) and other co-dominating phyla like Chloroflexi (11.11%), Bacteroidota (8.9%), Actinobacteriota (5.6%), Fusobacteriota (5.5%), Synergistota (2.1%), and Euryarchaeota (0.29%) respectively. These relative abundances were similar to those reported by Al-Shemy et al. (2024) [42], who used the same inoculum from the same source treatment plant for the enhancement of biogas production from landfill leachate.
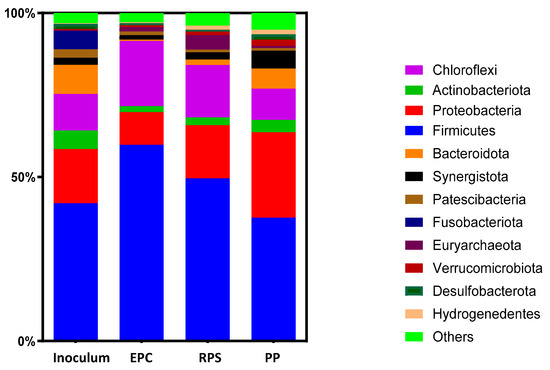
Figure 5.
Composition of microbial communities in samples of inoculum sludge, optimum EPC-1.0, RPS-1.5, and PP-2.0 at phylum levels.
Figure 5 shows that after adding EPCs as an inoculum sludge at an S/I ratio of 1.0 as the optimum ratio, the Firmicutes phylum increased to 59.8% compared to the inoculum sludge (42.0%). However, these values were 49.6% and 37.5% using RPS-1.5 and PP-2.0 as substrates, and this variation confirms the significant difference between the microbial community compositions using the same potato industry waste [43]. The content of Firmicutes decreased after using PP as a substrate and was close to the inoculum sludge using RPS. This was due to the fact that fiber produced from the potato starch and potato peel reduced the growth of the Firmicutes phylum, as reported in the literature [44,45]. The content of the phylum Chloroflexi increased from 11.11% to 19.8% and 15.9% using EPC-1.0 and RPS-1.5 as substrates; however, this percentage decreased to 9.5% using PP-2.0 as a substrate. The increase in the Chloroflexi phylum when RPS was used as a substrate aligns with the findings of Antwi and his colleagues [46], who reported a similar rise in Chloroflexi abundance using potato starch wastewater. Chloroflexi are hydrolytic fermentative bacteria that have the tendency to accelerate the anaerobic degradation of cellulose via the production of cellulosomes to degrade recalcitrant microcrystalline cellulose [47]. Chloroflexi [45] can always be enriched under alkaline conditions, and these bacteria mainly participate in VFA generation. The low amount of this phylum in the PP community confirms the VFA results obtained using PP as a substrate [41]. The abundance of Proteobacteria decreased to 9.9% when using EPC-1.0, and a value of 16.1% was recorded as a significant percent with inoculum sludge (16.5%) using RPS-1.5 as a substrate, which increased to 26.0% using PP-2.0 as a substrate. Similarly, Proteobacteria was found to account for 12.7% of the entire microbial community during the processing of potato starch from wastewater in a UASB [46]; however, in this study, Proteobacteria were only slightly affected by starch waste, decreasing from 16.5% to 16.1%. The Proteobacteria phylum increased when PP was used as a substrate, in agreement with prior reports that Proteobacteria were enriched under alkaline conditions with added agricultural residue like potato peels [48]. Moreover, Proteobacteria were the second most abundant phylum when using PP as a substrate. This may be attributed to the fact that the Pseudomonadaceae family from the Proteobacteria phylum may be increased in the AD system due to its strong correlation with cellulose utilization during the AD process [49,50]. Fusobacteriota are Gram-negative, non-motile, rod-shaped bacteria. The Fusobacteriota phylum is made up of two main families, Fusobacteriaceae and Leptotrichiaceae [51], and disappeared from all batches apart from the inoculum sludge. This confirms that Fusobacteriota cannot survive with all types of potato processing wastes. However, the abundance of Euryarchaeota increased from 0.2% in the inoculum sludge to a significant percent under all types of potato processing wastes. The Euryarchaeota phylum is responsible for acetate biosynthesis (including carbon monoxide dehydrogenase and enzymes mainly produced by Firmicutes) [52]. The abundance of Euryarchaeota increased from 0.29% to 1.3%, 4.4%, and 0.6% in treatments EPC-1.0, RPS-1.5, and PP-2.0, respectively. Using RPS as a substrate caused an increase in the abundance of the Euryarchaeota phylum 15-fold: the same observation was made by the researchers in [38], who stated that Euryarchaeota increased by using potato starch processing wastewater as substrate. Bacteroidota disappeared when EPC-1.0 and RPS-1.5 were used against a significant percent (6.1%) in the case of PP-2.0. Some species of Bacteroidota are considered hydrolytic microbes, assisting in the conversion of macro molecular organic compounds, such as cellulose, protein, and lipids, into simple organic compounds. Hafez et al. (2024) [53] stated that the abundance of Bacteroidota increased from 0.89% to 32.0% when using paper mill sludge, which is rich in cellulose, as a substrate. The content of the Synergistota phylum increased from 2.1% in the inoculum sludge to 5.4% in the case of PP-2.0, which may be because Synergistota are cellulostic bacteria. This is similar to the observation made by Luiz et al. (2023) [54], who reported that the abundance of Synergistota increased by 10% compared to inoculum sludge after using micro-crystalline cellulose in batch and pilot scales.
3.5. Biodegradation Pathways of PCP Waste
The anaerobic biodegradation of carbohydrates, lipids, and cellulose occurs due to bacterial and enzymatic activities, as shown in Figure 6. EPCs, which are composed mainly of carbohydrates and lipids, are degraded into mono-sugars and long-chain fatty acids by the bacterial activities of Firmicutes, Proteobacteria, Chloroflexi, and Acinetobacter. The Proteobacteria and Firmicutes phyla have a high capability for secreting alpha amylase and lipase enzymes [55] required for the degradation of carbohydrates and lipids in EPCs. The same situation occurs for RPS, which mostly contains starch. This starch is degraded to simple sugars, mainly by bacteria from Proteobacteria and Firmicutes phyla. The released sugars are converted into hydrogen, which is then converted during methanogenesis into carbon dioxide and methane. PP is usually converted into mono-sugars by the bacterial activities of the Proteobacteria and Bacteroidota phyla. Proteobacteria and Bacteroidota have a high capability for secreting cellulose enzymes required for the organic degradation of PP. In addition, most of the members of the phylum Proteobacteria that break down cellulose were represented by Pseudomonas spp. and the lignocellulolytic-related genus, Enterobacter sp. [56]. Mono-sugars are converted into pyruvic acids, which are then converted into hydrogen, which is subsequently converted into biogas through methanogenesis.
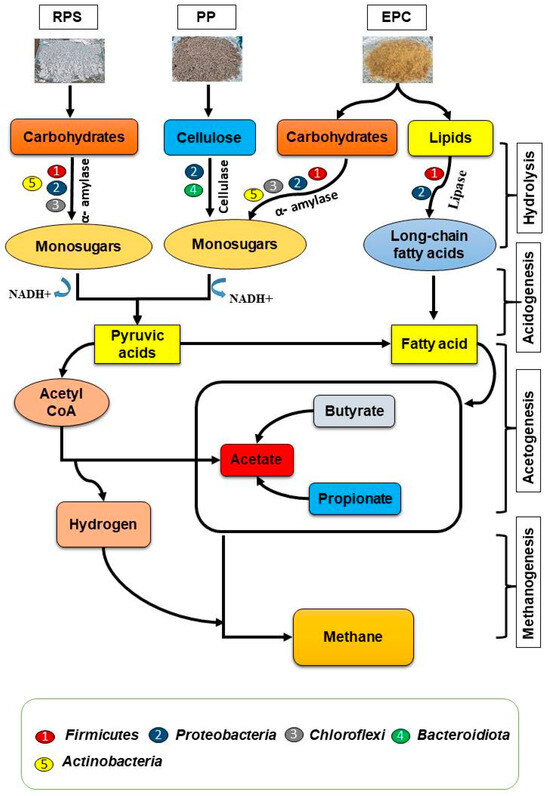
Figure 6.
The interactions between enzymatic metabolism pathways and AD routes of EPCs, RPS, and PP.
4. Conclusions
Buttressing the earlier reports that the addition of an inoculum could enhance biogas production from various substrates, this study has demonstrated that an inoculum/substrate ratio ranging from 0.5 to 2.0 could greatly enhance the biogas yield and methane content from the AD of PCP wastes, namely, EPCs, RPS, and PP. Biogas yield was found to vary with inoculum/substrate ratios as well as the source of substrate. The optimum S/I ratios that provided maximum biogas yield were 1.0, 1.5, and 2.0 for EPCs, RPS, and PP, respectively. The microbial community changed for each substrate, as the abundance of Firmicutes increased from 42% in the CB to 59.8% in EPC-1.0, 49.6% in RPS-1.5, and 37.5% in PP-2.0. The content of Proteobacteria decreased from 16.5% to 9.9% when using EPC-1.0, and the same percentage of inoculum sludge was found when using RPS-1.5 and increased to 26.0% with PP-2.0. The study’s findings add to existing knowledge of sustainable biofuel production, suggesting that different PCP wastes can serve as potential feedstock for AD processes for renewable energy production. Future research should focus on mixing EPCs, RPS, and PP to maximize the efficiency of biogas production and industrial full-scale applications.
Author Contributions
S.A.E.-S.: Funding Acquisition, Validation, Conceptualization, Writing—Original Draft, Review and Editing, Data Curation, and Submission. G.K.H.: Experimental Setup, Formal Analysis, Methodology, and Writing—Original Draft. A.G.G.: Methodology, Formal Analysis, and Writing—Original Draft. K.M.A.: Methodology, Formal Analysis, Validation, and Data Curation. D.-F.D.: Validation, Review and Editing. E.K.: Validation, Review and Editing. E.Y.T.: Conceptualization, Validation, Review and Editing. All authors have read and agreed to the published version of the manuscript.
Funding
This study was financed by the Science and Technology Development Fund (STDF) and the National Academies, Sciences, Engineering and Medicine (NASEM) within the framework of the U.S.–Egypt Science and Technology Joint Fund Cycle 21. The project title is ‘Valorization of agro-industrial waste and wastewater for biofuel and fish production’ (project ID 21000171).
Data Availability Statement
Data will be made available on request.
Acknowledgments
The authors would like to extend their sincere thanks to the Science and Technology Development Fund (STDF) and National Academies, Sciences, Engineering and Medicine (NASEM).
Conflicts of Interest
The authors declare that they have no known financial, personal, or professional conflicts that could have appeared to influence the work reported in this paper. All authors have approved the manuscript and agree with its submission. The research was conducted without any involvement of entities that could be perceived to have a vested interest in the outcomes of this study.
References
- Zaky, A.S.; French, C.E.; Tucker, G.A.; Du, C. Improving the Productivity of Bioethanol Production Using Marine Yeast and Seawater-Based Media. Biomass Bioenergy 2020, 139, 105615. [Google Scholar] [CrossRef]
- Monir, M.U.; Aziz, A.A.; Khatun, F.; Yousuf, A. Bioethanol Production through Syngas Fermentation in a Tar Free Bioreactor Using Clostridium Butyricum. Renew. Energy 2020, 157, 1116–1123. [Google Scholar] [CrossRef]
- Ferreira, S.; Moreira, N.A.; Monteiro, E. Bioenergy Overview for Portugal. Biomass Bioenergy 2009, 33, 1567–1576. [Google Scholar] [CrossRef]
- Hellal, M.S.; Gamon, F.; Cema, G.; Hassan, G.K.; Mohamed, G.G.; Ziembińska-Buczyńska, A. Nanoparticle-Assisted Biohydrogen Production from Pretreated Food Industry Wastewater Sludge: Microbial Community Shifts in Batch and Continuous Processes. Energy Convers. Manag. 2024, 299, 117824. [Google Scholar] [CrossRef]
- Moharram, N.A.; Tarek, A.; Gaber, M.; Bayoumi, S. Brief Review on Egypt’s Renewable Energy Current Status and Future Vision. Energy Rep. 2022, 8, 165–172. [Google Scholar] [CrossRef]
- Moustakas, K.; Rehan, M.; Loizidou, M.; Nizami, A.S.; Naqvi, M. Energy and Resource Recovery through Integrated Sustainable Waste Management. Appl. Energy 2020, 261, 114372. [Google Scholar] [CrossRef]
- Nair, L.G.; Agrawal, K.; Verma, P. An Overview of Sustainable Approaches for Bioenergy Production from Agro-Industrial Wastes. Energy Nexus 2022, 6, 100086. [Google Scholar] [CrossRef]
- Abanades, S.; Abbaspour, H.; Ahmadi, A.; Das, B.; Ehyaei, M.A.; Esmaeilion, F.; El Haj Assad, M.; Hajilounezhad, T.; Jamali, D.H.; Hmida, A.; et al. A Critical Review of Biogas Production and Usage with Legislations Framework across the Globe. Int. J. Environ. Sci. Technol. 2022, 19, 3377–3400. [Google Scholar] [CrossRef]
- Hassan, G.K.; Mahmoud, W.H.; Al-sayed, A.; Ismail, S.H.; El-Sherif, A.A.; Abd El Wahab, S.M. Multi-Functional of TiO2@Ag Core–Shell Nanostructure to Prevent Hydrogen Sulfide Formation during Anaerobic Digestion of Sewage Sludge with Boosting of Bio-CH4 Production. Fuel 2023, 333, 126608. [Google Scholar] [CrossRef]
- Mo, W.Y.; Man, Y.B.; Wong, M.H. Use of Food Waste, Fish Waste and Food Processing Waste for China’s Aquaculture Industry: Needs and Challenge. Sci. Total Environ. 2018, 613–614, 635–643. [Google Scholar] [CrossRef]
- Hassan, G.K.; Al-Sayed, A.; Afify, A.A.; El-Liethy, M.A.; Elagroudy, S.; El-Gohary, F.A. Production of Biofuels (H2&CH4) from Food Leftovers via Dual-Stage Anaerobic Digestion: Enhancement of Bioenergy Production and Determination of Metabolic Fingerprinting of Microbial Communities. Egypt. J. Chem. 2021, 64, 4105–4115. [Google Scholar] [CrossRef]
- Yang, X.; Chen, H.; Gao, H.; Li, Z. Bioconversion of Corn Straw by Coupling Ensiling and Solid-State Fermentation. Bioresour. Technol. 2001, 78, 277–280. [Google Scholar] [CrossRef]
- Devaux, A.; Goffart, J.-P.; Kromann, P.; Andrade-Piedra, J.; Polar, V.; Hareau, G. Correction to: The Potato of the Future: Opportunities and Challenges in Sustainable Agri-Food Systems. Potato Res. 2022, 65, 209–210. [Google Scholar] [CrossRef]
- Goffart, J.-P.; Haverkort, A.; Storey, M.; Haase, N.; Martin, M.; Lebrun, P.; Ryckmans, D.; Florins, D.; Demeulemeester, K. Potato Production in Northwestern Europe (Germany, France, the Netherlands, United Kingdom, Belgium): Characteristics, Issues, Challenges and Opportunities. Potato Res. 2022, 65, 503–547. [Google Scholar] [CrossRef]
- Sampaio, S.L.; Petropoulos, S.A.; Alexopoulos, A.; Heleno, S.A.; Santos-Buelga, C.; Barros, L.; Ferreira, I.C.F.R. Potato Peels as Sources of Functional Compounds for the Food Industry: A Review. Trends Food Sci. Technol. 2020, 103, 118–129. [Google Scholar] [CrossRef]
- Allam, A.; Mahmoud, M.; Mahmoud, S. An Analytical Study of the Production, Consumption and Exports of Potatoes in Egypt. Int. J. Environ. Stud. Res. 2022, 1, 274–284. [Google Scholar] [CrossRef]
- Achinas, S.; Li, Y.; Achinas, V.; Euverink, G.J.W. Biogas Potential from the Anaerobic Digestion of Potato Peels: Process Performance and Kinetics Evaluation. Energies 2019, 12, 2311. [Google Scholar] [CrossRef]
- Fang, C.; Boe, K.; Angelidaki, I. Biogas Production from Potato-Juice, a by-Product from Potato-Starch Processing, in Upflow Anaerobic Sludge Blanket (UASB) and Expanded Granular Sludge Bed (EGSB) Reactors. Bioresour. Technol. 2011, 102, 5734–5741. [Google Scholar] [CrossRef]
- Bialek, K.; Kim, J.; Lee, C.; Collins, G.; Mahony, T.; O’Flaherty, V. Quantitative and Qualitative Analyses of Methanogenic Community Development in High-Rate Anaerobic Bioreactors. Water Res. 2011, 45, 1298–1308. [Google Scholar] [CrossRef]
- Nielfa, A.; Cano, R.; Fdz-Polanco, M. Theoretical Methane Production Generated by the Co-Digestion of Organic Fraction Municipal Solid Waste and Biological Sludge. Biotechnol. Rep. 2015, 5, 14–21. [Google Scholar] [CrossRef]
- Achinas, S.; Euverink, G.J.W. Theoretical Analysis of Biogas Potential Prediction from Agricultural Waste. Resour. Technol. 2016, 2, 143–147. [Google Scholar] [CrossRef] [PubMed]
- Liang, S.; McDonald, A.G. Anaerobic Digestion of Pre-Fermented Potato Peel Wastes for Methane Production. Waste Manag. 2015, 46, 197–200. [Google Scholar] [CrossRef]
- Elbeshbishy, E.; Nakhla, G.; Hafez, H. Biochemical Methane Potential (BMP) of Food Waste and Primary Sludge: Influence of Inoculum Pre-Incubation and Inoculum Source. Bioresour. Technol. 2012, 110, 18–25. [Google Scholar] [CrossRef] [PubMed]
- Müller, W.-R.; Frommert, I.; Jörg, R. Standardized Methods for Anaerobic Biodegradability Testing. Rev. Environ. Sci. Bio/Technol. 2004, 3, 141–158. [Google Scholar] [CrossRef]
- Luo, J.; Zhou, J.; Qian, G.; Liu, J. Effective Anaerobic Biodegradation of Municipal Solid Waste Fresh Leachate Using a Novel Pilot-Scale Reactor: Comparison under Different Seeding Granular Sludge. Bioresour. Technol. 2014, 165, 152–157. [Google Scholar] [CrossRef]
- Neves, L.; Oliveira, R.; Alves, M.M. Influence of Inoculum Activity on the Bio-Methanization of a Kitchen Waste under Different Waste/Inoculum Ratios. Process Biochem. 2004, 39, 2019–2024. [Google Scholar] [CrossRef]
- Ponsá, S.; Gea, T.; Sánchez, A. Different Indices to Express Biodegradability in Organic Solid Wastes. J. Environ. Qual. 2010, 39, 706–712. [Google Scholar] [CrossRef]
- APHA. Standard Methods for the Examination of Water and Wastewater, 24th ed.; Lipps, W.C., Braun-Howland, E.B., Baxter, T.E., Eds.; American Public Health Association: Washington, DC, USA; American Water Works Association: Denver, CO, USA; Water Environment Federation: Alexandria, VA, USA, 2023. [Google Scholar]
- El-Shafai, S.A.; Abdelfattah, I.; Nasr, F.A.; Fawzy, M.E. Lemna Gibba and Azolla Filiculoides for Sewage Treatment and Plant Protein Production. Res. J. Pharm. Biol. Chem. Sci. 2016, 7, 1869–1876. [Google Scholar]
- Beshaw, T.; Demssie, K.; Tefera, M.; Guadie, A. Determination of Proximate Composition, Selected Essential and Heavy Metals in Sesame Seeds (Sesamum Indicum L.) from the Ethiopian Markets and Assessment of the Associated Health Risks. Toxicol. Rep. 2022, 9, 1806–1812. [Google Scholar] [CrossRef]
- Abdul Aziz, N.I.H.; Hanafiah, M.M.; Mohamed Ali, M.Y. Sustainable Biogas Production from Agrowaste and Effluents—A Promising Step for Small-Scale Industry Income. Renew. Energy 2019, 132, 363–369. [Google Scholar] [CrossRef]
- Bücker, F.; Marder, M.; Peiter, M.R.; Lehn, D.N.; Esquerdo, V.M.; Antonio de Almeida Pinto, L.; Konrad, O. Fish Waste: An Efficient Alternative to Biogas and Methane Production in an Anaerobic Mono-Digestion System. Renew. Energy 2020, 147, 798–805. [Google Scholar] [CrossRef]
- Kim, M.J.; Kim, S.H. Conditions of Lag-Phase Reduction during Anaerobic Digestion of Protein for High-Efficiency Biogas Production. Biomass Bioenergy 2020, 143, 105813. [Google Scholar] [CrossRef]
- Owamah, H.I.; Ikpeseni, S.C.; Alfa, M.I.; Oyebisi, S.O.; Gopikumar, S.; David Samuel, O.; Ilabor, S.C. Influence of Inoculum/Substrate Ratio on Biogas Yield and Kinetics from the Anaerobic Co-Digestion of Food Waste and Maize Husk. Environ. Nanotechnol. Monit. Manag. 2021, 16, 100558. [Google Scholar] [CrossRef]
- Raposo, F.; Borja, R.; Martín, M.A.; Martín, A.; de la Rubia, M.A.; Rincón, B. Influence of Inoculum-Substrate Ratio on the Anaerobic Digestion of Sunflower Oil Cake in Batch Mode: Process Stability and Kinetic Evaluation. Chem. Eng. J. 2009, 149, 70–77. [Google Scholar] [CrossRef]
- Zhang, Y.; Caldwell, G.S.; Zealand, A.M.; Sallis, P.J. Anaerobic Co-Digestion of Microalgae Chlorella Vulgaris and Potato Processing Waste: Effect of Mixing Ratio, Waste Type and Substrate to Inoculum Ratio. Biochem. Eng. J. 2019, 143, 91–100. [Google Scholar] [CrossRef]
- Jacob, S.; Banerjee, R. Modeling and Optimization of Anaerobic Codigestion of Potato Waste and Aquatic Weed by Response Surface Methodology and Artificial Neural Network Coupled Genetic Algorithm. Bioresour. Technol. 2016, 214, 386–395. [Google Scholar] [CrossRef] [PubMed]
- Antwi, P.; Li, J.; Boadi, P.O.; Meng, J.; Koblah Quashie, F.; Wang, X.; Ren, N.; Buelna, G. Efficiency of an Upflow Anaerobic Sludge Blanket Reactor Treating Potato Starch Processing Wastewater and Related Process Kinetics, Functional Microbial Community and Sludge Morphology. Bioresour. Technol. 2017, 239, 105–116. [Google Scholar] [CrossRef]
- Yang, M.; Kuittinen, S.; Zhang, J.; Vepsäläinen, J.; Keinänen, M.; Pappinen, A. Co-Fermentation of Hemicellulose and Starch from Barley Straw and Grain for Efficient Pentoses Utilization in Acetone–Butanol–Ethanol Production. Bioresour. Technol. 2015, 179, 128–135. [Google Scholar] [CrossRef]
- Silvestre, G.; Fernández, B.; Bonmatí, A. Addition of Crude Glycerine as Strategy to Balance the C/N Ratio on Sewage Sludge Thermophilic and Mesophilic Anaerobic Co-Digestion. Bioresour. Technol. 2015, 193, 377–385. [Google Scholar] [CrossRef]
- Ma, H.; Liu, H.; Zhang, L.; Yang, M.; Fu, B.; Liu, H. Novel Insight into the Relationship between Organic Substrate Composition and Volatile Fatty Acids Distribution in Acidogenic Co-Fermentation. Biotechnol. Biofuels 2017, 10, 137. [Google Scholar] [CrossRef]
- Al-Shemy, M.T.; Gamoń, F.; Al-Sayed, A.; Hellal, M.S.; Ziembińska-Buczyńska, A.; Hassan, G.K. Silver Nanoparticles Incorporated with Superior Silica Nanoparticles-Based Rice Straw to Maximize Biogas Production from Anaerobic Digestion of Landfill Leachate. J. Environ. Manag. 2024, 365, 121715. [Google Scholar] [CrossRef]
- Barczynska, R.; Slizewska, K.; Litwin, M.; Szalecki, M.; Zarski, A.; Kapusniak, J. The Effect of Dietary Fibre Preparations from Potato Starch on the Growth and Activity of Bacterial Strains Belonging to the Phyla Firmicutes, Bacteroidetes, and Actinobacteria. J. Funct. Foods 2015, 19, 661–668. [Google Scholar] [CrossRef]
- Barczynska, R.; Jurgoński, A.; Slizewska, K.; Juśkiewicz, J.; Kapusniak, J. Effects of Potato Dextrin on the Composition and Metabolism of the Gut Microbiota in Rats Fed Standard and High-Fat Diets. J. Funct. Foods 2017, 34, 398–407. [Google Scholar] [CrossRef]
- Antwi, P.; Li, J.; Boadi, P.O.; Meng, J.; Shi, E.; Chi, X.; Deng, K.; Ayivi, F. Dosing Effect of Zero Valent Iron (ZVI) on Biomethanation and Microbial Community Distribution as Revealed by 16S RRNA High-Throughput Sequencing. Int. Biodeterior. Biodegrad. 2017, 123, 191–199. [Google Scholar] [CrossRef]
- Antwi, P.; Li, J.; Opoku Boadi, P.; Meng, J.; Shi, E.; Xue, C.; Zhang, Y.; Ayivi, F. Functional Bacterial and Archaeal Diversity Revealed by 16S RRNA Gene Pyrosequencing during Potato Starch Processing Wastewater Treatment in an UASB. Bioresour. Technol. 2017, 235, 348–357. [Google Scholar] [CrossRef]
- Lynd, L.R.; Weimer, P.J.; van Zyl, W.H.; Pretorius, I.S. Microbial Cellulose Utilization: Fundamentals and Biotechnology. Microbiol. Mol. Biol. Rev. 2002, 66, 506–577. [Google Scholar] [CrossRef]
- Guo, Z.; Zhou, A.; Yang, C.; Liang, B.; Sangeetha, T.; He, Z.; Wang, L.; Cai, W.; Wang, A.; Liu, W. Enhanced Short Chain Fatty Acids Production from Waste Activated Sludge Conditioning with Typical Agricultural Residues: Carbon Source Composition Regulates Community Functions. Biotechnol. Biofuels 2015, 8, 192. [Google Scholar] [CrossRef] [PubMed]
- Puentes-Téllez, P.E.; Salles, J.F. Dynamics of Abundant and Rare Bacteria During Degradation of Lignocellulose from Sugarcane Biomass. Microb. Ecol. 2020, 79, 312–325. [Google Scholar] [CrossRef]
- Tawfik, A.; Hassan, G.K.; Awad, H.; Hassan, M.; Rojas, P.; Sanz, J.L.; Elsamadony, M.; Pant, D.; Fujii, M. Strengthen “the Sustainable Farm” Concept via Efficacious Conversion of Farm Wastes into Methane. Bioresour. Technol. 2021, 341, 125838. [Google Scholar] [CrossRef] [PubMed]
- Gupta, R.S.; Sethi, M. Phylogeny and Molecular Signatures for the Phylum Fusobacteria and Its Distinct Subclades. Anaerobe 2014, 28, 182–198. [Google Scholar] [CrossRef] [PubMed]
- Palomba, A.; Tanca, A.; Fraumene, C.; Abbondio, M.; Fancello, F.; Atzori, A.; Uzzau, S. Multi-Omic Biogeography of the Gastrointestinal Microbiota of a Pre-Weaned Lamb. Proteomes 2017, 5, 36. [Google Scholar] [CrossRef]
- Hafez, R.M.; Tawfik, A.; Hassan, G.K.; Kandil Zahran, M.; Younes, A.A.; Ziembińska-Buczyńska, A.; Gamoń, F.; Nasr, M. Valorization of Paper-Mill Sludge Laden with 2-Chlorotoluene Using Hydroxyapatite@biochar Nanocomposite to Enrich Methanogenic Community: A Techno-Economic Approach. Biomass Bioenergy 2024, 190, 107401. [Google Scholar] [CrossRef]
- Luiz, F.N.; Passarini, M.R.Z.; Magrini, F.E.; Gaio, J.; Somer, J.G.; Meyer, R.F.; Paesi, S. Metataxonomic Characterization of the Microbial Community Involved in the Production of Biogas with Microcrystalline Cellulose in Pilot and Laboratory Scale. World J. Microbiol. Biotechnol. 2023, 39, 184. [Google Scholar] [CrossRef] [PubMed]
- Al-Fadhli, F.M.; Alhajeri, N.S.; Osman, A.I.; Tawfik, A. Enhancing Hydrogen Production from Oily Sludge: A Novel Approach Using Household Waste Digestate to Overcome Mono-Ethylene Glycol Inhibition. Int. J. Hydrog. Energy 2024, 17, 840–850. [Google Scholar] [CrossRef]
- Manfredi, A.P.; Perotti, N.I.; Martínez, M.A. Cellulose Degrading Bacteria Isolated from Industrial Samples and the Gut of Native Insects from Northwest of Argentina. J. Basic Microbiol. 2015, 55, 1384–1393. [Google Scholar] [CrossRef] [PubMed]
Disclaimer/Publisher’s Note: The statements, opinions and data contained in all publications are solely those of the individual author(s) and contributor(s) and not of MDPI and/or the editor(s). MDPI and/or the editor(s) disclaim responsibility for any injury to people or property resulting from any ideas, methods, instructions or products referred to in the content. |
© 2025 by the authors. Licensee MDPI, Basel, Switzerland. This article is an open access article distributed under the terms and conditions of the Creative Commons Attribution (CC BY) license (https://creativecommons.org/licenses/by/4.0/).