Article

Adsorption of Ammonium by Coal and Coal Fly Ash Derived from Hawthorn Tree from Aquatic Systems

by
Jonathan Suazo-Hernández
1,*,
Nicol Burgos
2,
María de Los Ángeles Sepúlveda-Parada
3,
Jorge Castro-Rojas
4,5,
Patricia Poblete-Grant
6,
Carmen Castro-Castillo
7,
Rawan Mlih
8,
Cristian Urdiales
9,
Tomás Schoffer
10,11,
Collin G. Joseph
12,13 and
Antonieta Ruiz
2
1
Facultad de Medicina Veterinaria y Agronomía, Universidad de Las Américas, Sede Concepción, Concepción 4030000, Chile
2
Department of Chemical Sciences and Natural Resources, Universidad de La Frontera, Avenida Francisco Salazar 01145, Temuco P.O. Box 54-D, Chile
3
Doctoral Program in Agricultural Sciences, VIS-IR Spectroscopy and Sustainable Soil Management Laboratory, Department of Soils and Natural Resources, Faculty of Agronomy, University of Concepción, Chillán 3780000, Chile
4
Escuela de Ciencias Ambientales y Sustentabilidad, Universidad Andres Bello, República 440, Santiago 8370251, Chile
5
Department of Chemistry, Faculty of Science, Universidad de La Serena, 1305 Raúl Bitrán Av., La Serena 1700000, Chile
6
Facultad de Medicina Veterinaria y Agronomía, Universidad de Las Américas, Campus Providencia, Manuel Montt 948, Santiago 7500975, Chile
7
Department of Chemical Engineering, Biotechnology and Materials, FCFM, Universidad de Chile, Avenida Beauchef 850, Santiago 8320000, Chile
8
Institute of Water and Environment (IWE), Al Azhar University-Gaza, Gaza P860, Palestine
9
Sede Vallenar, Universidad de Atacama, Av. Costanera #105, Vallenar 1612178, Chile
10
Núcleo de Investigación en Sustentabilidad Agroambiental (NISUA), Escuela de Agronomía, Facultad de Medicina Veterinaria y Agronomía, Universidad de Las Américas, Manuel Montt 948, Santiago 8320000, Chile
11
Center of Applied Ecology and Sustainability (CAPES), Pontificia Universidad Católica de Chile, Av. Libertador Bernardo O’Higgins 340, Santiago 8331150, Chile
12
Sonophotochemistry Research Group, Faculty of Science and Technology, Universiti Malaysia Sabah, Kota Kinabalu 88400, Sabah, Malaysia
13
Industrial Chemistry Programme, Faculty of Science and Technology, Universiti Malaysia Sabah, Kota Kinabalu 88400, Sabah, Malaysia
*
Author to whom correspondence should be addressed.
Processes 2025, 13(10), 3118; https://doi.org/10.3390/pr13103118
Submission received: 28 August 2025 / Revised: 20 September 2025 / Accepted: 24 September 2025 / Published: 29 September 2025
(This article belongs to the Special Issue Natural Low-Cost Adsorbents in Water Purification Processes)

Abstract

Excessive release of ammonium (NH4+) into aquatic ecosystems can promote eutrophication. In this study, the natural adsorbents, coal (C) prepared from Hawthorn (Acacia caven) and coal fly ash obtained from C, were used to remove NH4+ from aqueous systems through batch adsorption–desorption studies. Both adsorbents were physically and chemically characterized, while Fourier-transform infrared spectroscopy and zeta potential were used to understand the surface functional groups and surface charge characteristics. CFA showed a higher pH, BET specific surface area, electrical conductivity and higher % values for CaO and MgO than C. Kinetic studies of NH4+ adsorption at pH = 4.5 for both materials fitted the pseudo-second-order model giving the r2 of 0.970–0.983 and the χ2 of 0.008–0.005 and at pH = 6.5 only for C with the r2 of 0.986 and the χ2 of 0.013. Meanwhile, the adsorption isotherm data at pH = 4.5 for both materials and 6.5 for CFA complied with the Freundlich model (r2 > 0.965 and χ2 < 0.012), suggesting that NH4+ adsorption onto both adsorbents at those pH values occurred through the formation of a multilayer adsorption on heterogeneous surfaces. This indicates that the dominant adsorption of both adsorbents was physisorption with no site-specific interaction. Based on these results, CFA is proposed as a promising and economical material for the removal of NH4+ from aqueous systems.

1. Introduction

Nitrogen (N) is an essential nutrient for the diverse life forms that inhabit the planet. It is involved in many chemical structures that are fundamental to life, such as amino acids, peptides, proteins, and genetic material [1]. However, depending on the concentration and chemical form of N (NO2, NO3, NH3, and NH4+), this element can become highly toxic to living organisms, including humans [2,3]. In this context, ammonium (NH4+) in the soil promotes proper plant growth, which is why it is used in chemical fertilizers such as urea, ammonium nitrate, ammonium sulfate, and urea ammonium nitrate [4]. At the same time, this cation is used in the pharmaceutical industry, coal gasification processes, oil refining, and catalytic factories [5]. Due to the lack of control and the limited environmental regulation on anthropogenic activities, NH4+ is being massively discharged into surface water and groundwater, which has increased its concentration in various aqueous matrices [5]. It is estimated that approximately 2 million tons of NH4+ are released into the world’s fresh waters every day through industrial and agricultural waste [6]. This includes countries like Vietnam, with NH4+ concentrations in the order of 70 mg/L [7], in China, of 390 mg/L [8], and in Indonesia, of 84.9 mg/L [9]. These concentrations are much higher than the values that should be found naturally in surface and groundwater, which, according to the European Union, should be below 0.5 mg/L [10].
Excessive accumulation of NH4+ in aquatic systems not only causes eutrophication and oxygen depletion but also has harmful and detrimental effects on the health and survival of humans and aquatic organisms [11]. This is because the intake of water with a high concentration of NH4+ or its direct inhalation can cause diseases in humans, such as tracheobronchitis, laryngitis, bronchiolitis, bronchopneumonia, or pulmonary edema [12]. Likewise, the non-ionized form of NH4+ (ammonia, NH3), which predominates under basic pH conditions (pH 10), is even more dangerous for aquatic organisms [13]. Therefore, there is currently a need to increase NH4+ retention in agricultural soils and/or removal of NH4+ from freshwater systems designated for human consumption. This would contribute to safeguarding water quality and maintaining healthy aquatic ecosystems, thereby contributing to Sustainable Development Goal 6 (clean water and sanitation).
In general, various physicochemical techniques have been used to remove NH4+ from aqueous systems, including ion exchange, chemical precipitation, electrochemical oxidation, air extraction of NH4+, membrane separation, and adsorption [14]. Adsorption, in particular, is a physical technique widely used for the removal of NH4+ in aqueous systems [15]. In this process, NH4+ ions are adhered to the surface of an adsorbent material through mechanisms of electrostatic attraction, van der Waals interactions, and/or ion exchange [16]. Synthetic adsorbents, such as engineering nanoparticles (ENPs), including MgO [17], Fe3O4 [18], Ag [19], and natural adsorbents, including pomegranate peel [20], coal fly ash (CFA) [21], and biochar [22], have been used to remove NH4+ from aqueous systems. ENPs present some disadvantages related to their high costs and health and environmental risks. In contrast, the use of natural adsorbents is a promising and attractive alternative for NH4+ removal from aqueous systems because it is effective, economical, and environmentally sustainable [23,24]. An example of a natural adsorbent for NH4+ removal is coal (C). C is characterized by a highly porous matrix, offering a high surface area that possesses a variety of surface groups such as hydroxyls (-OH), carboxyls (-COO-), and phenolics, which have a high affinity for cations, including NH4+ [15]. Likewise, CFA has a negative surface charge and a low particle size, which benefits its use as an absorbent material [21]. In a study conducted by Chen et al. [25], an adsorption capacity of 139 mg/g for NH4+ was achieved by applying CFA from the Taiyuan first thermal power plant as an adsorbent. For their part, Affandi et al. [21] used CFA from plants and determined an adsorption of 7.17 mg/g for NH4+. This demonstrates that the adsorption capacity of NH4+ by CFA depends on the raw material used. Furthermore, environmental factors such as pH, temperature, and the concentration of other ions in the solution directly affect the efficiency of the adsorption process. To date, no adsorption studies have been conducted with C and CFA from Hawthorn (Acacia caven) considering different pH values. In Chile, Hawthorn is a characteristic tree of the dry interior of the central zone of Chile with a surface of around 3,800,000 ha [26]. Hawthorn is considered a medicinal plant widely used in phytotherapy. Its wooden parts are used to produce coal as a source of energy [27]. Further applications are not documented; therefore, using this abundant natural source provides an economical and sustainable alternative for environmental remediation. In this context, C and CFA derived from Hawthorn will be used as adsorbents for NH4+ from aqueous solution. Based on this, the study objectives are: (1) to characterize C and CFA produced from Hawthorn, and (2) to determine the adsorption capacity of NH4+ on C and CFA at different pH values. The results of this study are expected to reveal the adsorption mechanisms of NH4+ by C and CFA.

2. Materials and Methods

2.1. Chemicals and Reagents

The reagents used were ammonium chloride (NH4Cl), sodium chloride (NaCl), sodium hydroxide (NaOH), hydrochloric acid (HCl), potassium dichromate (K2Cr2O7), sulfuric acid (H2SO4), and ammonium acetate (NH4CH3COO). All reagents were analytical-grade (Merck), and distilled water (conductivity ≤ 1.0 μS m−1).

2.2. Preparation of Materials

One bag of store-bought hawthorn coal (C), 2.5 kg of Premium coal brand Quincho (https://quinchobbq.com, accessed on 15 August 2025) was used. Subsequently, C was then ground with a mortar and passed through a sieve with a diameter of 75 μm. To obtain the CFA, approximately 1.5 kg of the previously obtained C was added to different crucibles, which were then placed on a hot plate, heated to a maximum of 500 °C, and maintained for 6 h, then left to cool for 1 day at room temperature. The CFA obtained was then stored at room temperature for future use.

2.3. Physical-Chemical Properties

The pH and electrical conductivity (EC) of the C and CFA samples were determined using a ratio of 1:5 solid: distilled water [28]. The moisture content of the C and CFA was determined at 70 °C per specifications established by Sadzawka et al. [28]. The organic matter (OM) percentage of C and CFA samples was determined through calcination at 550 °C [28]. The total nitrogen (N) was determined through the Kjeldahl method. The NH4+ (mg/kg) concentration in C and CFA was determined by extraction with KCl 2 mol/L. Before analysis, 1 g of the dried and finely ground sample of C and CFA was digested using a mixture of HNO3, HCl, and H2O2 [28]. The digest was filtered and diluted to a final volume of 50 mL with distilled water before analysis. The P2O5% was determined by UNICAM Helios α UV spectrophotometer (Unicam, Cambridge, UK), while the K2O%, CaO%, and MgO% were determined using an atomic absorption spectrometer (AAS) iCE 3000 (Thermo Fisher Scientific, Waltham, MA, USA).
The specific surface area (SBET) of the C and CFA samples was obtained using the Brunauer–Emmett–Teller (BET) method. C was degassed for 8 h at 120 °C [29], and CFA was degassed for 10 h at 200 °C [30], and then was conducted using N2 gas at −196 °C in a relative pressure range (P/P0) of 0.05–0.9. Surface area measurements were taken with an Anton Paar Autosorb 6300 PFE (Autosorb iQ, Anton-Paar GmbH, Ostfildern-Scharnhausen, Germany). The total pore volume and pore diameter of C and CFA samples were obtained using the Barrett-Joyner-Halenda (BJH) model.

2.4. Scanning Electron Microscopy-Energy Dispersive X-Ray Analysis

The analyses of scanning electron microscopy (SEM) and SEM coupled to energy dispersive X-ray analysis (EDX) of the C and CFA samples were taken using an SEM Hitachi SU3500 (Tokyo, Japan) at 15.0 kV and 25 kV. The samples were placed on a copper grid covered with a carbon film before analysis. The diameter of the C and CFA particles was determined using the ImageJ Version 1.54i software.

2.5. Surface Charge

The zeta potential (ZP) of C and CFA samples was measured in the presence of 10 mL NaCl 0.01 mol/L using a Nano ZS apparatus (Malvern Instruments, Worcestershire, UK). Subsequently, the isoelectric point (IEP) of both samples was obtained from graphs of ZP versus pH values.

2.6. Fourier-Transform Infrared Spectroscopy

Fourier-transform infrared spectroscopy (FT-IR) analyses of C and CFA samples were performed using a Cary 630 spectrometer (Agilent Technologies, Santa Clara, CA, USA). The spectral wavelength covered a range of 600 to 4000 cm−1 with a resolution of 4 cm−1. Once the FT-IR spectra were obtained for C and CFA samples, an adaptive baseline correction of 15% and Savitzky–Golay smoothing were applied using a 10-point interval and a polynomial of order 3. After baseline correction, standard normal variation (SNV) normalization is applied, allowing comparisons between samples by spectral data scaling. SNV considers the mean absorbance values in addition to the standard deviation. It subtracts the mean from each absorbance value and divides this result by the standard deviation, obtaining a spectrum with a variance of one.

2.7. Batch Adsorption–Desorption Studies

2.7.1. Effect of Adsorbent Dose

The NH4+ adsorption capacity of C and CFA samples was investigated using batch experiments to study the effect of C and CFA adsorbent dosage was varied from 0.05 g to 0.30 g in the presence of 20 mL of a 50 mg/L NH4+ solution (adjusted to pH 6.5 ± 0.2 using HCl (0.01 mol/L) or NaOH (0.01 mol/L) in a 50 mL centrifuge tube containing varying amounts of C and CFA. The mixture was then stirred at 200 rpm in a linear shaker for 1440 min at 20 ± 2 °C. The tubes were centrifuged at 3500 rpm using a centrifuge for 10 min and filtered through 0.22 μm syringe filters. The NH4+ concentration in the solution was determined using the Nessler method [31] on a UNICAM Helios α UV spectrophotometer (Unicam, Cambridge, UK). The NH4+ adsorbed (qe, mg/g) onto C and CFA was determined using Equation (1).
q e = ( C 0 C t ) V w
where C0 is the initial concentration of NH4+ in solution (mg/L), Ct is the equilibrium concentration of NH4+ in solution (mg/L), V is the volume (L), and w is the mass (g) of the C and CFA used.

2.7.2. Effect of pH

The pHInitial effect on NH4+ adsorption by C and CFA samples was studied using 0.15 g of C and CFA and 20 mL of a 50 mg/L NH4+ stock solution, with varying initial pH values between 3.5 ± 0.2 and 10.5 ± 0.2, which was altered using HCl (0.01 mol/L) or NaOH (0.01 mol/L). The mixture was added to 50 mL centrifuge tubes and stirred at 200 rpm for 1440 min at 20 ± 2 °C. The pH was also measured at the end of the experiment (pHFinal). The tubes were centrifuged at 3500 rpm for 10 min, and the NH4+ concentration in the supernatant was determined, as previously described.

2.7.3. Adsorption Kinetics

A kinetic adsorption study was conducted in a similar setup as stated earlier, with 0.15 g of C and CFA samples, and 20 mL of 50 mg/L NH4+ at an initial pH of 4.5 ± 0.2 and 6.5 ± 0.2, which was altered by adding HCl (0.01 mol/L) or NaOH (0.01 mol/L). Samples were withdrawn at time intervals between 0 and 360 min (0, 2.5, 10, 30, 45, 60, 120, 180, and 360 min), at 200 rpm, and at 20 ± 2 °C and analyzed for NH4+ concentration in the supernatant, as described previously.

2.7.4. Adsorption Isotherms

Adsorption isotherms were obtained by conducting experiments with 0.15 g of C and CFA samples at varying NH4+ concentrations between 0.5 and 50 mg/L (0.5, 1, 5, 10, 20, 30, and 50 mg/L) at an initial pH 4.5 ± 0.2 and 6.5 ± 0.2, which was controlled by adding HCl (0.01 mol/L) or NaOH (0.01 mol/L). After continuous stirring at 200 rpm for 180 min at 20 ± 2 °C, centrifugation, and filtration, the final NH4+ concentration in the solution was extracted and analyzed, as described previously.

2.7.5. Desorption Studies

To study NH4+ desorption from C and CFA samples, the first 0.15 g of C and CFA and 20 mL of NH4+ solution (50 mg/L) were mixed at an initial pH of 4.5 ± 0.2 and 6.5 ± 0.2 by adding HCl or NaOH. The mixture was stirred at 200 rpm for 180 min at 20 ± 2 °C. The final NH4+ concentration in the supernatant solution was determined following stirring, centrifugation, and filtration as described earlier. The residual solution was removed, distilled water was added to the solid, and the suspension was stirred, as described above. The desorption cycle was repeated five times. After each desorption cycle, the mixture was centrifuged at 3500 rpm for 10 min, and the NH4+ concentration in the supernatant was determined as described previously. The NH4+ desorption percentage (%) by C and CFA after each cycle was calculated using Equation (2).
N H 4 + d e s o r p t i o n = N H 4 +   d e s o r b e d N H 4 +   a d s o r b e d × 100
where NH4+ adsorbed (mg/g) is the amount of NH4+ adsorbed by the C and CFA before distilled water treatment, and NH4+ desorbed (mg/g) is the amount of NH4+ desorbed by the C and CFA after distilled water treatment.

2.7.6. Adsorption Kinetics and Isotherm Models

The experimental kinetic data were tested using the pseudo-second order (PSO) and pseudo-first-order (PFO) equations through non-linear fitting (Table S1). The NH4+ adsorption isotherm equilibrium data were also tested using the Freundlich and Langmuir equations through non-linear fitting, and linear equation fitting (Henry’s isotherm) (Table S2). Those models are widely used to describe adsorption studies [32].

2.8. Data Analysis

All adsorption experiments were performed in triplicate, and the results were presented as the mean value. The fitness of experimental data to the kinetic and isotherm models based on the coefficient of determination (r2), and the Chi-square (χ2) parameters. The highest r2 and lowest χ2 values were used as the best fit [33]. The model fitting and figure drawing were performed using the Origin 9.0 program.

3. Results and Discussion

3.1. Characterization of the Materials

The physical-chemical properties of C and CFA samples are tabulated in Table 1. C presented a higher % of humidity, OM, total N, and NH4+ than CFA. Meanwhile, CFA had a higher pH, EC, and % of P2O5, K2O, CaO, and MgO than C. Specifically, CFA had a pH value of 11.9, which is classified as a strongly alkaline adsorbent, while C had a pH value of 8.4, which indicates it is a moderately alkaline adsorbent [34]. These pH values are related to the different CaO% values shown by both adsorbents and agree with the pH values previously reported by Gaffney and Marley [35]. In addition, CFA had higher values of BET specific surface area and pore radius than C. Finally, it is important to highlight that the chemical-physical properties determined for CFAs depend directly on the source of C used [36].

3.2. SEM-EDX Analysis

The SEM analysis of C and CFA adsorbents is shown in Figure 1. Figure 1a shows that C presents an irregular morphology and a particle size diameter that fluctuates between approximately 4 and 75 μm. Meanwhile, the surface morphology of CFA particles is similar between them, with particle diameters in the size range between 3 and 10 μm.
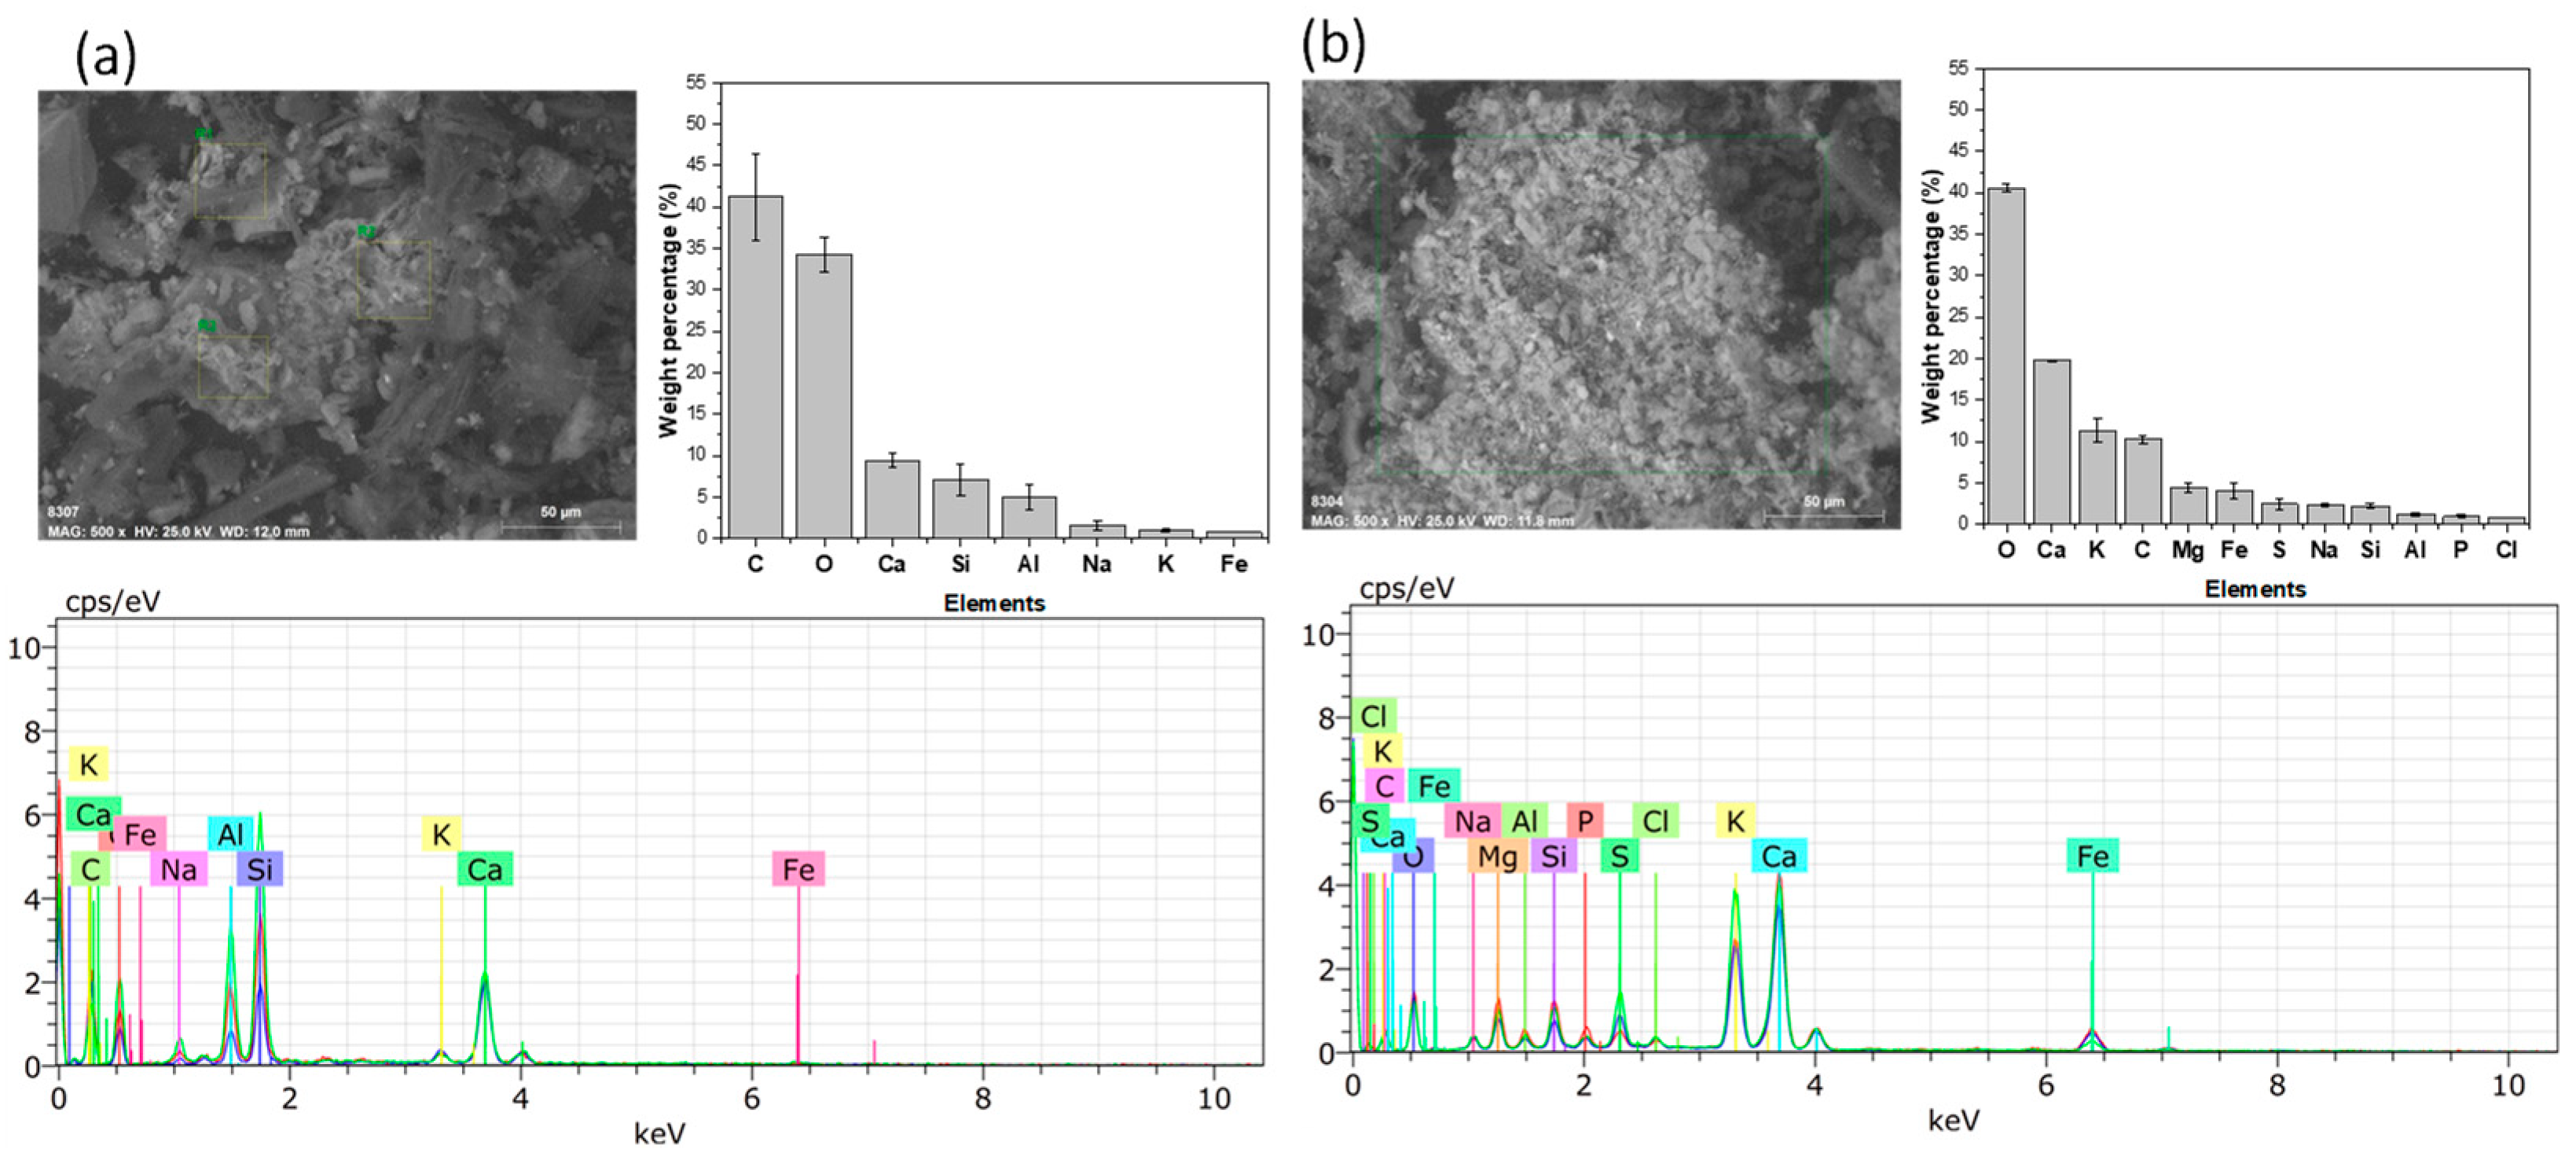
The SEM-EDX analysis accounts for the elemental content of the adsorbents, which in decreasing order was: C, O, Ca, Si, Al, Na, K, and Fe (Figure 2a), whereas for CFA, the content in decreasing order was: O, Ca, K, C, Mg, Fe, S, Na, Si, Al, P, and Cl (Figure 2b). According to these results, the appearance of four new signals for the CFA with respect to C is evident. These corresponded to Mg, S, P, and Cl, in addition to a change in their mass percentage. This phenomenon is due to the combustion process of C (loss of organic mass).

3.3. Zeta Potential

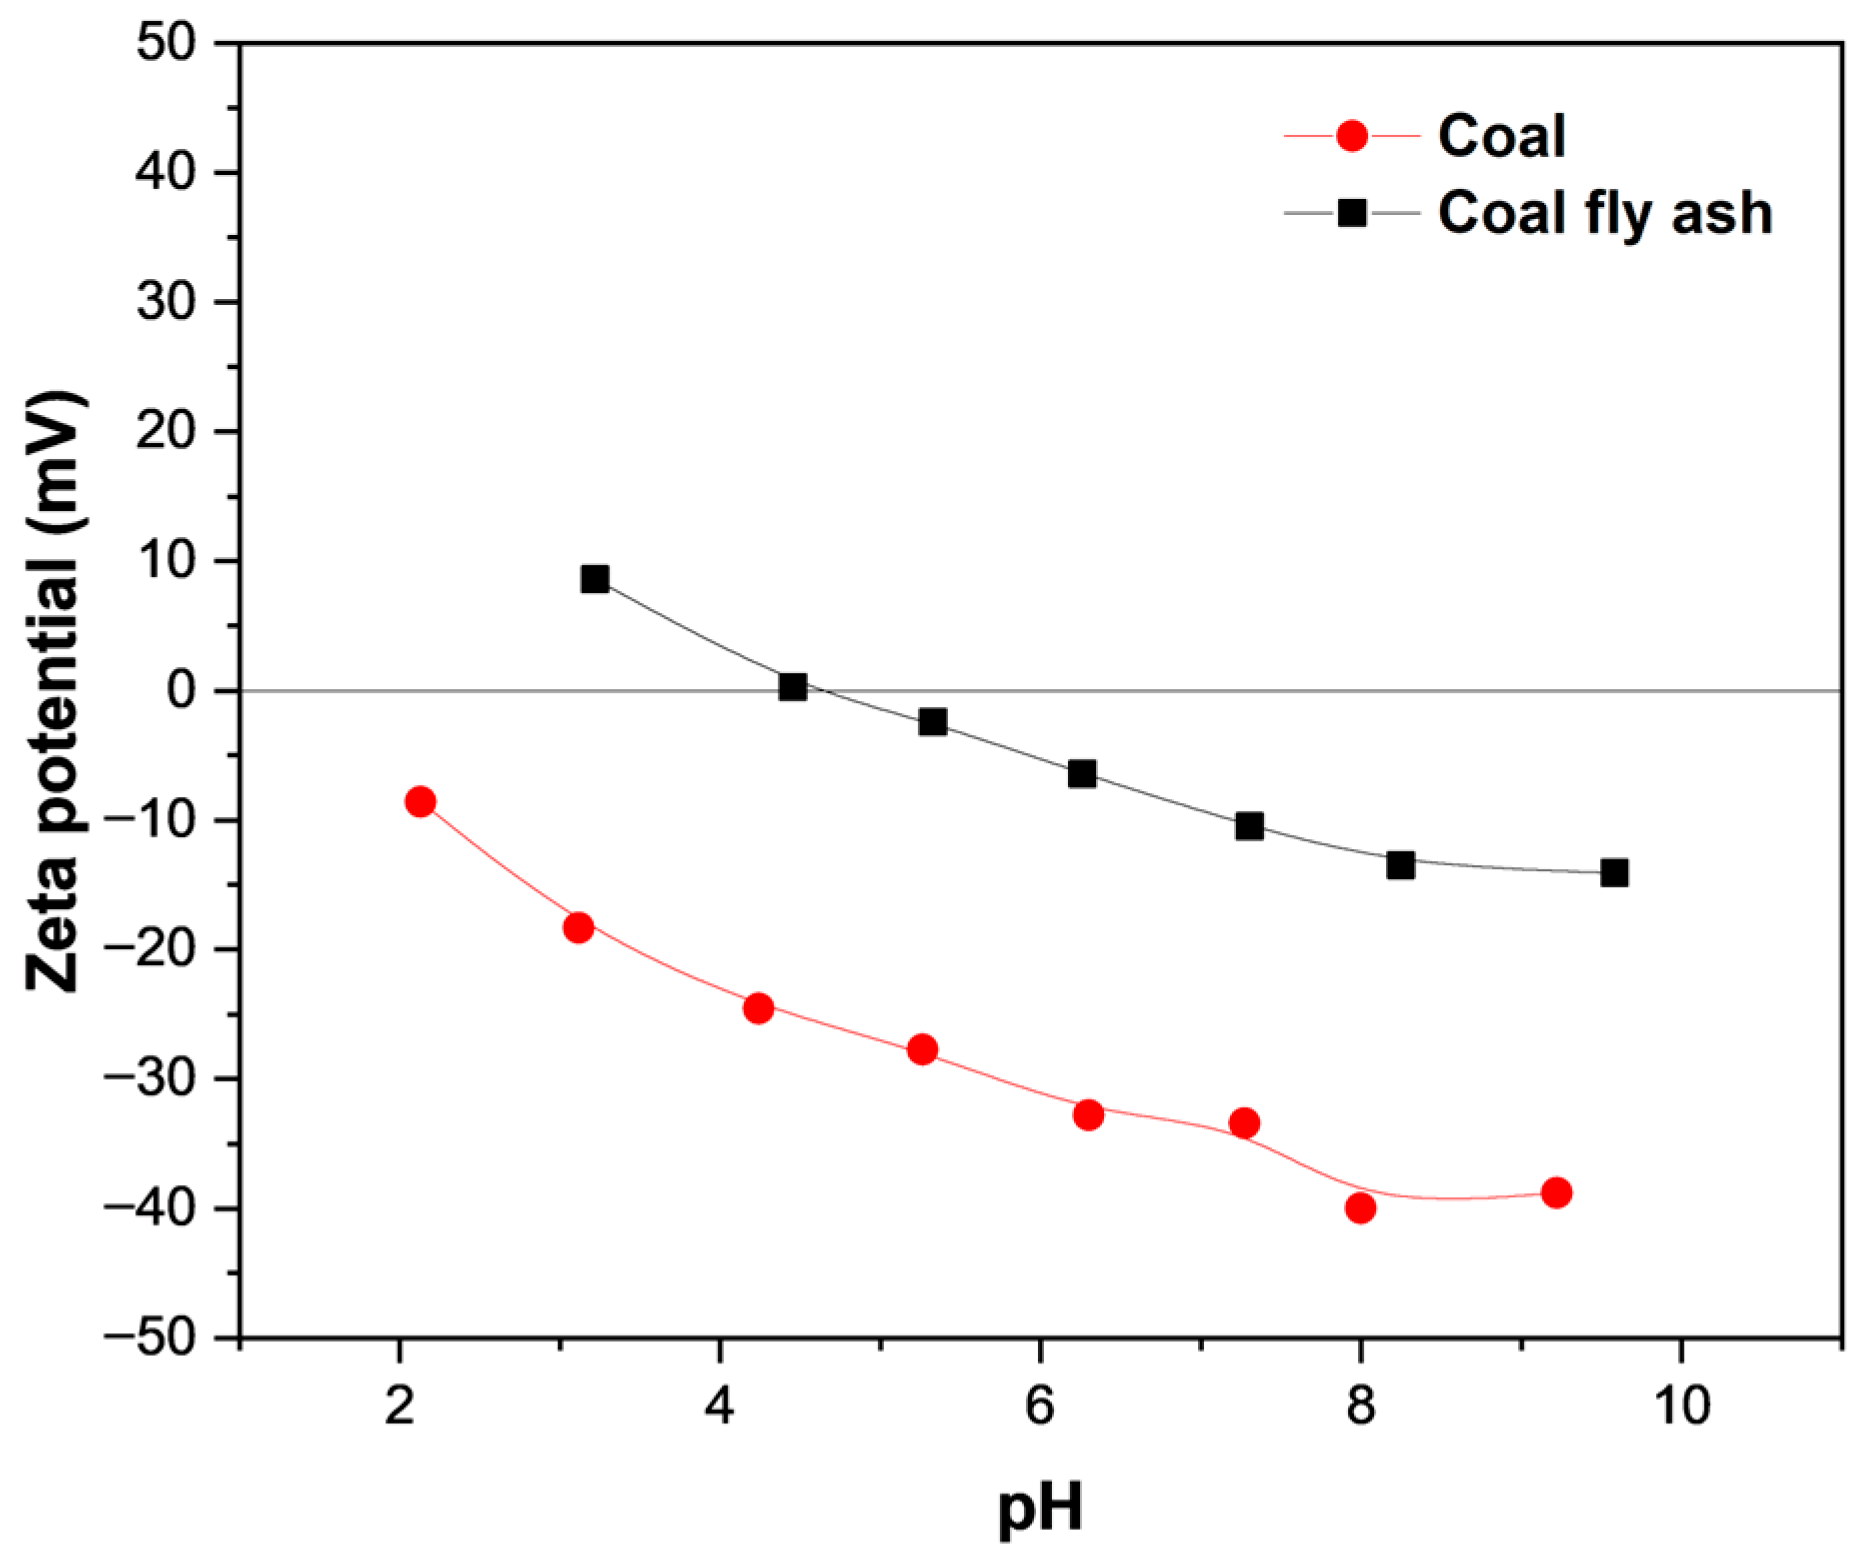
The surface charge of the adsorbents is related to the presence of organic functional (-COOH and -OH) and inorganic (-FeOH and -AlOH) groups [37]. Figure 3 illustrates that at pH = 2.13, C has a charge of −8.58 mV, which becomes more negative as the pH increases, reaching a value of −38.8 at pH = 9.22. Compared to C, the CFA exhibited a lower negative surface charge, measuring 8.58 mV at pH = 3.22. As the pH increased to 9.58, the surface charge shifted to −14.08 mV. The CFA presented an IEP value of 4.4. The decrease in the negative charge for CFA in relation to C is attributed to a decrease in OM% (Table 1) and an increase in Fe% (Figure 2) [33,37].

3.4. FT-IR Analysis

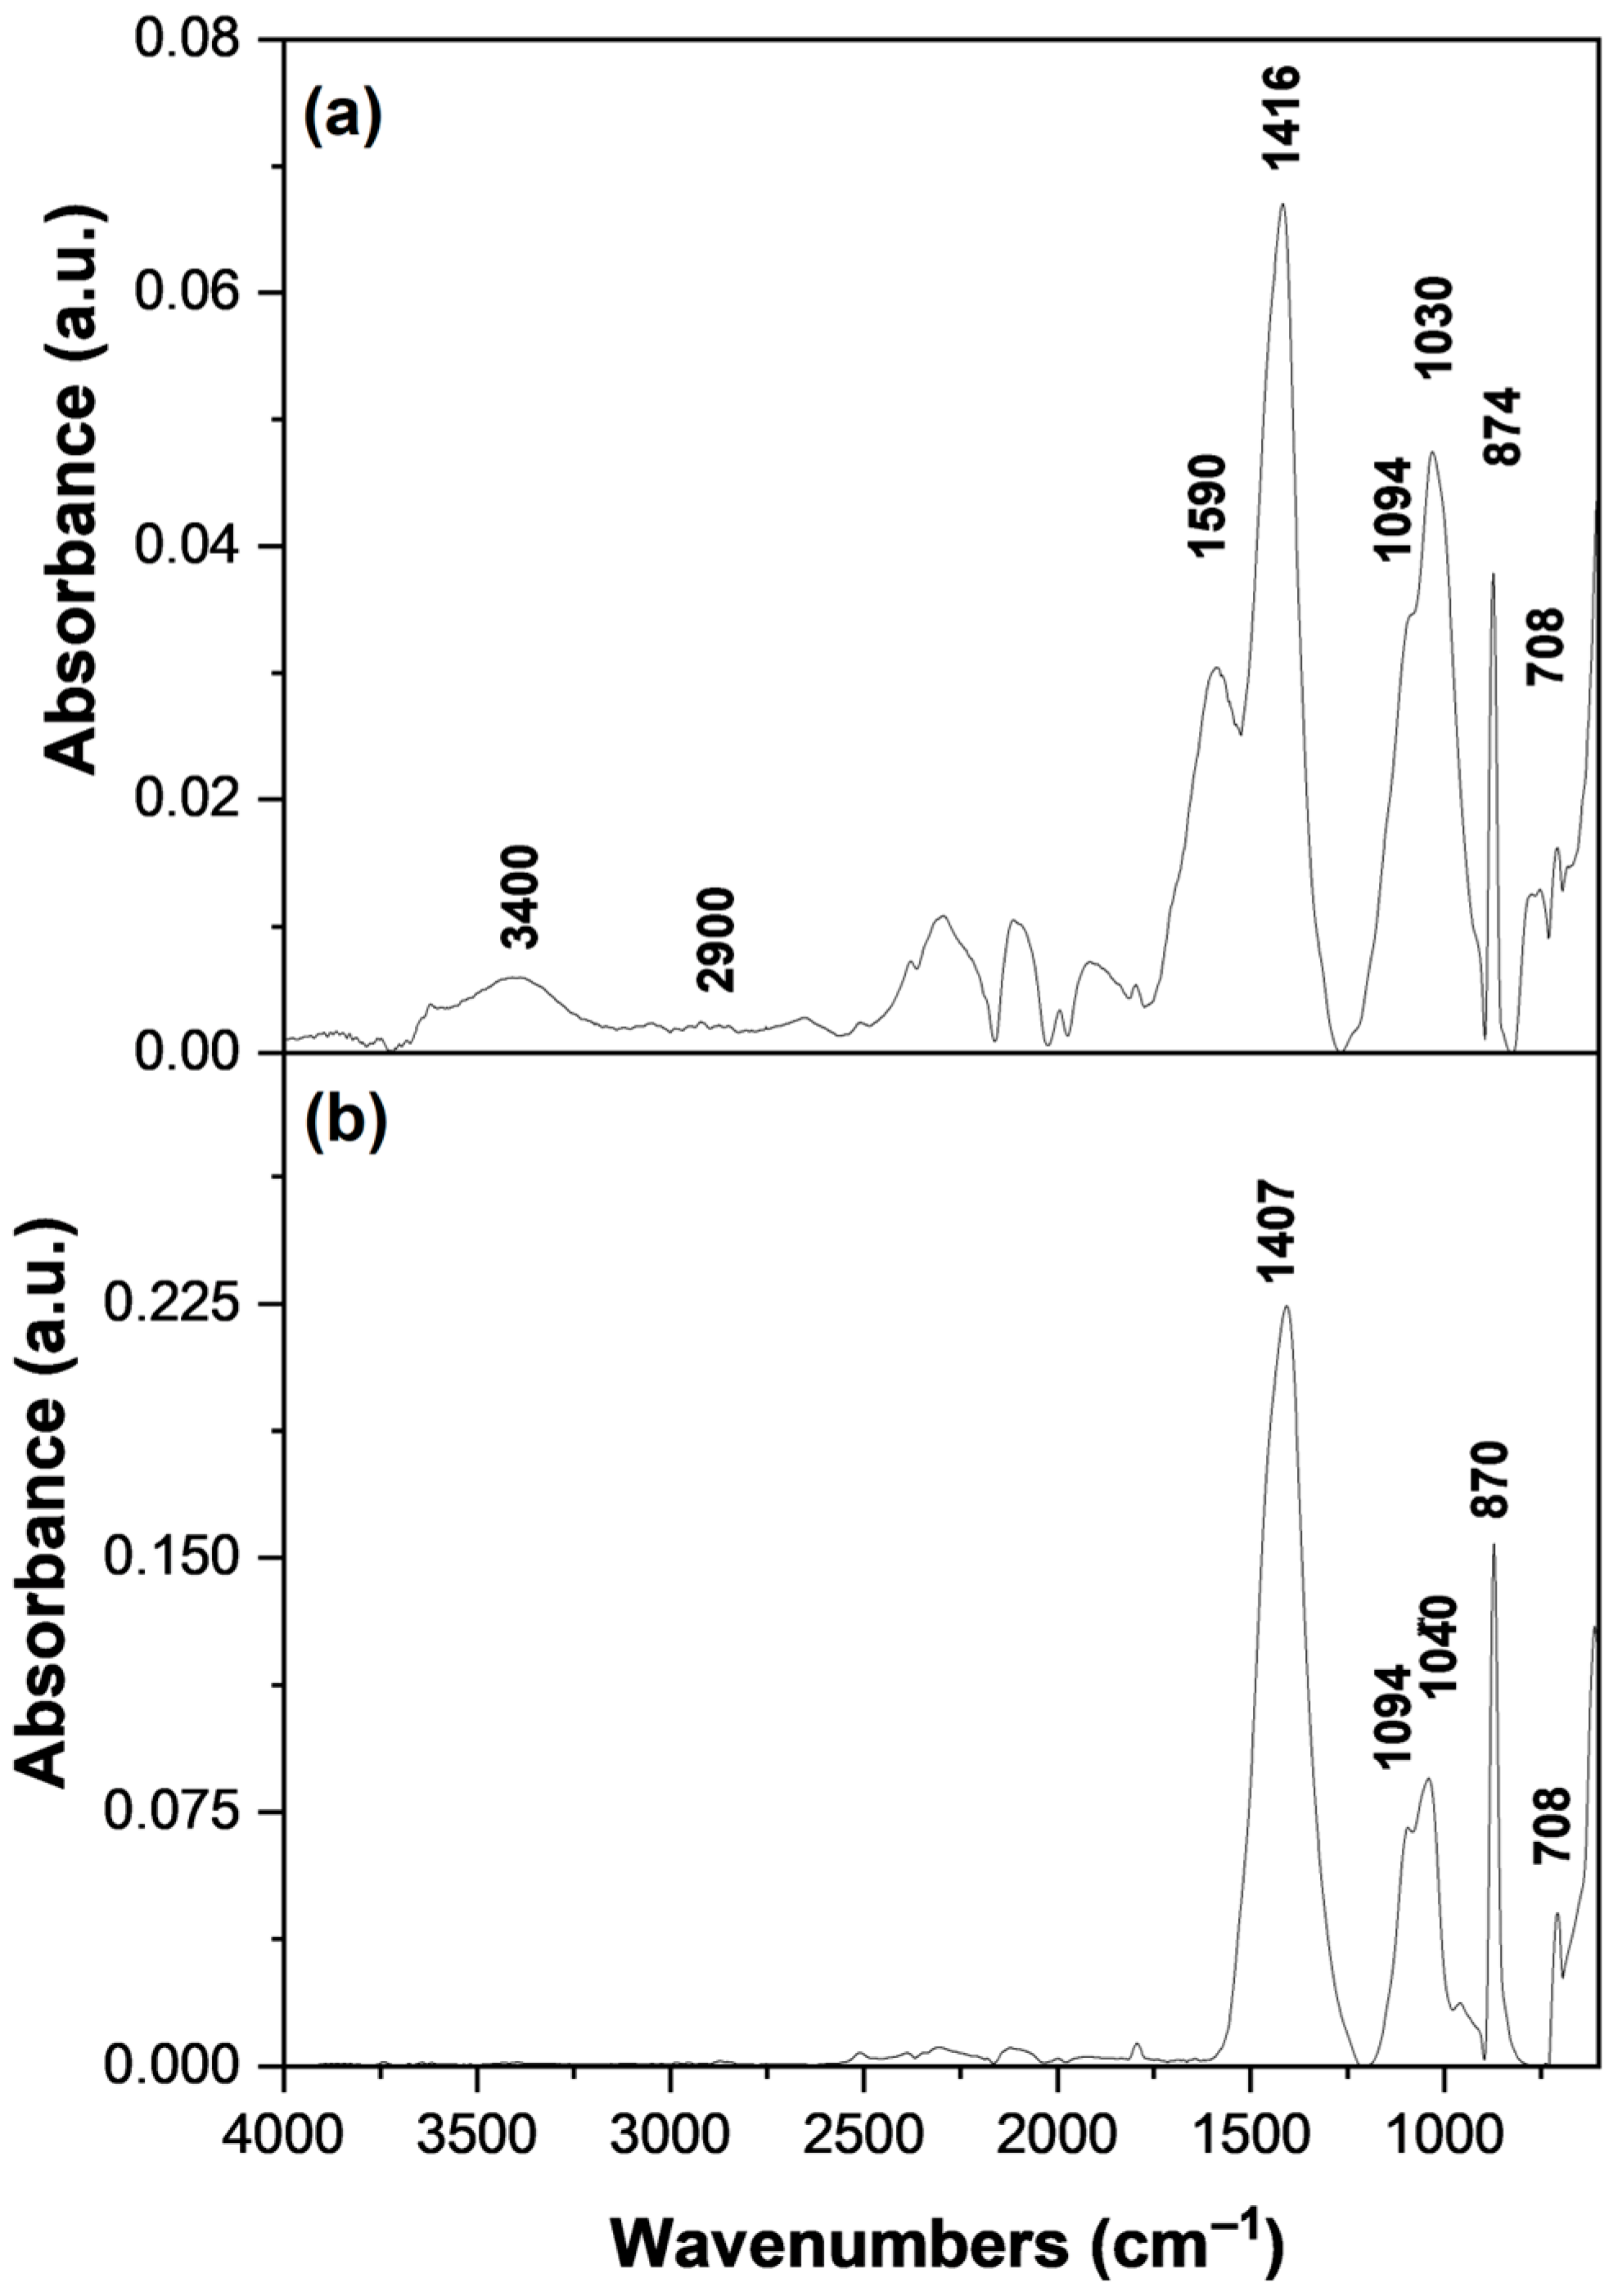
The presence of functional groups on the C and CFA adsorbents was observed by FT-IR analysis (Figure 4). In Figure 4a, C exhibits the presence of functional groups, aliphatic O-H (~3400 cm−1) and C-H (~2900–2850 cm−1), unlike the absence of those groups for the CFA [38,39]. The low intensity suggests that these peaks are dominated by the stretching of O-H and C-O bonds and vibrations from -OH in carboxylate groups [40,41]. In the C sample, a medium sharp signal can be seen at a wave number of 1590 cm−1, which does not appear in the CFA sample; this signal is attributable to the presence of amide or amine groups [42,43]. At 1416 cm−1 for C at 1407 cm−1 for CFA, a peak was identified, being more intense in CFA. The variations in peak intensities could be associated with C–O vibrations in carbonate minerals [44]. In the region of ~1094 cm−1 and ~1030 cm−1, both samples presented significant peaks, being stronger in CFA. These bands are of ~1094 cm−1 and ~1030 cm−1, characteristic of the stretching vibrations of the Si-O bond in silicates, an important component of CFA. They can also be attributed to stretching vibrations of C-O bonds in ester, ether, or C-O-C, and C-O-H vibrations [45,46]. In addition, both CFA and C samples exhibit a band at ~870 cm−1, attributed to out-of-plane aromatic C-H bending vibrations or carbonates [47,48]. Additionally, both samples showed a band at ~708 cm−1, which was more intense in CFA. This band may correspond to Si-O-Si bending vibrations in silica frameworks or to out-of-plane C-H bending vibrations in aromatic rings with specific substitutions.

3.5. Effect of Adsorbent Dosage on NH4+ Removal

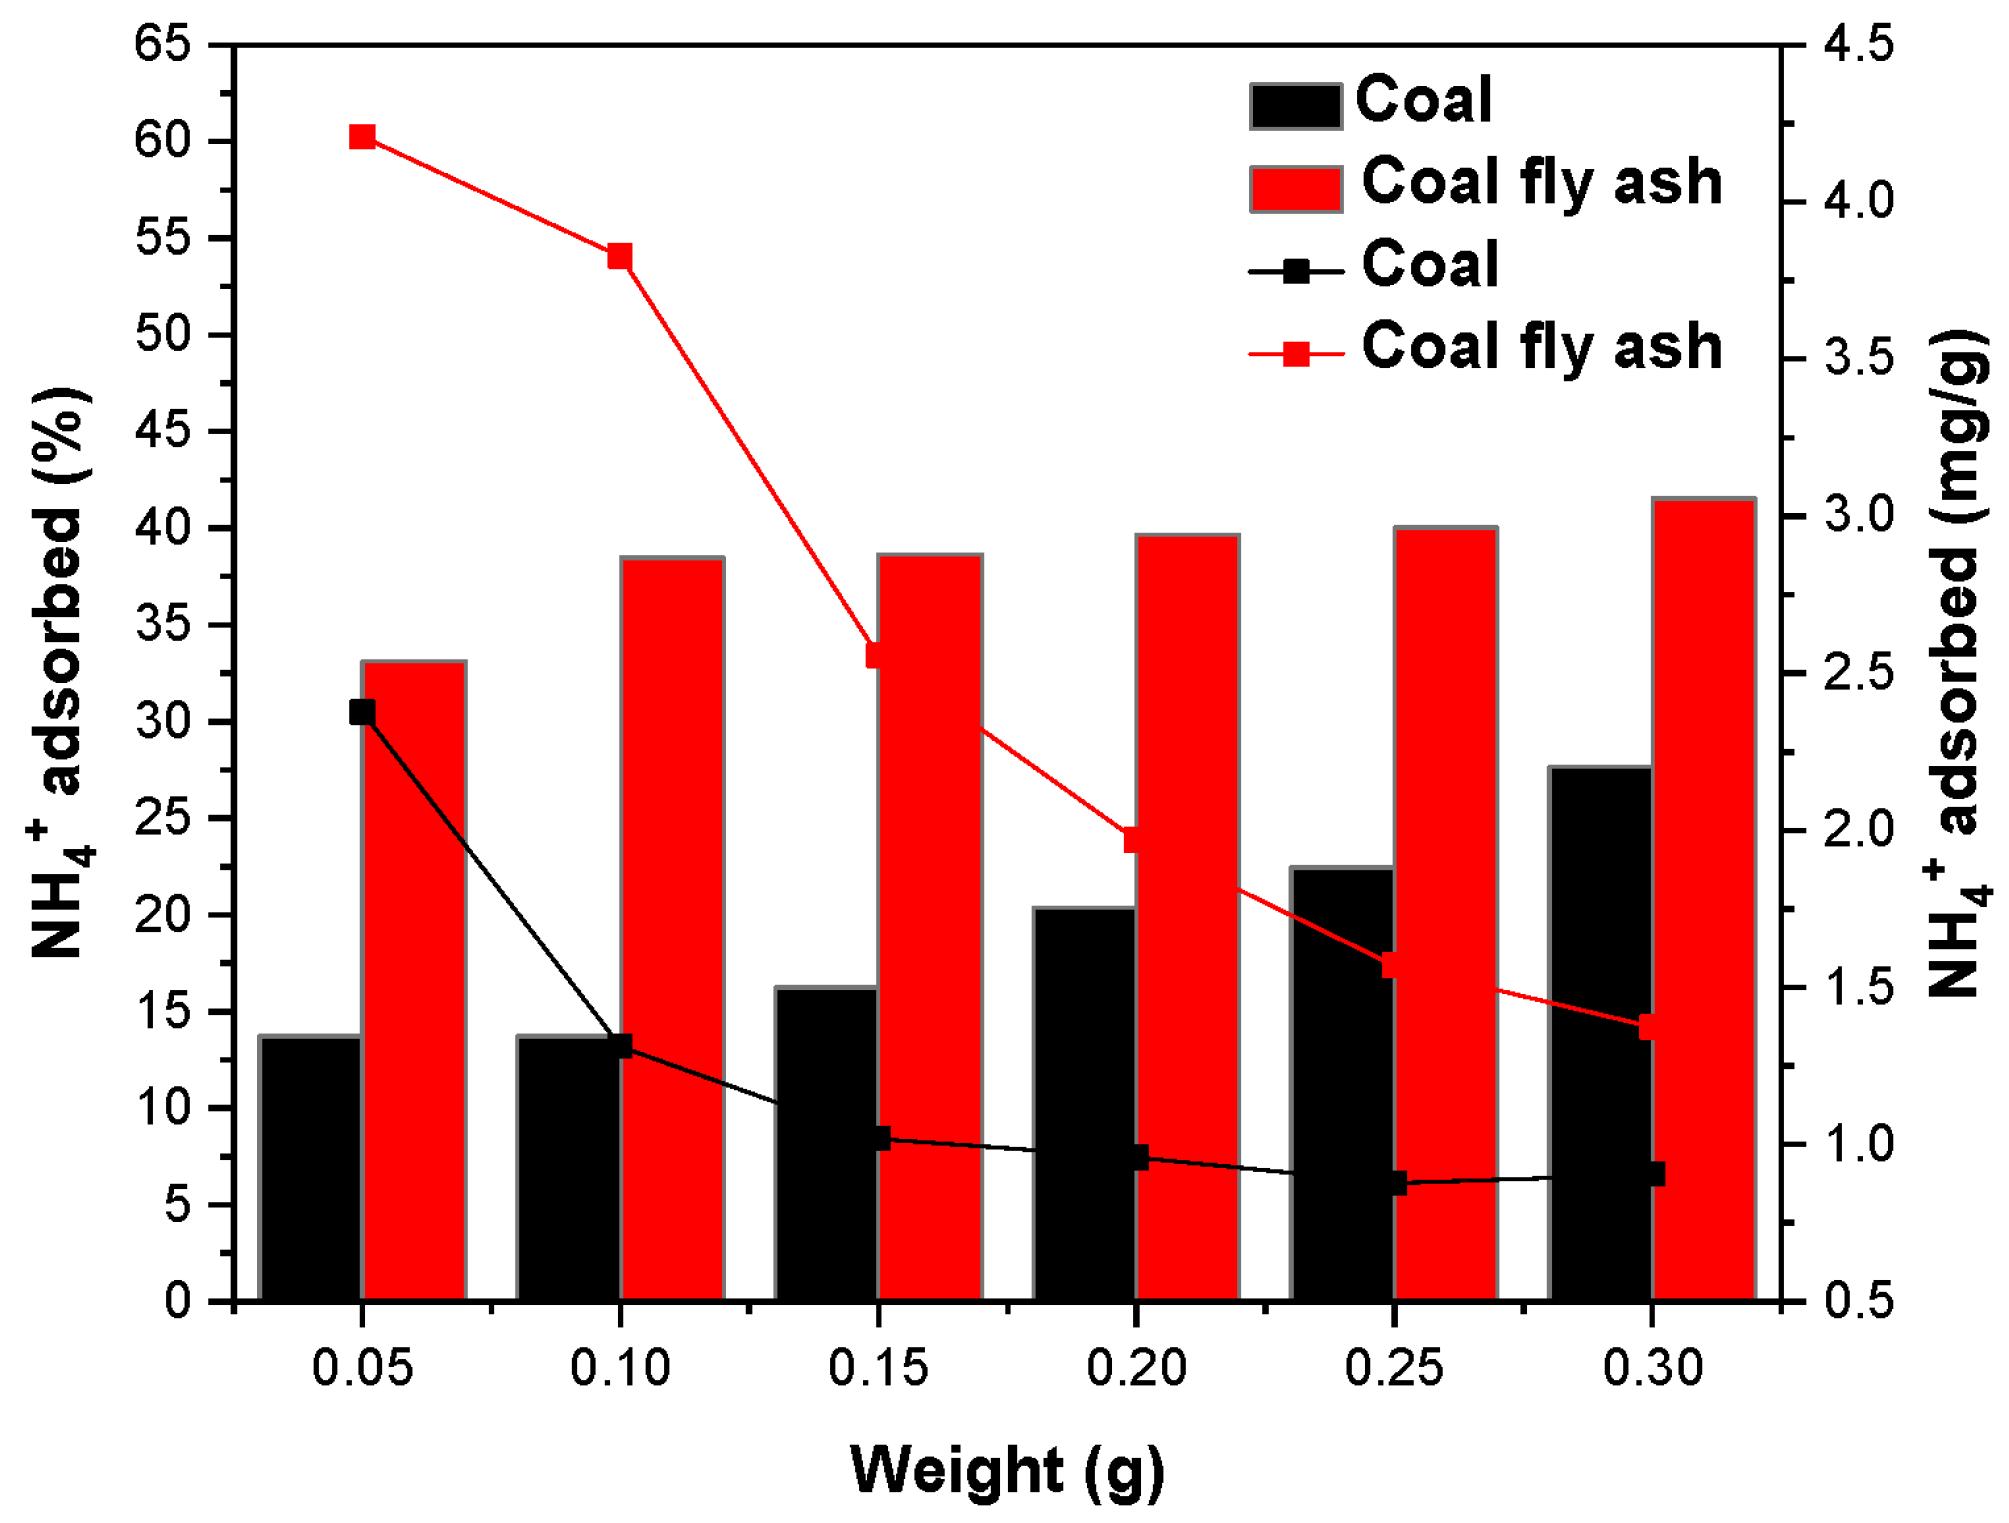
Optimization of adsorbent dosage in NH4+ ion removal systems for wastewater treatment is essential for practical use and avoids wasting excess adsorbent material. Figure 5 shows the effect of C and CFA dosages between 0.05 g and 0.3 g on NH4+ adsorption at pH 6.5.
The % increase in NH4+ adsorption from 13.74% to 27.67% for C, and from 33.12% to 41.55% for CFA, indicated that as the mass of the adsorbents increased, they removed a higher % of NH4+ ions from the aqueous solution. This is logical, since a higher mass of adsorbent provides a greater number of active sites for NH4+ ions to adhere to [22]. Figure 5 also suggests that using 0.2 g of adsorbent results in a decreasing amount of NH4+ adsorbed in mg/g units. The decreasing NH4+ adsorption in mg/g indicated that the adsorbents have limited binding sites and are prone to rapid saturation. Similar behavior was observed by Zhao et al. [49] for the adsorption of NH4+ using CFA modified with NaOH. Based on this study, an adsorbent mass of 0.15 g was chosen as the optimal dosage for performing the following adsorption experiments of NH4+.

3.6. Effect of Solution pH on NH4+ Removal

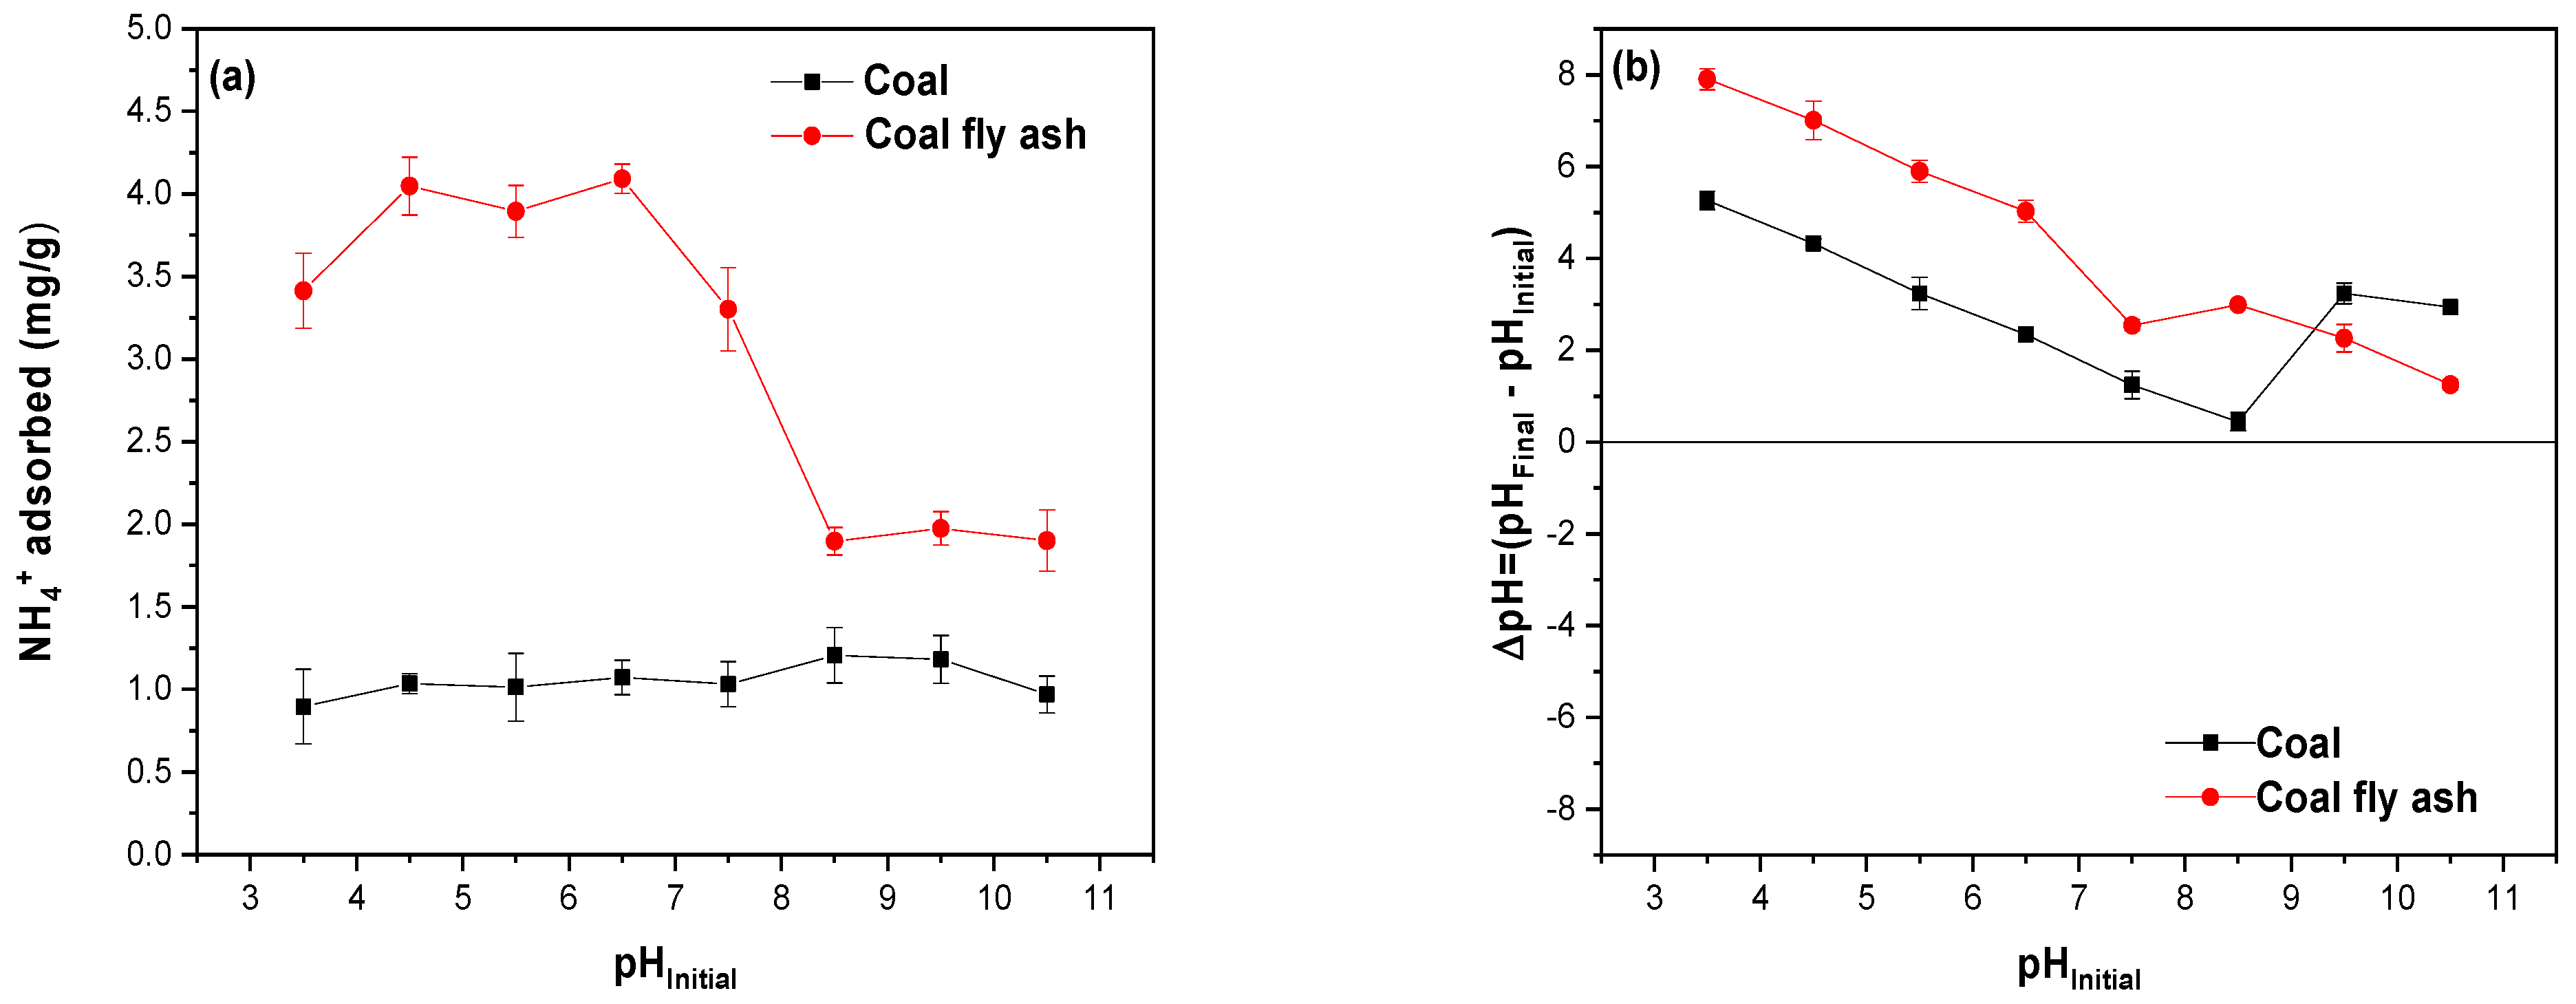
The solution pH had a marked effect on the NH4+ adsorption capacity because it influences the chemical molecular form in which this analyte is found in the solution, that is, its chemical speciation. There is an equilibrium between NH4+ and NH3 (NH4 + ⇌ NH3 + H+; pKa ≈ 9.25, 25 °C), as well as in the surface charge of the adsorbent [50]. The pH study was conducted over a range of 3.5 to 10.5 and is shown in Figure 6.
At a pH value of 3.5, the adsorption of NH4+ by C reached 0.89 mg/g, being around 14%. As the pH of the solution increased, the adsorption of NH4+ showed a slight increase, reaching between pH = 4.5 and 7.5, and an adsorption of NH4+ between 1.03 mg/g and 1.07 mg/g, which corresponded to 15–16%, respectively. From a pH value of 7.5 to 9.5, the adsorption of NH4+ by C was practically constant, being close to 1.20 mg/g, which corresponds to 18% of the NH4+ added. The CFA showed a higher adsorption of NH4+ than for C throughout the pH range studied. In particular, the adsorption of NH4+ by CFA at pH = 3.5 was 3.41 mg/g, which corresponded to 53%. Between pH values of 4.5 and 6.5, a slight stabilization in NH4+ adsorption by CFA was observed, reaching 4.09 mg/g, which corresponds to approximately 64% of the total added. At pH values above 8.5, the NH4+ adsorption capacity by CFA showed a drastic decrease, reaching 1.90 mg/g, corresponding to 29.34%, and remaining constant up to a pH value of 10.5.
The NH4+ adsorption trend noted for both adsorbents in the pH range studied is because under acidic conditions (from 3.5 to 6.5), NH4+ is the predominant ionic form, having a high affinity for adsorbents with negative surface charges, such as C and CFA, due to electrostatic attraction mechanisms between the positive NH4+ ion and the negative surface charges that both materials present. However, at pH < 3.5, the adsorption of NH4+ decreases, which may be associated with the increase in the H+ concentration in the solution, which causes a competition with the NH4+ ions for the adsorption sites of both absorbents, thus inhibiting the adsorption of NH4+ [22]. At high pH values (8.5), NH4+ is transformed into NH3(g), which is a neutral molecule that does not adsorb easily onto C and CFA. Zhu et al. [51] suggested that NH3 existing in solution at pH > 10.0 could be lost through volatilization.
The ΔpH graph in Figure 6b shows that for CFA, the final pH values obtained were higher than for C. These results indicated that, after the adsorption process of NH4+ by CFA, there was a greater release of surface OH groups into the solution. However, these values could also be associated with the fact that the pHH2O for CFA was much higher than for C (Table 1). Regardless of these, the higher ΔpH values, i.e., more basic final pH values, shown by CFA than by C could explain the capacity and the adsorption trend of NH4+ seen in Figure 6a.

3.7. Adsorption Kinetics of NH4+

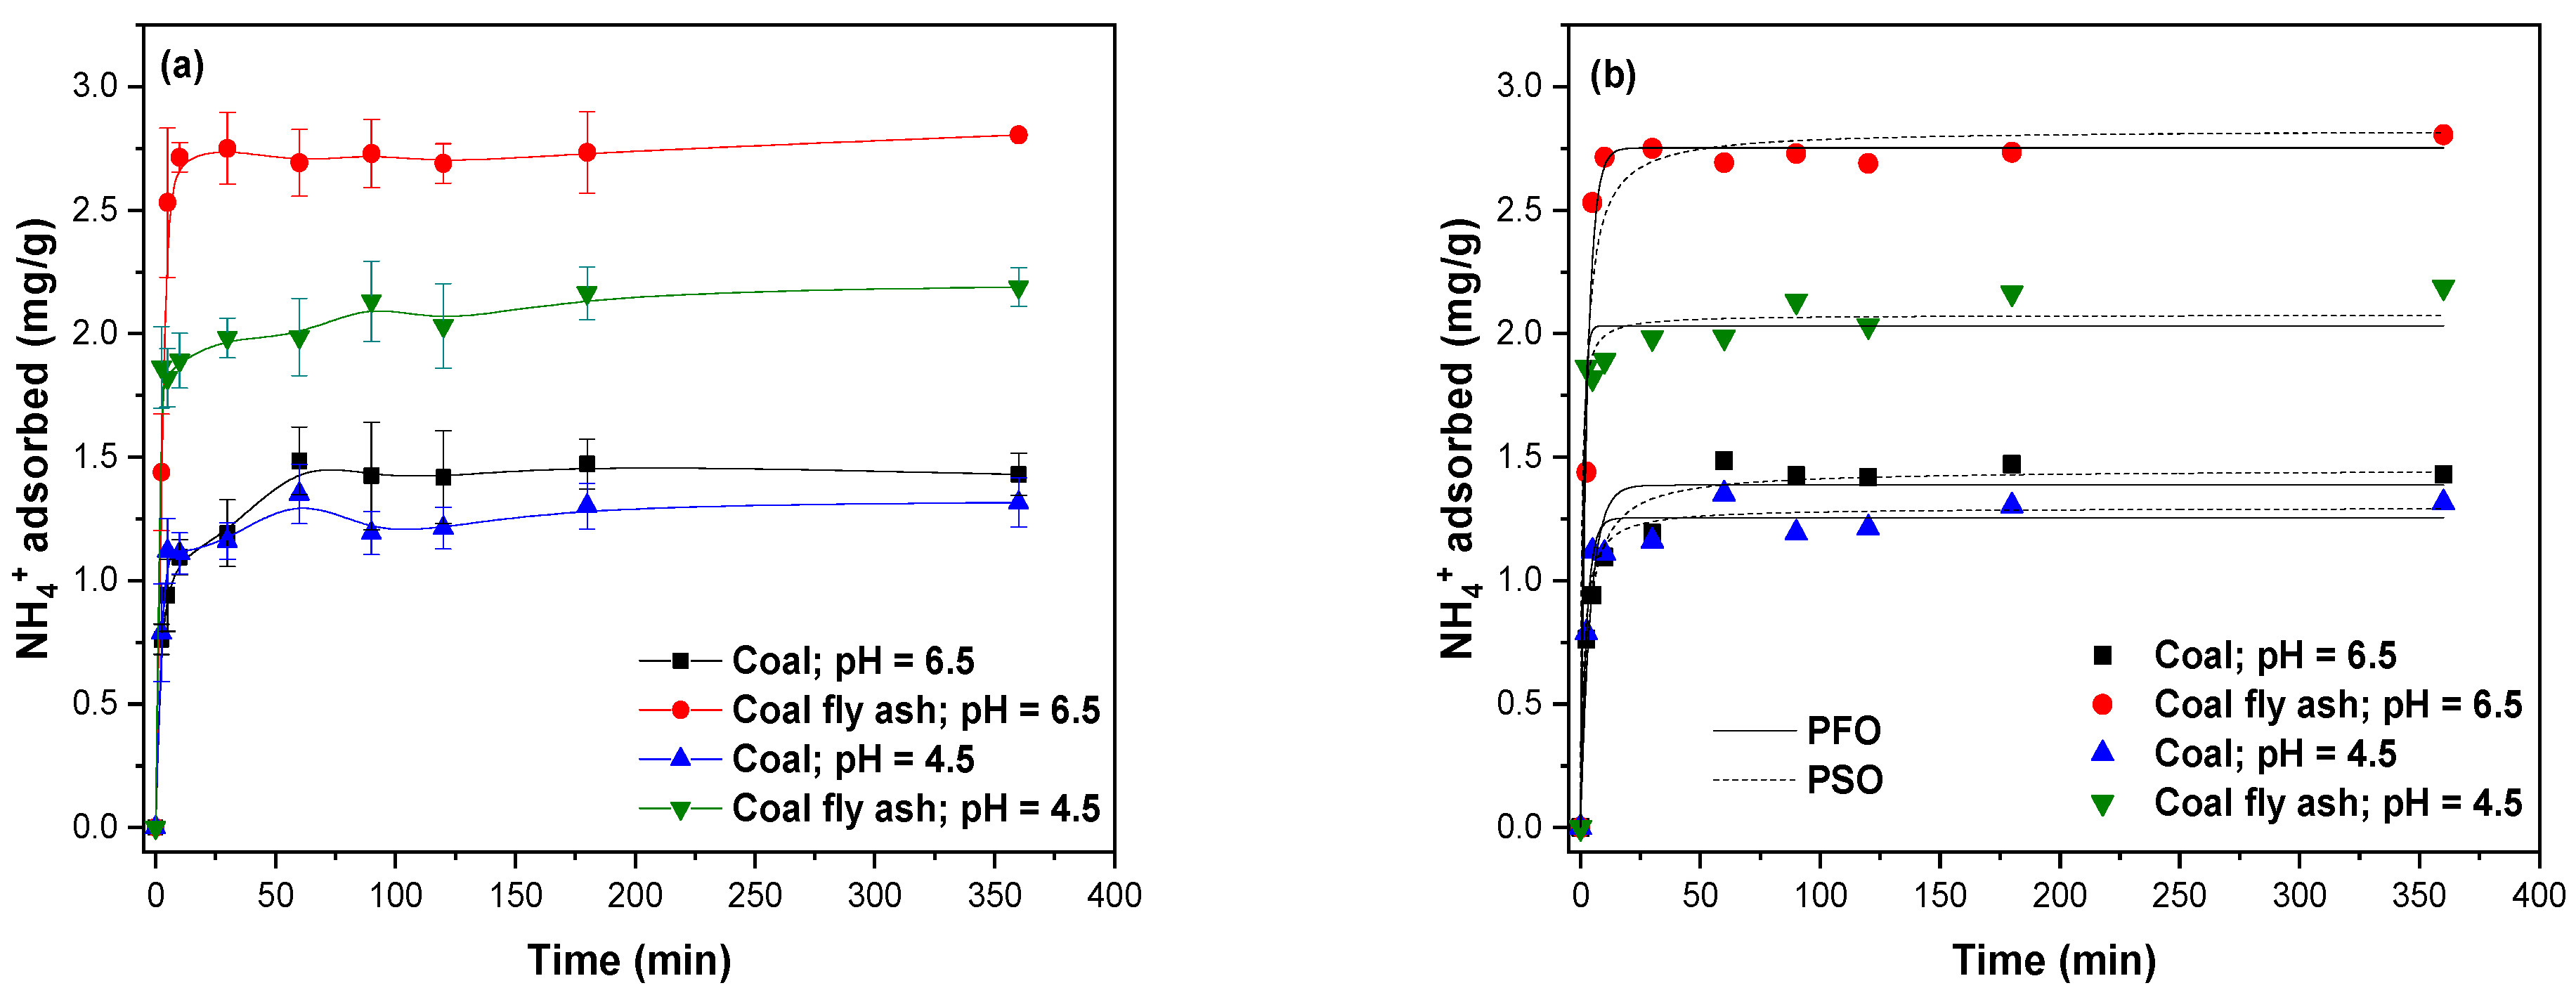
In Figure 7a, the amount of NH4+ adsorbed (in mg/g) on C and CFA is seen as a function of the equilibration time (min) at pH = 4.5 and 6.5.
During the first minutes, NH4+ adsorption increased rapidly for both materials, being higher for CFA than C. This suggests that CFA had a higher affinity for NH4+ ions than C. After about 10 min, NH4+ adsorption for both adsorbents stabilized and remained almost constant until 360 min, reaching an experimental NH4+ adsorption (qexp) of 0.6–1.0 mg/g for C and 1.4–1.6 mg/g for CFA. According to these values, the saturation of C adsorption sites can occur with a lower amount of adsorbed NH4+ and in a shorter equilibrium time compared to CFA, as previously reported by Makgabutlane et al. [52]. Adsorption kinetic models describe the kinetic rate of adsorption, the initial kinetic rate, and the mechanism by which an adsorbate (a substance in the liquid phase) is transferred to the surface of a solid adsorbent. In this study, the experimental data of NH4+ adsorption were modeled using the PFO and PSO models (Figure 7b), whose data and statistical parameters obtained are tabulated in Table 2.
According to the r2 value, the PSO model (r2 > 0.970 and χ2 < 0.008) presented a better fit to the experimental adsorption data of both materials compared to the PFO model, except CFA at pH = 6.5 (r2 = 0.986 and χ2 = 0.013). According to these results, it is suggested that the adsorption of NH4+ on C and CFA at pH = 4.5 and for C at pH = 6.5 would occur through two adsorption sites of the adsorbent [53]. Similar mathematical fits have been reported for NH4+ adsorption on La-zeolite, phoslock, activated alumina, and diatomaceous earth [54]. The PFO model suggests that NH4+ adsorption by CFA at pH = 6.5 is due to an interaction on one adsorption site [53].
The adsorption capacities (qe) estimated by the PSO model at pH = 4.5 reached 1.30 mg/g and 2.08 mg/g for C and CFA, respectively. Meanwhile, at pH = 6.5, the qe for C was 1.45 mg/g and for CFA 2.83 mg/g. These data indicate that, once in equilibrium, the adsorbents have a higher affinity for NH4+ at pH = 6.5 than at pH = 4.5, which was consistent with the data obtained in the pH studies (Figure 6a).
The initial rate constant (h) can be attributed to the chemical and/or hydrogen (H) bonding that exists between NH4+ and the surface hydroxyl groups present on the C and CFA adsorbents [55]. At pH = 4.5, the h value for C was 0.988 mg/g/min and for CFA it was 4.88 mg/g/min. At pH 6.5, the h value was 0.544 mg/g/min and 1.978 mg/g/min for C and CFA, respectively. According to these values, it can be suggested that a lower pH value favors surface disinhibition at time →0, which means that the adsorbents possess a greater number of adsorption sites that show a high affinity for NH4+.

3.8. Adsorption Isotherms of NH4+

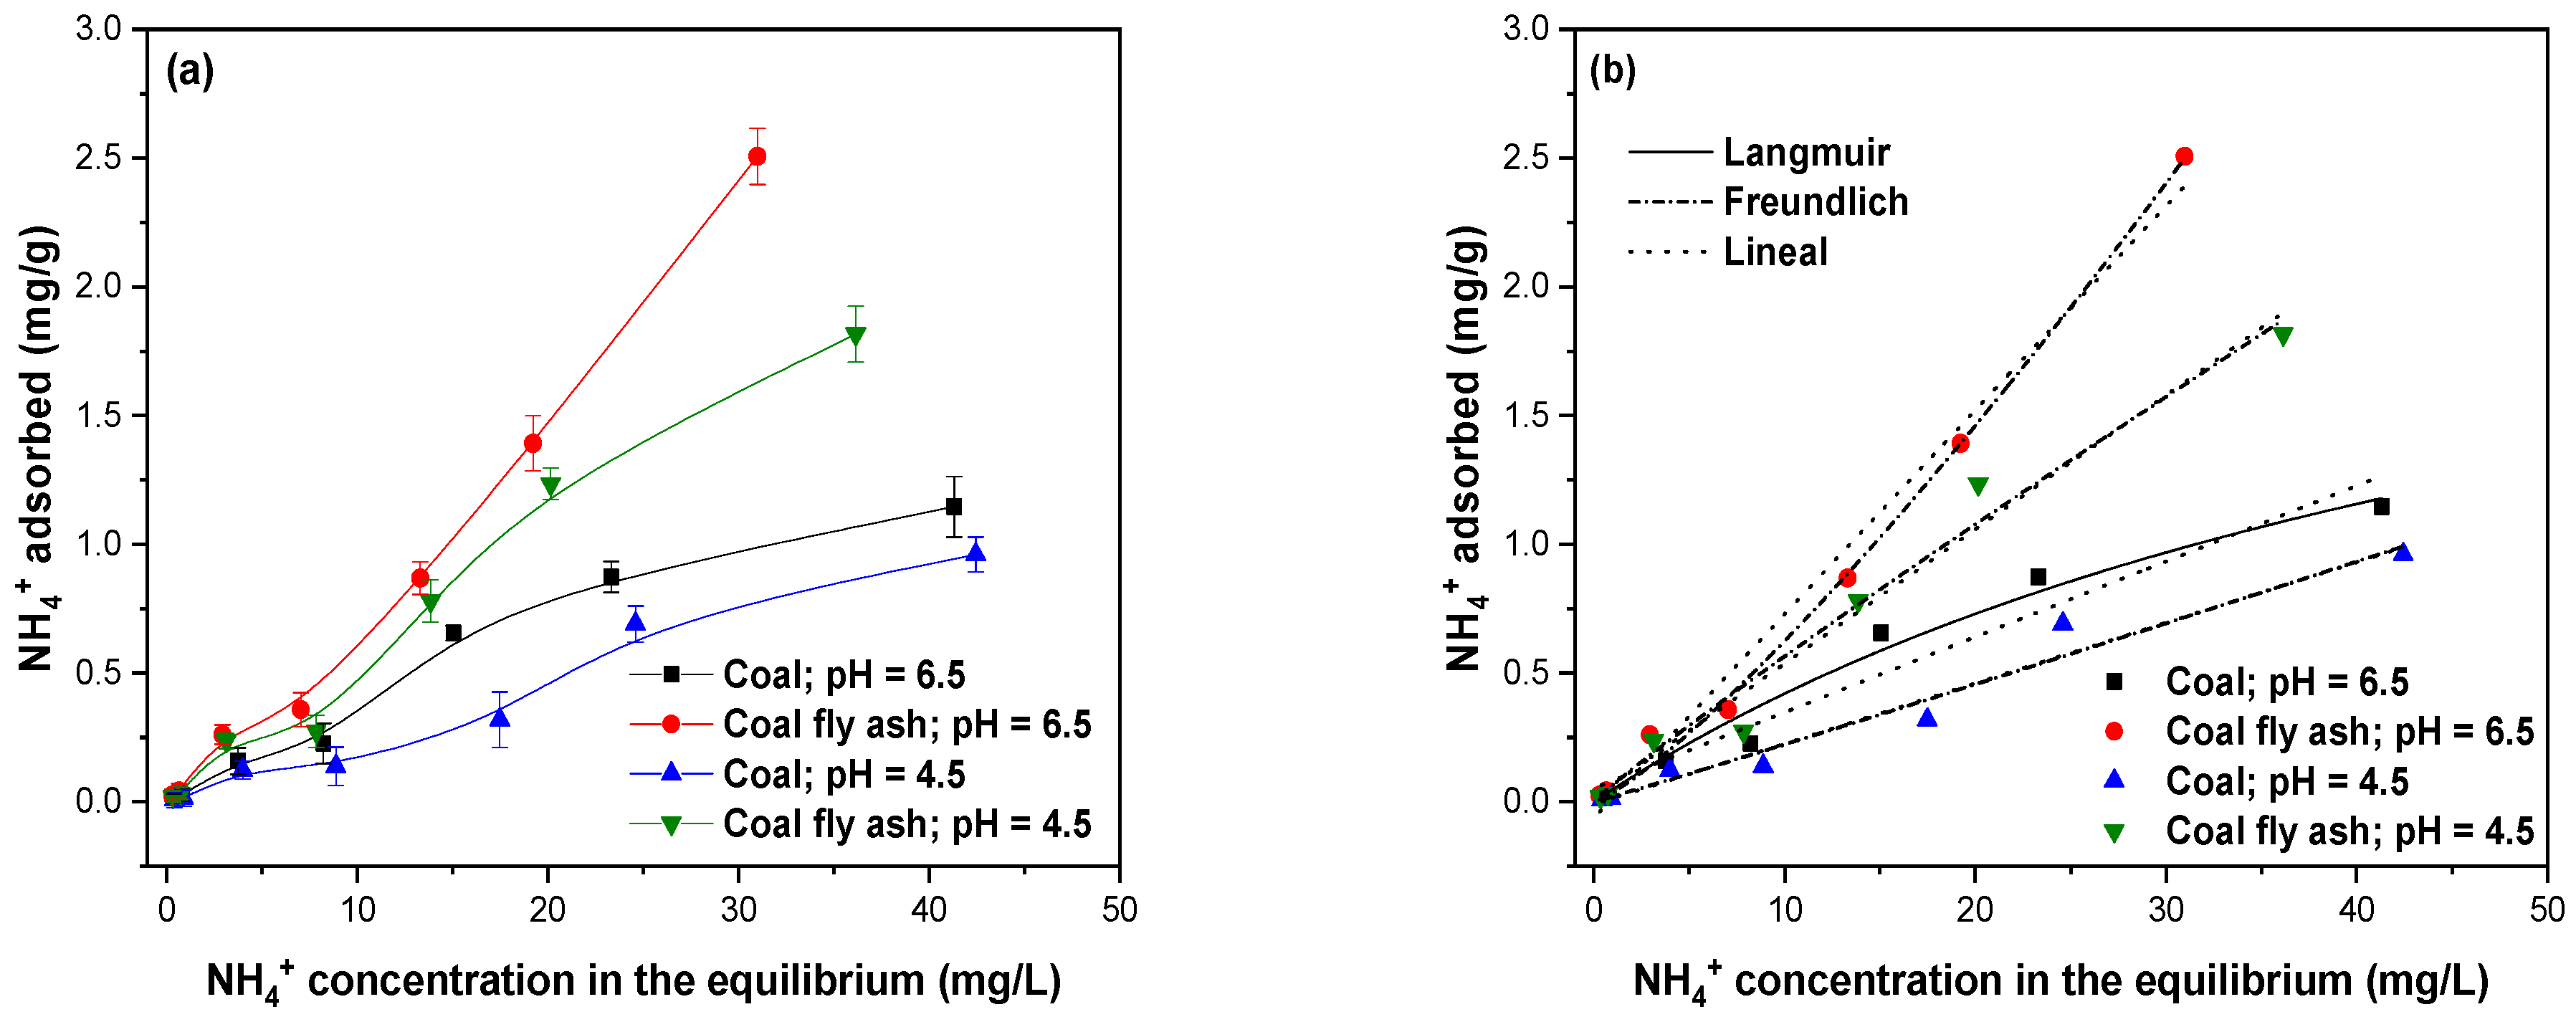
Adsorption isotherms describe how an adsorbate, in this case NH4+ ions, adsorbs onto a solid surface (C and CFA) as a function of the initial concentration at a constant temperature. NH4+ adsorption studies were performed using a concentration range that fluctuated between 0.5 and 50 mg/L at pH = 4.5 and 6.5. The NH4+ curves described in Figure 8a for the different adsorbents corresponded to S-type isotherms [56], which showed a cooperative type of adsorption and suggests that once the surface of the materials is covered by NH4+ ions, other NH4+ ions can be easily adsorbed on the surface. For both materials, the amount of NH4+ adsorbed increased rapidly with increasing initial solution concentration, being higher at pH = 6.5 than at pH = 4.5 (Figure 8a).
These results were due to the increasing NH4+ concentration gradient and a higher probability of contact between NH4+ and the C and CFA adsorbents. The lower amount of NH4+ adsorbed for C compared to CFA at both pH values could be attributed to the low affinity of the functional groups contained in C for NH4+, which was already discussed in the kinetic studies. Meanwhile, the higher affinity observed of CFA for NH4+ can be explained by the higher pHH2O values obtained and the SBET values (Table 1), as previously discussed in the previous sections, and, in addition, by the possible effects of the cations contained in the CFA, such as CaCO3, CaO, and MgO. The dissolution of these compounds would allow the release of Ca2+ and Mg2+ cations, which possibly increase the NH4+ adsorption on the adsorbents due to cation exchange mechanisms [23].
The experimental adsorption data were fitted to the Freundlich, Langmuir, and linear models (Figure 8b), the parameters of which are tabulated in Table 3.
According to the obtained r2 and χ2 values, the Langmuir model only showed a better fit to the experimental data for the adsorption of NH4+ by C at pH = 6.5 (r2 = 0.978 and χ2 = 0.005), which suggested that the adsorption of NH4+ on this adsorbent and under these conditions occurs on a homogeneous surface through chemisorption [57]. However, due to the adsorption sites of C are heterogeneous, the fit of adsorption data of NH4+ to the Langmuir model at pH = 6.5 should be more studied. Meanwhile, the Freundlich model adequately described the adsorption of NH4+ on C and CFA at pH = 4.5 and for CFA at pH = 6.5 (r2 > 0.965 and χ2 < 0.012). Therefore, in all these cases, NH4+ would be adsorbed via a physisorption process, through the formation of multilayers, benefiting from the heterogeneous surfaces of the adsorbents that have varying binding energies [58]. Makgabutlane et al. [52] found that the adsorption of NH4+ on CFA-based zeolites adequately fitted to the Freundlich model, which is in line with the results obtained in this study.
From the parameters obtained from this model, the adsorption intensity (n) can be determined. At pH = 4.5, it was 0.97 for C and 1.07 for CFA, meaning the affinity for CFA was 1.10 times greater than for C. In contrast, at pH = 6.5, the value of n was 1.30 for C and 0.82 for CFA, indicating that C had 1.59 times higher affinity than CFA. According to Table S3, it can be observed that C and CFA exhibited lower adsorption capacities compared to other adsorbents previously reported for the removal of NH4+ from aquatic systems. However, CFA stands out for its low cost, abundance, and simple preparation process.

3.9. Desorption Studies

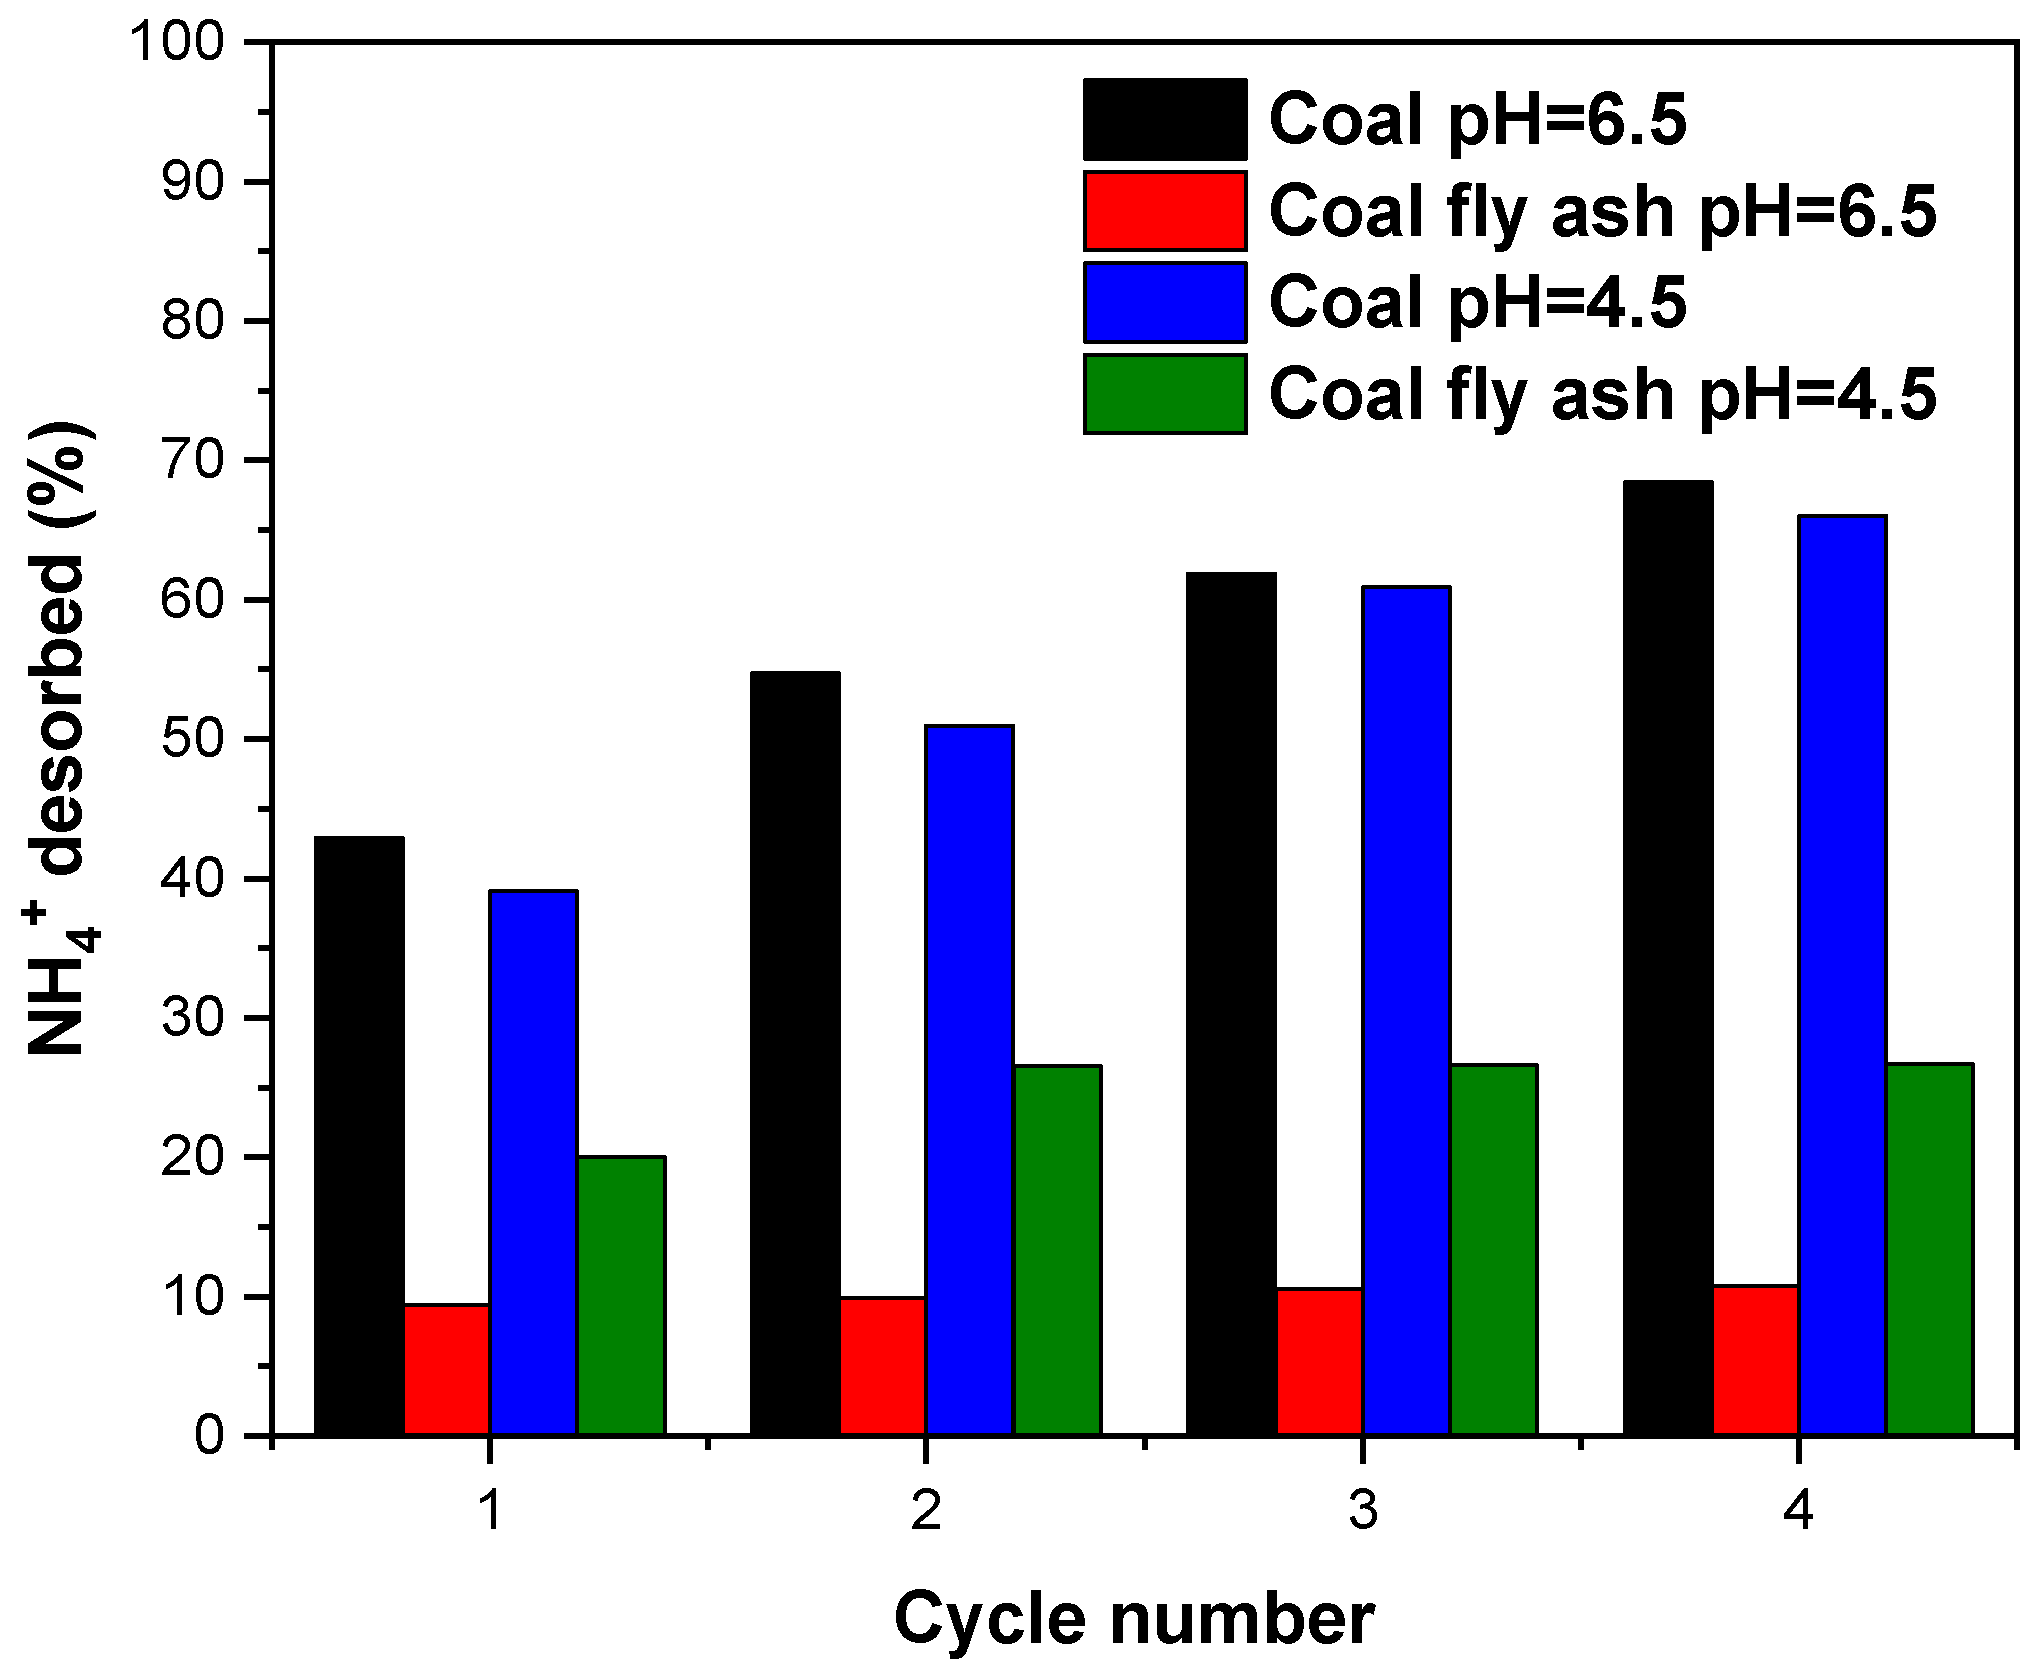
Desorption studies are used to determine the strength of interaction between an adsorbent and an adsorbate and the possible reusability of an adsorbent [58]. In this case, the data in Figure 9 show that after four desorption cycles at pH = 4.5 and 6.5, C had a desorption of 2.48 and 6.33 times greater than CFA. In other words, the strength of the interaction formed by NH4+ with CFA may be greater than that formed by NH4+ and C. This indicates that the NH4+ mainly adhered to C by electrostatic interactions (cation exchange), as it was largely exchangeable with H2O [58]. Similarly, Hamidi et al. [23] reported that C has a low capacity to retain NH4+ despite its high cation exchange capacity. Furthermore, Figure 9 showed that the strength of the interaction between NH4+ and CFA decreased at less acidic pH.

4. Conclusions

This study demonstrated that coal fly ash (CFA) had a higher BET specific surface area, pH, conductivity, and % of CaO and MgO than C, and a lower isoelectric point than C. It was determined that CFA (2.19 mg/g; pH = 4.5 and 2.79 mg/g; pH = 6.5) had higher NH4+ adsorption than C (1.39 mg/g; pH = 4.5 and 1.54 mg/g; pH = 6.5). Overall, the kinetic data fit the pseudo-second-order model well for both adsorbents, and the adsorption isotherms fit the Freundlich model. The study suggests CFA as a low-cost, natural adsorbent for removing NH4+ from aqueous systems. However, for potential development into a sustainable and effective NH4+ adsorption technology, further optimization is required (e.g., co-existing cations and temperature), and pilot-scale validation must also be considered. In addition, CFA loaded with NH4+ could be used as a soil amendment to increase NH4+ bioavailability, which also requires further research.

Supplementary Materials

The following supporting information can be downloaded at: https://www.mdpi.com/article/10.3390/pr13103118/s1, Figure S1. Nitrogen adsorption–desorption isotherms at 77 K for (a) coal, (b) coal fly ash, and BET graph for (c) coal, and (d) coal fly ash. Table S1. Kinetic models used for the description of ammonium adsorption. Table S2. Isotherm models used for the description of ammonium adsorption. Table S3. Modelled NH4+ adsorption capacity values of adsorbent materials. References [7,21,25,49,52,59,60,61,62,63,64,65,66,67,68,69] are cited in the supplementary materials.

Author Contributions

Conceptualization, J.S.-H., M.d.L.Á.S.-P., C.U. and C.G.J.; methodology, J.S.-H., N.B. and C.C.-C.; software, J.S.-H. and J.C.-R.; validation, M.d.L.Á.S.-P., P.P.-G. and C.G.J.; formal analysis, J.S.-H.; M.d.L.Á.S.-P. and A.R.; investigation, J.S.-H. and N.B.; resources, J.S.-H. and A.R.; data curation, J.S.-H.; writing—original draft preparation, J.S.-H., N.B., M.d.L.Á.S.-P., C.C.-C., J.C.-R. and T.S.; writing—review and editing, J.S.-H., R.M., C.U., T.S., C.G.J. and A.R.; visualization, J.S.-H., M.d.L.Á.S.-P., P.P.-G. and A.R.; supervision, J.S.-H. and A.R.; project administration, J.S.-H.; funding acquisition, J.S.-H. and A.R. All authors have read and agreed to the published version of the manuscript.

Funding

This study was supported by the Agencia Nacional de Investigación y Desarrollo de Chile (ANID) (grant number FONDECYT Postdoctoral Grant N° 3230179).

Institutional Review Board Statement

Not applicable.

Informed Consent Statement

Not applicable.

Data Availability Statement

The raw data supporting the conclusions of this article will be made available by the authors on request.

Acknowledgments

We gratefully acknowledge the support of the ANID PIA/BASAL project AFB240003. M.d.l.Á.S-P acknowledges the support of the Beca ANID 21231225. This work was partially funded by the Research Directorate of Universidad de La Frontera.

Conflicts of Interest

The authors declare no conflicts of interest.

References

  1. Singh, V. Textbook of Environment and Ecology; Springer: Singapore, 2024; ISBN 9789819988457. [Google Scholar]
  2. Marañón, E.; Ulmanu, M.; Fernández, Y.; Anger, I.; Castrillón, L. Removal of Ammonium from Aqueous Solutions with Volcanic Tuff. J. Hazard. Mater. 2006, 137, 1402–1409. [Google Scholar] [CrossRef]
  3. Randall, D.J.; Tsui, T.K.N. Ammonia Toxicity in Fish. Mar. Pollut. Bull. 2002, 45, 17–23. [Google Scholar] [CrossRef]
  4. Li, H.; Mei, X.; Nangia, V.; Guo, R.; Liu, Y.; Hao, W.; Wang, J. Effects of Different Nitrogen Fertilizers on the Yield, Water- and Nitrogen-Use Efficiencies of Drip-Fertigated Wheat and Maize in the North China Plain. Agric. Water Manag. 2021, 243, 106474. [Google Scholar] [CrossRef]
  5. Adam, M.R.; Othman, M.H.D.; Abu Samah, R.; Puteh, M.H.; Ismail, A.F.; Mustafa, A.; Rahman, M.A.; Jaafar, J. Current Trends and Future Prospects of Ammonia Removal in Wastewater: A Comprehensive Review on Adsorptive Membrane Development. Sep. Purif. Technol. 2019, 213, 114–132. [Google Scholar] [CrossRef]
  6. Joseph, J.; Sajeesh, A.K.; Nagashri, K.; Gladis, E.H.E.; Sharmila, T.M.; Dhanaraj, C.J. Determination of Ammonia Content in Various Drinking Water Sources in Malappuram District, Kerala and Its Removal by Adsorption Using Agricultural Waste Materials. Mater. Today Proc. 2021, 45, 811–819. [Google Scholar] [CrossRef]
  7. Vu, T.M.; Trinh, V.T.; Doan, D.P.; Van, H.T.; Nguyen, T.V.; Vigneswaran, S.; Ngo, H.H. Removing Ammonium from Water Using Modified Corncob-Biochar. Sci. Total Environ. 2017, 579, 612–619. [Google Scholar] [CrossRef] [PubMed]
  8. Liu, J.; Yuan, J.; Zhang, Y.; Zhang, H.; Luo, Y.; Su, Y. Identification of Ammonium Source for Groundwater in the Piedmont Zone with Strong Runoff of the Hohhot Basin Based on Nitrogen Isotope. Sci. Total Environ. 2023, 882, 163650. [Google Scholar] [CrossRef] [PubMed]
  9. Fahmi, M.A.; Rohman, A.; Ahsan, S.A.; Firmansyah, F.; Perdananugraha, G.M.; Rusydi, A.F. Evaluation of Ammonium Issues in Indonesian Groundwater: Potential Sources and Removal Methods. IOP Conf. Ser. Earth Environ. Sci. 2023, 1201, 012108. [Google Scholar] [CrossRef]
  10. Chen, S.K.; Lee, Y.Y.; Liao, T.L. Assessment of Ammonium–N and Nitrate–N Contamination of Shallow Groundwater in a Complex Agricultural Region, Central Western Taiwan. Water 2022, 14, 2130. [Google Scholar] [CrossRef]
  11. Buazar, H.; Larki, A.; Pourreza, N. Digital Colorimetric Detection of Ammonium in Water Samples after Microextraction Procedure Using Deep Eutectic Solvent, Based on DLLME Method. J. Mol. Liq. 2024, 404, 124938. [Google Scholar] [CrossRef]
  12. Tonelli, A.R.; Pham, A. Bronchiectasis, a Long-Term Sequela of Ammonia Inhalation: A Case Report and Review of the Literature. Burns 2009, 35, 451–453. [Google Scholar] [CrossRef]
  13. Haralambous, A.; Maliou, E.; Malamis, M. The Use of Zeolite for Ammonium Uptake. Water Sci. Technol. 1992, 25, 139–145. [Google Scholar] [CrossRef]
  14. Atsbha, M.W.; Liu, R.; Nir, O. Circular Hybrid Membrane Process Treating High-Salinity Ammonium-Rich Pharmaceutical Wastewater. Chem. Eng. J. 2024, 497, 154690. [Google Scholar] [CrossRef]
  15. Jo, J.Y.; Kim, J.G.; Tsang, Y.F.; Baek, K. Removal of Ammonium, Phosphate, and Sulfonamide Antibiotics Using Alum Sludge and Low-Grade Charcoal Pellets. Chemosphere 2021, 281, 130960. [Google Scholar] [CrossRef] [PubMed]
  16. Wang, Y.; Jiang, X.; Song, X.; Cao, X.; Xu, Z.; Wang, Y.; Li, J.; Wu, N.; Bai, J. Manganese Oxide–Loaded Activated Carbon for Ammonium Removal from Wastewater: The Roles of Adsorption and Oxidation. Environ. Sci. Pollut. Res. 2023, 30, 110161–110174. [Google Scholar] [CrossRef]
  17. Amanollahi, H.; Moussavi, G.; Ostovar, S.; Giannakis, S. From Waste to Wealth: Using MgO Nanoparticles to Transform Ammonium into a Valuable Resource. J. Water Process Eng. 2023, 56, 104331. [Google Scholar] [CrossRef]
  18. Zare, K.; Sadegh, H.; Shahryari-Ghoshekandi, R.; Asif, M.; Tyagi, I.; Agarwal, S.; Gupta, V.K. Equilibrium and Kinetic Study of Ammonium Ion Adsorption by Fe3O4 Nanoparticles from Aqueous Solutions. J. Mol. Liq. 2016, 213, 345–350. [Google Scholar] [CrossRef]
  19. Vu, T.M.; Nguyen, T.M.P.; Van, H.T.; Hoang, V.H.; Nga, L.T.Q.; Hoang, L.P.; Ravindran, B. High Removal Efficiency of Ammonium from Aqueous Solution by Colloidal Silver Nanoparticles: Batch Adsorption. Urban Water J. 2024, 21, 323–336. [Google Scholar] [CrossRef]
  20. Bellahsen, N.; Varga, G.; Halyag, N.; Kertész, S.; Tombácz, E.; Hodúr, C. Pomegranate Peel as a New Low-Cost Adsorbent for Ammonium Removal. Int. J. Environ. Sci. Technol. 2021, 18, 711–722. [Google Scholar] [CrossRef]
  21. Affandi, K.A.; Bagastyo, A.Y.; Fitriana, A.R. View of Removal of Ammonium and Phosphate in the Simulated Wastewater by Using Coal Fly Ash Adsorbent. Sustinere J. Environ. Sustain. 2021, 5, 24–35. [Google Scholar] [CrossRef]
  22. Xu, H.; Wang, B.; Zhao, R.; Wang, X.; Pan, C.; Jiang, Y.; Zhang, X.; Ge, B. Adsorption Behavior and Performance of Ammonium onto Sorghum Straw Biochar from Water. Sci. Rep. 2022, 12, 5358. [Google Scholar] [CrossRef] [PubMed]
  23. Hamidi, N.H.; Ahmed, O.H.; Omar, L.; Ch’ng, H.Y.; Johan, P.D.; Paramisparam, P.; Musah, A.A.; Jalloh, M.B. Charcoal and Sago Bark Ash Regulates Ammonium Adsorption and Desorption in an Acid Soil. Sustainability 2023, 15, 1368. [Google Scholar] [CrossRef]
  24. Wu, P.; Tang, Y.; Cai, Z. Dual Role of Coal Fly Ash in Copper Ion Adsorption Followed by Thermal Stabilization in a Spinel Solid Solution. RSC Adv. 2018, 8, 8805–8812. [Google Scholar] [CrossRef] [PubMed]
  25. Chen, X.; Song, H.; Guo, Y.; Wang, L.; Cheng, F. Converting Waste Coal Fly Ash into Effective Adsorbent for the Removal of Ammonia Nitrogen in Water. J. Mater. Sci. 2018, 53, 12731–12740. [Google Scholar] [CrossRef]
  26. Serra, M.T. Especies Arbóreas y Arbustivas Para Las Zonas Aridas y Semiáridas de América Latina. In Red Latinoamericana de Cooperación Técnica en Sistemas Agroforestales; FAO: Santiago, Chile, 1997. [Google Scholar]
  27. Cruz, J.P.; Schulze, D.C.C.; Honeyman, P. Chilean Mediterranean Forest, Their Values and Destiny Facing Global Change. In Forest Management of Mediterranean Forest Under the New Context of Climate Change; Universidad Mayor: Santiago, Chile, 2005; pp. 78–88. ISBN 9781624178689. [Google Scholar]
  28. Sadzawka, R.A.; Carrasco, R.A.M.; Grez, Z.R.; De La Luz Mora, G.M. Métodos de Análisis de Compost; Comisión de Normalización y Acreditación (CNA); Sociedad Chilena de La Ciencia Del Suelo: Santiago, Chile, 2005. [Google Scholar]
  29. Liu, Y.; Miao, J.; Han, H.; Xu, P. Differences in Influence of Particle Size on the Adsorption Capacity between Deformed and Undeformed Coal. ACS Omega 2021, 6, 5886–5897. [Google Scholar] [CrossRef]
  30. Batra, V.S.; Urbonaite, S.; Svensson, G. Characterization of Unburned Carbon in Bagasse Fly Ash. Fuel 2008, 87, 2972–2976. [Google Scholar] [CrossRef]
  31. Koch, F.C.; McMeekin, T.L. A New Direct Nesslerization Micro-Kjeldahl Method and a Modification of the Nessler-Folin Reagent for Ammonia. J. Am. Chem. Soc. 1924, 46, 2066–2069. [Google Scholar] [CrossRef]
  32. Tran, H.N.; You, S.J.; Chao, H.P. Thermodynamic Parameters of Cadmium Adsorption onto Orange Peel Calculated from Various Methods: A Comparison Study. J. Environ. Chem. Eng. 2016, 4, 2671–2682. [Google Scholar] [CrossRef]
  33. Suazo-Hernández, J.; Klumpp, E.; Arancibia-Miranda, N.; Poblete-Grant, P.; Jara, A.; Bol, R.; de La Luz Mora, M. Describing Phosphorus Sorption Processes on Volcanic Soil in the Presence of Copper or Silver Engineered Nanoparticles. Minerals 2021, 11, 373. [Google Scholar] [CrossRef]
  34. Bhatt, A.; Priyadarshini, S.; Acharath Mohanakrishnan, A.; Abri, A.; Sattler, M.; Techapaphawit, S. Physical, Chemical, and Geotechnical Properties of Coal Fly Ash: A Global Review. Case Stud. Constr. Mater. 2019, 11, e00263. [Google Scholar] [CrossRef]
  35. Gaffney, J.S.; Marley, N.A. The Impacts of Combustion Emissions on Air Quality and Climate—From Coal to Biofuels and Beyond. Atmos. Environ. 2009, 43, 23–36. [Google Scholar] [CrossRef]
  36. Mukherjee, A.B.; Zevenhoven, R.; Bhattacharya, P.; Sajwan, K.S.; Kikuchi, R. Mercury Flow via Coal and Coal Utilization By-Products: A Global Perspective. Resour. Conserv. Recycl. 2008, 52, 571–591. [Google Scholar] [CrossRef]
  37. Silva-Yumi, J.; Escudey, M.; Gacitua, M.; Pizarro, C. Kinetics, Adsorption and Desorption of Cd(II) and Cu(II) on Natural Allophane: Effect of Iron Oxide Coating. Geoderma 2018, 319, 70–79. [Google Scholar] [CrossRef]
  38. Can, Ö.; Baklacioglu, T.; Özturk, E.; Turan, O. Artificial Neural Networks Modeling of Combustion Parameters for a Diesel Engine Fueled with Biodiesel Fuel. Energy 2022, 247, 123473. [Google Scholar] [CrossRef]
  39. Jiang, J.; Zhang, S.; Longhurst, P.; Yang, W.; Zheng, S. Molecular Structure Characterization of Bituminous Coal in Northern China via XRD, Raman and FTIR Spectroscopy. Spectrochim. Acta—Part A Mol. Biomol. Spectrosc. 2021, 255, 119724. [Google Scholar] [CrossRef] [PubMed]
  40. da Silva Veiga, P.A.; Cerqueira, M.H.; Gonçalves, M.G.; da Silva Matos, T.T.; Pantano, G.; Schultz, J.; de Andrade, J.B.; Mangrich, A.S. Upgrading from Batch to Continuous Flow Process for the Pyrolysis of Sugarcane Bagasse: Structural Characterization of the Biochars Produced. J. Environ. Manag. 2021, 285, 12145. [Google Scholar] [CrossRef]
  41. Zielińska, A.; Oleszczuk, P.; Charmas, B.; Skubiszewska-Zięba, J.; Pasieczna-Patkowska, S. Effect of Sewage Sludge Properties on the Biochar Characteristic. J. Anal. Appl. Pyrolysis 2015, 112, 201–213. [Google Scholar] [CrossRef]
  42. Bamdad, H.; Papari, S.; MacQuarrie, S.; Hawboldt, K. Study of Surface Heterogeneity and Nitrogen Functionalizing of Biochars: Molecular Modeling Approach. Carbon N. Y. 2021, 171, 161–170. [Google Scholar] [CrossRef]
  43. Shi, W.; Ju, Y.; Bian, R.; Li, L.; Joseph, S.; Mitchell, D.R.G.; Munroe, P.; Taherymoosavi, S.; Pan, G. Biochar Bound Urea Boosts Plant Growth and Reduces Nitrogen Leaching. Sci. Total Environ. 2020, 701, 134424. [Google Scholar] [CrossRef]
  44. Opiso, E.M.; Tabelin, C.B.; Maestre, C.V.; Aseniero, J.P.J.; Park, I.; Villacorte-Tabelin, M. Synthesis and Characterization of Coal Fly Ash and Palm Oil Fuel Ash Modified Artisanal and Small-Scale Gold Mine (ASGM) Tailings Based Geopolymer Using Sugar Mill Lime Sludge as Ca-Based Activator. Heliyon 2021, 7, e06654. [Google Scholar] [CrossRef]
  45. Li, H.; Hou, Y.; He, Z.; Wei, J.; Ren, S.; Wu, W. Structural Evolution Characteristics of Lignite during Pyrolysis Based on Alkaline-Oxygen Oxidation, NMR and FTIR. J. Anal. Appl. Pyrolysis 2023, 172, 105980. [Google Scholar] [CrossRef]
  46. Nair, R.R.; Mondal, M.M.; Weichgrebe, D. Biochar from Co-Pyrolysis of Urban Organic Wastes—Investigation of Carbon Sink Potential Using ATR-FTIR and TGA. Biomass Convers. Biorefinery 2022, 12, 4729–4743. [Google Scholar] [CrossRef]
  47. Chen, Y.; Mastalerz, M.; Schimmelmann, A. Characterization of Chemical Functional Groups in Macerals across Different Coal Ranks via Micro-FTIR Spectroscopy. Int. J. Coal Geol. 2012, 104, 22–33. [Google Scholar] [CrossRef]
  48. Meng, D.; Yue, C.; Wang, T.; Chen, X. Evolution of Carbon Structure and Functional Group during Shenmu Lump Coal Pyrolysis. Fuel 2021, 287, 119538. [Google Scholar] [CrossRef]
  49. Zhao, Y.; Luan, H.; Yang, B.; Li, Z.; Song, M.; Li, B.; Tang, X. Adsorption of Low-Concentration Ammonia Nitrogen from Water on Alkali-Modified Coal Fly Ash: Characterization and Mechanism. Water 2023, 15, 956. [Google Scholar] [CrossRef]
  50. Xia, L.; Cao, J.; Stüeken, E.E.; Zhi, D.; Wang, T.; Li, W. Unsynchronized Evolution of Salinity and PH of a Permian Alkaline Lake Influenced by Hydrothermal Fluids: A Multi-Proxy Geochemical Study. Chem. Geol. 2020, 541, 119581. [Google Scholar] [CrossRef]
  51. Zhu, J.; Liu, Z.; Yang, F.; Long, D.; Jian, Y.; Pu, S. The Preparation of {001}TiO2/TiOF2 via a One-Step Hydrothermal Method and Its Degradation Mechanism of Ammonia Nitrogen. Materials 2022, 15, 6465. [Google Scholar] [CrossRef]
  52. Makgabutlane, B.; Nthunya, L.N.; Musyoka, N.; Dladla, B.S.; Nxumalo, E.N.; Mhlanga, S.D. Microwave-Assisted Synthesis of Coal Fly Ash-Based Zeolites for Removal of Ammonium from Urine. RSC Adv. 2020, 10, 2416–2427. [Google Scholar] [CrossRef]
  53. Boparai, H.K.; Joseph, M.; Carroll, D.M.O. Kinetics and Thermodynamics of Cadmium Ion Removal by Adsorption onto Nano Zerovalent Iron Particles. J. Hazard. Mater. 2011, 186, 458–465. [Google Scholar] [CrossRef]
  54. Shaheen, U.; Ye, Z.L.; Abass, O.K.; Zamel, D.; Rehman, A.; Zhao, P.; Huang, F. Evaluation of Potential Adsorbents for Simultaneous Adsorption of Phosphate and Ammonium at Low Concentrations. Microporous Mesoporous Mater. 2024, 379, 113301. [Google Scholar] [CrossRef]
  55. Wang, H.; Zhu, J.; Fu, Q.L.; Xiong, J.W.; Hong, C.; Hu, H.Q.; Violante, A. Adsorption of Phosphate onto Ferrihydrite and Ferrihydrite-Humic Acid Complexes. Pedosphere 2015, 25, 405–414. [Google Scholar] [CrossRef]
  56. Limousin, G.; Gaudet, J.P.; Charlet, L.; Szenknect, S.; Barthès, V.; Krimissa, M. Sorption Isotherms: A Review on Physical Bases, Modeling and Measurement. Appl. Geochem. 2007, 22, 249–275. [Google Scholar] [CrossRef]
  57. Alshameri, A.; He, H.; Zhu, J.; Xi, Y.; Zhu, R.; Ma, L.; Tao, Q. Adsorption of Ammonium by Different Natural Clay Minerals: Characterization, Kinetics and Adsorption Isotherms. Appl. Clay Sci. 2018, 159, 83–93. [Google Scholar] [CrossRef]
  58. Aghoghovwia, M.P.; Hardie, A.G.; Rozanov, A.B. Characterisation, Adsorption and Desorption of Ammonium and Nitrate of Biochar Derived from Different Feedstocks. Environ. Technol. 2022, 43, 774–787. [Google Scholar] [CrossRef] [PubMed]
  59. Suazo-Hernández, J.; Sepúlveda, P.; Manquián-Cerda, K.; Ramírez-Tagle, R.; Rubio, M.A.; Bolan, N.; Sarkar, B.; Arancibia-Miranda, N. Synthesis and Characterization of Zeolite-Based Composites Functionalized with Nanoscale Zero-Valent Iron for Removing Arsenic in the Presence of Selenium from Water. J. Hazard. Mater. 2019, 373, 810–819. [Google Scholar] [CrossRef]
  60. Suazo-Hernández, J.; Urdiales, C.; Poblete-Grant, P.; Pesenti, H.; Cáceres-Jensen, L.; Sarkar, B.; Bolan, N.; de la Luz Mora, M. Effect of Particle Size of Nanoscale Zero–Valent Copper on Inorganic Phosphorus Adsorption–Desorption in a Volcanic Ash Soil. Chemosphere 2023, 340, 139836. [Google Scholar] [CrossRef]
  61. Suazo-Hernández, J.; Mlih, R.; Bustamante, M.; Castro-Castillo, C.; Mora, M.d.l.L.; Sepúlveda-Parada, M.d.l.Á.; Mella, C.; Cornejo, P.; Ruiz, A. Immobilization of Inorganic Phosphorus on Soils by Zinc Oxide Engineered Nanoparticles. Toxics 2025, 13, 363. [Google Scholar] [CrossRef]
  62. Do, T.T.; Van, H.T.; Pham, Q.H.; Nguyen, T.H. Adsorption of Ammonium from Aqueous Solution Using Coffee Husk-Derived Activated Charcoal Composite with Fe3O4. Results Surf. Interfaces 2025, 18, 100471. [Google Scholar] [CrossRef]
  63. Jiang, Q.; He, J.; Wang, Y.; Chen, B.; Tian, K.; Yang, K.; Wei, H.; Xu, X. Efficient Removal of Ammonia–Nitrogen in Wastewater by Zeolite Molecular Sieves Prepared from Coal Fly Ash. Sci. Rep. 2024, 14, 21064. [Google Scholar] [CrossRef]
  64. Godifredo, J.; Ferrer, J.; Seco, A.; Barat, R. Zeolites for Nitrogen Recovery from the Anaerobic Membrane Bioreactor Permeate: Zeolite Characterization. Water 2023, 15, 1007. [Google Scholar] [CrossRef]
  65. Ma, Z.; Li, Q.; Yue, Q.; Gao, B.; Li, W.; Xu, X.; Zhong, Q. Adsorption Removal of Ammonium and Phosphate from Water by Fertilizer Controlled Release Agent Prepared from Wheat Straw. Chem. Eng. J. 2011, 171, 1209–1217. [Google Scholar] [CrossRef]
  66. Wahab, M.A.; Jellali, S.; Jedidi, N. Ammonium Biosorption onto Sawdust: FTIR Analysis, Kinetics and Adsorption Isotherms Modeling. Bioresour. Technol. 2010, 101, 5070–5075. [Google Scholar] [CrossRef]
  67. Boopathy, R.; Karthikeyan, S.; Mandal, A.B.; Sekaran, G. Adsorption of Ammonium Ion by Coconut Shell-Activated Carbon from Aqueous Solution: Kinetic, Isotherm, and Thermodynamic Studies. Environ. Sci. Pollut. Res. 2013, 20, 533–542. [Google Scholar] [CrossRef]
  68. Cheng, Y.; Huang, T.; Shi, X.; Wen, G.; Sun, Y. Removal of Ammonium Ion from Water by Na-Rich Birnessite: Performance and Mechanisms. J. Environ. Sci. 2017, 57, 402–410. [Google Scholar] [CrossRef]
  69. Cheng, H.; Zhu, Q.; Xing, Z. Adsorption of Ammonia Nitrogen in Low Temperature Domestic Wastewater by Modification Bentonite. J. Clean. Prod. 2019, 233, 720–730. [Google Scholar] [CrossRef]
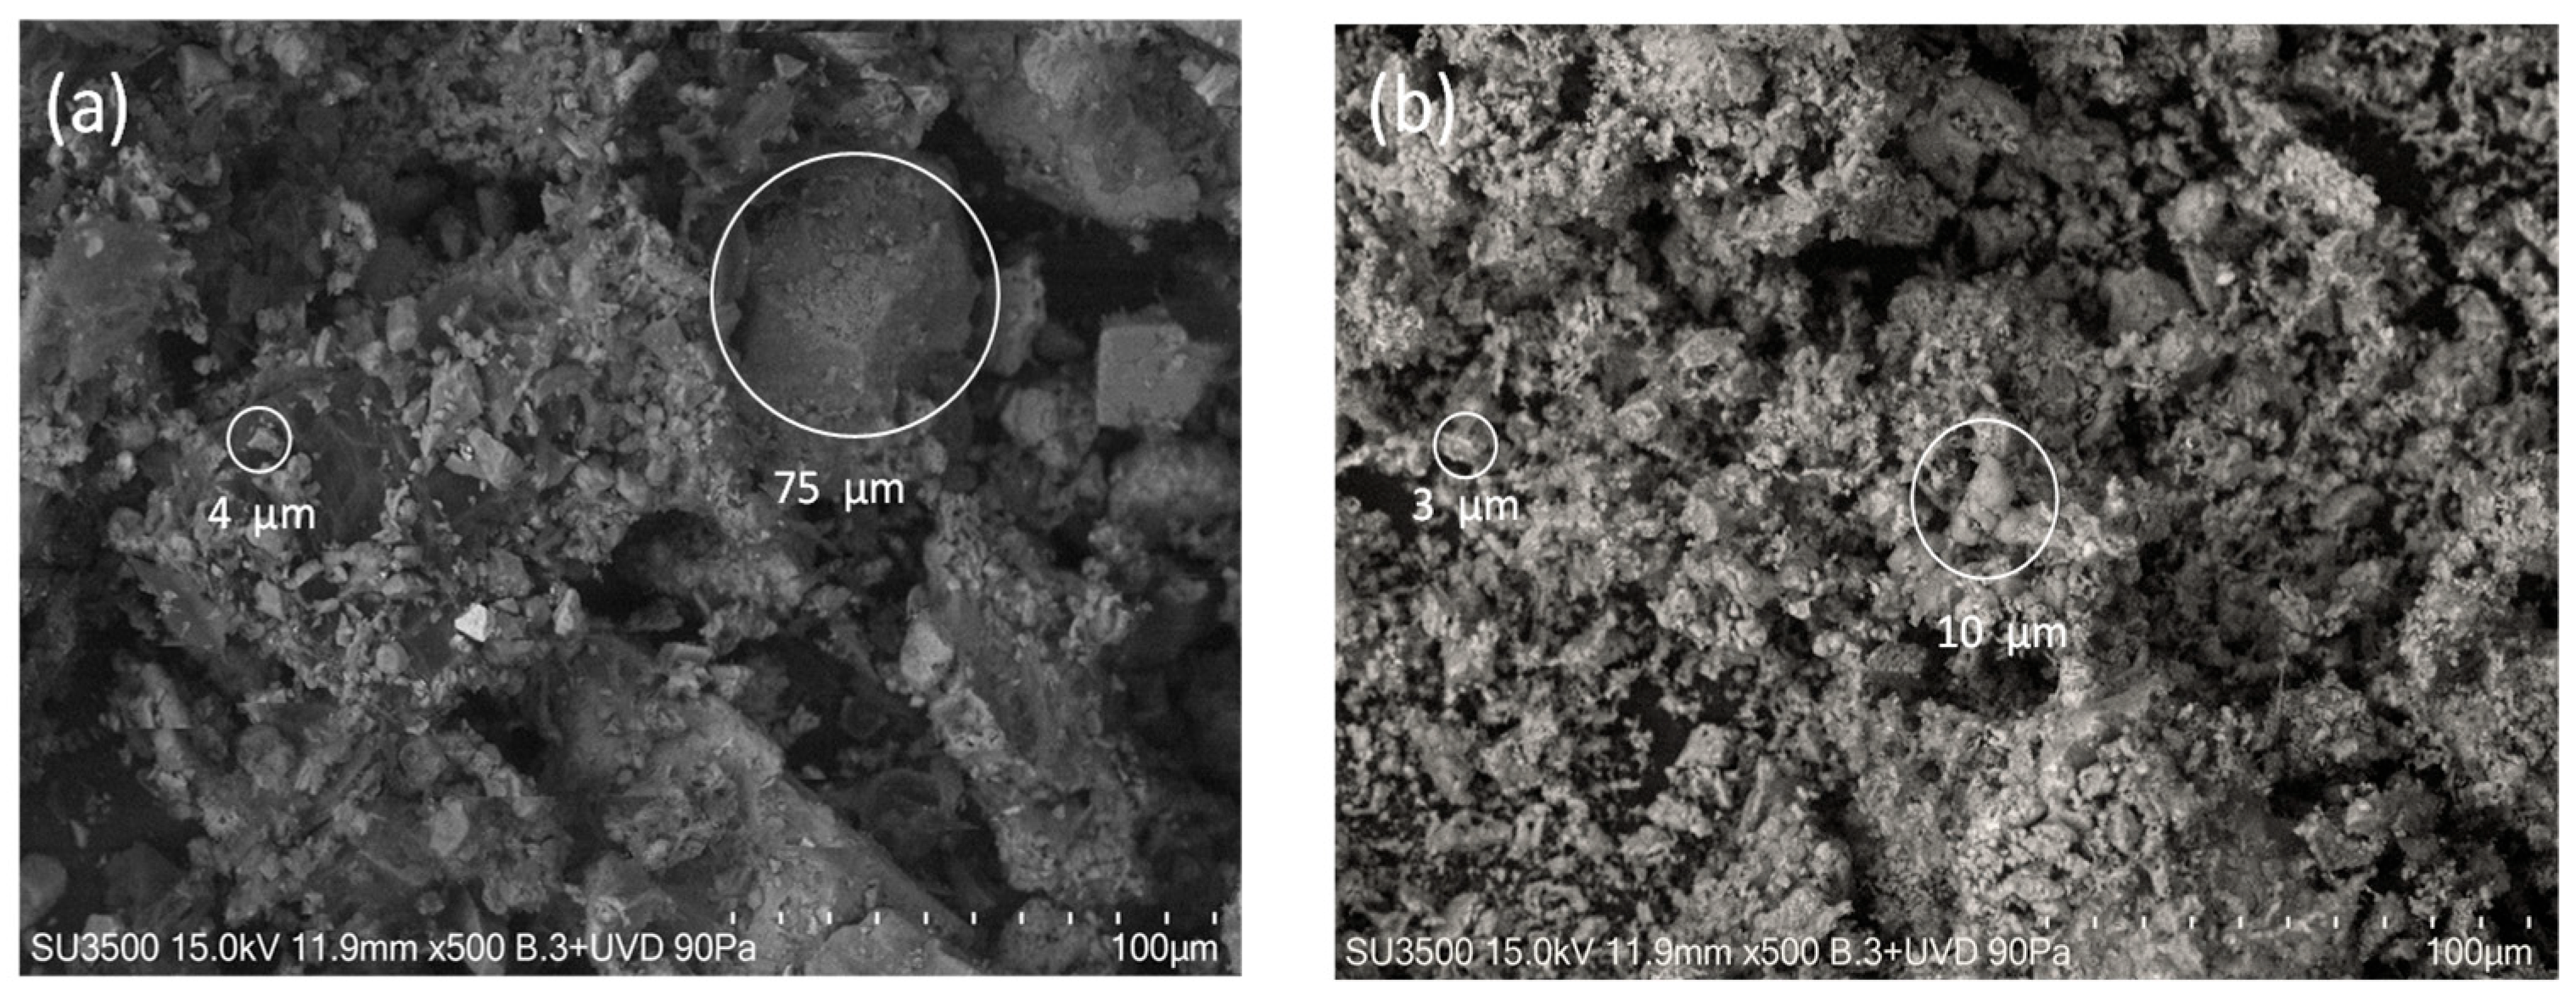
Figure 1. SEM analysis of (a) coal, and (b) coal fly ash.
Processes 13 03118 g001
Figure 2. SEM-EDX analysis of (a) coal, and (b) coal fly ash.
Processes 13 03118 g002
Figure 3. Zeta potential for coal and coal fly ash.
Processes 13 03118 g003
Figure 4. FT-IR spectrum of (a) coal, and (b) coal fly ash baseline corrected and smoothed.
Processes 13 03118 g004
Figure 5. Effect of coal and coal fly ash dosages on the removal of NH4+ at solution pH = 6.5 ± 0.2.
Processes 13 03118 g005
Figure 6. (a) Effect of pH on the adsorption of ammonium (NH4+) on coal and coal fly ash, and (b) variation in pH (ΔpH) before and after adsorption at different initial pH values.
Processes 13 03118 g006
Figure 7. (a) Adsorption kinetics of ammonium (NH4+) on coal and coal ash at pH = 4.5 ± 0.2 and 6.5 ± 0.2, and (b) model fitting lines of the experimental data.
Processes 13 03118 g007
Figure 8. (a) Ammonium (NH4+) adsorption isotherms at pH 4.5 ± 0.2 and 6.5 ± 0.2 on coal and coal fly ash, and (b) NH4+ adsorption isotherms on coal and coal fly ash modelled by Langmuir, Freundlich, and Linear models.
Processes 13 03118 g008
Figure 9. Ammonium (NH4+) desorption percentage obtained from coal and coal fly ash using distilled water as the extracting agent.
Processes 13 03118 g009
Table 1. Physical-chemical properties of coal and coal fly ash.
CoalCoal Fly Ash
pHH2O (1:5)8.411.9
Electrical conductivity (1:5) dS/m1.237.1
Humidity (%)4.700.60
Organic matter (%)90.501.68
Total nitrogen (%)1.100.06
NH4+ (mg/kg)9.201.10
P2O5 (%)0.302.37
K2O (%)1.458.80
CaO (%)3.8927.00
MgO (%)0.184.81
BET specific surface area (m2/g)4.4095.411
Pore radius (Å)17.6618.72
Pore volume (g/cm3)0.01380.0126
Table 2. Pseudo-first-order and pseudo-second-order parameters obtained from ammonium adsorption kinetics at pH 4.5 ± 0.2 and 6.5 ± 0.2 on coal and coal fly ash.
CoalCoal Fly AshCoalCoal Fly Ash
pH4.56.5
qe (%)20.3533.4823.7644.67
qexp (mg/g)1.39 ± 0.102.19 ± 0.051.54 ± 0.032.79 ± 0.18
Pseudo-first-order
qe (mg/g)1.24 ± 0.032.03 ± 0.041.39 ± 0.052.75 ± 0.04
k1 (1/min)0.409 ± 0.0590.913 ± 0.2430.238 ± 0.040.361 ± 0.03
r20.9650.9700.9560.986
χ20.0080.0140.0130.013
Pseudo-second-order
qe (mg/g)1.30 ± 0.032.08 ± 0.041.45 ± 0.032.83 ± 0.09
k2 (g/mg/min)0.565 ± 0.1401.128 ± 0.4020.259 ± 0.040.247 ± 0.07
h (mg/g/min)0.988 ± 0.0004.88 ± 0.00 0.544 ± 0.001.978 ± 0.000
r20.9700.9830.9810.951
χ20.0060.0080.0050.041
Table 3. Langmuir, Freundlich, and Linear parameters obtained from ammonium adsorption isotherm at pH 4.5 ± 0.2 and 6.5 ± 0.2 on coal and coal fly ash.
CoalCoal Fly AshCoalCoal Fly Ash
pH4.56.5
Langmuir
qmax (mg/g)N/AN/A2.79 ± 0.85N/A
kLN/AN/A0.018 ± 0.008N/A
r2N/AN/A0.978N/A
χ2N/AN/A0.005N/A
Freundlich
kF (mg/g)0.021 ± 0.0110.066 ± 0.0220.070 ± 0.0250.037 ± 0.007
n0.97 ± 0.1401.07 ± 0.121.30 ± 0.180.82 ± 0.04
r20.9650.9790.9660.996
χ20.0060.0120.0080.004
Linear
K (L/g)0.024 ± 0.0020.052 ± 0.0040.029 ± 0.030.079 ± 0.004
r20.9660.9770.9430.986
N/A: not applicable.
Disclaimer/Publisher’s Note: The statements, opinions and data contained in all publications are solely those of the individual author(s) and contributor(s) and not of MDPI and/or the editor(s). MDPI and/or the editor(s) disclaim responsibility for any injury to people or property resulting from any ideas, methods, instructions or products referred to in the content.