Abstract
Overdosing an external carbon source can lead to its incomplete utilization. With this in mind, this study aimed to investigate the effect of carbon dosing on nutrient removal in a rotating electro-biological disc contactor (REBDC) treating hydroponic tomato wastewater and to evaluate its impact on effluent COD under a constant electric current (2.5 A/m2). In REBDC, discs served as the cathode, and an aluminum sheet placed in the tank served as the anode. Sodium acetate was added to provide carbon to nitrogen (C/N) ratios of 0.5, 1.0, 2.0, and 3.0. The HRT was 24 h. The phosphorus removal efficiency in the REBDC exceeded 90% at C/N ratios of 0.5, 1.0, and 2.0. A several-fold increase was observed in nitrogen removal efficiency at C/N = 2.0 and C/N = 3.0 compared to C/N = 0.5 (9 and 11 times higher, respectively). At C/N ratios of 2.0 and 3.0, the efficiency was 56.0% and 65%, respectively. Considerable amounts of unutilized organic carbon were found in the REBDC-treated wastewater. The rational solution would be to extend the HRT, which would enable greater substrate consumption and nitrogen removal.
1. Introduction
The growing demand for vegetables, fruits, herbs, and other crops has significantly increased the use of protected cultivation methods, including vertical farms. These are highly efficient systems that enable year-round production, like soilless cultivation, which isolates plants from soil and entails fertigation (a combination of fertilization and irrigation) [1]. This approach allows for the precise optimization of crop yields by adjusting the nutrient medium’s composition and dosage to meet the plants’ demands for nutrients under specified environmental conditions.
To prevent salt accumulation in the rhizosphere and ensure optimal nutrient supply, crops cultivated in this system are irrigated with an excess of a nutrient solution, typically ranging from 25% to 45%, which generates approximately 4.5 L/m2 of nutrient-dense greenhouse wastewater (GW) [2].
Our previous study addressing greenhouse wastewater from soilless tomato cultivation revealed that the wastewater had low levels of organic matter but high concentrations of total nitrogen (TN) and total phosphorus (TP), and had increased salinity (expressed as electrical conductivity, EC). Notably, more than 99% of TN was present in the form of nitrates [1]. The analyzed wastewater originated from two greenhouses for soilless tomato cultivation under shelter, located in the north-eastern Poland. The greenhouses differed in the production scale, i.e., the area of Greenhouse 1 (located at the University of Warmia and Mazury in Olsztyn) was approximately 100 m2, whereas that of Greenhouse 2 was 200,000 m2 (private enterprise).
The composition of GW varied as follows:
- COD: 50.07–75.82 mg O2/L (Greenhouse 1) and 37.35–78.12 mg O2/L (Greenhouse)
- TN: 403.59–614.89 mg N/L (Greenhouse 1) and 270.00–577.40 mg N/L (Greenhouse 2)
- TP: 35.44–78.00 mg P/L (Greenhouse 1) and 54.10–104.00 mg P/L (Greenhouse 2)
- EC: 3.53–6.93 mS/cm (Greenhouse 1) and 4.94–6.94 mS/cm (Greenhouse 2).
According to Polish and EU regulations [3], wastewater with such high concentrations of biogenic compounds cannot be discharged untreated into surface waters or soil. For biodegradable industrial wastewater originating from the production and processing of fruit and vegetables (including tomato processing), the biogene concentrations have been stipulated below 30.0 mg N/L for total nitrogen (TN) and below 3.0 mg P/L for total phosphorus (TP). These quality requirements underscore the necessity of treating or pre-treating GW prior to discharging it into surface waters or sewage systems. The pre-treatment is also essential if the wastewater is intended for recirculation within the cultivation system [1]. Other studies have supported these observations. For instance, Du et al. [4] reported nitrate concentrations ranging from 150 to 600 mg N/L in effluents from soilless tomato cultivation, whereas Kwon et al. [5] determined values of up to 494 mg N/L (TN), 96.9 mg P/L (TP), and an EC of 37.5 µmho/cm in wastewater from tomato and capsicum cultivation.
The treatment of wastewater having a low C/N ratio requires supplementing it with an external carbon source, which acts as an electron donor in the denitrification process [6,7]. Various solid (SCS), liquid, or gaseous substances can serve as external carbon sources. According to Henze et al. [8], the reduction of 1 mg N–NO3− to nitrogen requires 2–5 mg COD of organic material. For methanol, this ratio is approximately 2.5 mg methanol per mg N–NO3−, whereas for acetic acid it ranges from 3.0 to 4.0 mg COD, when biomass growth is taken into account. The theoretical carbon demand for complete hydrogenotrophic denitrification has been estimated at 0.20 mg C (as bicarbonate) per 1 mg NO3− reduced to gaseous nitrogen [9], and at 0.12–0.21 mg C (as CO2 gas) per 1 mg NO3− [10]. Liquid carbon sources include methanol [11], acetic acid [12], sodium acetate [13], citric acid [14], sugars [15], industrial wastewater [16], and liquid fermentation products derived from sewage sludge and food waste [17,18].
Biodegradable polymers (BDPs), composed of polyesters and polyolefins, have been increasingly recognized as viable solid carbon sources. They ensure controlled carbon release, while minimizing the risk of exceeding COD discharge limits, thereby ensuring safe and reliable wastewater treatment [19,20,21]. Furthermore, solid carbon sources, which are generally insoluble in water, not only serve as stable electron donors for denitrification but also act as a growth medium for denitrifying microorganisms. This helps prevent the overdosage of carbon sources, which could otherwise adversely affect effluent quality and process control [17,22]. Despite these advantages, their use is often constrained by reactor design, often requiring the supplementation of liquid carbon sources. One such case involves bio-electro reactors (BERs), which, when combined with an external carbon source, create optimal conditions for nitrate and phosphorus removal from GW.
One of the technologically prospective BERs is the rotating electro-biological disc contactor (REBDC). It consists of flat discs mounted on a horizontal rotating shaft [23]. The electric current applied in REBDC facilitates key processes, including water electrolysis, hydrogenotrophic denitrification, electrochemical nitrate reduction, and efficient phosphorus electrocoagulation.
Hydrogenotrophic denitrification, driven by the electric current applied, may reduce the demand for organic substrates required for heterotrophic denitrification. Sodium acetate serves as a carbon source for heterotrophic denitrifying bacteria, both within the biofilm on the discs and the suspended biomass, influencing dissolved organic carbon (DOC) levels in the effluent. Additionally, hydrogen and carbon dioxide produced during water electrolysis are consumed by autotrophic denitrifying microorganisms [23].
Rodziewicz et al. [13] examined the use of sodium acetate as a carbon source in REBDC systems at a C:N ratio of 0.5. Their research showed that maximum nitrogen and phosphorus removal efficiencies were achieved at a hydraulic retention time (HRT) of 24 h. Key findings from their study were as follows:
- At current densities above 2.5 A/m2, hydrogenotrophic denitrification became the dominant nitrogen removal mechanism, while heterotrophic denitrification and electrochemical nitrate reduction were suppressed.
- At a 24-h HRT and 2.5 A/m2 current density, phosphorus removal efficiency exceeded 99%, while nitrogen removal efficiency reached 38.7%.
- Higher current densities (>2.5 A/m2) increased the wastewater temperature above 33.5 °C.
During the experiment, the COD of synthetic wastewater was 52.5 ± 4.5 mg O2/L. After adding sodium acetate, it increased to 259.5 ± 39.7 mg O2/L, and ultimately reached 24.5 ± 2.9 mg O2/L in the treated wastewater. These findings confirm the complete utilization of the external carbon source during heterotrophic denitrification.
However, the nitrogen removal efficiency recorded in these experiments (<40%) suggests that increasing the external carbon dose could further enhance heterotrophic denitrification and overall nitrogen removal. Nevertheless, reactor design must correspond to the specific characteristics of the treated wastewater to minimize carbon and nitrogen footprints.
In addition to direct emissions (e.g., greenhouse gases) and aquatic pollutants (e.g., reactive nitrogen species and phosphorus), also energy and raw material consumption during wastewater treatment must be considered. The priority should be to optimize energy and resource efficiency by leveraging the full potential of the selected technology.
While the addition of an external carbon source enhances heterotrophic denitrification in REBDC systems, precise dosing is critical. Insufficient carbon supply leads to incomplete denitrification, rendering the treated wastewater non-compliant with discharge standards, whereas excess carbon increases COD levels in the effluent, thereby posing potential environmental risks.
The objective of this study was to evaluate the effect of external carbon dosing on nitrogen and phosphorus removal efficiency in a rotating electro-biological disc contactor treating wastewater from soilless tomato cultivation, and to assess its impact on COD levels in the effluent. The results of the tests conducted in REBDC were compared with those obtained in a biological reactor without electric current flow (rotating biological disc contactor, RBDC) fed with the same doses of the organic substrate as REBDC.
2. Materials and Methods
2.1. Wastewater Characteristics
The study was conducted with wastewater collected from a greenhouse specializing in soilless tomato cultivation, located in Legajny, Poland. The wastewater was collected at the outflow of the fertigation system, ensuring a representative sample of drainage water from the cultivation process.
Prior to the experiments, composite samples were analyzed for:
- Chemical oxygen demand (COD),
- Total nitrogen (TN),
- Nitrate nitrogen (N-NO3),
- Total phosphorus (TP),
- Electrical conductivity (EC).
The initial wastewater parameters are presented in Table 1.

Table 1.
Wastewater characteristics.
The wastewater had a low C/N ratio, with over 99% of nitrogen present in the form of nitrates.
2.2. Reactor Setups—Rotating Biological Disc Contactor (RBDC) and Rotating Electro-Biological Disc Contactor (REBDC)
The treatment experiments were conducted using a laboratory-scale RBDC and REBDC, designed to simulate the operation of a full-scale reactor (Table 2).
Table 2.
Rotating disc contactor parameters.
The system consisted of (Figure 1):
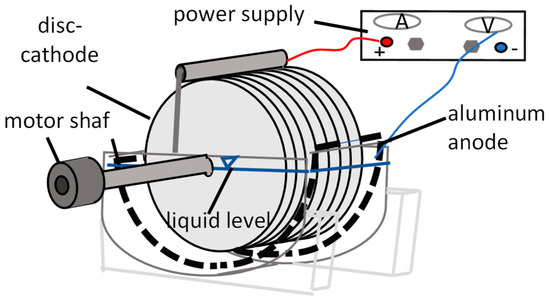
Figure 1.
Scheme of a single-stage REBDC.
- A cylindrical biological tank with a working volume of 2.0 L,
- A horizontal shaft equipped with flat PVC discs (diameter: 22 cm),
- Aluminum plate electrodes mounted on the tank walls, acting as an anode,
- A DC power supply (HANTEK PPS2116A, Qingdao, China) providing adjustable constant current densities ranging from 0 to 10 A/m2.
The rotational speed of the discs was maintained at 10 rpm, ensuring periodic submergence and exposure to air. The hydraulic retention time (HRT) was set at 24 h throughout the study.
2.3. External Carbon Source Dosing
Sodium acetate (CH3COONa, analytical purity, powder, VWR) was selected as the external carbon source because it is readily biodegradable, safe and effective, and provides predictable results in denitrification and other biological processes. It has been used and tested in previous studies by the authors’ [10]. The dosing aimed to achieve C:N ratios of 0.5, 1.0, 2.0, and 3.0 in the influent, was calculated based on TN concentration. The lowest value (0.5), used in the study by Rodziewicz et al. [13], was found to be insufficient for effective nitrate removal in an electro-biological disc reactor. The sodium acetate solution was prepared by dissolving analytical-grade CH3COONa in deionized water and afterwards was introduced into the reactor’s influent using a peristaltic pump which ensured its continuous and stable dosing.
2.4. Operational Parameters
The experiments were conducted at ambient laboratory temperature (22 ± 2 °C). The current density applied to the electrodes was set at 2.5 A/m2, selected based on findings from a previous study [9] to balance nitrogen removal efficiency and energy consumption. The aeration was provided by natural rotation of the discs; no additional air supply was used.
The study was divided into two phases (Table 3):
Table 3.
Technological parameters used in the study.
- Phase I—biological phase; operation of RBDC (without electric current flow), with external carbon source dosing (C:N = 0.5, 1.0, 2.0, and 3.0)
- Phase II—electro-biological phase; operation of REBDC with external carbon source dosing (C:N = 0.5, 1.0, 2.0, and 3.0).
The two-phase study employing RBDC and REBDC under fixed technological parameters enabled determining contribution of individual biological processes (mainly heterotrophic denitrification) in the overall performance of the electro-biological contactor.
Biomass from the denitrification tank of the Olsztyn municipal wastewater treatment plant (20°5876′ E 54°128′ N) was used as the inoculum during the biological phase. After completing analyses in the rotating biological disc contactors (RBDC), which lasted 3.5 months (including biofilm cultivation), the experiments in the electro-biological reactor were initiated. The biofilm cultivation and adaptation period in the electro-biological reactor lasted over 2 months.
The analytical monitoring of the processes, both in the biological and electro-biological phases, commenced after the adaptation period of the reactors. Samples were collected at 24-h intervals during both phases of the study. The results of physicochemical analyses of 25 samples were used to calculate the average values for each phase.
All experiments were conducted under laboratory conditions at a temperature of 20.0 ± 1 °C.
2.5. Analytical Methods
Samples of the influent and the effluent were collected daily and analyzed for the following parameters:
- COD: dichromate method [24],
- TN: persulfate digestion followed by UV-spectrophotometric detection [25],
- N-NO3: ion chromatography [26],
- TP: molybdenum blue spectrophotometric method [27],
- EC: conductometric method [28].
Content of total nitrogen was determined using a Total Organic Carbon Analyzer TOC-L CPH/CPN with TNM-L device (Shimadzu Corporation, Kyoto, Japan), with a method of oxidative combustion—chemiluminescence, content of total phosphorus using a UV-VIS 5000 DR spectrophotometer (HACH Lange, Duesseldorf, Germany), with an HACH Lange LCK 348–350 method, nitrate nitrogen using a VWR UV-3100PC Spectrophotometer (VWR International, Shanghai, China), with a colorimetric method and chemical oxygen demand (COD; titrimetric method), using a Gerhardt KI 16 (Königswinter, Germany) laboratory heater—with a dichromate method. Analytical control of the sewage treatment process also included measurements of pH value, electrolytic conductivity, and temperature using an HQ4300 multimeter (HACH Company, Loveland, CO, USA).
Ammonium nitrogen (N-NH4; HACH Lange LCK303- 305) and nitrite (N-NO2; HACH Lange LCK341-342) levels were determined using a DR5000 HACH Lange Spectrophotometer (Malente, Germany).
All analyses were performed in accordance with Polish Standards (PN) or ISO methods [24,25,26,27,28]. Each measurement was conducted in triplicate to ensure analytical accuracy.
The research results obtained were subjected to statistical analysis in order to organize the data and assess the nature of their distribution. In the first phase, the arithmetic mean was calculated as a measure of the tendency, which allows the average level of the analyzed characteristic to be determined. The standard deviation was then calculated to assess the degree of variability of the results and their dispersion around the mean.
3. Results and Discussion
3.1. pH
The low pH of the raw wastewater (5.75) was due to the pH of the nutrient solution supplied to the cultivated crops, which in turn resulted from the fact that the highest availability of most nutrients in hydroponic cultivation occurs at a pH range of 5.5–5.8 [1].
During the study, the pH of the effluent from both reactors increased as a result of the treatment processes (Figure 2). A similar upward trend in pH was noted in both reactors as the doses of sodium acetate and the C/N ratio increased. Simultaneously, in the electro-biological reactor, the pH values were lower (ranging from 7.59 to 9.39) than those recorded in the biological reactor (ranging from 8.50 to 9.48).
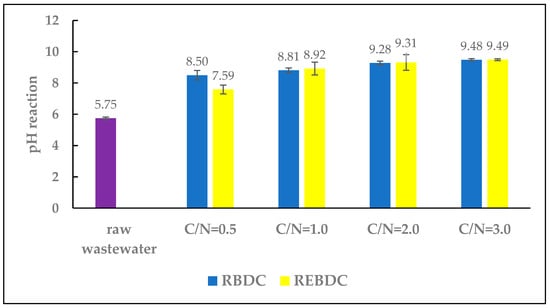
Figure 2.
The effect of the C/N ratio on effluent pH.
The alkaline pH of the effluent from RBDC and REBDC was primarily due to the pH of the sodium acetate (strongly alkaline) added to the influent fed to both types of reactors. The differences in pH levels between the reactors stemmed from the processes occurring therein. The pH increase in the biological reactor was a consequence of heterotrophic denitrification, as the removal of one mole of NO3− results in the formation of one mole of OH−, which increases pH and can simultaneously cause nitrite accumulation and reduce the nitrate removal rate. Additionally, the pH increase during denitrification is due to the reaction converting nitrite to nitrogen gas [29,30,31].
In the electro-biological reactor, the pH increase results from concurrent processes: water electrolysis (producing OH− ions), hydrogenotrophic denitrification, and heterotrophic denitrification (further increasing OH− concentration). In contrast, lower pH values in this reactor are due to hydrogen gas evolution on the cathode surface during water electrolysis, accompanied by the release of H+ ions, leading to a pH decrease. In turn, the pH increase from hydrogen evolution is more or less compensated by the reactions releasing H+ ions [32,33].
pH is one of the main factors influencing the denitrification process. Controlling pH values can effectively enhance nitrate (V) removal efficiency. Uncontrolled or fluctuating pH can lead to partial denitrification and accumulation of nitrite (III) [34]. However, different denitrifying bacterial cultures have various optimal pH ranges. Rezania et al. [35] studied the effect of pH in the range of 7.5–9.5 on auto-hydrogenotrophic denitrification of nitrogen-contaminated water and achieved maximum removal rates at pH = 9.5. Conversely, Kurt et al. [36] found the highest denitrification rates at pH = 7.5.
It should be noted that, in addition to the denitrification process which contributes to pH increase, the use of BERs for denitrification also raises alkalinity since water electrolysis and pH control become more complex. The production of 1 mole of H2 results in the formation of 2 moles of OH−. Moreover, during denitrification, the removal of one mole of NO3− forms one mole of OH−, increasing pH, which leads to nitrite (III) accumulation and reduces nitrate (V) removal rates. The pH increase during denitrification is also due to the half-reaction converting nitrite (III) to nitrogen gas [29,30].
3.2. The Electrical Conductivity (EC)
The electrical conductivity, expressed in mS/cm, is an indicator of nutrient concentration in the nutrient solution. Average EC values for hydroponic solutions range from 1.5 to 4.5 mS/cm [1]. During the study, the EC of the raw wastewater was slightly higher, reaching 4.89 mS/cm (Figure 3).
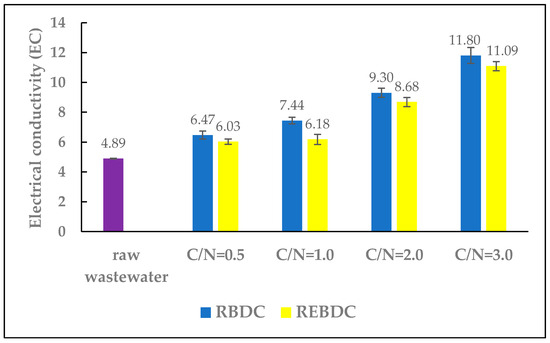
Figure 3.
The effect of the C/N ratio on the electrical conductivity (EC) of the effluent.
In reactors of both types, the EC values increased with the amount of carbon supplied. In the RBDC reactor, EC increased from 4.89 to 6.47, 7.44, 9.3, and 11.80 mS/cm for C/N ratios of 0.5, 1.0, 2.0, and 3.0, respectively. In the REBDC reactor, the EC values were lower than in the biological reactor, ranging from 6.03 to 11.09 mS/cm.
The observed increase in EC values in the effluents from both reactors was primarily due to the addition of sodium acetate, a strong electrolyte with considerable conductivity, and the simultaneous removal of nitrates via heterotrophic denitrification, hydrogenotrophic denitrification, and electrochemical nitrate reduction. This finding corroborates results from a previous research by Huang et al. [37,38], who found that nitrogen removal decreased solution conductivity. The presence of carbon and nitrates in the treated wastewater leads to an intense electric current flow through the bio-electrochemical reactor (BER) [37]. Organic compounds in BER are consumed by microorganisms during heterotrophic degradation or for electron production at the anode, thereby increasing current intensity [37]. Nitrogen removal reduces solution’s conductivity, whereas the breakdown of organic substances by microorganisms at the anode generates electrons, increasing the current flow in the reactor [39]. Lower EC values in the effluent of electro-biological reactors are most likely due to higher nitrogen removal efficiency in these reactors and the lower concentration of nitrogen in the wastewater.
The magnitude of EC increase was a consequence of the C/N ratio, with the highest EC values in the reactors observed at C/N = 3.0. Lower EC values were noted in the electro-biological reactor, which resulted from higher nitrogen removal efficiency in this reactor (Figure 4). These findings align with observations made by Huang et al. [37,38], who demonstrated that nitrogen removal decreased solution’s conductivity. The presence of carbon and nitrates in the effluent leads to a significant increase in electric current flow through the electro-biological reactor, which could be caused by the addition of electrolytes that increase solution’s conductivity. Nitrogen removal reduces conductivity, and vice versa—the degradation of organic substances by microorganisms at the anode generates electrons, increasing the current flow in the reactor [37,38].
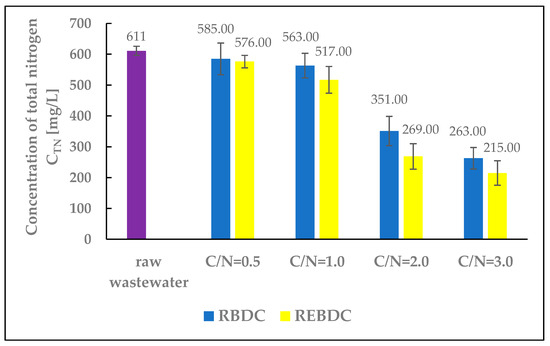
Figure 4.
The effect of the C/N ratio on the concentration of total nitrogen (TN) in the effluent.
3.3. Total Phosphorus (TP)
The total phosphorus concentration in the influent wastewater fed to the reactors was 57.75 mg P/L. The research results showed a distinct difference in phosphorus removal efficiency between the biological and electro-biological reactors. Phosphorus concentrations in the effluent from the REBDC reactor ranged from 0.19 to 9.69 mg P/L, whereas in the biological reactor, the respective values were significantly higher, ranging from 16.61 to 45.25 mg P/L (Figure 5). In the biological reactor, phosphorus removal was primarily associated with biofilm development. Achieving high phosphorus removal efficiencies in biological rotating contactors remains a challenge for engineers and operators due to the difficulty in controlling the sequential aerobic and anaerobic conditions required for the growth and accumulation of polyphosphate-accumulating organisms (PAOs). However, it cannot be definitively stated that phosphate binding and release processes did not occur within the biofilm, given the high share of anaerobic biofilm in the biomass colonizing the discs, especially under high organic compound loads, which was the case at C/N ratios of 2.0 and 3.0. The thickness of the biofilm influences phosphorus removal efficiency, with the maximum efficiency of up to 70% achieved at biofilm thickness lesser than 1.8 mm [40,41,42].
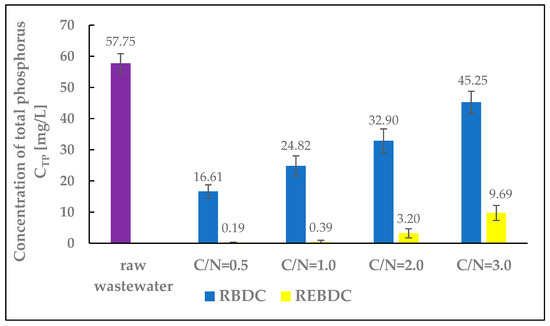
Figure 5.
The effect of the C/N ratio on the concentration of total phosphorus (TP) in the effluent.
The decrease in phosphorus removal efficiency noted in the reactors at high C/N values results from the fact that high concentrations of organic substrates in the biofilm promote the colonization by glycogen-accumulation microorganisms (GAOs, which do not accumulate phosphorus) that may outcompete PAOs, leading to reduced phosphorus removal efficiency [41].
In the electro-biological reactor, phosphorus removal efficiencies exceeding 90% were achieved at C/N ratios of 0.5, 1.0, and 2.0, whereas over 83% efficiency was noted at C/N = 3.0. These results are due to two processes: phosphorus uptake during biofilm biomass growth and, primarily, electrocoagulation. Similarly high phosphorus removal efficiencies in electro-biological reactors have been reported by Rodziewicz et al. [43], Lagum [44], and Hackbarth et al. [45]. All cited researchers highlighted the significantly higher phosphorus removal efficiencies in electrochemical and electro-biological reactors compared to the biological reactors, where phosphorus removal primarily resulted from phosphorus incorporation into biofilm biomass, as well as phosphate release and accumulation processes.
At the same time, the observed trend indicated that increasing substrate availability in the REBDC reactor led to a decrease in phosphorus removal efficiency and an increase in phosphorus concentration in the effluent (with the highest efficiency determined at C/N = 0.5 and the lowest one at C/N = 3.0). This is because the increase in available organic substrate can upset the electrochemical balance in the reactor (Figure 5). Higher amounts of substrate mean a larger pool of electron donors, which are primarily utilized by microorganisms, thus diminishing the role of the electrode. Additionally, excess carbon sources promote faster and more intense biofilm growth. Biofilm thickness affects oxygen and electron diffusion, which can suppress PAOs bacterial activity and diminish phosphorus accumulation in the biofilm biomass. High concentrations of organic substrates may also promote the growth of GAO bacteria (not accumulating phosphorus), which compete with PAOs for organic substrates [46].
3.4. Total Nitrogen (TN)
The efficiency of total nitrogen removal increased with the dose of the organic substrate supplied to reactors of both types (Figure 4). At the lowest substrate dose (C/N = 0.5), TN concentration decreased from 611.0 mg N/L in raw wastewater to 585.0 mg N/L in the effluent from the biological reactor and 576.0 mg N/L in that from the electro-biological reactor, indicating denitrification efficiency below 6.0% (4.1% and 5.7%, respectively). At the highest substrate dose (C/N = 3.0), the TN concentration was 263.0 mg N/L in the effluent from RBDC (56.7% efficiency) and 215.0 mg N/L in that from REBDC (64.8% efficiency). The research results show a significant, multi-fold increase in nitrogen removal efficiency at C/N = 2.0 and C/N = 3.0 compared to C/N = 0.5. In the electro-biological reactor, the efficiency at C/N = 2.0 was more than 9 times higher, and at C/N = 3.0 over 11 times higher. This proves that increasing the amount of organic substrate supplied to both biological and electro-biological reactors to achieve higher nitrogen removal efficiencies (in the case of wastewater from soilless tomato cultivation, primarily nitrates) turned out to be a viable technological solution.
In the biological reactor, nitrogen removal efficiency resulted from heterotrophic denitrification and nitrogen incorporation into biomass. In the electro-biological reactor, nitrate removal efficiency was also influenced by hydrogenotrophic denitrification and electrochemical nitrate reduction due to electric current flow. This is why higher nitrogen removal efficiencies were achieved in the electro-biological reactor, corroborating earlier findings by Rodziewicz et al. [13] and Chen et al. [47].
The effectiveness of all the mentioned processes depends on the pH of the wastewater in the reactor. pH is one of the main factors influencing the denitrification process. For heterotrophic denitrification, the optimal pH is considered to be between 7.0 and 8.0. At pH values below 7.0, N2O and NO concentrations increase, while pH values below 4.0 promote the accumulation of large amounts of nitrite (III), which are toxic to most enzymes. Denitrification halts in strongly acidic and highly alkaline environments, respectively, below pH 4.0 and above pH 9.5 [48,49]. Salem et al. [50] considered the optimal pH range for heterotrophic denitrifiers to be 5.95–7.9. In biological reactors, where pH ranged from 8.5 to 9.5 (Figure 2), the conditions were far from optimal; however, they would rather not inhibit denitrification.
Hydrogenotrophic denitrification is also strongly dependent on pH. The optimal values are considered to be between 7.6 and 8.6 [9,47]. Nevertheless, different denitrifying bacteria cultures have various optimal pH ranges. Rezania et al. [35] studied the influence of pH in the range of 7.5–9.5 on auto-hydrogenotrophic denitrification of nitrogen-contaminated water and achieved maximum removal rates at pH = 9.5, whereas Kurt et al. [36] found the highest denitrification rates at pH = 7.5. It should be noted that in addition to denitrification, which causes pH to rise, a characteristic feature of electro-biological reactors is an increase in alkalinity, leading to nitrite accumulation and a decrease in the nitrate removal rate [29,30]. Nitrites are also by-products of electrochemical nitrate reduction [39,51].
3.5. Nitrites and Ammonium Nitrogen
The research results confirm nitrite accumulation in the treated wastewater (Figure 6). As the amount of organic substrate supplied increased, and with associated changes such as wastewater pH shifts in both reactors, nitrite concentrations in the effluent increased as well. Nitrite concentrations were higher in the effluent from the electro-biological reactor because, generally, the pH value and energy source concentration (H2) depend on the electric current intensity. Water electrolysis in the cathode zone generates H2 and OH−. The OH− concentration increases proportionally to the electric current intensity, which can raise the pH and consequently decrease reactor efficiency. However, the activity of hydrogenotrophic bacteria depends on the concentration of electron donors as denitrification-controlling factors. Complete denitrification was achieved at various H2 concentrations [30]. Lower H2 concentrations were reported to lead to partial denitrification and nitrite accumulation as well as to inhibit biomass growth rates. Due to the low solubility of H2, ensuring an appropriate contact time increases the denitrification rate [32,52]. Such phenomena induced by electric current flow did not occur in the biological reactor; hence, the lower nitrite concentrations in the RBDC effluent.
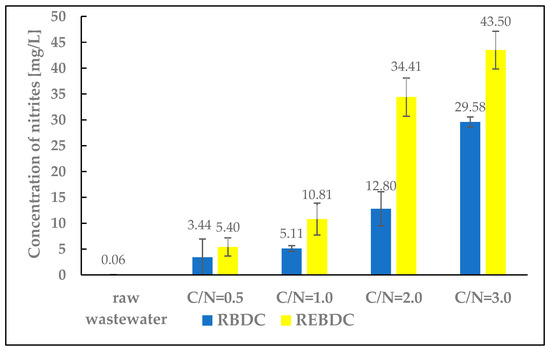
Figure 6.
The effect of the C/N ratio on the concentration of nitrites in the effluent.
Ammonium nitrogen was also present in the effluent from both RBDC and REBDC, but in very low concentrations, ranging from 1.34 to 3.84 mg N-NH4/L. This is most likely the result of one of the two phenomena: electrochemical nitrate reduction at the cathode [53] or dissimilatory nitrate reduction to ammonium nitrogen [54].
3.6. COD
The COD concentration of raw wastewater was 51.0 mg O2/L (Figure 7). It increased after sodium acetate addition in the amounts corresponding to the C/N ratio. The content of organic matter decreased along with the progress of processes in the reactors. The COD of the effluent from the biological reactor ranged from 237.0 to 566.0 mg O2/L at C/N = 0.5 and C/N = 3.0, respectively.
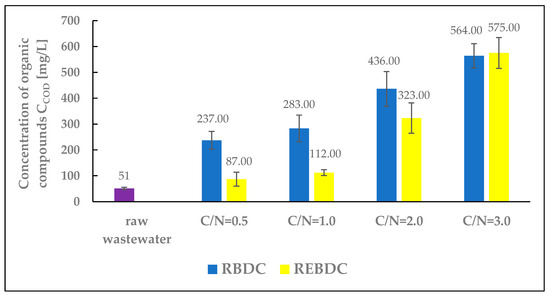
Figure 7.
The effect of the C/N ratio on COD concentration in the effluent.
An increase in the amount of an external carbon source supplied to the RBDC reactor resulted in an increase in the COD of the treated wastewater compared to the COD of the raw influent. These values were more than 4 times higher (at C/N = 0.5) and 11 times higher (at C/N = 3.0) than the COD concentration in the influent. This indicates the inefficient utilization of the supplied organic substrate by heterotrophic microorganisms within the biofilm during its biodegradation and during the heterotrophic denitrification occurring in the deeper layers of the biofilm. For this type of reactor and a hydraulic retention time (HRT) of 24 h, the demand of microorganisms (responsible for biodegradation and heterotrophic denitrification) for a carbon and energy source, such as sodium acetate, was significantly lower than its amount supplied. As a result of denitrification, biomass growth, and biodegradation processes, only a portion of the organic substances was consumed [55].
In the electro-biological reactor, the supplied organic compounds were removed via ongoing physicochemical, biological, and electrochemical processes. Biological degradation occurred as aerobic and anaerobic microorganisms metabolized the supplied organic substrate as a source of carbon and energy, leading to a reduction in COD within the reactor and its increase in the biomass. The flow of electric current through the REBDC reactor enhanced the activity of microorganisms, decomposed organic compounds on the electrodes via electro-oxidation, produced hydroxyl radicals oxidizing organic compounds, and induced electrocoagulation of organic matter. Simultaneously, part of the organic substrate was consumed during heterotrophic denitrification as an electron donor for denitrifying bacteria [56].
The extent of organic compound utilization in the electro-biological reactor was greater than in the biological reactor. At C/N ratios of 0.5, 1.0, and 2.0, the COD concentration in the effluent from this reactor was significantly lower than in that from the biological reactor. At the highest C/N ratio of 3.0, the COD concentrations in the effluent from both reactors were similar, but slightly higher in the effluent from the REBDC reactor. According to Hao et al. [57], the presence of both heterotrophic and autotrophic bacteria responsible for nitrate removal in the electro-biological reactor depends on the C/N ratio. Similar conclusions were drawn by Lin et al. [58]. Meanwhile, Tong et al. [59] observed an increase in organic matter concentration, expressed as COD, in the effluent from the electro-biological reactor at higher C/N ratios. This increase could be due to autotrophic denitrifying bacteria consuming part of the nitrates during electric current flow, resulting in lower organic carbon consumption [60].
In the REBDC reactor with C/N = 0.5, the COD concentration in the treated wastewater was 36 mg O2/L higher than in the raw influent (87 and 51 mg O2/L, respectively), indicating a significant, though not complete, utilization of the external carbon source. Its complete utilization was observed in the study by Rodziewicz et al. [13]. To achieve complete utilization of the external carbon source at current density applied, a rational solution would be to extend the wastewater retention time, which would additionally enable higher nitrogen removal efficiency and lower pollutant concentrations in the effluent.
However, it should be noted that for both C/N values (0.5 and 1.0), the nitrogen removal efficiency was low and did not exceed a few or several percent, respectively, in the first and second case (Figure 5). Only at C/N = 2.0 did the REBDC reactor achieve an efficiency above 50% (56.0%), and at C/N = 3.0 over 65%. Nevertheless, significant amounts of unused organic carbon were determined in the effluent from the reactors. The COD to TN ratio (COD/N), calculated based on final concentrations of organic compounds and nitrogen, was 0.23, 0.50, 1.24, and 2.07 for the RBDC reactor, and 0.15, 0.21, 1.20, and 2.67 for the REBDC reactor, respectively. In the case of the first two C/N values (0.5 and 1.0), we can speak of significant and much more efficient carbon utilization in the electro-biological reactor. For the remaining sodium acetate doses (C/N = 2.0 and C/N = 3.0), it is clearly evident that the external carbon source was utilized inefficiently in both reactors, and that the discharged wastewater had high concentrations of not only nitrogen compounds but also carbon compounds, indicating the need for further treatment.
It may be undoubtedly concluded that achieving higher nitrogen removal efficiency combined with more effective utilization of the external carbon source in the reactors discussed in this publication is feasible. However, a more reasonable approach would be to conduct research using an electro-biological reactor that ensures higher efficiency of nutrient removal. Taking into account the results from a previous study [13], the primary factor to be considered should be the extension of the wastewater retention time [55], rather than increasing the current density (due to operating and investment costs) [43]. The future research should focus on C/N ratios of 2.0 and 3.0 because they are expected to ensure the highest nitrogen removal efficiency and, simultaneously, a high phosphorus removal efficiency. This is most likely to be the case with REBDC at a C/N value of 2.0. The aim of the future studies would be to determine the impact of extending the HRT compared to 24 h on the efficiency of nitrogen removal and the utilization of the external carbon source.
4. Conclusions
- Phosphorus removal efficiency in the biological reactor was significantly lower than in the electrobiological reactor because phosphorus removal in the biological reactor was primarily associated with biofilm formation, a process of low efficiency.
- Phosphorus removal efficiencies above 90% were obtained in the electro-biological reactor at C/N ratios of 0.5, 1.0, and 2.0. At C/N = 3.0, the efficiency exceeded 83%. This reactor performance resulted from two mechanisms: phosphorus uptake linked to biofilm biomass growth and, more importantly, electrocoagulation.
- High C/N ratios reduced phosphorus removal efficiency because elevated organic substrate levels in the biofilm promoted the growth of GAOs, which outcompeted PAOs.
- The efficiency of total nitrogen (TN) removal increased with the dose of organic substrate fed to reactors of both types. In the electrobiological reactor, the TN removal efficiency was more than 9 times higher at C/N = 2.0 and more than 11 times higher at C/N = 3.0 compared to the values obtained at C/N = 0.5.
- At the highest substrate dose (C/N = 3.0), the TN concentration was 263.0 mg N/L in the effluent from RBDC (56.7% TN removal efficiency) and 215.0 mg N/L in that from REBDC (64.8% efficiency).
- The higher nitrogen removal rates were achieved in the electrobiological reactor, as nitrogen removal in the biological reactor was achieved upon heterotrophic denitrification and nitrogen incorporation into the biomass. In the electrobiological reactor, the efficiency of nitrogen removal was also influenced by hydrogenotrophic denitrification and electrochemical nitrate reduction due to the electric current flow.
- The extent of organic compound utilization in the electro-biological reactor was higher than in the biological reactor.
- In the reactor operated at a C/N = 0.5, the COD concentration in the effluent (87 mg O2/L) exceeded that in the influent (51 mg O2/L), indicating substantial, though incomplete, utilization of the external carbon source.
- At C/N ratios of 0.5 and 1.0, nitrogen removal efficiencies remained very low, not exceeding dozen percent. A tangible improvement was observed only at C/N = 2.0, where the REBDC reactor reached 56.0%, and at C/N = 3.0, where the efficiency exceeded 65%. Despite this enhancement, considerable residual organic carbon persisted in the effluent.
- To enhance nitrogen removal in the electrobiological reactor while ensuring more efficient utilization of the external carbon source, the technological approach should involve either extending the hydraulic retention time or implementing a multi-stage REBDC system. Further research should be carried out in this respect.
Author Contributions
Conceptualization, J.R. and W.J.; methodology, K.B. and A.M.; validation, A.M. and M.K.; formal analysis, J.R. and K.B.; data curation, K.B. and J.R.; writing—original draft preparation, W.J.; writing—review and editing, A.M. and M.K.; supervision, W.J. All authors have read and agreed to the published version of the manuscript.
Funding
This research was funded in the framework of a Project No. 29.610.023-300 of the University of Warmia and Mazury in Olsztyn, Poland.
Data Availability Statement
The data presented in this study are available in the article.
Conflicts of Interest
Author Kamil Bryszewski was employed by the company Hanna Instruments Sp. z.o.o., Al. J. Piłsudskiego St. 73, 10-449 Olsztyn, Poland. The remaining authors declare that the research was conducted in the absence of any commercial or financial relationships that could be construed as a potential conflict of interest.
Abbreviations
The following abbreviations are used in this manuscript:
| BER | Bio-electrochemical reactor |
| REBDC | Rotating electro-biological disc contactor |
| RBDC | Rotating biological disc contactor |
| BDPs | Biodegradable polymers |
| HRT | Hydraulic retention time |
| TN | Total nitrogen |
| TP | Total phosphorus |
| DOC | Dissolved organic carbon |
| EC | Electrical conductivity |
| PAOs | Polyphosphate-accumulating organisms |
| GAOs | Glycogen-accumulating organisms |
References
- Mielcarek, A.; Rodziewicz, J.; Janczukowicz, W.; Dobrowolski, A. Analysis of wastewater generated in greenhouse soilless tomato cultivation in central Europe. Water 2019, 11, 2538. [Google Scholar] [CrossRef]
- van der Salm, C.; Voogt, W.; Beerling, E.; van Ruijven, J.; van Os, E. Minimising emissions to water bodies from NW European greenhouses; with focus on Dutch vegetable cultivation. Agric. Water Manag. 2020, 242, 106398. [Google Scholar] [CrossRef]
- Regulation of the Minister of Maritime Economy and Inland Navigation of July 12, 2019 on Substances Particularly Harmful to the Aquatic Environment and Conditions to Be Met When Introducing Sewage into Waters or into the Ground, as Well as When Discharging Rainwater or Snowmelt into Waters or into Water Equipment. Dz. U. (J. Laws) 2019, 1311. Available online: https://isap.sejm.gov.pl/isap.nsf/DocDetails.xsp?id=WDU20190001311 (accessed on 23 September 2025). (In Polish)
- Du, J.; Xu, B.; Ma, L.; Jiao, H.; Tian, B.; Li, K.; Lian, J. Study on denitrification of hydroponic wastewater reverse osmosis concentrate using sulfur-autotrophic denitrification. J. Environ. Chem. Eng. 2023, 11, 111195. [Google Scholar] [CrossRef]
- Kwon, M.J.; Hwang, Y.; Lee, J.; Ham, B.; Rahman, A.; Azam, H.; Yang, J.-S. Waste nutrient solutions from full-scale open hydroponic cultivation: Dynamics of effluent quality and removal of nitrogen and phosphorus using a pilot-scale sequencing batch reactor. J. Environ. Manag. 2021, 281, 111893. [Google Scholar] [CrossRef] [PubMed]
- Gu, X.; Leng, J.; Zhu, J.; Zhang, K.; Zhao, J.; Wu, P.; Xing, Q.; Tang, K.; Li, X.; Hu, B. Influence mechanism of C/N ratio on heterotrophic nitrification- aerobic denitrification process. Bioresour. Technol. 2022, 343, 126116. [Google Scholar] [CrossRef]
- Zhao, B.; Sun, Z.; Liu, Y. An overview of in-situ remediation for nitrate in groundwater. Sci. Total Environ. 2022, 804, 149981. [Google Scholar] [CrossRef]
- Henze, M.; Harremoës, P.; Jes La Cour, J.; Arvin, E. Wastewater Treatment. Biological and Chemical Processes; Kielce University of Technology Publishing House: Kielce, Poland, 2002. (In Polish) [Google Scholar]
- Lee, K.C.; Rittmann, B.E. Effects of pH and precipitation on autohydrogenotrophic denitrification using the hollow-fiber membrane-biofilm reactor. Water Res. 2003, 37, 1551–1556. [Google Scholar] [CrossRef]
- Mansell, B.O.; Schroeder, E.D. Hydrogenotrophic denitrification in a microporous membrane bioreactor. Water Res. 2002, 36, 4683–4690. [Google Scholar] [CrossRef]
- Peng, Y.-Z.; Ma, Y.; Wang, S.-Y. Denitrification potential enhancement by addition of external carbon sources in a pre-denitrification process. J. Environ. Sci. 2007, 19, 284–289. [Google Scholar] [CrossRef] [PubMed]
- Chen, H.B.; Wang, D.B.; Li, X.M.; Yang, Q.; Zeng, G.M. Enhancement of post-anoxic denitrificationfor biological nutrient removal: Effect of different carbon sources. Environ. Sci. Pollut. Res. 2015, 22, 5887–5894. [Google Scholar] [CrossRef]
- Rodziewicz, J.; Mielcarek, A.; Janczukowicz, W.; Jóźwiak, T.; Struk–Sokołowska, J.; Bryszewski, K. The share of electrochemical reduction, hydrogenotrophic and heterotrophic denitrification in nitrogen removal in rotating electrobiological contactor (REBC) treating wastewater from soilless cultivation systems. Sci. Total Environ. 2019, 683, 21–28. [Google Scholar] [CrossRef] [PubMed]
- Mielcarek, A.; Rodziewicz, J.; Janczukowicz, W.; Dąbrowska, D.; Ciesielski, S.; Thornton, A.; Struk-Sokołowska, J. Citric acid application for denitrification process support in biofilm reactor. Chemosphere 2017, 171, 512–519. [Google Scholar] [CrossRef] [PubMed]
- Lee, D.-U.; Lee, I.-S.; Choi, Y.-D.; Bae, J.-H. Effects of external carbon source and empty bed contact time on simultaneous heterotrophic and sulfur-utilizing autotrophic denitrification. Process Biochem. 2001, 36, 1215–1224. [Google Scholar] [CrossRef]
- Fernández, F.J.; Castro, M.C.; Villasenor, J.; Rodríguez, L. Agro-food wastewaters as external carbon source to enhance biological phosphorus removal. Chem. Eng. J. 2011, 166, 559–567. [Google Scholar] [CrossRef]
- Fu, X.; Hou, R.; Yang, P.; Qian, S.; Feng, Z.; Chen, Z.; Wang, F.; Yuan, R.; Chen, H.; Zhou, B. Application of external carbon source in heterotrophic denitrification of domestic sewage: A review. Sci. Total Environ. 2022, 817, 153061. [Google Scholar] [CrossRef]
- Zhang, Y.; Wang, X.C.; Cheng, Z.; Li, Y.; Tang, J. Effect of fermentation liquid from food waste as a carbon source for enhancing denitrification in wastewater treatment. Chemosphere 2016, 144, 689–696. [Google Scholar] [CrossRef]
- Cui, H.; Feng, Y.; Yin, Z.; Qu, K.; Wang, L.; Li, J.; Jin, T.; Bai, T.; Cui, Z. Organic carbon release, denitrification performance and microbial community of solid-phase denitrification reactors using the blends of agricultural wastes and artificial polymers for the treatment of mariculture wastewater. Ecotoxicol. Environ. Saf. 2023, 255, 114791. [Google Scholar] [CrossRef]
- Liu, D.; Li, J.; Li, C.; Deng, Y.; Zhang, Z.; Ye, Z.; Zhu, S. Poly(butylene succinate)/bamboo powder blends as solid-phase carbon source and biofilm carrier for denitrifying biofilters treating wastewater from recirculating aquaculture system. Sci. Rep. 2018, 8, 3289. [Google Scholar] [CrossRef]
- Yang, X.L.; Jiang, Q.; Song, H.L.; Gu, T.T.; Xia, M.Q. Selection and application of agricultural wastes as solid carbon sources and biofilm carriers in MBR. J. Hazard. Mater. 2015, 283, 186–192. [Google Scholar] [CrossRef]
- Kłobukowska, K.; Rodziewicz, J.; Mielcarek, A.; Bryszewski, K.; Janczukowicz, W.; Bugajski, P.; Jóźwiakowski, K.; Operacz, A. Novel materials as exogenous carbon sources for denitrifying biofilters. Appl. Sci. 2024, 14, 176. [Google Scholar] [CrossRef]
- Krzemieniewski, M.; Rodziewicz, J. Nitrogen compounds removal in a rotating electrobiological contactor. Environ. Eng. Sci. 2005, 22, 816–822. [Google Scholar] [CrossRef]
- PN-ISO 6060:2006; Water Quality—Determination of the Chemical Oxygen Demand. Polish Committee for Standardization: Warsaw, Poland, 2006.
- PN-EN 12260:2005; Water Quality—Determination of Nitrogen—Determination of Bound Nitrogen (TN), Following Oxidation To Nitrogen Oxides. Polish Committee for Standardization: Warsaw, Poland, 2005.
- PN-EN ISO 10304-1:2009; Water Quality—Determination of Dissolved Anions by Liquid Chromatography of Ions—Part 1: Determination of Bromide, Chloride, Fluoride, Nitrate, Nitrite, Phosphate and Sulfate. Polish Committee for Standardization: Warsaw, Poland, 2009.
- PN-EN ISO 6878:2006; Water Quality—Determination of Phosphorus—Ammonium Molybdate Spectrometric Method. Polish Committee for Standardization: Warsaw, Poland, 2006.
- PN-EN 27888:1999; Water Quality—Determination of Electrical Conductivity. Polish Committee for Standardization: Warsaw, Poland, 1999.
- Ghafari, S.; Hasan, M.; Aroua, M.K. Improvement of autohydrogenotrophic nitrite reduction rate through optimization of pH and bicarbonate dose in a batch experiments. J. Biosci. Bioeng. 2009, 107, 275–280. [Google Scholar] [CrossRef] [PubMed]
- Mousavi, S.A.R.; Ibrahim, S.; Aroua, M.K.; Ghafari, S. Development of nitrate elimination by autohydrogenotrophic bacteria in bio-electrochemical reactors—A review. Biochem. Eng. J. 2012, 67, 251–264. [Google Scholar] [CrossRef]
- Di Capua, F.; Pirozzi, F.; Lens, P.N.L.; Esposito, G. Electron donors for autotrophic denitrification. Chem. Eng. J. 2019, 362, 922–937. [Google Scholar] [CrossRef]
- Prosnansky, M.; Sakakibara, Y.; Kuroda, M. High-rate denitrification and SS rejection by biofilm electrode reactor (BER) combined with microfiltration. Water Res. 2002, 36, 4801–4810. [Google Scholar] [CrossRef] [PubMed]
- Rahimi, S.; Modin, O.; Mijakovic, I. Technologies for biological removal and recovery of nitrogen from wastewater. Biotechnol. Adv. 2020, 43, 107570. [Google Scholar] [CrossRef]
- Glass, C.; Silverstein, J. Denitrification kinetics of high nitrate concentration water: pH effect on inhibition and nitrite accumulation. Water Res. 1998, 32, 831–839. [Google Scholar] [CrossRef]
- Rezania, B.; Cicek, N.; Oleszkiewicz, J.A. Kinetics of hydrogen-dependent denitrification under varying pH and temperature conditions. Biotechnol. Bioeng. 2005, 92, 900–906. [Google Scholar] [CrossRef]
- Kurt, M.; Dunn, J.; Bourne, J.R. Biological denitrification of drinking water using autotrophic organisms with H2 in a fluidized-bed biofilm reactor. Biotechnol. Bioeng. 1987, 29, 493–501. [Google Scholar] [CrossRef]
- Huang, B.; Feng, H.; Wang, M.; Li, N.; Cong, Y.; Shen, D. The effect of C/N ratio on nitrogen removal in a bioelectrochemical system. Bioresour. Technol. 2013, 132, 91–98. [Google Scholar] [CrossRef]
- Huang, W.; Gong, B.; Wang, Y.; Lin, Z.; He, L.; Zhou, J.; He, Q. Metagenomic analysis reveals enhanced nutrients removal from low C/N municipal wastewater in a pilot-scale modified AAO system coupling electrolysis. Water Res. 2020, 173, 115530. [Google Scholar] [CrossRef]
- Zhang, L.; Hao, S.; Wang, Y.; Lan, S.; Dou, Q.; Peng, Y. Rapid start-up strategy of partial denitrification and microbially driven mechanism of nitrite accumulation mediated by dissolved organic matter. Bioresour. Technol. 2021, 340, 125663. [Google Scholar] [CrossRef]
- Hassard, F.; Biddle, J.; Cartmell, E.; Jefferson, B.; Tyrrel, S.; Stephenson, T. Rotating biological contactors for wastewater treatment—A review. Process Saf. Environ. 2015, 94, 285–306. [Google Scholar] [CrossRef]
- Mahto, K.U.; Das, S. Bacterial biofilm and extracellular polymeric substances in the moving bed biofilm reactor for wastewater treatment: A review. Bioresour. Technol. 2022, 345, 126476. [Google Scholar] [CrossRef]
- Gaspar, E.; Munteanu, I.; Sintea, S. Removal of N and P in a Rotating Biological Contactor Plant: Case Study Agnita, Romania. Water 2022, 14, 3670. [Google Scholar] [CrossRef]
- Rodziewicz, J.; Mielcarek, A.; Bryszewski, K.; Janczukowicz, W.; Kłobukowska, K. Energy consumption for nutrient removal from high-nitrate and high-phosphorus wastewater in aerobic and anaerobic bioelectrochemical reactors. Energies 2022, 15, 7251. [Google Scholar] [CrossRef]
- Lagum, A.A. Integrating electrochemical and biological phosphorus removal processes via electrokinetic-based technology. J. Environ. Chem. Eng. 2021, 9, 106609. [Google Scholar] [CrossRef]
- Hackbarth, M.; Gescher, J.; Horn, H.; Reiner, J.E. A scalable, rotating disc bioelectrochemical reactor (RDBER) suitable for the cultivation of both cathodic and anodic biofilms. Bioresour. Technol. Rep. 2023, 21, 101357. [Google Scholar] [CrossRef]
- Rittmann, B.E.; McCarty, P.L. Environmental Biotechnology: Principles and Applications; McGraw-Hill Education: New York, NY, USA, 2020. [Google Scholar]
- Chen, Y.Z.; Zhang, L.J.; Ding, L.Y.; Zhang, Y.Y.; Wang, X.S.; Qiao, X.J.; Pan, B.Z.; Wang, Z.W.; Xu, N.; Tao, H.C. Sustainable treatment of nitrate-containing wastewater by an autotrophic hydrogen-oxidizing bacterium. Environ. Sci. Ecotechnol. 2022, 9, 100146. [Google Scholar] [CrossRef] [PubMed]
- Pan, Y.; She, D.; Shi, Z.; Cao, T.; Xia, Y.; Shan, J. Salinity and high pH reduce denitrification rates by inhibiting denitrifying gene abundance in a saline-alkali soil. Sci. Rep. 2023, 13, 2155. [Google Scholar] [CrossRef]
- González, V.L.; Dombrowski, P.M.; Lee, M.D.; Ramsburg, C.A. The Influence of pH on Subsurface Denitrification Stimulated with Emulsified Vegetable Oil. Water 2023, 15, 883. [Google Scholar] [CrossRef]
- Salem, Z.; Lebik, H.; Cherafa, W.K.; Allia, K. Valorisation of olive pits using biological denitrification. Desalination 2007, 204, 72–78. [Google Scholar] [CrossRef]
- Dash, B.P.; Chaudhari, S. Electrochemical denitrification of simulated ground water. Water Res. 2005, 39, 4065–4072. [Google Scholar] [CrossRef]
- Ding, A.; Zheng, P.; Zhang, M.; Zhang, Q. Impacts of electron donor and acceptor on the performance of electrotrophic denitrification. Environ. Sci. Pollut. Res. 2017, 24, 19693–19702. [Google Scholar] [CrossRef]
- Li, M.; Feng, C.P.; Zhang, Z.N.; Lei, X.H.; Chen, R.Z.; Yang, Y.N.; Sugiura, N. Simultaneous reduction of nitrate and oxidation by-products using electrochemical method. J. Hazard. Mater. 2009, 171, 724–730. [Google Scholar] [CrossRef] [PubMed]
- Zhang, J.M.; Feng, C.P.; Hong, S.Q.; Hao, H.L.; Yang, Y.N. Behavior of solid carbon sources for biological denitrification in groundwater remediation. Water Sci. Technol. 2012, 65, 1696–1704. [Google Scholar] [CrossRef] [PubMed]
- Metcalf & Eddy, Inc. Wastewater Engineering: Treatment and Resource Recovery, 5th ed.; McGraw Hill: New York, NY, USA, 2014. [Google Scholar]
- Sanjrani Manzoor Ahmed, B.Z.; Rind, S.; Rani, K. Systematic review: External carbon source for biological denitrification for wastewater. Biotechnol. Bioeng. 2023, 120, 642–658. [Google Scholar] [CrossRef] [PubMed]
- Hao, R.X.; Li, S.M.; Li, J.B.; Meng, C.C. Denitrification of simulated municipal wastewater treatment plant effluent using a three-dimensional biofilm-electrode reactor: Operating performance and bacterial community. Bioresour. Technol. 2013, 143, 178–186. [Google Scholar] [CrossRef]
- Lin, X.; Yin, H.; Wang, L.; Chen, Y.; Zhao, F.; Pu, Y.; Tang, X. Study of a three-dimensional biofilm-electrode reactor (3D-BER) that combined heterotrophic and autotrophic denitrification (HAD) to remove nitrate from water. RSC Adv. 2023, 21, 14675–14684. [Google Scholar] [CrossRef]
- Tong, S.; Zhang, B.; Feng, C.; Zhao, Y.; Chen, N.; Hao, C.; Pu, J.; Zhao, L. Characteristics of heterotrophic/biofilm-electrode autotrophic denitrification for nitrate removal from groundwater. Bioresour. Technol. 2013, 148, 121–127. [Google Scholar] [CrossRef]
- Wu, L.; Wei, W.; Xu, J.; Chen, X.; Liu, Y.; Peng, L.; Wang, D.; Ni, B.-J. Denitrifying biofilm processes for wastewater treatment: Developments and perspective. Environ. Sci. Water Res. Technol. 2021, 7, 40–67. [Google Scholar] [CrossRef]


Disclaimer/Publisher’s Note: The statements, opinions and data contained in all publications are solely those of the individual author(s) and contributor(s) and not of MDPI and/or the editor(s). MDPI and/or the editor(s) disclaim responsibility for any injury to people or property resulting from any ideas, methods, instructions or products referred to in the content. |
© 2025 by the authors. Licensee MDPI, Basel, Switzerland. This article is an open access article distributed under the terms and conditions of the Creative Commons Attribution (CC BY) license (https://creativecommons.org/licenses/by/4.0/).