Article

Analysis of Trace Rare Earth Elements in Uranium-Bearing Nuclear Materials

1
Beijing Engineering Research Center of Radiographic Techniques and Equipment, Institute of High Energy Physics, Chinese Academy of Sciences, Beijing 100049, China
2
School of Nuclear Science and Technology, University of Chinese Academy of Sciences, Beijing 100049, China
3
State Nuclear Security Technology Center, Beijing 102401, China
*
Authors to whom correspondence should be addressed.
Processes 2025, 13(10), 3089; https://doi.org/10.3390/pr13103089
Submission received: 12 August 2025 / Revised: 13 September 2025 / Accepted: 18 September 2025 / Published: 26 September 2025
(This article belongs to the Section Materials Processes)

Abstract

Rare earth elements (REEs) have significant application value in the quality control of nuclear materials and in traceability research in nuclear forensics. Methods were developed for the determination of REEs in uranium-bearing nuclear materials. The digestion parameters for uranium oxides and uranium ores, such as the digestion acid, digestion temperature, and digestion time, were optimized and reported. The optimized digestion parameters for uranium oxides were 2 mL HNO3 at 160 °C for 3 h, and those for uranium ores were 7 mL mixed acid (HNO3–HClO4–HF = 5:5:3) at 180 °C for 36 h. Two digestion methods were demonstrated to be effective for the quantitative recovery of REEs. The suitable system and specifications for different resin columns were investigated to achieve a high decontamination factor of U (105) by UTEVA resin. The corresponding loading system was 10 mL 4 M HNO3, and the elution system was 6 mL 4 M HNO3. Additionally, the analysis of ultra-trace REEs in high-uranium matrices was accomplished using two UTEVA resins. The developed methods were subjected to the Cochran test and the Grubbs test, and the relative standard deviation (RSD) for all REEs was below 6%. In uranium oxide samples with different spiked amounts, the recovery of REEs exceeded 80% in all cases, and the RSDs were all less than 10%. The method’s detection limits were below 10 ppt for all REEs (except for Ce), ensuring the accurate measurement of REEs in uranium-bearing nuclear materials.

Graphical Abstract

1. Introduction

Rare earth elements (REEs) comprise lanthanides, as well as scandium (Sc) and yttrium (Y). REEs exhibit similar chemical properties and commonly occur in compounds as stable trivalent ions. This stability ensures that, excluding Ce and Eu, all REEs can function as a coherent group during geological or industrial processes [1]. Due to the similarity in ionic radius between REE ions and U4+, REEs can easily substitute for uranium [2,3,4]. Additionally, some lanthanides can be utilized as additives in nuclear fuel or as byproducts of nuclear fuel fission. For instance, Sm, Er, Gd, and Dy can act as soluble neutron poisons to regulate the reactivity of nuclear fuel [5,6]. Isotopes of Nd, Tb, and Pm can be used to determine the fuel state, which is dependent on the fuel and neutron energy spectrum [7,8]. Consequently, the patterns of REEs in uranium-bearing materials can provide significant insights for nuclear forensics [9]. The development of analytical methods for REEs in various uranium-bearing materials can enhance our ability to identify unknown nuclear materials and provide valuable support for traceability research in nuclear forensics.
In order to accurately measure the content of REEs in uranium-bearing materials, it is essential to completely dissolve the samples. Acid digestion, which converts samples into an acidic solution, is currently the simplest and most feasible method for sample analysis [10]. However, the existing states of related elements vary greatly in different samples. Therefore, it is crucial to confirm the appropriate pretreatment solution based on the specific conditions of the elements being analyzed. The primary methods for REE analysis include X-ray fluorescence [11], atomic absorption spectrometry [12], neutron activation analysis [13], inductively coupled plasma optical emission spectrometry [14,15,16], and inductively coupled plasma mass spectrometry (ICP-MS) [17,18]. ICP-MS is widely utilized for the analysis of REEs due to its low detection limits and high measurement accuracy. It is also characterized by low sample consumption, high sample throughput, and a broad dynamic linear range [17,19].
However, the presence of a substantial uranium matrix has an adverse impact on the accurate measurement of REEs [6]. The background value associated with matrix effects can suppress measurement signals, resulting in significant uranium contamination in mass spectrometry equipment. Furthermore, the memory effect may compromise the accuracy and precision of subsequent sample analysis. Separating REEs from the uranium matrix is an effective strategy to mitigate mass spectrum interference and matrix effects [18,20,21,22,23]. It not only concentrates the analytes but also prevents instrument contamination. The current prevalent separation technologies include solvent extraction [24], ion exchange chromatography [25], and solid-phase extraction chromatography [26,27]. Among these, solid-phase extraction chromatography has been widely utilized [6,26,27]. Since each element exhibits distinct chemical behavior during chromatographic separation, it is essential to develop appropriate separation methods for specific research objectives.
This study established a method for the separation and analysis of trace REEs within a high-uranium matrix, applicable to various types of uranium-bearing nuclear materials. By optimizing the digestion conditions, we achieved the effective dissolution of uranium-bearing nuclear materials. Furthermore, through the optimization of the separation procedures, we achieved the high recovery of REEs while effectively removing the uranium matrix.

2. Materials and Methods

2.1. Reagents and Samples

Ultrapure water (>18 MΩ·cm) was obtained from a Milli-Q reference water purification system (Merck Millipore, Darmstadt, Germany). HCl, HF and HNO3 were obtained from Beijing Institute of Chemical Reagents Co., Ltd. (Beijing, China). HClO4 was obtained from Tianjin Dongfang Chemical Factory, (Tianjin, China). HCl and HF were MOS-grade, while HNO3 was BV-III-grade, and HClO4 was of guaranteed reagent grade. The 10 mg/kg REE standard solution (GBW(E)082428) was obtained from the National Institute of Metrology of China (Beijing, China). A single In standard solution (100 µg/mL, GSB 04-1731-2004) and Re standard solution (1000 µg/mL, GSB 04-1745-2004) were used in this study, and they were purchased from General Research Institute for Nonferrous Metals (Beijing, China). The 1000 µg/mL uranium standard solution was obtained from MackLin (Shanghai, China). UTEVA resin (normal, 100–150 um) and TRU resin (normal, 100–150 um) were purchased from Triskem International (Bruz, France). The AG1-X8 anion exchange resin (Cl form, 100–200 mesh) was purchased from Bio-Rad Laboratories, Inc. (Hercules, CA, USA).

2.2. Analysis Procedures for Uranium Oxides and Uranium Ore

As shown in Figure 1, 30 mg of UO2 or U3O8 and 10 µL of REE solution (approximately 100 ng of REEs) were placed in a PFA vessel. Subsequently, 2 mL of concentrated HNO3 was added, and the vessel was heated at 160 °C for 3 h. After digestion, the solutions were evaporated to dryness and reconstituted with 4 M HNO3 for UTEVA purification. Then, 2 mL UTEVA resin was preconditioned with ultrapure water and 4 M HNO3. The sample solution was then loaded onto the column at a flow rate of approximately 1 mL/min and the resin was eluted with 4 M HNO3. The sample solution and eluent were combined, diluted with ultrapure water, and prepared for ICP-MS measurement.
Given the relatively low concentrations of certain REEs in uranium ore samples, 50 mg samples were selected for analysis. Here, 50 mg uranium ore samples were digested with a mixed acid solution (2.69 mL HNO3 + 2.69 mL HClO4 + 1.62 mL HF) at 180 °C for 36 h. After digestion, the solutions were evaporated to near-dryness and subsequently reconstituted in 2 mL of concentrated HNO3. The residue was dissolved in 2 mL 6 M HCl and then evaporated to dryness at 120 °C. Finally, the samples were reconstituted in 2% HNO3 for ICP-MS measurement. In uranium ore analysis, the uranium matrix and silicon matrix represent the primary factors influencing the measurement accuracy. The silicon matrix can be effectively eliminated through digestion and acid evaporation steps, while residual matrix elements (including uranium) no longer interfere with REE measurements following sample dilution. Therefore, our analysis of uranium ores does not require a chemical separation step.

2.3. Instrumentation

The REEs in samples were analyzed using ICP-MS (Thermo Elemental X7, Hillsboro, OR, USA) in standard mode. Instrument optimization and short-term stability tests were performed using a multi-element tuning solution (10 ng/mL Li, Co, In, U). Elemental concentrations were quantified using an external standard calibration method. The calibrating standard solution was prepared by diluting the REE standard solution and uranium standard solution with 2% HNO3. Internal standard solutions of 20 ng/mL 115In and 20 ng/mL 185Re were utilized to correct for instrument drift and matrix effects. Typical operating parameters for the measurement of REEs are shown in Table 1. For each REE, one mass number (139La, 140Ce, 141Pr, 146Nd, 147Sm, 153Eu, 157Gd, 159Tb, 163Dy, 165Ho, 166Er, 169Tm, 172Yb, and 175Lu) with no isobaric interference was chosen for the measurement.

3. Results and Discussion

3.1. Optimization of Digestion Conditions

To complete the recovery of REEs from uranium oxide and uranium ore samples, the type of digestion acid was first considered. Figure 2a presents the digestion acid experimental results for UO2, showing significantly higher recovery in the HNO3 group (111.2 ± 5.6%) compared to the HCl group (107.3 ± 3.3%). Figure 2b shows the corresponding results for U3O8 digestion, revealing no significant difference between the HNO3 (92.4 ± 2.4%) and HCl (92.2 ± 3.2%) groups. However, we found that there were undissolved UO2 particles in the HCl group, which was speculated to be related to the stability of U(IV). U(IV) cannot remain stable in HCl due to the absence of oxidizing conditions, thereby limiting the dissolution of UO2 in HCl [28]. Considering the necessity of complete dissolution, 2 mL HNO3 was chosen for the subsequent digestion of uranium oxides. Figure 2c shows the results of uranium ore digestion using different mixed acids (HNO3 + HClO4 + HF). The experimental results demonstrated that increasing the volume of HClO4 significantly improved the recovery efficiency regarding REEs. The optimum ratio of mixed acid was HNO3–HClO4–HF = 5:5:3, and the average recovery of REEs was 88.2 ± 2.4%. White precipitates were observed during the experiment. The highest precipitate yield occurred in the mixed acid group of HNO3–HClO4–HF = 7:1:2, whereas the lowest yield was observed in the HNO3–HClO4–HF = 3:1:2 group. This phenomenon has also been observed in analogous studies. After analysis, Hu et al. [29] found that a similar white precipitate was an insoluble fluoride. Insoluble fluoride precipitates form during sample decomposition when HF is employed. Based on the results, it was proposed that the precipitates were insoluble fluorides, which could coprecipitate REEs [30], resulting in the loss of REEs. The addition of HClO4 effectively inhibits fluoride formation during sample digestion [31,32]. Therefore, 7 mL of mixed acid at a ratio of HNO3–HClO4–HF = 5:5:3 was chosen for the digestion of uranium ores.
The digestion temperature and time are two critical parameters for sample digestion. Based on the results regarding the digestion acid, experiments were conducted on uranium oxide and uranium ore samples at varying temperatures and times. As shown in Figure 2d, the UO2 digestion temperature experiment demonstrated that digestion at 160 °C yielded the highest average recovery (93.6 ± 3.8%), outperforming 140 °C (91.9 ± 3.9%) and 180 °C (90.4 ± 2.6%). A similar trend was observed for U3O8 (Figure 2e), with recoveries of 104%, 106%, and 103% at 140 °C, 160 °C, and 180 °C, respectively. Thus, 160 °C is recommended for uranium oxide digestion. Under these optimized conditions, the recovery efficiency and precision of the uranium oxides were consistent with those in previous work using microwave digestion at 180 °C [33]. For uranium ores (Figure 2f), digestion at 180 °C achieved the highest recovery (83.9 ± 5.6%). At 200 °C, significant solution evaporation and increased insoluble fluoride formation were observed compared to 160 °C and 180 °C. In consideration of the evaporation efficiency and the comparable insoluble fluoride yields at 160 °C and 180 °C, 180 °C was selected as the parameter for uranium ore digestion.
Figure 2g,h present the recovery of REEs in uranium oxide digestion with different digestion times. Comparable recovery was observed across all experimental groups. Notably, all REEs in the three-hour digestion groups demonstrated consistent recovery exceeding 91%. These results represent a significant improvement over previous analyses of high-purity uranium samples digested at 90 °C for 6 h, with an average recovery enhancement of over 5% [34]. Considering solution retention and recovery efficiency, a three-hour digestion period was selected for subsequent uranium oxide pretreatment optimization experiments. Figure 2i displays the uranium ore digestion results across different durations. The 36-h group achieved the highest average recovery (85.0 ± 3.4%), outperforming both the 12-h (83.9 ± 5.6%) and 24-h (84.0 ± 2.6%) groups. No insoluble fluorides were observed following 36-h digestion, attributable to enhanced fluoride dissolution during the prolonged reaction period [35,36]. Therefore, the 36 h digestion time is recommended for uranium ores.

3.2. Optimization of Uranium Matrix Removal

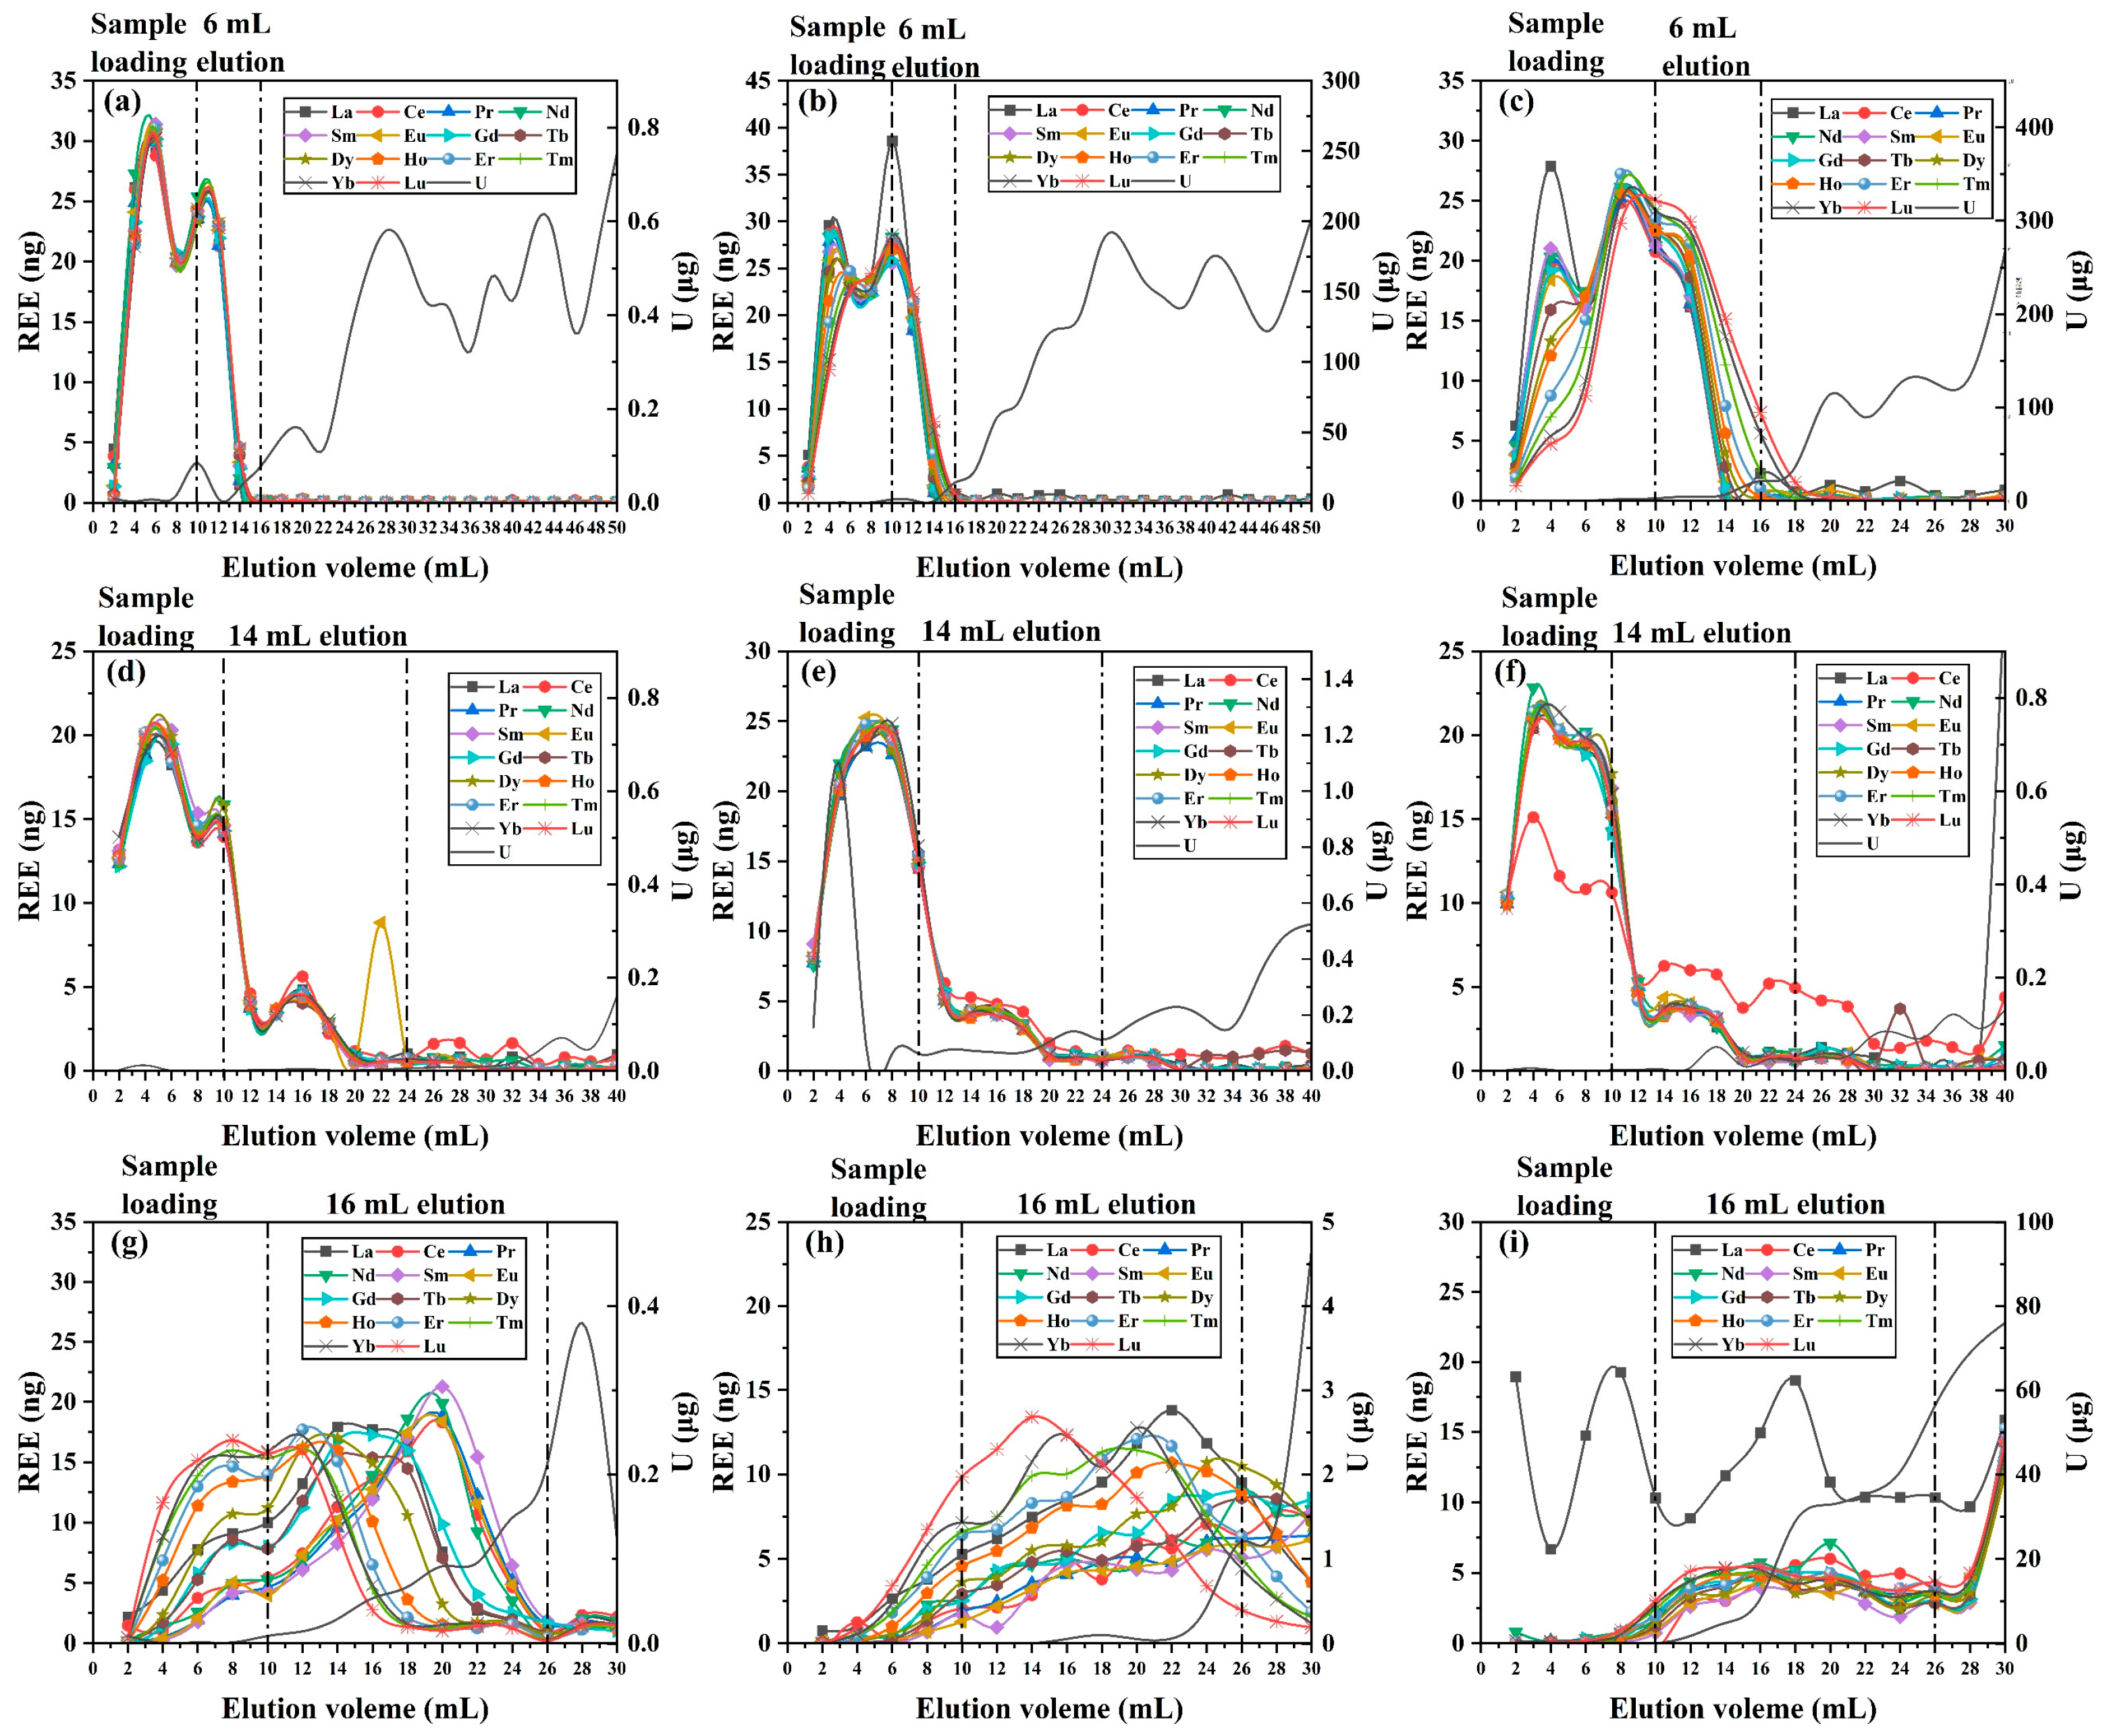
This study focuses on nuclear materials from the front end of the nuclear fuel cycle, where the uranium matrix effect represents the primary challenge for REE detection. To address this, we optimized the separation procedures using uranium matrix samples and REE standard solutions. Several studies have conducted the direct determination of impurity elements in uranium materials using the matrix-matched external standard method [33,37]. Although this method is simple, the vast amount of uranium matrix in the sample solution could contaminate the instrument. UTEVA resin is commonly used for uranium separation; however, in the 10 M HNO3 system, the adsorption coefficients of most REEs are less than 10 [38]. As for TRU resin, the adsorption coefficients of REEs are generally less than 5 in low-concentration hydrochloric acid [39]. In addition, REEs exhibit almost no adsorption in anion exchange resins [40]. Therefore, UTEVA resin, AG1-X8 anionic resin, and TRU resin were selected to study the separation efficiency for trace REEs in a uranium matrix. Simulated loading samples containing 100 ng REEs and 30 mg uranium matrix in 10 mL of the corresponding solutions were processed through 2 mL resin columns. The recoveries and separation efficiencies were systematically evaluated, with the elution profiles presented in Figure 3.
For UTEVA resin, uranium formed a distinct yellow band at the column’s upper end [6]. Figure 3a–c demonstrate that heavy REEs exhibited stronger retention than light REEs with increasing HNO3 concentrations, consistent with Marinov et al.’s findings [38]. During sample loading, the average REE recoveries were 70.5% (4 M HNO3), 75.0% (6 M HNO3), and 68.2% (8 M HNO3). Notably, uranium elution in the 4 M HNO3 system (0.120 µg) was significantly lower than in the 6 M (2.51 µg) and 8 M (4.86 µg) systems. When the total acid volume reached 16 mL, REE recovery plateaued (88.7–93.2%) in both the 4 M and 6 M HNO3 systems, while uranium elution continued to increase. The 4 M HNO3 system showed optimal performance, with minimal uranium elution (0.236 µg) and a high decontamination factor (9.83 × 10⁴), representing a threefold improvement over previous UTEVA resin studies [18]. Consequently, we selected 10 mL 4 M HNO3 as the loading solution and 6 mL 4 M HNO3 as the rinsing solution, ensuring accurate trace REE measurements [21].
The separation results for REEs using the AG1-X8 resin with varying HCl concentrations are presented in Figure 3d–f. During the sample loading stage, the average recoveries of REEs in the three systems were 73.6% (8 M HCl), 78.2% (10 M HCl), and 78.1% (12 M HCl), comparable to those achieved with the UTEVA resin in the 4 M and 6 M HNO3 systems. The corresponding uranium elution quantities for these systems were 0.0155 µg, 1.47 µg, and 0.0112 µg, respectively. Although the average REE recoveries were similar across the three systems, the 8 M and 12 M HCl systems demonstrated superior uranium adsorption. At a total acid volume of 24 mL, the average recoveries improved to 89.6%, 95.4%, and 95.5%, with uranium elution quantities of 0.0392 µg, 2.11 µg, and 0.133 µg, respectively. Overall, the AG1-X8 resin performed optimally in the 12 M HCl system, achieving a uranium decontamination factor of 1.65 × 10⁵. Under these conditions, the average REE recovery was 95.5%, with a loading volume of 10 mL and a rinse volume of 14 mL. While the recovery efficiency was similar to that of other ion exchange resin systems, the separation performance was superior [25,41].
TRU resin is a white fine powder. During the sample loading stage, a distinct yellow band [6] was observed at the upper end of the resin column. Figure 3g–i illustrate the elution curves of REEs in TRU resin at different HCl concentrations. The elution trends varied significantly across the systems, attributable to the strong adsorption of trivalent cations by TRU resin [42]. At the loading stage, all three systems exhibited effective uranium adsorption (<0.1 µg), but the REE recovery was the lowest among the tested resin–acid combinations. The 6 M HCl system yielded the highest REE recovery (32.2%), suggesting that TRU resin’s adsorption efficiency for REEs improves with increasing HCl concentrations. This behavior aligns with the extraction properties of TRU resin, as its two extractants exhibit some affinity for REEs. When a total acid volume of 26 mL was applied, the 6 M HCl system achieved average REE recovery of 94.0%, although uranium elution began to rise gradually. In contrast, the 8 M and 10 M HCl systems showed markedly lower recoveries (55.2% and 39.7%, respectively). The 6 M HCl system also produced the least uranium elution (0.733 µg), corresponding to a decontamination factor of 3.03 × 10⁴. Thus, 26 mL of 6 M HCl (10 mL loading solution + 16 mL rinsing solution) was identified as the optimal separation condition for TRU resin.

3.3. Optimization of Inner Diameter Conditions

In column chromatography, the column efficiency is inversely proportional to the inner diameter and directly proportional to the column length, indicating that a higher aspect ratio theoretically enhances the separation performance [43,44]. Consequently, when maintaining a constant resin column volume, columns with smaller internal diameters are preferred to achieve narrow peaks and high efficiency. However, excessively large aspect ratios present practical limitations [33,45], as they may generate elevated column pressures that complicate experimental operation. To evaluate these trade-offs, we compared the recovery and separation efficiencies of each resin across different inner diameters.
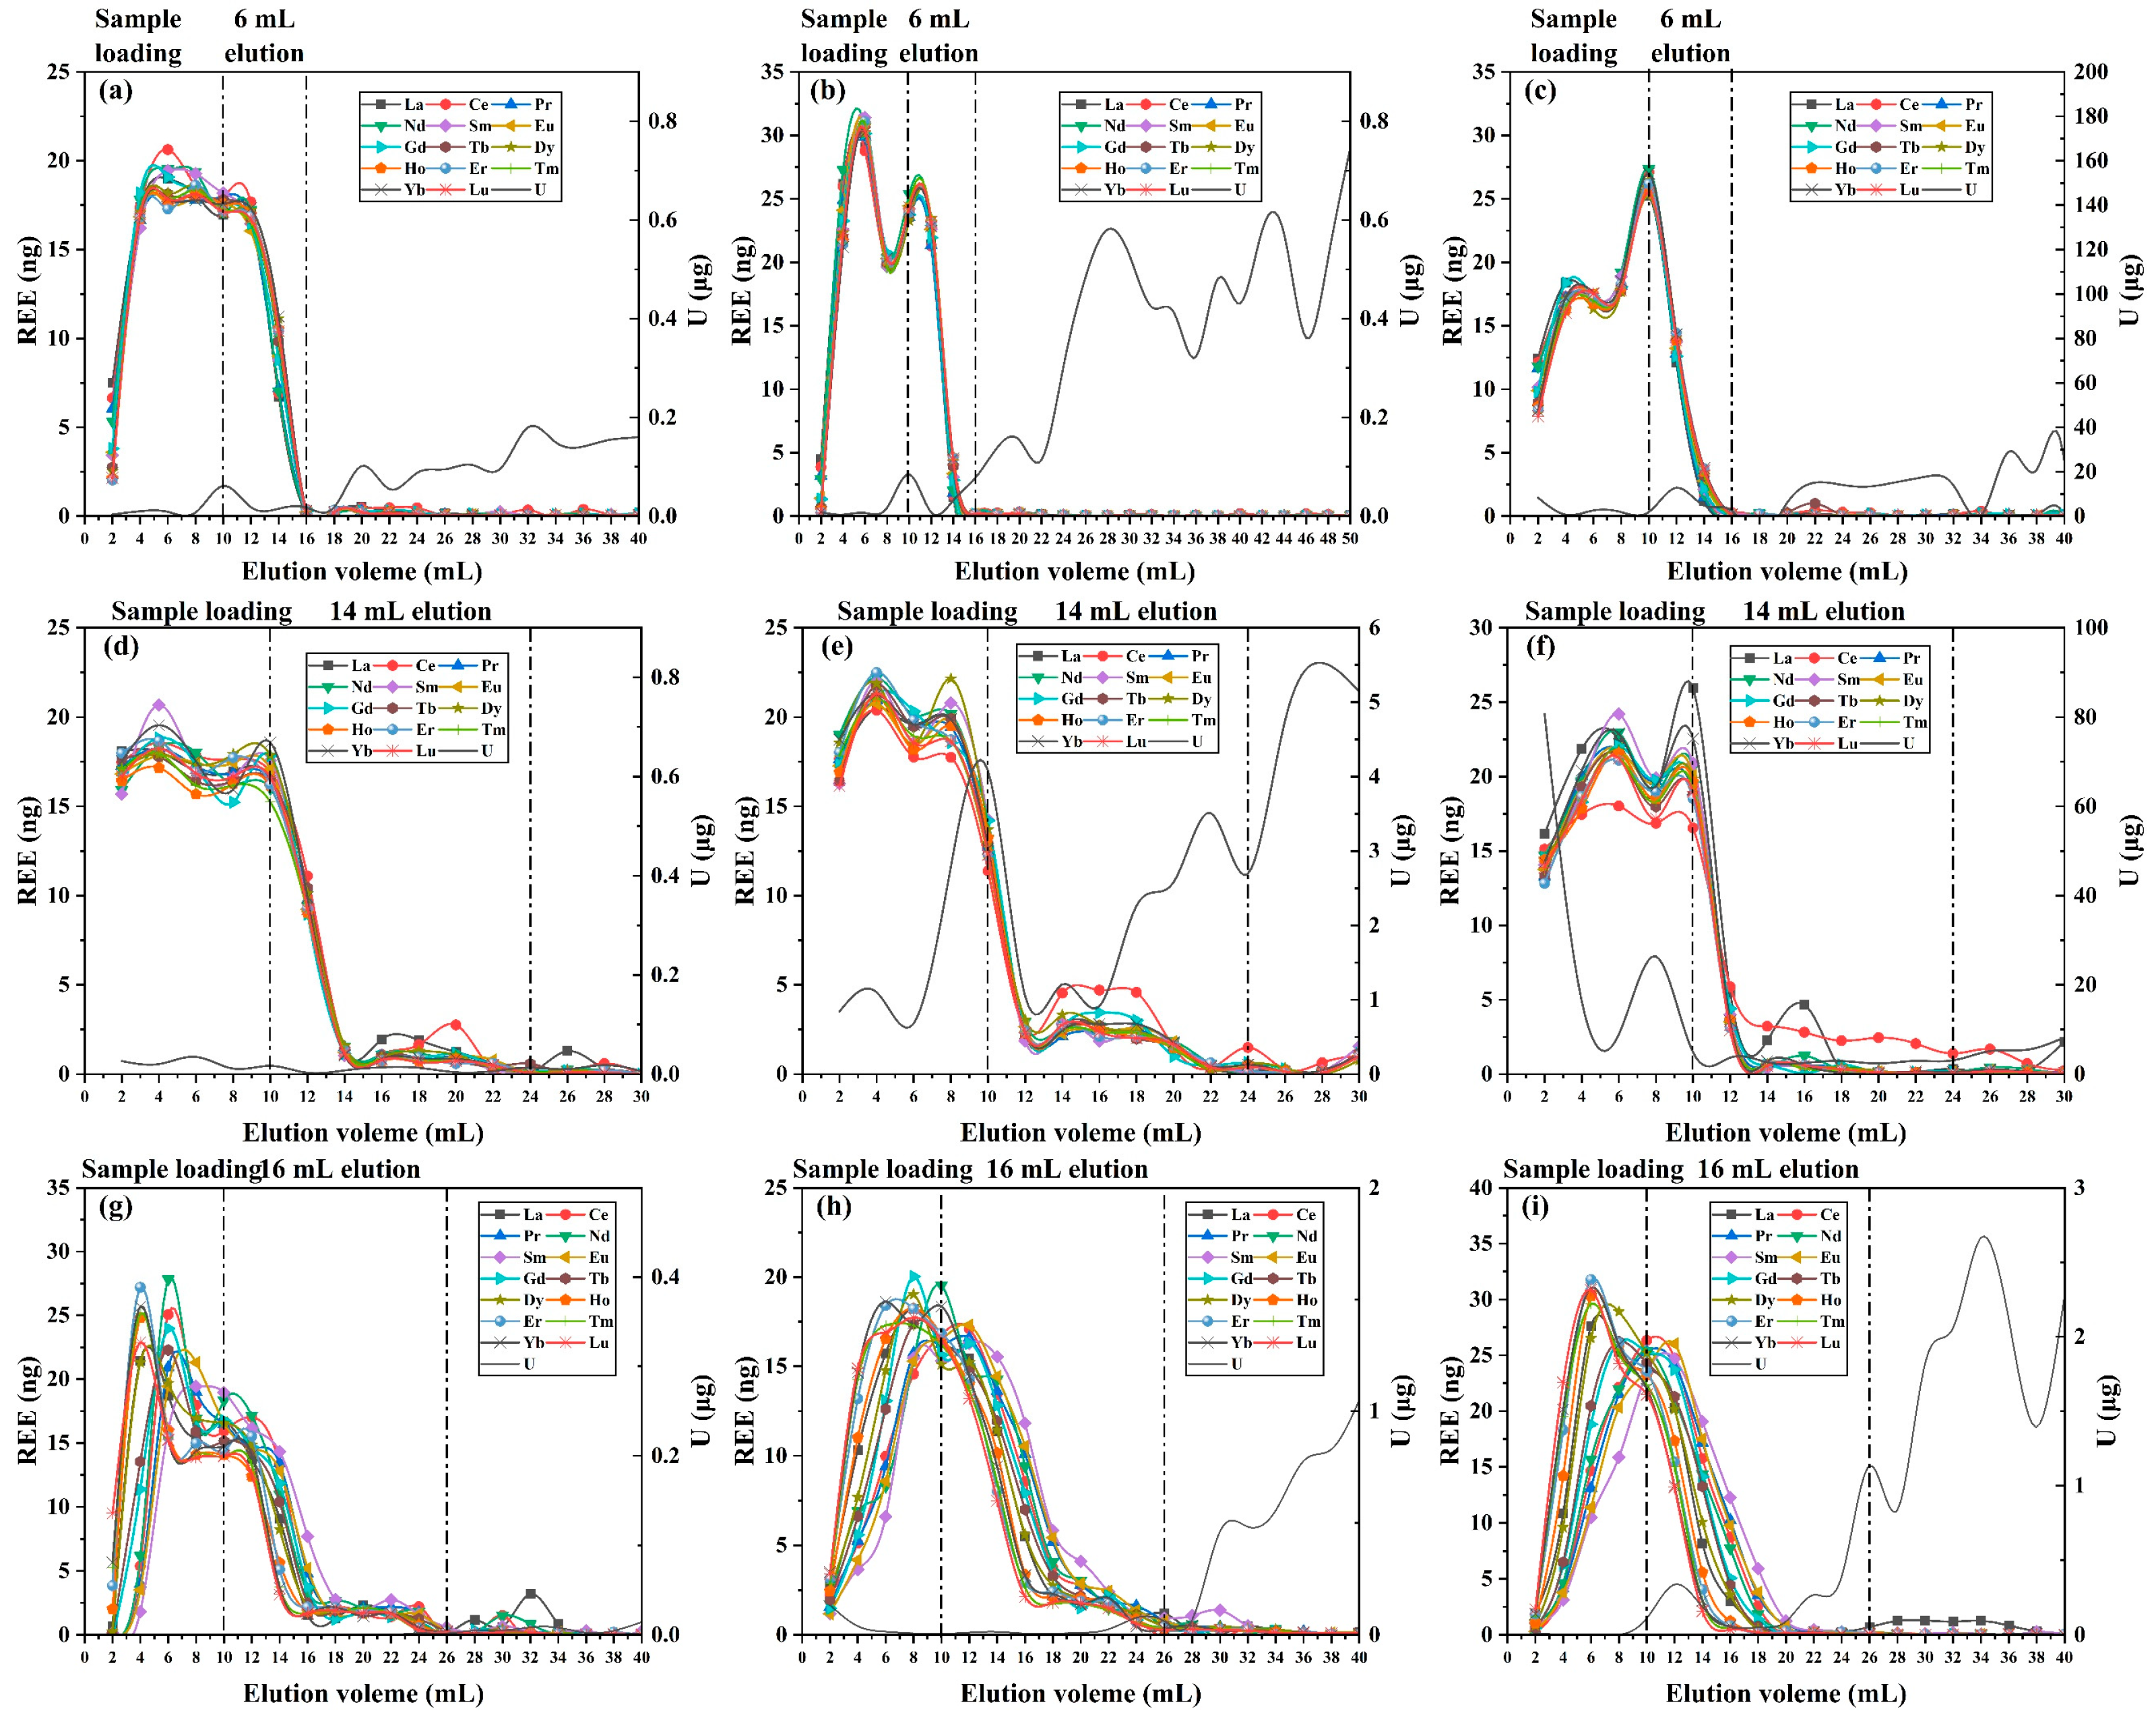
Here, 2 mL resin particles were packed into columns with 5 mm, 9 mm, and 15 mm inner diameters. Under optimal loading solution and rinsing volume conditions, we investigated how the column diameter affected the separation efficiency of trace REEs from uranium matrices. Figure 4 shows the elution curves of REEs for each resin across different column diameters. As the inner diameter of the TRU resin column decreased, the elution peaks became sharper but exhibited tailing effects. This phenomenon suggests that smaller column diameters enhance the retention capabilities of TRU resin for REEs [43,44].
For UTEVA resin columns with inner diameters of 5 mm, 9 mm, and 15 mm, most REEs were recovered using a total acid volume of 16 mL. The three systems showed comparable average recoveries (89.0–91.7%). Notably, uranium elution was lowest in the 5 mm system (0.141 µg), compared to 0.236 µg and 35.1 µg in the 9 mm and 15 mm columns, respectively. With AG1-X8 resin, most REEs were recovered at a total acid volume of 24 mL, with similar average recoveries across systems (93.9–95.0%). The primary variation between column diameters appeared in uranium elution: the 5 mm column yielded only 0.169 µg, while the 9 mm and 15 mm columns showed significantly higher elution (23.7 µg and 157 µg, respectively). For TRU resin, optimal REE recovery (94.5–97.5%) required a total acid volume of 26 mL. The 5 mm system demonstrated exceptional uranium retention (0.004 µg), substantially lower than in the 9 mm (0.346 µg) and 15 mm (1.50 µg) systems.
Our results demonstrate that all three resins effectively recovered REEs under optimized conditions regardless of the column diameter. While the REE recovery efficiencies remained comparable across different diameters, reducing the inner diameter significantly decreased the uranium content in the final eluate. This improvement stems from the enhanced uranium retention capacity in narrower columns. The 5 mm diameter systems exhibited particularly low uranium elution—0.141 µg (UTEVA), 0.169 µg (AG1-X8), and 0.004 µg (TRU)—corresponding to uranium decontamination factors of 1.56 × 10⁵, 1.30 × 10⁵, and 5.77 × 10⁶, respectively. Considering its lowest acid consumption and compatibility with direct sample dilution in 4 M HNO3, we selected UTEVA resin for subsequent experiments.

3.4. Analysis of REEs in High-Uranium Matrix

In nuclear fuel production, the elemental composition is strictly controlled to ensure optimal product performance. Impurity elements with small thermal neutron cross-sections typically exist at concentrations of 10−6 to 10−5, while REEs in nuclear materials are present at even lower levels (10−8 to 10−7) [23]. This ultra-trace presence makes REE analysis in high-uranium matrices particularly valuable for nuclear forensics applications. Based on these operational parameters, we selected a content ratio of 10−7 to simulate high-purity uranium samples for our experiments.
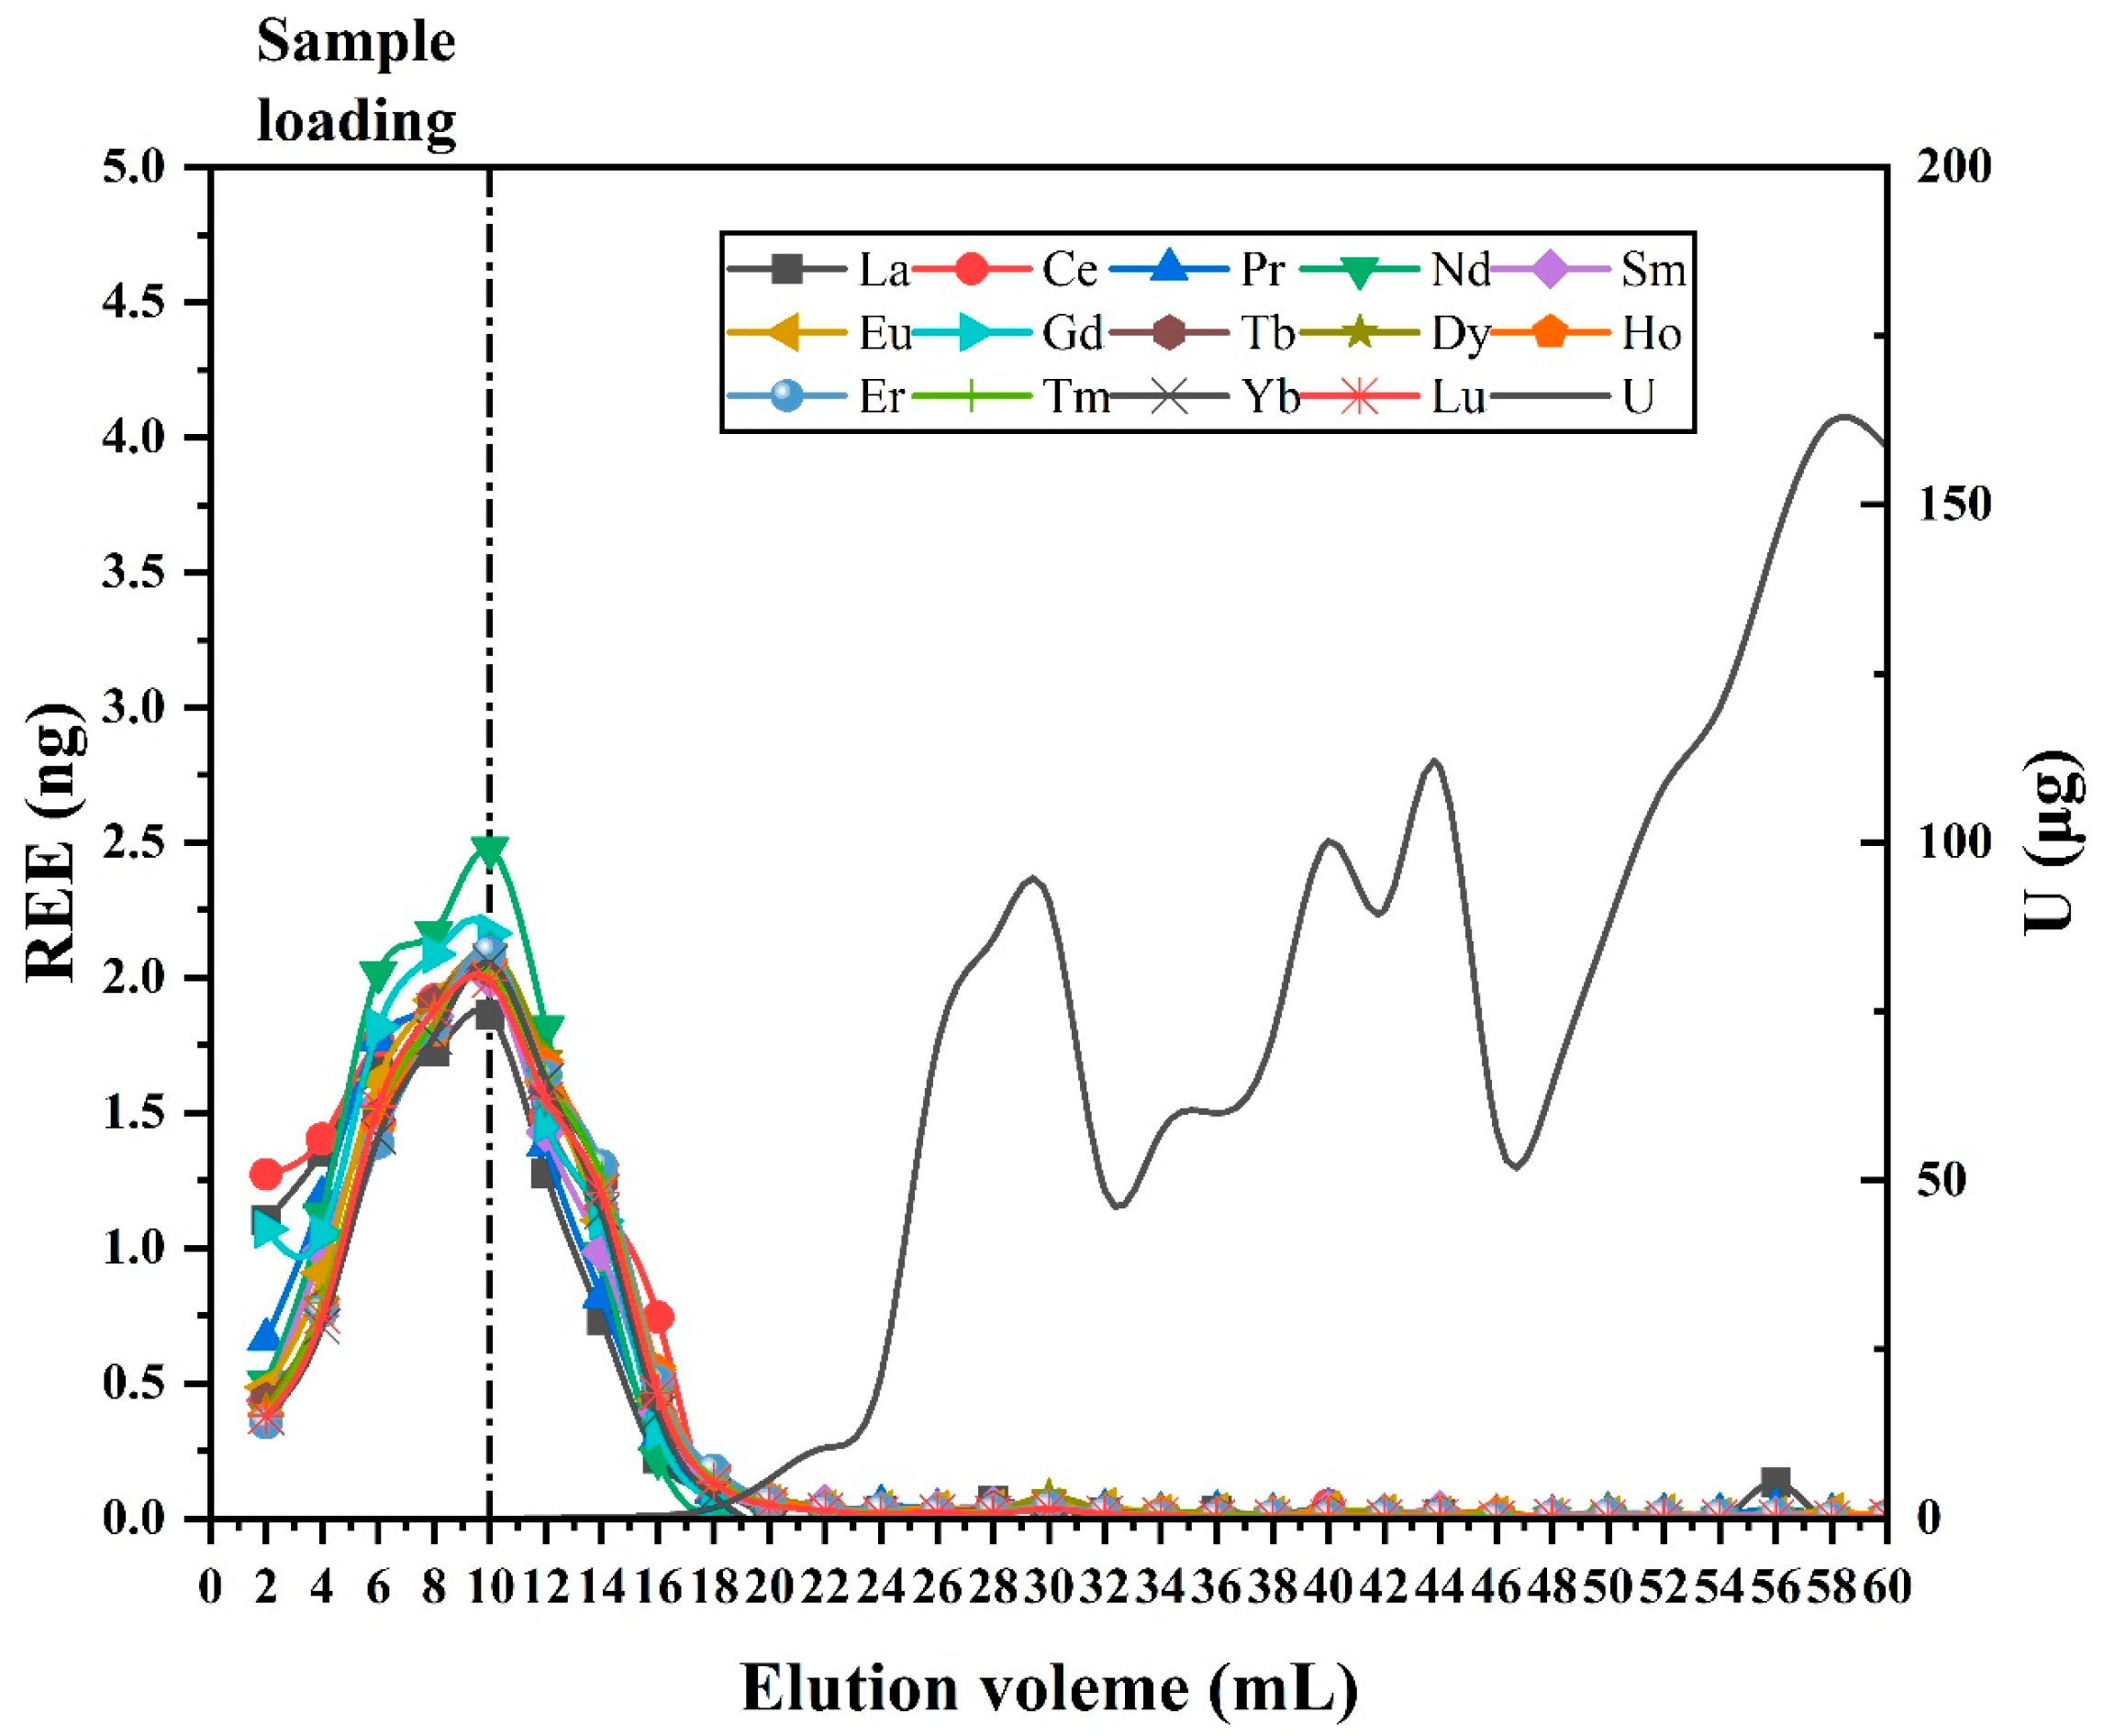
To prepare simulated loading samples, 10 ng of REEs and 100 mg of uranium matrix were dissolved in 10 mL of the corresponding solution. Initial separation experiments using a single UTEVA resin column resulted in final uranium concentrations at the milligram level. To improve the separation efficiency, we employed a dual-column approach. The eluent from the first UTEVA column was collected in 2 mL fractions, each of which was subsequently processed through a second UTEVA column. Figure 5 presents the composite elution profile for REEs obtained through this method.
During sample loading, the average recovery of REEs was 70.8%, with uranium elution of 0.0566 µg, comparable to the results obtained using a single UTEVA column. For total acid volumes of 16 mL and 18 mL, the REE recoveries remained similar (101% and 103%), while uranium elution increased significantly from 0.715 µg to 2.30 µg. Consequently, 16 mL of 4 M HNO3 (10 mL loading volume + 6 mL rinsing volume) was determined as the optimal separation condition for the dual UTEVA resin system, yielding a uranium decontamination factor of 1.17 × 10⁵. This effectively maintained the uranium concentrations below the measurable threshold (<100 ng/mL) [22,46], demonstrating the system’s capabilities for ultra-trace REE analysis in high-uranium matrices.
Previous studies have typically employed uranium sample amounts ranging from 200 mg to 1 g, with post-separation uranium residues generally remaining at the microgram level [18,20,45,46]. In contrast to these conventional approaches, our optimized method achieved two significant improvements: (1) substantially reduced uranium residue in the final solution and (2) an enhanced decontamination factor (improved by approximately 103) [18,21,22].

3.5. Validation of the Developed Method

To validate the method’s precision, we performed both repeatability and reproducibility studies. Given the limited availability of certified reference materials for uranium oxides, we employed the standard addition method for quantitative analysis. Our evaluation utilized two sample types: (1) simulated samples containing 100 ng of rare earth elements (REEs) with a 30 mg uranium matrix and (2) certified uranium ore samples (GBW 04131). Following the developed protocol, we processed repeatability samples in triplicate (n = 3) and reproducibility samples in quintuplicate (n = 5). To assess reproducibility, independent analysts performed the analyses and the results were cross-compared. Throughout sample preparation, procedural blanks were analyzed in parallel, with all blank measurements falling below the detection limit. For recovery calculations, we accounted for procedural blank contributions by subtracting blank values from sample measurements.
The analytical data validity was assessed using Cochran’s and Grubbs’ statistical tests. Cochran’s test was employed to evaluate variance homogeneity among datasets, with the test statistic calculated as in Equation (1):
C = s m a x 2 i = 1 p s i 2
C is the Cochran parameter, si is the SD after each treatment, and smax is the maximum value of si.
Grubbs’ test identifies statistically significant outliers within a dataset by evaluating extreme values. The test statistic (G) is calculated as in Equation (2):
G p = x p x ¯ s ; G 1 = x ¯ x 1 s
Gp and G1 represent the Grubbs parameters for the maximum and minimum values, respectively; the data series xi (i = 1, 2, …, p) are the mean values after each treatment; s is the SD of xi; x ¯ is the mean value of xi; x(p) is the maximum value in xi; x(1) is the minimum value in xi.
The Cochran and Grubbs test parameters for the developed method are presented in Table S1. In the repeatability tests during uranium oxide analyses, La showed a statistically significant Cochran value, while the reproducibility tests revealed significant values for Er and Lu. All other elements demonstrated normal statistical distributions. Such statistical outliers are expected in analytical measurements and were attributed to instrumental background fluctuations. Consequently, these data points were retained as valid measurements in our analysis.
The relative standard deviation (RSD) values of the uranium oxide analysis method ranged from 0.39 to 3.61% (p = 3) and 0.39 to 4.73% (p = 5). The RSD values of the uranium ore analysis method ranged from 1.26 to 5.76% (p = 3) and 1.24 to 5.76% (p = 5). These results show that the methods have high precision.
The concentrations of REEs in uranium oxides are known to vary significantly depending on the processing conditions. To evaluate the method’s performance across different concentration ranges, we analyzed simulated samples with varying REE spike levels (50 ng, 100 ng, and 200 ng) while maintaining a constant uranium matrix mass. As shown in Table 2, the recoveries for U3O8-100 ng samples were systematically higher than those for UO2-100 ng samples. This discrepancy likely stemmed from trace REE impurities in the U3O8 starting material, although this minor contribution did not significantly impact our quantitative results. All samples demonstrated REE recoveries exceeding 80%, with standard deviations below 10% for all elements. The strong agreement between the spiked and measured values, coupled with low result dispersion, confirms the excellent method reproducibility. These results demonstrate the method’s robustness in quantifying REEs across different concentration levels in uranium oxide matrices.
The limit of detection (LOD) of a method is the minimum analyte concentration that can be clearly differentiated from the background signal. Reagent blank solutions obtained through analytical procedures were used to estimate the LOD values of REEs. The calculation method for the LOD is based on the SD (s, CPS) and the slope of the standard curve (k, CPS/ppt). The formula is expressed as in Equation (3):
L O D = 3 s / k
Table 3 presents the LODs of the developed method for the detected elements. The LODs for REEs in this study were generally below 10 ppt, except for Ce. Table 4 presents a comparison between the developed method and prior studies, focusing on three key parameters: the LOD, the uranium decontamination factor, and REE recovery. For a comprehensive analysis, we combined our uranium oxide analysis method and uranium ore analysis method for discussion. As illustrated in Table 4, the recovery with the developed method was slightly lower than those reported in prior studies. However, the developed method exhibits good performance in terms of the LODs and decontamination factor. The LODs for our methods were comparable with those reported by Ding et al. [21] for the measurement of a blank solution (1 M HNO3), and the achieved decontamination factors showed a moderate improvement over conventional methods, matching the performance reported by Varga et al. [6]. These results collectively demonstrate the method’s suitability for trace REE analysis in uranium-bearing nuclear materials.

4. Conclusions

This study developed an analytical method for determining REEs in uranium-containing nuclear materials. We established two efficient digestion protocols: (1) for uranium oxides using 2 mL HNO3 at 160 °C for 3 h and (2) for uranium ores using 7 mL of mixed acid (HNO3–HClO4–HF = 5:5:3) at 180 °C for 36 h. Both methods achieved complete dissolution while maintaining uranium matrix concentrations below 30 ppm, yielding stable REE recoveries with RSDs typically below 5%. Through the systematic evaluation of three resin column separation systems and internal diameters, we obtained an optimized UTEVA resin-based separation method that effectively eliminates uranium matrix interference, achieving a decontamination factor of 105. For ultra-trace REE analysis in high-uranium matrices, a dual UTEVA column system reduced the final uranium concentrations to <50 ppb while maintaining excellent recovery efficiency. The method demonstrated detection limits below 10 ppt for all elements except Ce, with good repeatability and reproducibility (RSD < 6%).

Supplementary Materials

The following supporting information can be downloaded at: https://www.mdpi.com/article/10.3390/pr13103089/s1, Table S1: The Cochran parameters and Grubbs parameters of the developed methods.

Author Contributions

Conceptualization, Z.L., Y.S. and D.X.; Writing—original draft, Z.L.; Investigation, Z.L. and Y.S.; Review and editing, Y.S.; Resources, D.X., L.M. and M.L.; Funding acquisition, L.M.; Data curation, Z.L., Y.S. and F.X.; Supervision, D.X., L.M., C.L. and J.Z.; Project administration, Y.S. and X.L. All authors have read and agreed to the published version of the manuscript.

Funding

This work was supported by the Nuclear Technology R&D Program (HNKF 202232(36)).

Data Availability Statement

The data are available from the corresponding author on reasonable request.

Conflicts of Interest

The authors declare no conflicts of interest.

References

  1. Asai, S.; Limbeck, A. LA-ICP-MS of rare earth elements concentrated in cation-exchange resin particles for origin attribution of uranium ore concentrate. Talanta 2015, 135, 41–49. [Google Scholar] [CrossRef]
  2. Spano, T.L.; Simonetti, A.; Balboni, E.; Dorais, C.; Burns, P.C. Trace element and U isotope analysis of uraninite and ore concentrate: Applications for nuclear forensic investigations. Appl. Geochem. 2017, 84, 277–285. [Google Scholar] [CrossRef]
  3. Corcoran, L.; Simonetti, A.; Spano, T.; Lewis, S.; Dorais, C.; Simonetti, S.; Burns, P. Multivariate Analysis Based on Geochemical, Isotopic, and Mineralogical Compositions of Uranium-Rich Samples. Minerals 2019, 9, 537. [Google Scholar] [CrossRef]
  4. Mercadier, J.; Cuney, M.; Lach, P.; Boiron, M.; Bonhoure, J.; Richard, A.; Leisen, M.; Kister, P. Origin of uranium deposits revealed by their rare earth element signature. Terra Nova 2011, 23, 264–269. [Google Scholar] [CrossRef]
  5. Keegan, E.; Richter, S.; Kelly, I.; Wong, H.; Gadd, P.; Kuehn, H.; Alonso-Munoz, A. The provenance of Australian uranium ore concentrates by elemental and isotopic analysis. Appl. Geochem. 2008, 23, 765–777. [Google Scholar] [CrossRef]
  6. Varga, Z.; Katona, R.; Stefánka, Z.; Wallenius, M.; Mayer, K.; Nicholl, A. Determination of rare-earth elements in uranium-bearing materials by inductively coupled plasma mass spectrometry. Talanta 2010, 80, 1744–1749. [Google Scholar] [CrossRef] [PubMed]
  7. Britt, H.C.; Dairiki, J.M.; Lougheed, R.W.; McNabb, D.P.; Prussin, S.G. Review of the Status of Cumulative Fission Yields from 239Pu(n,f) of Interest to Nuclear Forensics; Lawrence Livermore National Laboratory (LLNL): Livermore, CA, USA, 2010. [Google Scholar]
  8. Moody, K.J.; Grant, P.M.; Hutcheon, I.D. Nuclear Forensic Analysis, 2nd ed.; CRC Press: Boca Raton, FL, USA, 2014. [Google Scholar]
  9. Mayer, K.; Wallenius, M.; Varga, Z. Nuclear Forensic Science: Correlating Measurable Material Parameters to the History of Nuclear Material. Chem. Rev. 2013, 113, 884–900. [Google Scholar] [CrossRef]
  10. He, H.; Zhao, X.; Zhang, Y.; Zhao, L.; Hu, R.; Li, L. Determination of rare earth elements in uranium ores by ICP-MS after total dissolution with NH4F and matrix separation with TRU resin. J. Radioanal. Nucl. Chem. 2023, 332, 1909–1916. [Google Scholar] [CrossRef]
  11. Natarajan, V.; Dhawale, B.A.; Rajeswari, B.; Hon, N.S.; Thulasidas, S.K.; Porwal, N.K.; Godbole, S.V.; Manchanda, V.K. Determination of metallic impurities in U3O8 using energy dispersive X-ray fluorescence spectrometry. Spectrochim. Acta Part B At. Spectrosc. 2008, 63, 817–819. [Google Scholar] [CrossRef]
  12. Santoliquido, P.M. The determination of trace elements in uranium oxide (U3O8) by inductively coupled plasma emission spectrometry and graphite furnace atomic absorption spectrometry. J. Res. Natl. Bur. Stand. 1988, 93, 452–454. [Google Scholar] [CrossRef]
  13. Kin, F.D.; Prudêncio, M.I.; Gouveia, M.Â.; Magnusson, E. Determination of rare earth elements in geological reference materials: A comparative study by INAA and ICP-MS. Geostand. Newsl. 1999, 23, 47–58. [Google Scholar] [CrossRef]
  14. Navarro, M.S.; Ulbrich, H.H.G.J.; Andrade, S.; Janasi, V.A. Adaptation of ICP–OES routine determination techniques for the analysis of rare earth elements by chromatographic separation in geologic materials: Tests with reference materials and granitic rocks. J. Alloys Compd. 2002, 344, 40–45. [Google Scholar] [CrossRef]
  15. Gao, J.; Manard, B.T.; Castro, A.; Montoya, D.P.; Xu, N.; Chamberlin, R.M. Solid-phase extraction microfluidic devices for matrix removal in trace element assay of actinide materials. Talanta 2017, 167, 8–13. [Google Scholar] [CrossRef]
  16. Quarles, C.D.; Manard, B.T.; Wylie, E.M.; Xu, N. Trace elemental analysis of bulk uranium materials using an inline automated sample preparation technique for ICP-OES. Talanta 2018, 190, 460–465. [Google Scholar] [CrossRef]
  17. Trommetter, G.; Dumoulin, D.; Billon, G. Direct determination of rare earth elements in natural water and digested sediment samples by inductively coupled plasma quadrupole mass spectrometry using collision cell. Spectrochim. Acta Part B At. Spectrosc. 2020, 171, 105922. [Google Scholar] [CrossRef]
  18. Quemet, A.; Brennetot, R.; Chevalier, E.; Prian, E.; Laridon, A.-L.; Mariet, C.; Fichet, P.; Laszak, I.; Goutelard, F. Analysis of twenty five impurities in uranium matrix by ICP-MS with iron measurement optimized by using reaction collision cell, cold plasma or medium resolution. Talanta 2012, 99, 207–212. [Google Scholar] [CrossRef]
  19. Wu, Y.; Pena, L.D.; Goldstein, S.L.; Basak, C.; Bolge, L.L.; Jones, K.M.; McDaniel, D.K.; Hemming, S.R. A user-friendly workbook to facilitate rapid and accurate rare earth element analyses by ICP-MS for multispiked samples. Geochem. Geophys. Geosyst. 2020, 21, e2020GC009042. [Google Scholar] [CrossRef]
  20. Campbell, K.; Judge, E. Digestion and trace metal analysis of uranium nitride. J. Radioanal. Nucl. Chem. 2022, 331, 209–214. [Google Scholar] [CrossRef]
  21. Ding, X.; Bu, W.; Ni, Y.; Shao, X.; Xiong, K.; Yang, C.; Hu, S. Determination of trace rare earth elements in uranium ore samples by triple quadrupole inductively coupled plasma mass spectrometry. J. Anal. At. Spectrom. 2021, 36, 2144–2152. [Google Scholar] [CrossRef]
  22. Ni, Y.; Bu, W.; Xiong, K.; Ding, X.; Wang, H.; Liu, X.; Long, K.; Hu, S. Trace impurity analysis in uranium materials by rapid separation and ICP-MS/MS measurement with matrix matched external calibration. Microchem. J. 2021, 169, 106615. [Google Scholar] [CrossRef]
  23. Baghaliannejad, R.; Aghahoseini, M.; Amini, M.K. Determination of rare earth elements in uranium materials by ICP-MS and ICP-OES after matrix separation by solvent extraction with TEHP. Talanta 2021, 222, 121509. [Google Scholar] [CrossRef] [PubMed]
  24. Satyanarayana, K.; Durani, S. Separation and inductively coupled plasma optical emission spectrometric (ICP-OES) determination of trace impurities in nuclear grade uranium oxide. J. Radioanal. Nucl. Chem. 2010, 285, 659–665. [Google Scholar] [CrossRef]
  25. Aziz, A.; Jan, S.; Waqar, F.; Mohammad, B.; Hakim, M.; Yawar, W. Selective ion exchange separation of uranium from concomitant impurities in uranium materials and subsequent determination of the impurities by ICP-OES. J. Radioanal. Nucl. Chem. 2010, 284, 117–121. [Google Scholar] [CrossRef]
  26. Lee, C.H.; Suh, M.Y.; Choi, K.S.; Kim, J.S.; Song, B.C.; Jee, K.Y.; Kim, W.H. Separation of fission products from spent pressurized water reactor fuels by anion exchange and extraction chromatography for inductively coupled plasma atomic emission spectrometric analysis. Anal. Chim. Acta 2001, 428, 133–142. [Google Scholar] [CrossRef]
  27. Horwitz, E.P.; Dietz, M.L.; Chiarizia, R.; Diamond, H.; Maxwell, S.L.; Nelson, M.R. Separation and preconcentration of actinides by extraction chromatography using a supported liquid anion exchanger: Application to the characterization of high-level nuclear waste solutions. Anal. Chim. Acta 1995, 310, 63–78. [Google Scholar] [CrossRef]
  28. Rotzinger, F.P. Mechanism for the substitution of an aqua ligand of UO2(OH2)52+ by chloride. J. Chem. Theory Comput. 2008, 4, 1654–1658. [Google Scholar] [CrossRef]
  29. Pinto, F.G.; Tronto, J.; Lepri, F.G.; Tormen, L.; Saint’Pierre, T.D.; Costa, L.M.; Beinner, M.A.; da Silva, J.B.B. Study of ultrasonic and pneumatic nebulizers for ICP-MS determination of rare earth elements in geological samples. Atom. Spectrosc. 2015, 36, 116–127. [Google Scholar] [CrossRef]
  30. Nakamura, K.; Chang, Q. Precise determination of ultra-low (sub-ng g−1) level rare earth elements in ultramafic rocks by quadrupole ICP-MS. Geostand. Geoanal. Res. 2007, 31, 185–197. [Google Scholar] [CrossRef]
  31. Yokoyama, T.; Makishima, A.; Nakamura, E. Separation of thorium and uranium from silicate rock samples using two commercial extraction chromatographic resins. Anal. Chem. 1999, 71, 135–141. [Google Scholar] [CrossRef]
  32. Cong, H.; Liu, C.; Li, R.; Liu, Y.; Dou, Q.; Fu, H.; Zhang, L.; Zhou, W.; Li, Q.; Li, W. Trace impurities analysis in UF4 via standard addition and 103Rh internal standardization techniques combined with ICP-MS. J. Radioanal. Nucl. Chem. 2019, 322, 2025–2032. [Google Scholar] [CrossRef]
  33. Krajkó, J.; Varga, Z.; Wallenius, M.; Mayer, K. Pre-concentration of trace levels of rare-earth elements in high purity uranium samples for nuclear forensic purposes. Radiochim. Acta 2016, 104, 471–479. [Google Scholar] [CrossRef]
  34. Hubley, N.T.; Brockman, J.D.; Robertson, J.D. Evaluation of ammonium bifluoride fusion for rapid dissolution ineutron energy spectrumneutron energy spectrum post-detonation nuclear forensic analysis. Radiochim. Acta 2017, 105, 629–635. [Google Scholar] [CrossRef]
  35. Zhang, W.; Hu, Z.; Liu, Y.; Chen, H.; Gao, S.; Gaschnig, R.M. Total Rock Dissolution Using Ammonium Bifluoride (NH4HF2) in Screw-Top Teflon Vials: A New Development in Open-Vessel Digestion. Anal. Chem. 2012, 84, 10686–10693. [Google Scholar] [CrossRef]
  36. Bürger, S.; Riciputi, L.R.; Bostick, D.A. Determination of impurities in uranium matrices by time-of-flight ICP-MS using matrix-matched method. J. Radioanal. Nucl. Chem. 2007, 274, 491–505. [Google Scholar] [CrossRef]
  37. Lehto, J.; Hou, X. Chemistry and Analysis of Radionuclides: Laboratory Techniques and Methodology; Wiley-VCH: Weinheim, Germany, 2010. [Google Scholar]
  38. Marinov, G.; Marinova, A.; Milanova, M.; Happel, S.; Lebedev, N.A.; Drokhlyansky, A.; Mirzayev, N.; Karaivanov, D.V.; Filosofov, D.V. Sorption of Rare-Earth Elements and Ac on UTEVA Resin in Different Acid Solutions. Solvent Extr. Ion Exch. 2017, 35, 280–291. [Google Scholar] [CrossRef]
  39. Ostapenko, V.; Vasiliev, A.; Lapshina, E.; Ermolaev, S.; Aliev, R.; Totskiy, Y.; Zhuikov, B.; Kalmykov, S. Extraction chromatographic behavior of actinium and REE on DGA, Ln and TRU resins in nitric acid solutions. J. Radioanal. Nucl. Chem. 2015, 306, 707–711. [Google Scholar] [CrossRef]
  40. Balboni, E.; Simonetti, A.; Spano, T.; Cook, N.D.; Burns, P.C. Rare-earth element fractionation in uranium ore and its U(VI) alteration minerals. Appl. Geochem. 2017, 87, 84–92. [Google Scholar] [CrossRef]
  41. Treadway, J.W.; Wyndham, K.D.; Jorgenson, J.W. Highly efficient capillary columns packed with superficially porous particles via sequential column packing. J. Chromatogr. A 2015, 1422, 345–349. [Google Scholar] [CrossRef]
  42. Khoo, H.T.; Leow, C.H. Advancements in the preparation and application of monolithic silica columns for efficient separation in liquid chromatography. Talanta 2021, 224, 121777. [Google Scholar] [CrossRef]
  43. Gritti, F.; Guiochon, G. Kinetic investigation of the relationship between the efficiency of columns and their diameter. J. Chromatogr. A 2011, 1218, 1592–1602. [Google Scholar] [CrossRef]
  44. Wu, N.; Bradley, A.C. Effect of column dimension on observed column efficiency in very high pressure liquid chromatography. J. Chromatogr. A 2012, 1261, 113–120. [Google Scholar] [CrossRef] [PubMed]
  45. Saha, A.; Deb, S.B.; Saxena, M.K. Determination of trace impurities in advanced metallic nuclear fuels by inductively coupled plasma time-of-flight mass spectrometry (ICP-TOF-MS). J. Anal. At. Spectrom. 2016, 31, 1480–1489. [Google Scholar] [CrossRef]
  46. Durani, S.; Krishnakumar, M.; Satyanarayana, K. Solid phase separation and ICP-OES/ICP-MS determination of rare earth impurities in nuclear grade uranium oxide. J. Radioanal. Nucl. Chem. 2012, 294, 215–220. [Google Scholar] [CrossRef]
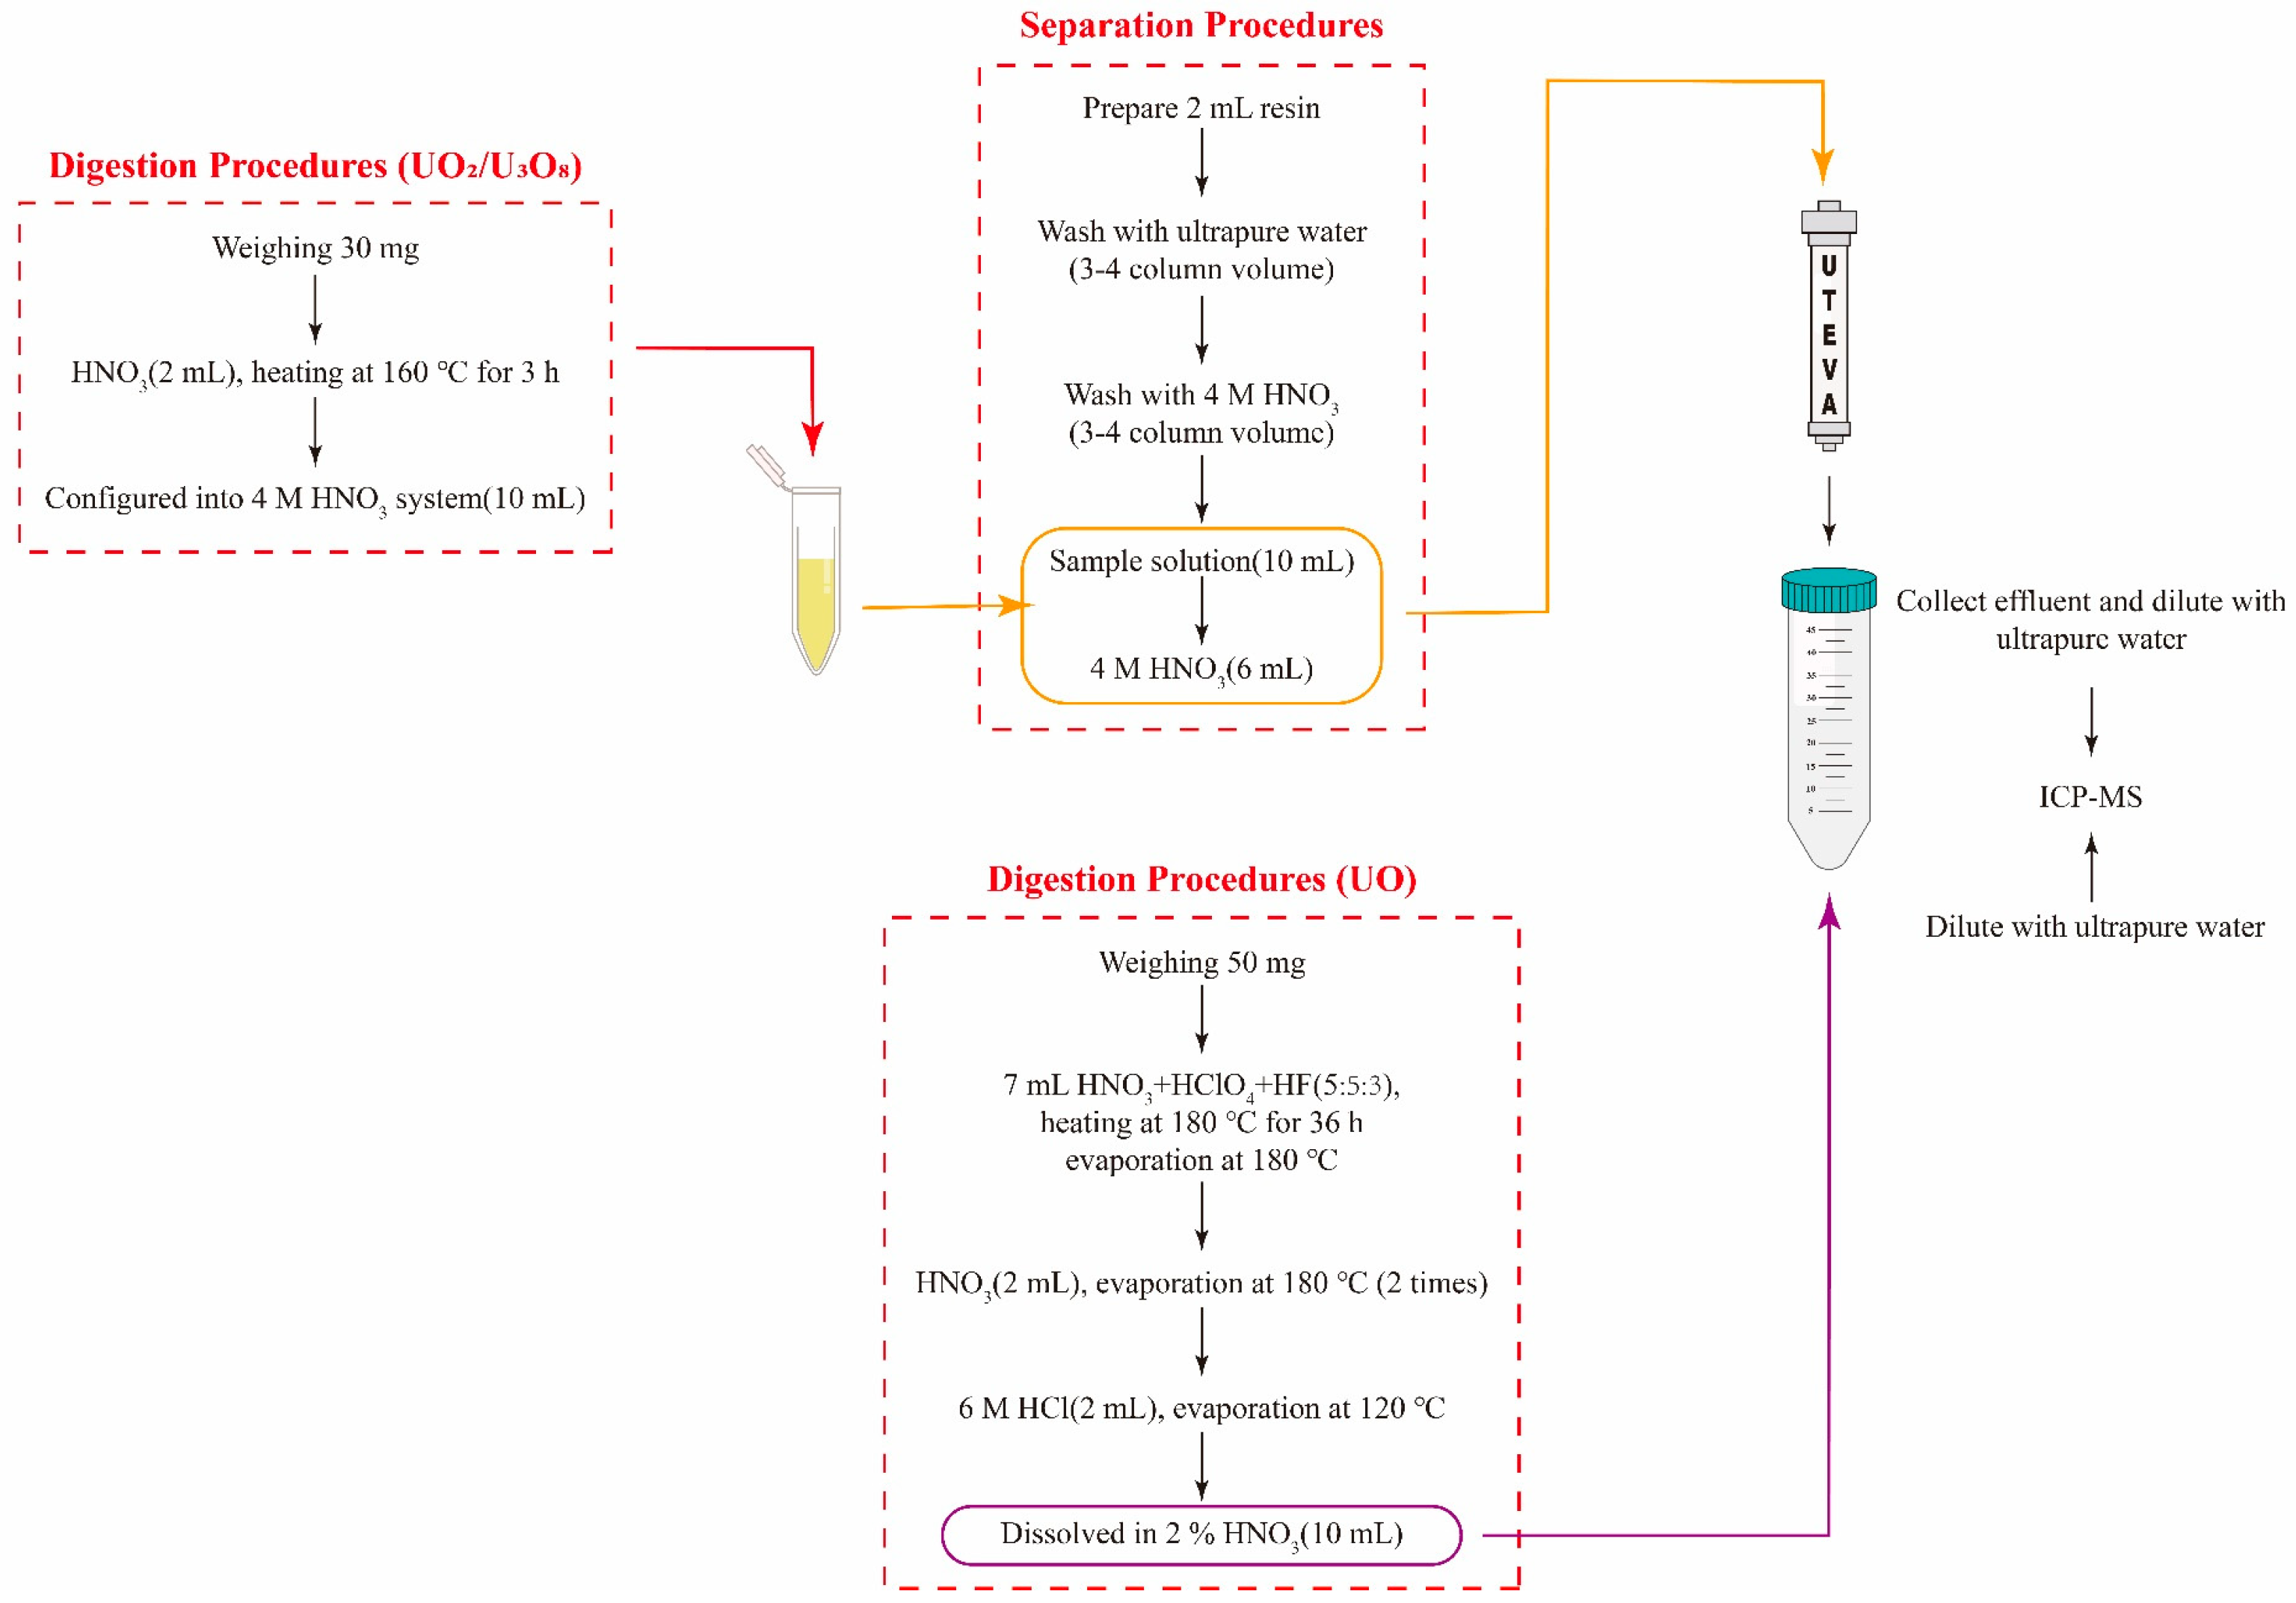
Figure 1. Schematic diagram of the analysis of uranium-bearing nuclear materials.
Processes 13 03089 g001
Figure 2. Effects of digestion conditions with different nuclear materials on REE recovery. (a) UO2 digestion acid group, (b) U3O8 digestion acid group, (c) uranium ore digestion acid group, (d) UO2 digestion temperature group, (e) U3O8 digestion temperature group, (f) uranium ore digestion temperature group, (g) UO2 digestion duration group, (h) U3O8 digestion duration group, (i) uranium ore digestion duration group. The reported uncertainty was determined from the standard deviation (SD) of 3 replicate samples (n = 3).
Processes 13 03089 g002
Figure 3. Effects of acid concentration with different resins on REE recovery. (a) 4 M HNO3 system (UTEVA resin), (b) 6 M HNO3 system (UTEVA resin), (c) 8 M HNO3 system (UTEVA resin), (d) 8 M HCl system (AG 1-X8 resin), (e) 10 M HCl system (AG 1-X8 resin), (f) 12 M HCl system (AG 1-X8 resin), (g) 6 M HCl system (TRU resin), (h) 8 M HCl system (TRU resin), (i) 10 M HCl system (TRU resin).
Processes 13 03089 g003
Figure 4. Effects of inner diameter with different resins on REE recovery. (a) 5 mm column (UTEVA resin), (b) 9 mm column (UTEVA resin), (c) 15 mm column (UTEVA resin), (d) 5 mm column (AG 1-X8 resin), (e) 9 mm column (AG 1-X8 resin), (f) 15 mm column (AG 1-X8 resin), (g) 5 mm column (TRU resin), (h) 9 mm column (TRU resin), (i) 15 mm column (TRU resin).
Processes 13 03089 g004
Figure 5. Elution profiles of REEs obtained by dual UTEVA resin columns in a high-uranium matrix.
Processes 13 03089 g005
Table 1. Typical ICP-MS operating parameters.
ParameterOperating ConditionsUnit
RF power1300W
Sampling depth120mm
Plasma gas flow rate13L/min
Auxiliary gas flow rate0.8L/min
Nebulizer gas flow rate0.8L/min
Cool gas flow rate18L/min
Table 2. Recoveries of REEs in different samples.
ElementUO2-50 ngUO2-100 ngUO2-200 ngU3O8-50 ngU3O8-100 ngU3O8-200 ng
La89.3 ± 4.3%84.9 ± 2.3%88.2 ± 3.6%91.0 ± 2.5%91.5 ± 4.6%86.9 ± 4.5%
Ce91.1 ± 6.6%84.5 ± 1.7%87.4 ± 4.1%92.7 ± 1.7%91.2 ± 4.6%86.0 ± 4.0%
Pr88.7 ± 3.6%85.3 ± 2.0%86.1 ± 3.7%91.3 ± 3.3%91.2 ± 4.7%86.3 ± 4.2%
Nd93.5 ± 3.6%85.8 ± 2.5%87.4 ± 4.3%87.3 ± 5.9%91.1 ± 3.9%87.3 ± 4.5%
Sm90.2 ± 5.0%86.3 ± 1.5%85.9 ± 4.1%88.7 ± 2.6%92.3 ± 4.7%84.0 ± 4.2%
Eu87.0 ± 3.5%84.4 ± 2.2%87.0 ± 3.2%91.4 ± 3.0%91.4 ± 4.1%84.4 ± 4.0%
Gd87.6 ± 3.8%83.4 ± 2.1%86.6 ± 2.9%86.4 ± 4.7%90.8 ± 4.2%82.2 ± 4.5%
Tb87.9 ± 3.6%83.8 ± 1.8%86.2 ± 3.2%90.0 ± 3.3%90.5 ± 4.3%84.2 ± 4.4%
Dy87.3 ± 5.3%84.6 ± 2.6%86.4 ± 4.0%89.2 ± 3.8%92.6 ± 5.1%84.7 ± 4.7%
Ho87.5 ± 4.0%84.9 ± 1.5%86.1 ± 3.2%89.7 ± 2.8%91.2 ± 4.6%83.0 ± 4.4%
Er89.5 ± 3.9%84.6 ± 2.1%86.9 ± 2.9%91.6 ± 3.3%91.4 ± 4.1%84.9 ± 4.4%
Tm89.0 ± 3.5%83.7 ± 1.9%86.4 ± 3.3%91.2 ± 2.5%90.3 ± 4.7%83.3 ± 4.3%
Yb91.9 ± 4.0%84.7 ± 2.5%87.8 ± 3.0%91.5 ± 3.2%91.5 ± 3.8%85.0 ± 4.8%
Lu88.4 ± 3.6%84.7 ± 1.9%86.6 ± 3.1%90.3 ± 2.3%90.7 ± 5.1%84.8 ± 4.7%
Average89.2 ± 4.2%84.7 ± 2.0%86.8 ± 3.5%90.2 ± 3.2%91.3 ± 4.5%84.8 ± 4.4%
Table 3. LODs for REEs using two analytical methods.
ElementUranium Oxides (ppt)Uranium Ores (ppt)
La9.055.47
Ce16.214.0
Pr4.011.28
Nd8.565.82
Sm6.541.80
Eu5.531.69
Gd7.253.17
Tb2.900.540
Dy5.062.03
Ho3.490.487
Er4.612.23
Tm2.890.363
Yb3.091.26
Lu2.300.273
U8.154.34
Table 4. Comparison between the developed method and previous studies.
LODUranium Decontamination FactorREE RecoveryReference
≤16.2 ppt1.56 × 10584~91% (all REEs)The developed
method
≤0.2 ng/g~2 × 106>94% (Sm, Eu, Gd, Dy)[6]
≤2 ng/g3 × 104>92% (Sm, Eu, Gd, Dy)[18]
≤0.98 ppt~1 × 10³>98% (all REEs)[21]
\1.2 × 10³\[22]
Disclaimer/Publisher’s Note: The statements, opinions and data contained in all publications are solely those of the individual author(s) and contributor(s) and not of MDPI and/or the editor(s). MDPI and/or the editor(s) disclaim responsibility for any injury to people or property resulting from any ideas, methods, instructions or products referred to in the content.