1. Introduction
Distillation, one of the principal unit operations in chemical engineering, remains the cornerstone of separation processes in many industries due to its efficiency and design intricacies. Among the many analytical and graphical methods developed for designing and analyzing distillation columns, the Ponchon–Savarit method [
1,
2] stands out.
The Ponchon–Savarit technique remains a fundamental graphical procedure for designing binary distillation columns. Using enthalpy–composition (H-x,y) diagrams and vapor-liquid equilibrium data, this method explicitly considers mass and energy balances when establishing the necessary number of theoretical stages for separation [
3]. Unlike the McCabe–Thiele technique [
4], which undertakes constant molal overflow and has limited ability to handle thermal effects, the Ponchon–Savarit method can rigorously incorporate different feed thermal conditions and varying enthalpy flows. This makes it especially useful for systems with significant heat effects or nonideal behavior.
In a distillation column, boil-up refers to the rate at which liquid evaporates in the reboiler and returns to the column as vapor. This process is essential for maintaining the separation of components within the column. Specifically, the boil-up ratio is the ratio of vapor formed in the exhausting section to the flow rate of the bottom product. While a higher boil-up ratio commonly progresses separation efficiency, it also increases energy consumption. Therefore, achieving an optimal balance between performance and economics is challenging.
Refs. [
3,
5] explain how to use the method to determine stage requirements and the influence of feed quality or reflux ratio on column operation. The focus remains on calculating the minimum reflux ratio and the number of equilibrium stages graphically. While fundamental to design, the boil-up ratio (V
B) and the minimum boil-up ratio (V
Bmin) are usually derived analytically through mass and energy balances external to the graphical procedure. The method itself is rarely extended beyond these classical uses in standard design references.
Several established methods exist for designing binary distillation and targeting energy. The McCabe–Thiele method is widely used due to its simplicity. However, since it relies on the constant-molar-overflow (CMO) assumption, it is most effective for determining stage requirements and minimum reflux ratios. The V
B can be calculated from the slope of the stripping section operating line. The V
Bmin is determined at the pinch point, where the operating lines intersect the equilibrium curve. However, the McCabe–Thiele method can produce inaccurate boil-ups when heat effects or the feed’s thermal state violate the CMO approximation. Shortcut methods, such as the Fenske–Underwood–Gilliland (FUG) approach, provide rapid estimates of minimum reflux and stage counts. However, V
B values must be inferred indirectly from R using CMO-based relationships. This limits their accuracy when heat effects are significant. Previous adaptations of the Ponchon–Savarit method have addressed specific challenges [
6,
7,
8,
9], but none have presented a systematic graphical procedure for directly extracting V
B and V
Bmin from the enthalpy–composition diagram. This study fills this gap by integrating these determinations into a graphical framework that unifies mass and energy balances, avoids restrictive CMO assumptions, and remains applicable to nonideal mixtures and diverse feed thermal conditions. This integration provides transparent visual interpretations and rigorous thermodynamic bases, thereby establishing the novelty and practical value of the proposed method.
This study implements, for the first time, a rigorous framework combining analytical mass and energy balances with an expanded Ponchon–Savarit graphical technique to determine the actual and minimum boil-up ratios in binary distillation. First, the boil-up ratio was calculated using an equation based on enthalpy differences obtained from global balances between the enriching and stripping portions. Second, the enthalpy segments between the saturated liquid, vapor, and heat-duty points were measured to calculate the boil-up ratio directly from an enthalpy–composition diagram. Based on these findings, a unified graphical technique was developed to determine the minimum boil-up ratio. This approach was systematically applied to the five canonical thermal states of the feed to ensure the method’s general applicability. The protocol was validated for nonideal mixtures, multiple feeds, and side streams to confirm its robustness and accuracy.
The Ponchon–Savarit method has been a cornerstone of distillation design for decades. However, it is typically used to determine stage requirements and minimum reflux ratios. Often, either boil-up ratios are derived analytically outside of the graphical framework or are not determined at all. This separation can lead to fragmented workflows and inconsistencies between analytical and graphical results. The extended approach presented here closes this gap by enabling the VB and VBmin to be extracted directly from the enthalpy–composition diagram. This integration unifies mass and energy balance considerations on a single visual platform, providing enhanced thermodynamic insight and reducing the need for iterative simulations.
2. Use of the Ponchon–Savarit Method in Related Literature
The Ponchon–Savarit enthalpy–composition framework has repeatedly served as a graphical foundation for designing and analyzing binary distillation processes, expanding well beyond its original stage-counting application. Several peer-reviewed studies illustrate various approaches, including analytical reformulations that mirror the Ponchon–Savarit construction, modifications that handle challenging feed conditions, and adaptations for intensified operations. Together, these works confirm the method’s versatility while highlighting that most prior studies do not read boil-up and minimum boil-up directly from the diagram, as performed in this manuscript. Ho et al. [
6] developed an extension of the Ponchon–Savarit approach for stage-by-stage analysis and synthesis of heat-integrated distillation columns. In these columns, heat is transferred internally between the rectifying and stripping sections. The extension retains the enthalpy balance viewpoint of the original approach, adapting it to columns with deliberate cross-section energy coupling. Thus, the extension demonstrates the usefulness of the Ponchon–Savarit approach when standard constant-overflow approximations are not applicable. Govind [
7] derived an analytical expression equivalent to the Ponchon–Savarit graphical construction method for systems with nearly straight enthalpy–composition lines. This enables plate calculations to be performed without referencing the diagram. Although this work emphasizes the same mass/energy coupling as the Ponchon–Savarit method, it employs closed-form algebra rather than geometric steps. This method is often cited when a large number of stages must be computed efficiently. Ledanois and Olivera-Fuentes [
8] presented modified Ponchon–Savarit and McCabe-Thiele procedures that accurately handle feed streams entering adjacent stages as separate liquids and vapors. Their fully graphical method retains the benefits of the Ponchon–Savarit procedure while addressing inconsistencies in the feed region resulting from conventional assumptions. This is an important practical consideration in binary columns. Lee et al. [
9] constructed Ponchon–Savarit diagrams for binary reactive columns and showed that stagewise reactions could be performed using a reactive difference point. They generalized the Ponchon–Savarit geometry to include enthalpy and composition changes. Although their objective was reaction-separation design rather than energy targeting, this study highlights the versatility of Ponchon–Savarit diagrams as thermally explicit tools for stagewise design.
The studies above have primarily used the Ponchon–Savarit diagram to replace analytical forms, ensure proper feed handling, and expand construction to include intensified columns. In contrast, the present study employs the Ponchon–Savarit diagram to directly extracts the boil-up ratio and its minimum from enthalpy segments and extremal tie-line intersections in binary operations. This complements shortcut targeting and rigorous simulations by providing a transparent, physically grounded graphical route to VB and VBmin.
3. Determination of Boil-Up Ratio
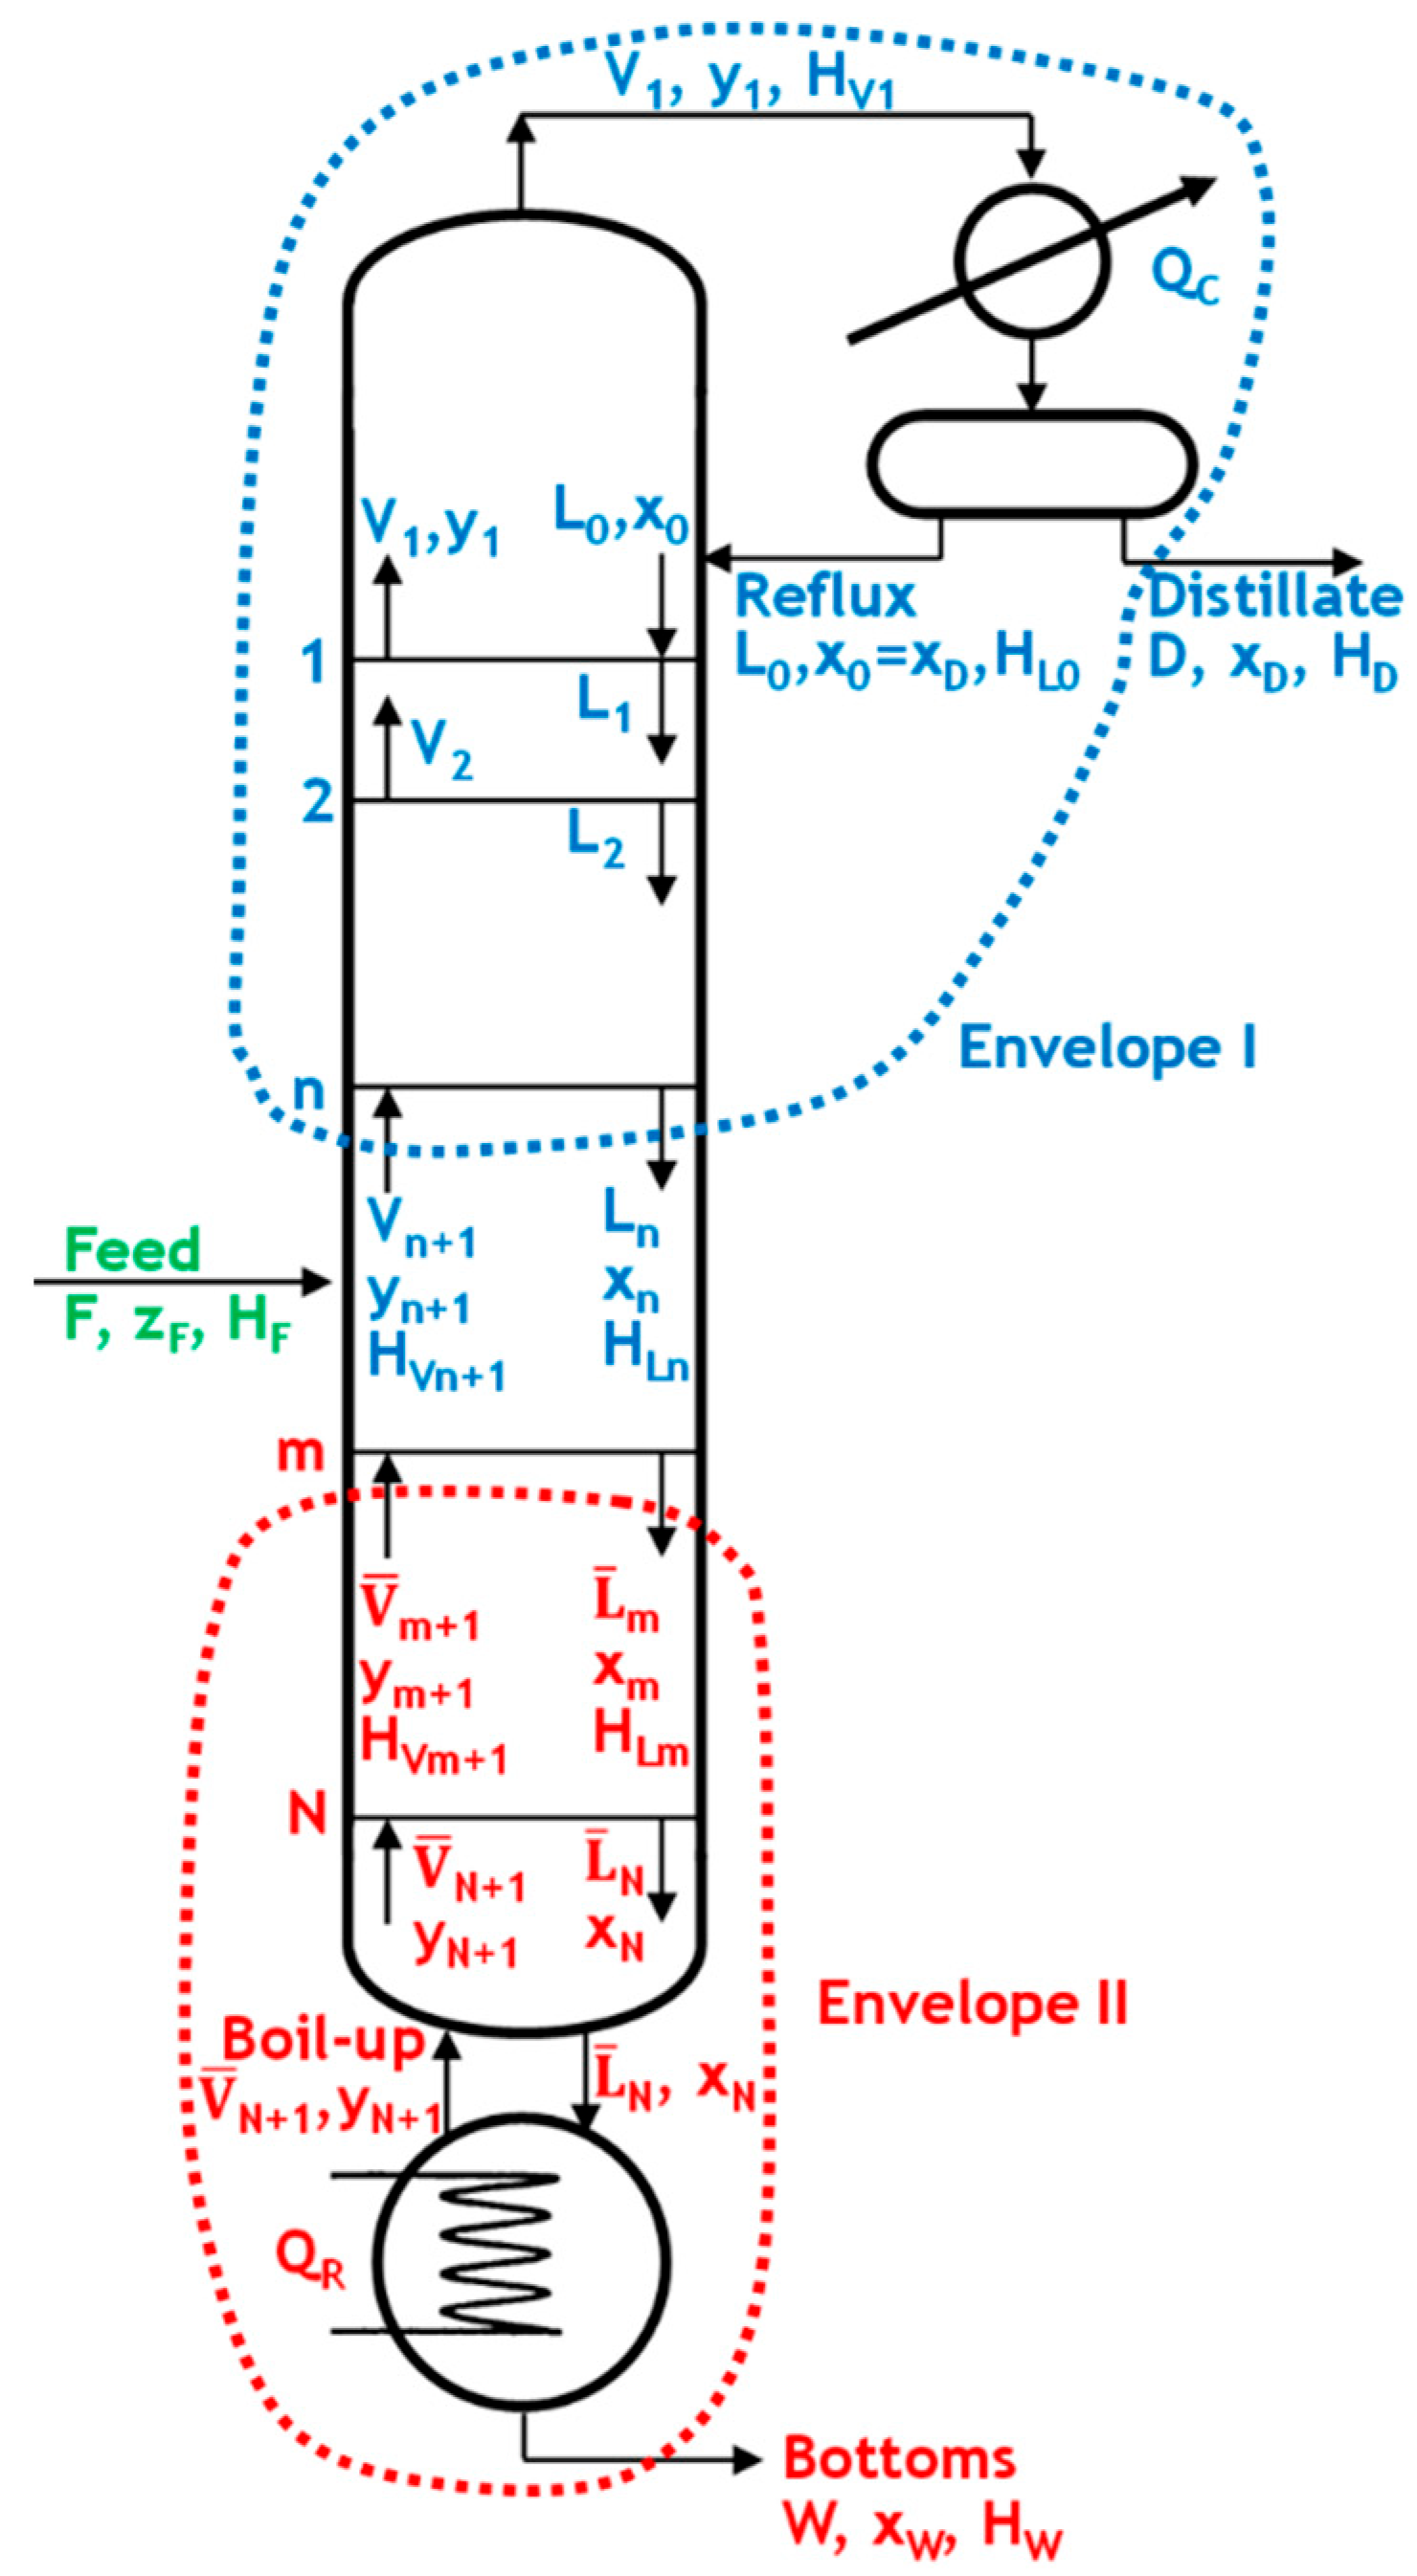
Figure 1 illustrates a representation of a characteristic distillation column with its major accessories, including a feed stream and a distillate and bottoms stream.
3.1. First Method (Analytical)
As shown in
Figure 1, we will examine the enriching section between trays 1 and n (envelope I). The material balances for the entire section are given below.
Plugging Equation (2) into Equation (3) yields the following:
Internal reflux ratio is given by
The energy balance for the entire rectifying section is given by
Substituting Equation (2) into Equation (8) yields the following:
Internal reflux ratio in the enriching section is given by
The stripping section (
Figure 1) will be examined between stages m and N (envelope II). The material and energy balances for the entire section are given below:
Equation (13) can be inserted into Equation (14) to yield the following result:
Internal reflux ratio is given by
The energy balance for the entire stripping section is given by
Substituting Equation (13) into Equation (19) yields
Internal reflux ratio in the stripping section is given by
Substituting Equation (12) into Equation (21) and inverting, the result yields the following:
If m = N, it indicates the last stage in the column, and we obtain the boil-up ratio as follows:
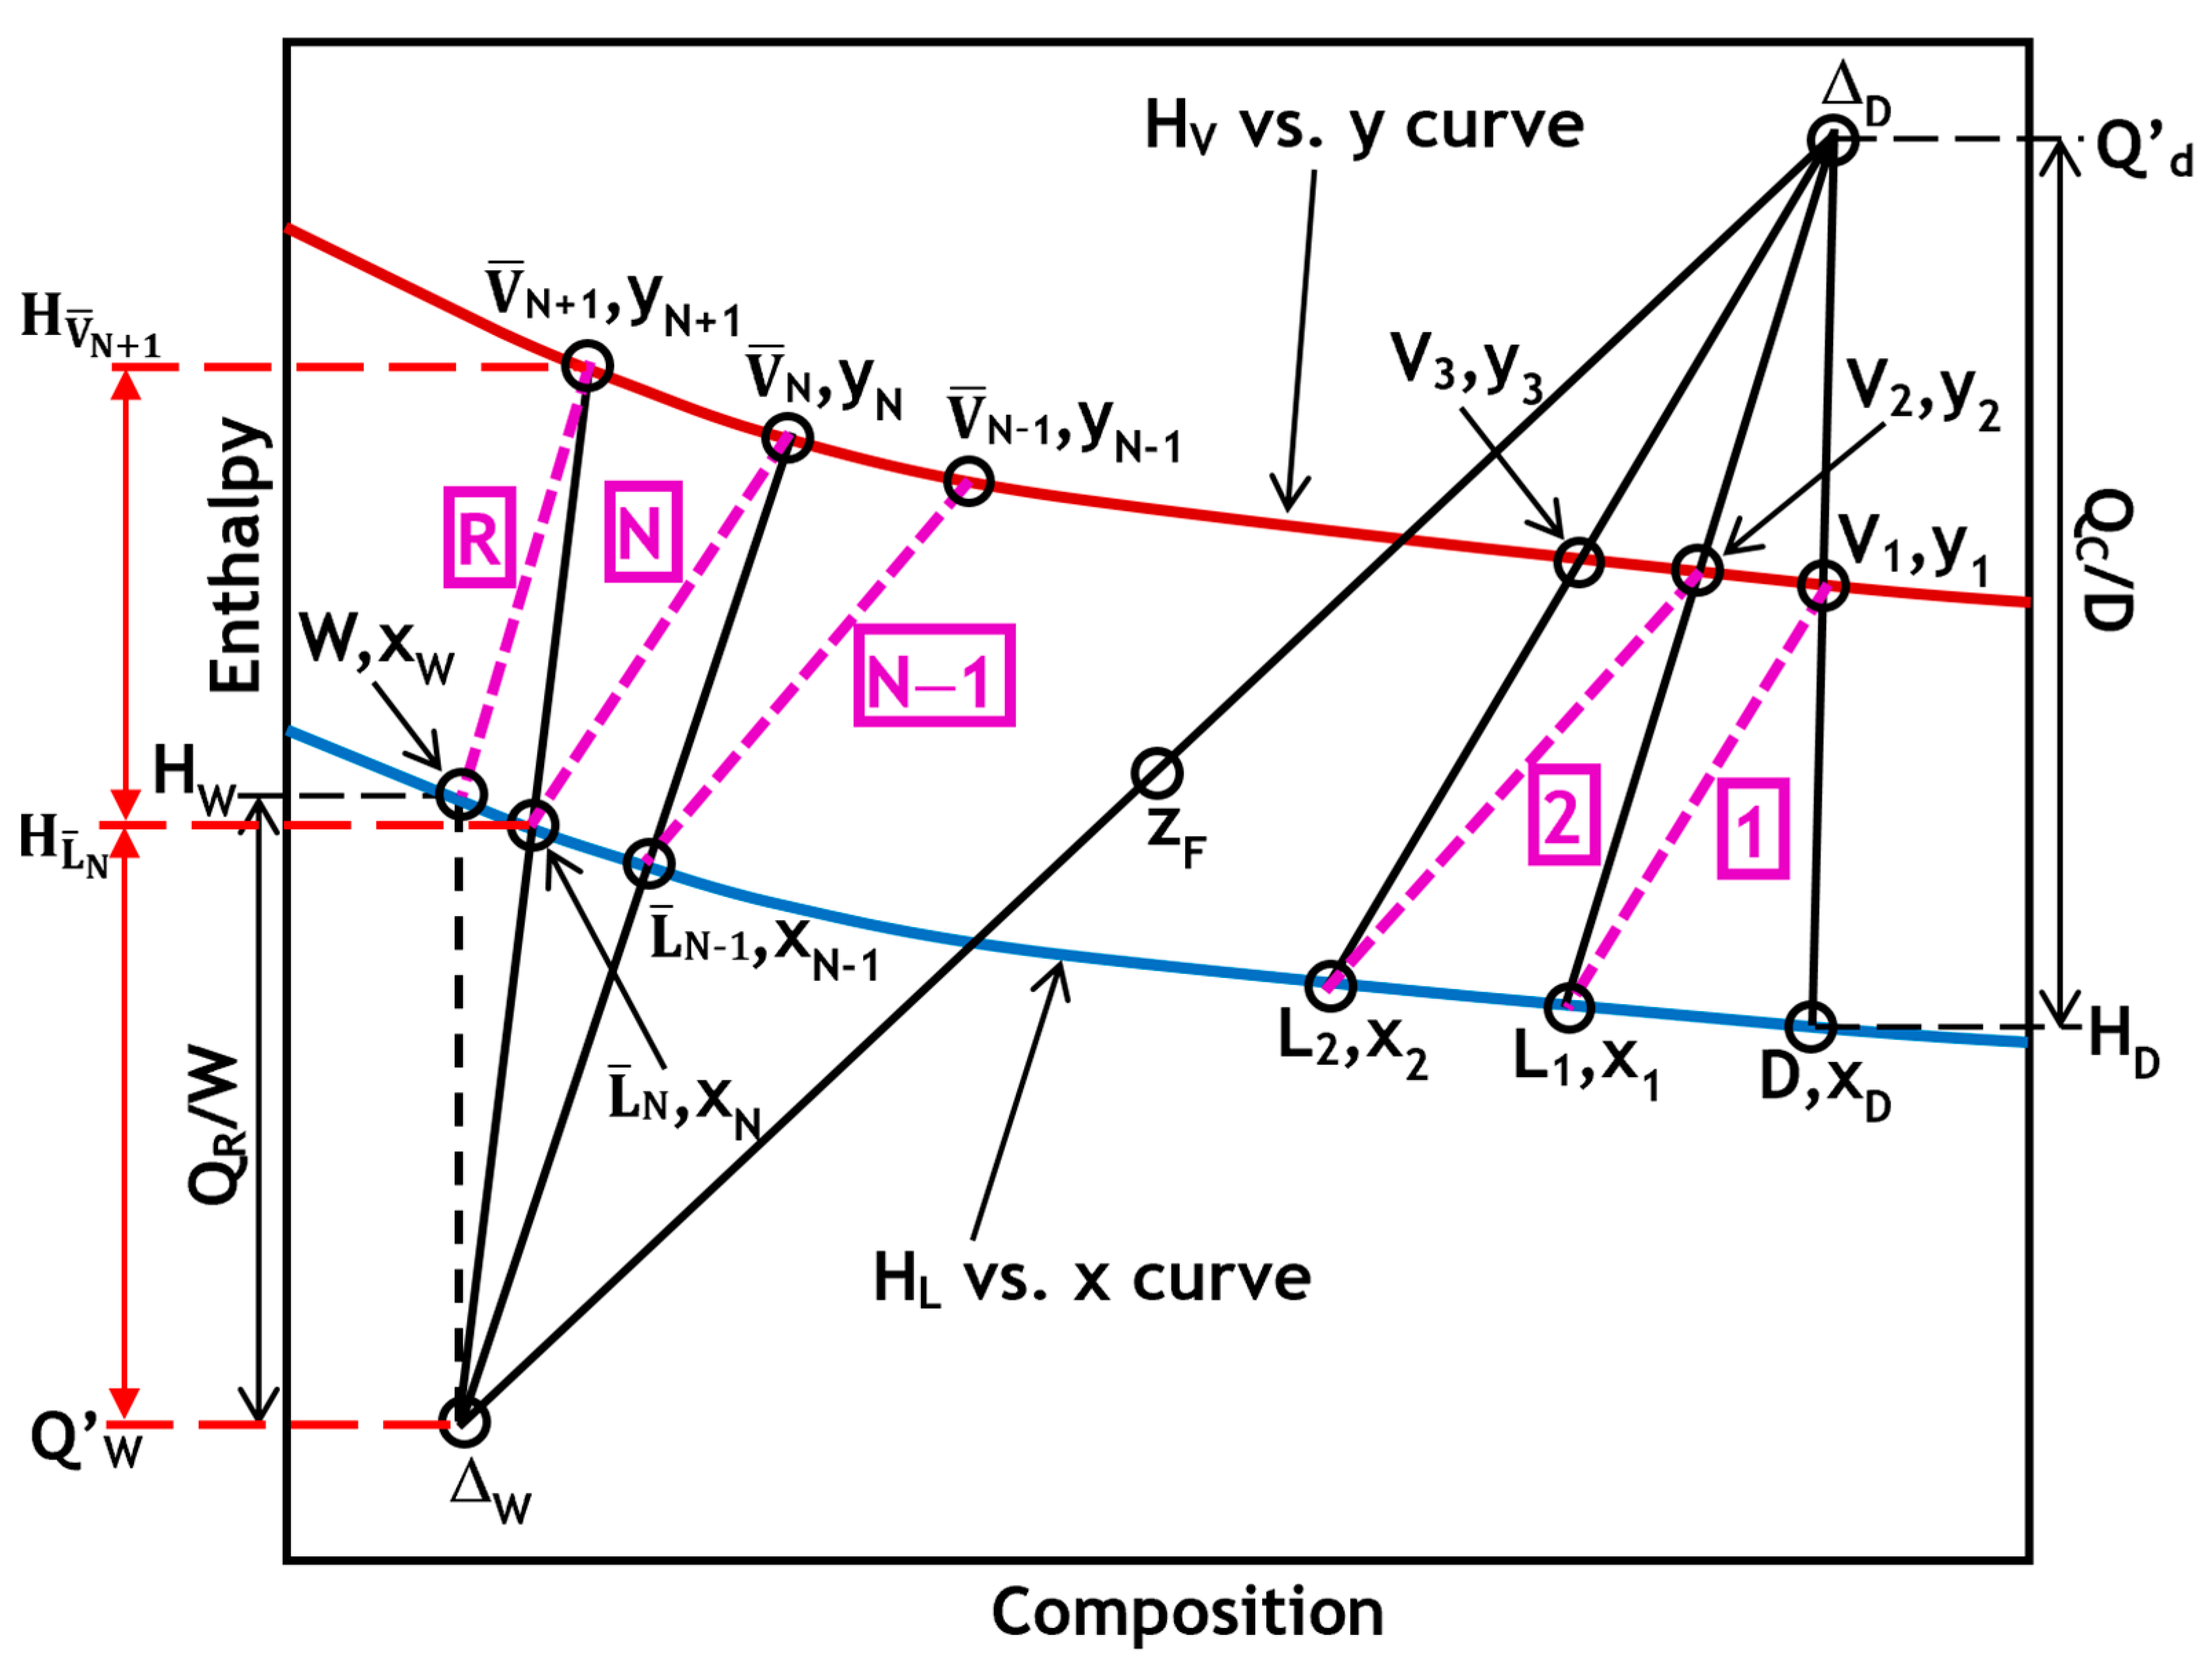
Figure 2 shows the Ponchon–Savarit method plot for distillation columns and highlights the determination of the boil-up ratio. Based on Equation (24) and
Figure 2, the boil-up ratio V
B can be evaluated graphically using the plot’s ordinates. The boil-up ratio is represented by the ratio of the length of the line
to the length of the line
. Alternatively, it can be represented by the ratio of the distance between points
and
to the distance between points
and
. In
Figure 2, these distances are indicated in red along the left side of the y-axis.
3.2. Second Method (Graphical)
The reboiler duty Q
R can be expressed as a function of the heat of vaporization of the vapor,
, which is measurable on the diagram by the height
When N is high, Equation (25) is equivalent to
The boil-up ratio is given by
As shown in
Figure 2 and using Equation (27), the boil-up ratio can be determined by dividing the length of the line
by the length of the line
.
It is important to note that the results of the two methods used to determine the boil-up ratio were nearly identical. These methods can be used interchangeably, especially in cases involving a higher number of stages in the distillation column.
4. Determination of Minimum Boil-Up Ratio
In a distillation column, minimum boil-up refers to the lowest vapor flow rate essential to accomplish the wanted separation of components. At this point, the column is operating at its thermodynamic limit. In other words, while the separation is theoretically possible, achieving it would require an infinite number of stages. This concept is similar to the minimum reflux ratio. Operating at or near the minimum boil-up rate is impractical due to inefficiency. For instance, an excessive number of stages would be required, thereby increasing the size and cost of the column. Therefore, distillation columns are typically designed to function at a boil-up rate higher than the minimum to balance efficiency and cost.
The minimum reflux ratio (R
min) is the maximum ratio necessitating an infinite number of stages to complete the desired separation. R
min corresponds to the minimum condenser cooling and reboiler heat loads necessary for separation. The method for determining R
min is well documented in various textbooks [
3,
5].
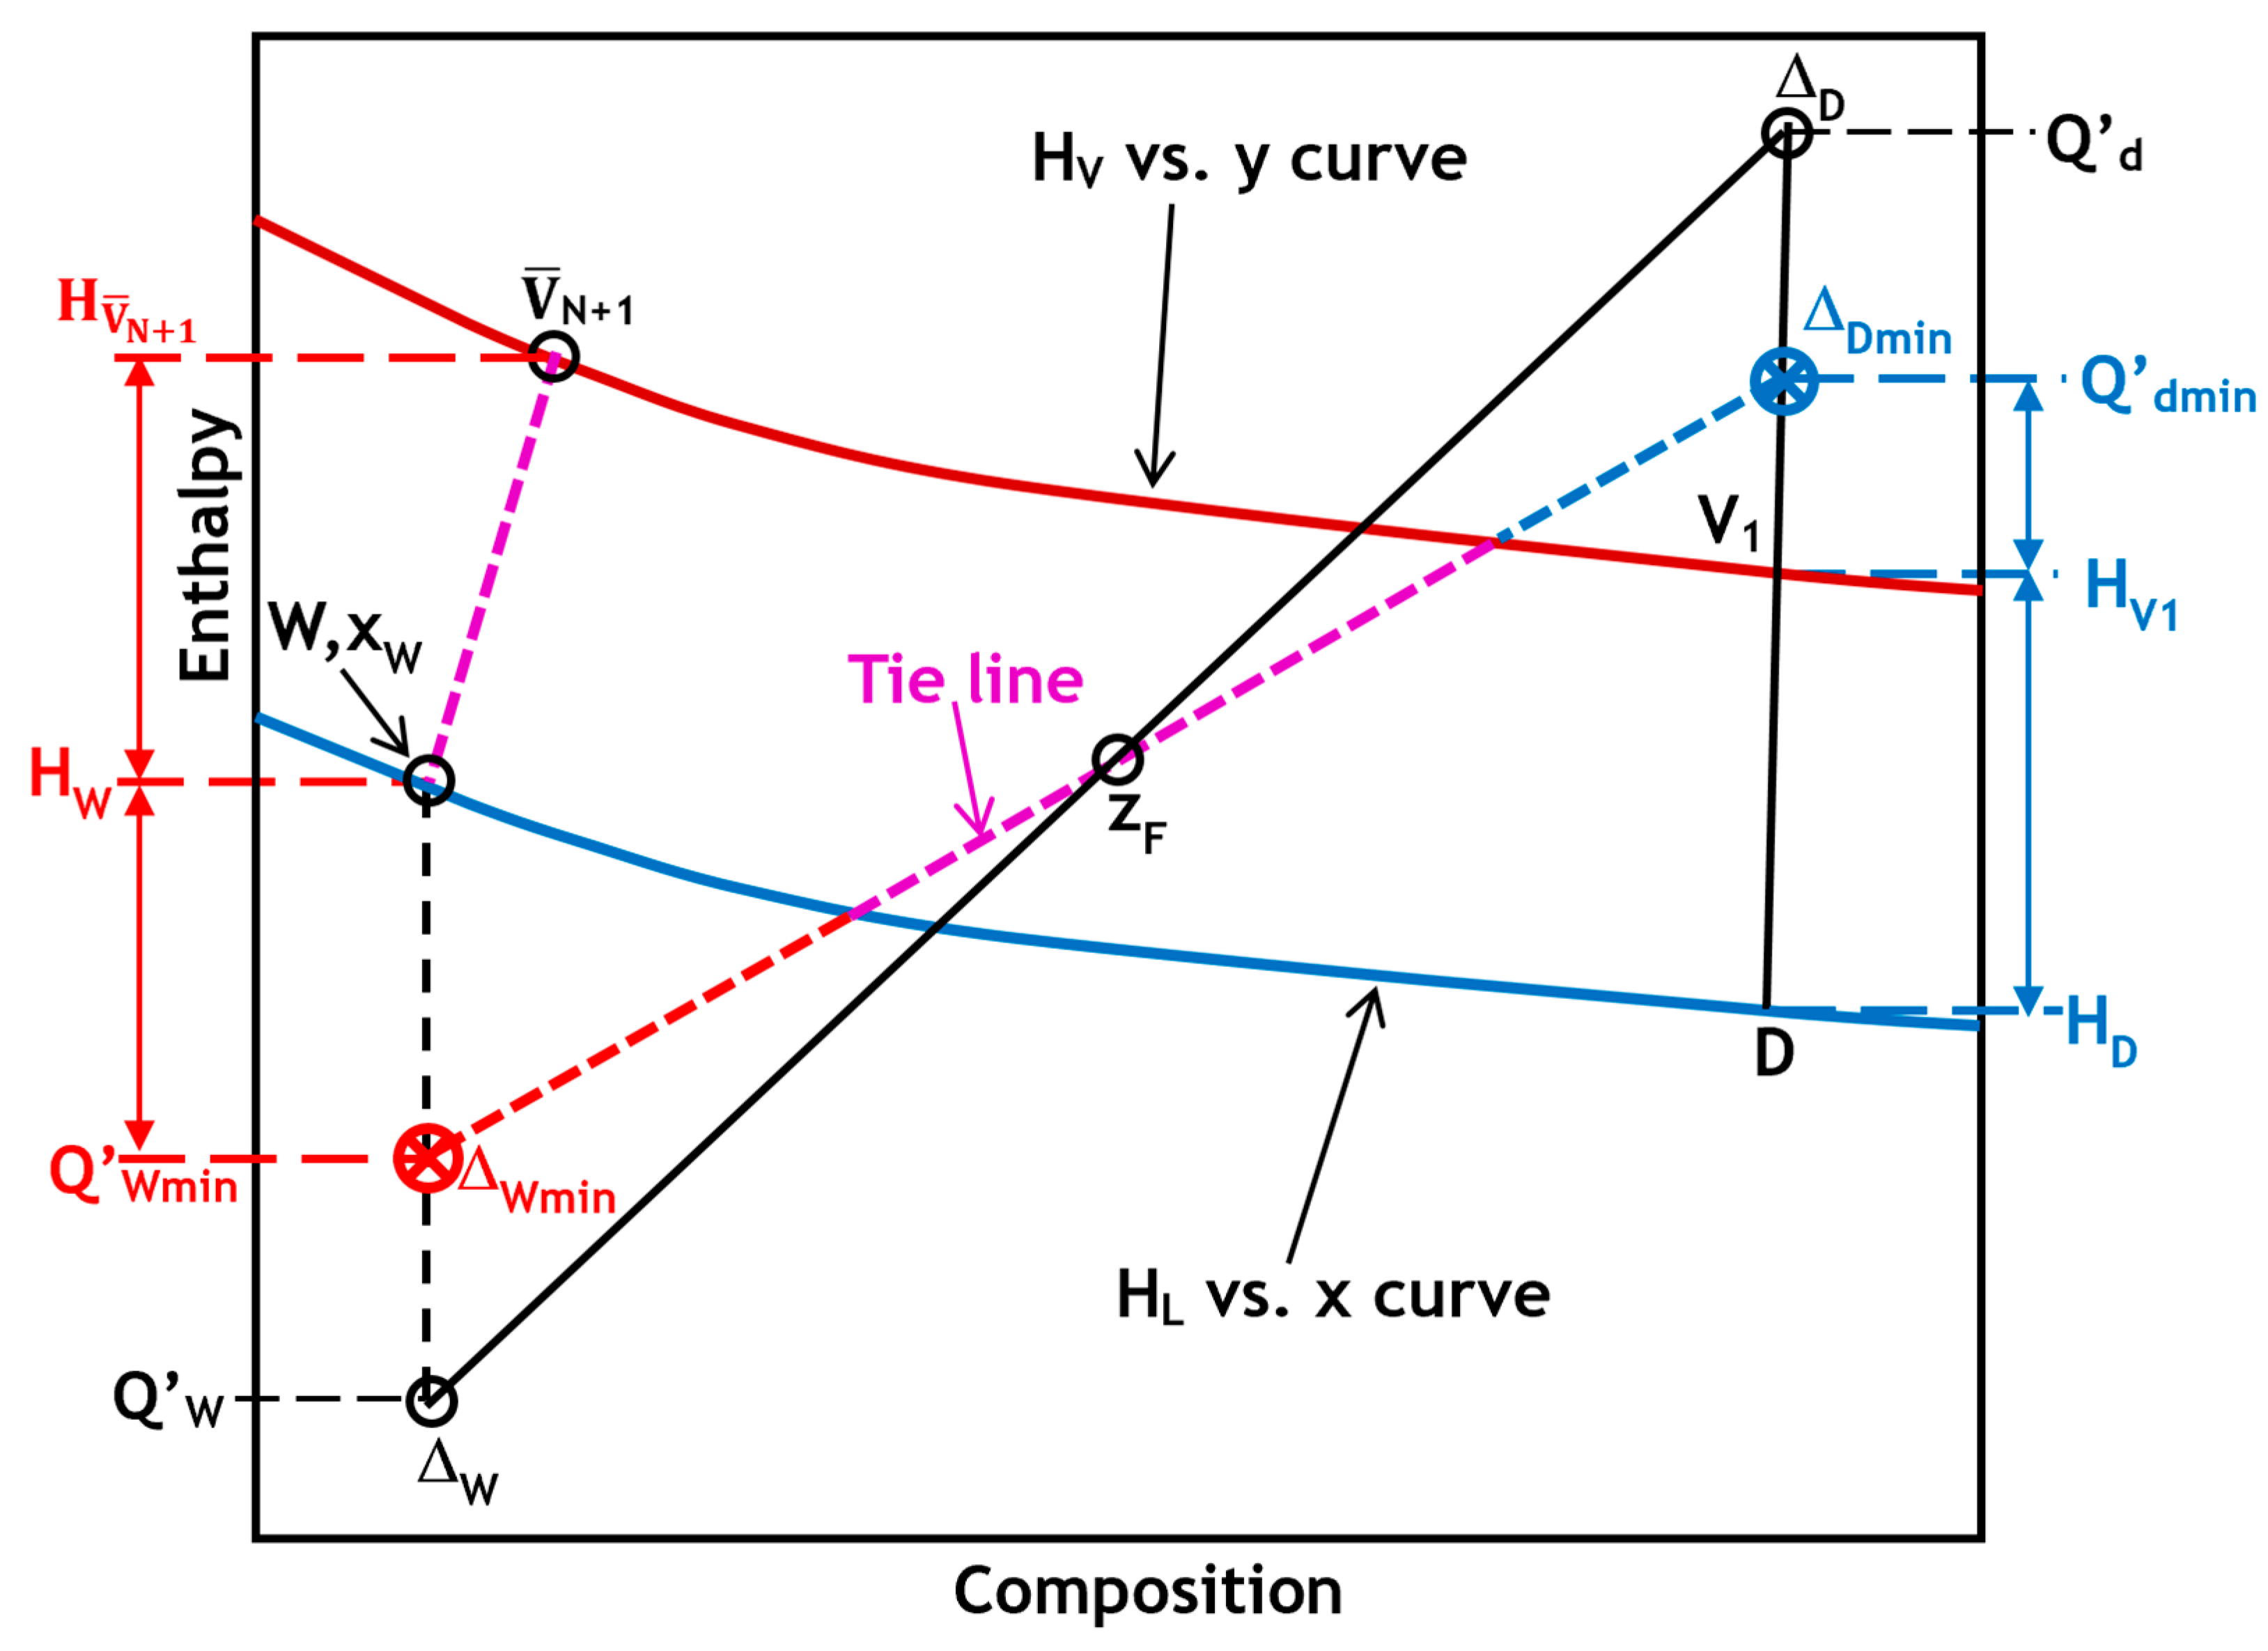
When operating at the minimum reflux ratio, the system necessarily exhibits a pinch point on the enthalpy–composition diagram. This occurs when the line extending from Q′
d or Q′
W aligns precisely with a tie line, indicating the vapor–liquid pair (x, y) that defines the location of the limiting separation. As described in Equation (27), the reflux ratio is inversely linked to the enthalpy difference between point V
1 and Q′
d. In other words, the closer Q′
d is to the composition axis, the less reflux is required. In typical mixtures, this alignment is most often observed when the Q′
d–Q′
W line intersects the tie line through the feed composition F. However, in strongly nonideal mixtures, the governing tie line may not pass through F but instead crosses the vertical line at x = z
D at a point offering the smallest enthalpic separation. This alternative tie line thus defines the actual pinch condition, from which the minimum reflux ratio can be precisely computed using Equation (28), as illustrated in
Figure 3.
As previously mentioned, the minimum reflux ratio is similar to the minimum boil-up ratio. Therefore, as indicated by the red color on the left side of
Figure 3, the minimum boil-up ratio can be determined in the same manner. According to Equation (29), which is derived from Equation (27), the boil-up ratio is inversely proportional to the distance from W to Q′
Wmin. In other words, the boil-up ratio is proportional to how far Q′
Wmin is from the composition axis, or how close it is to the saturated liquid curve. Thus, the minimum boil-up ratio can be determined as follows:
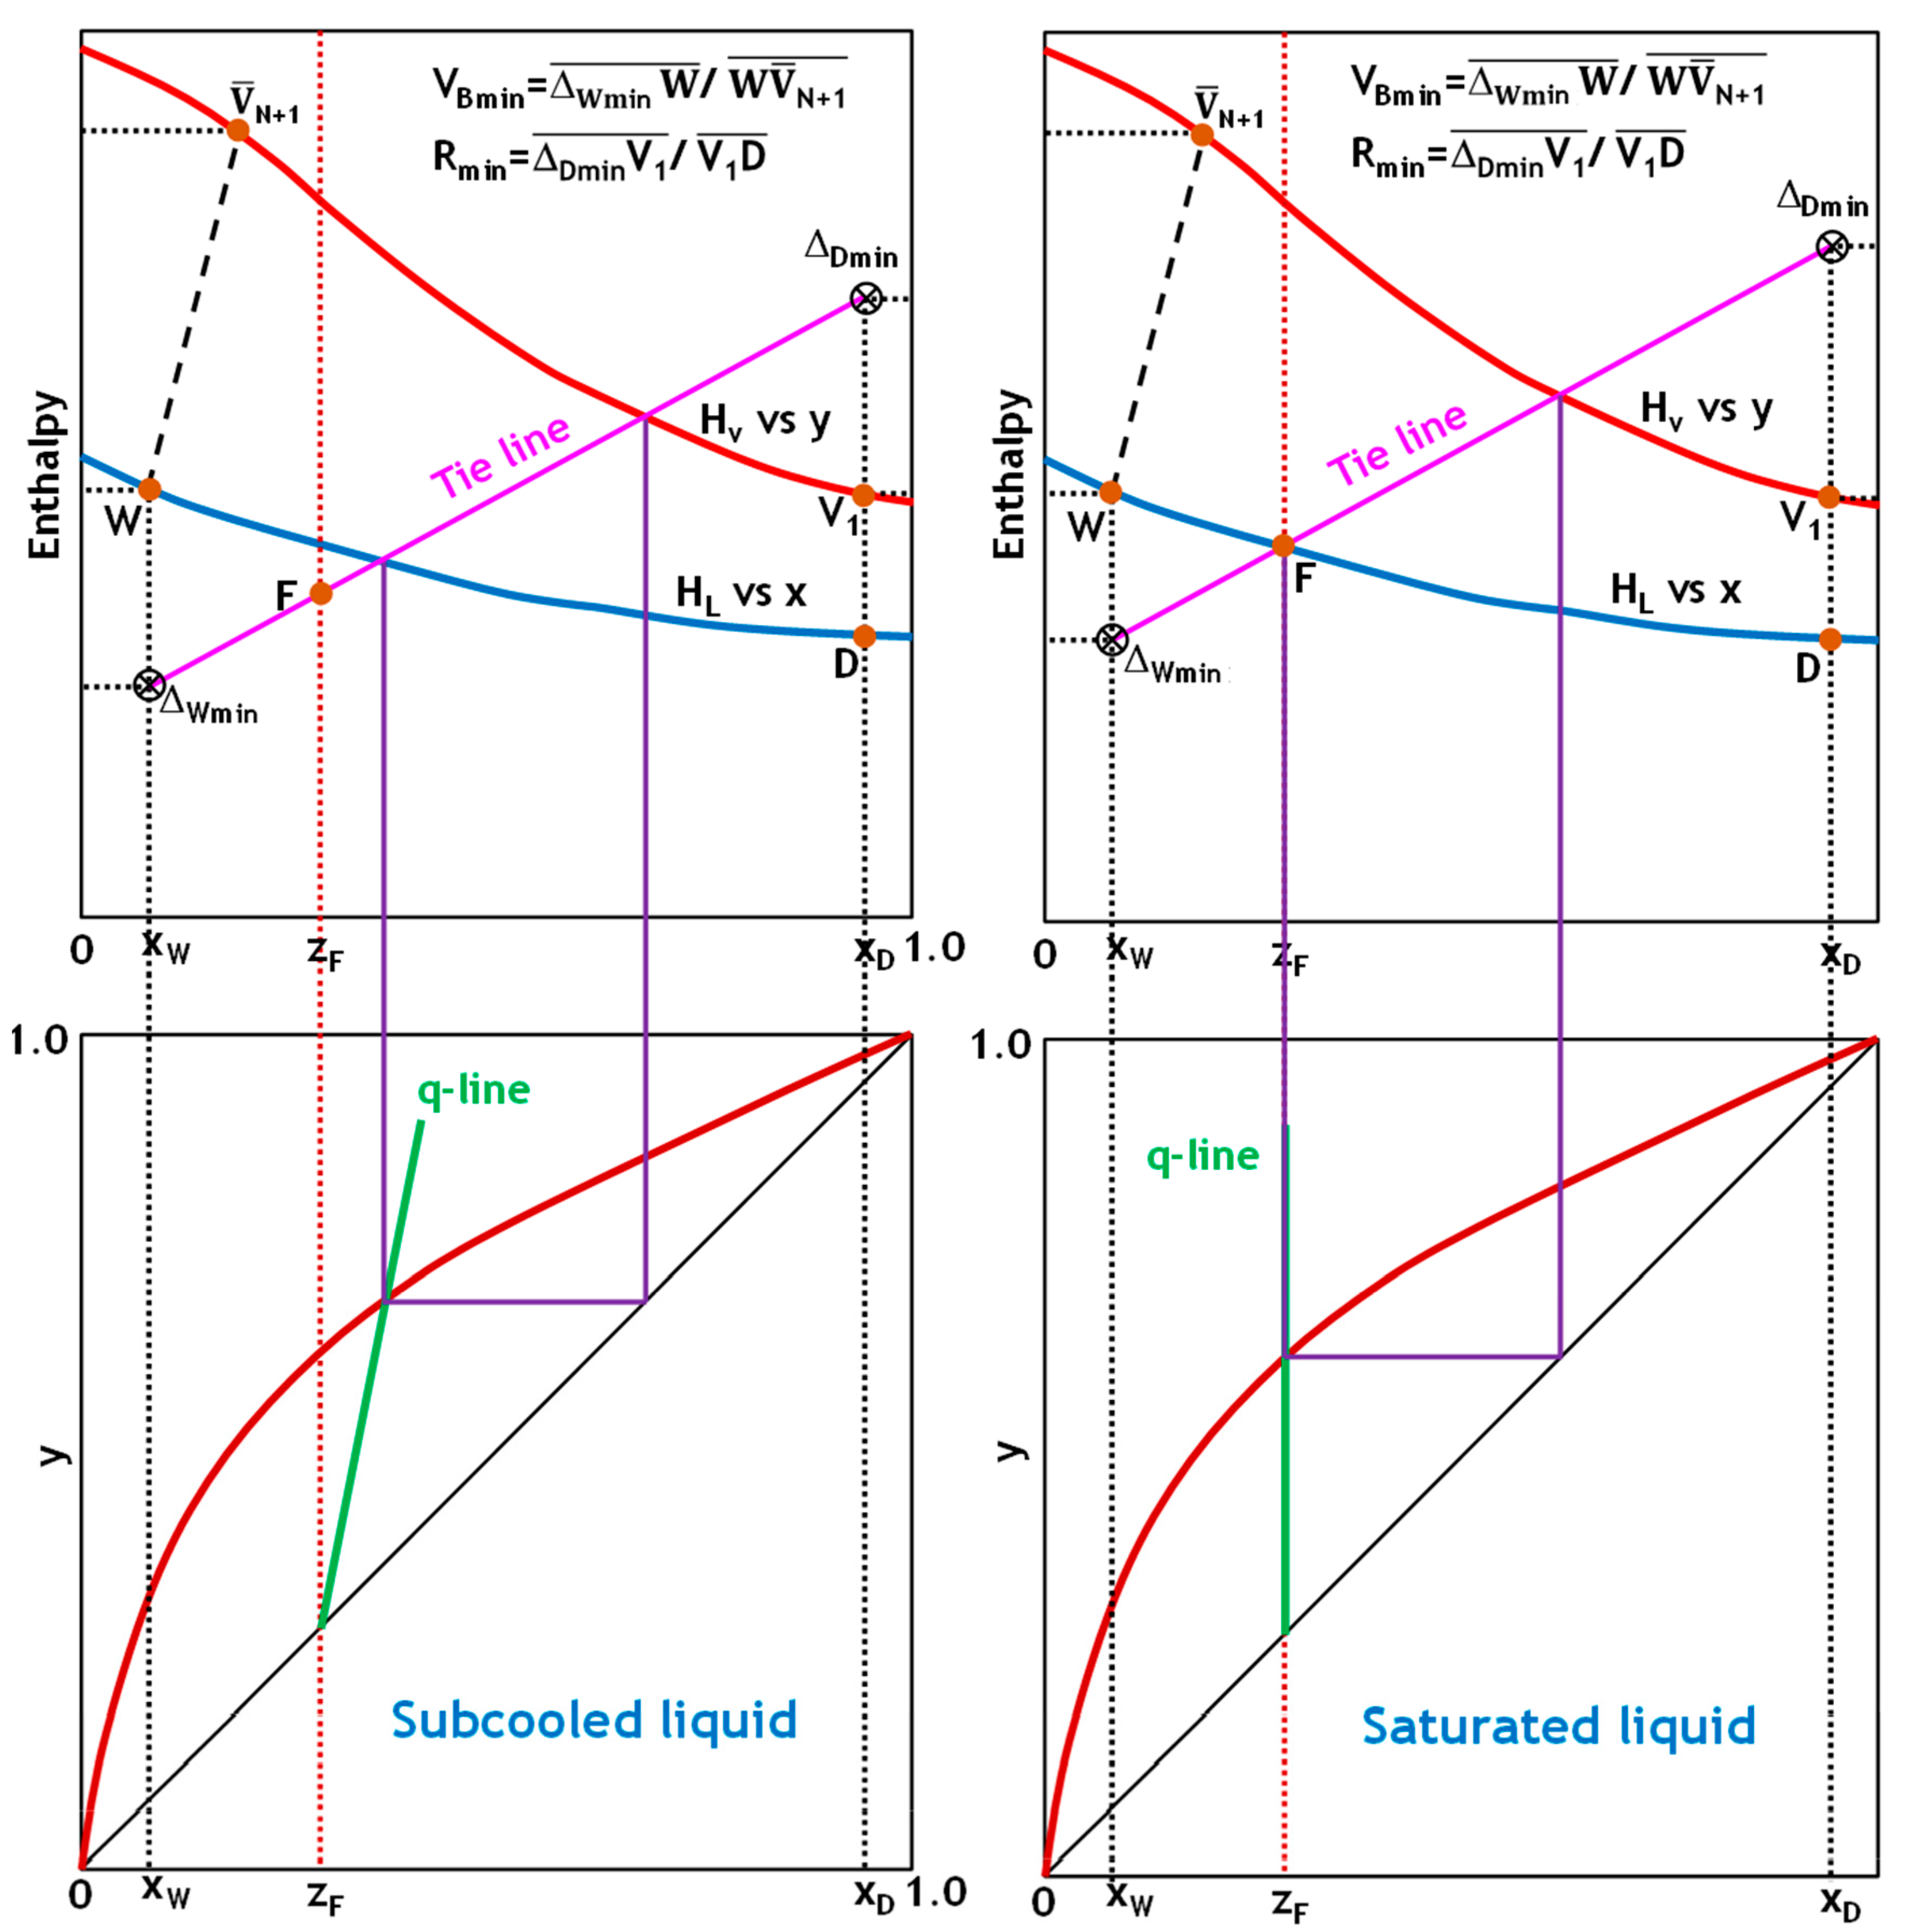
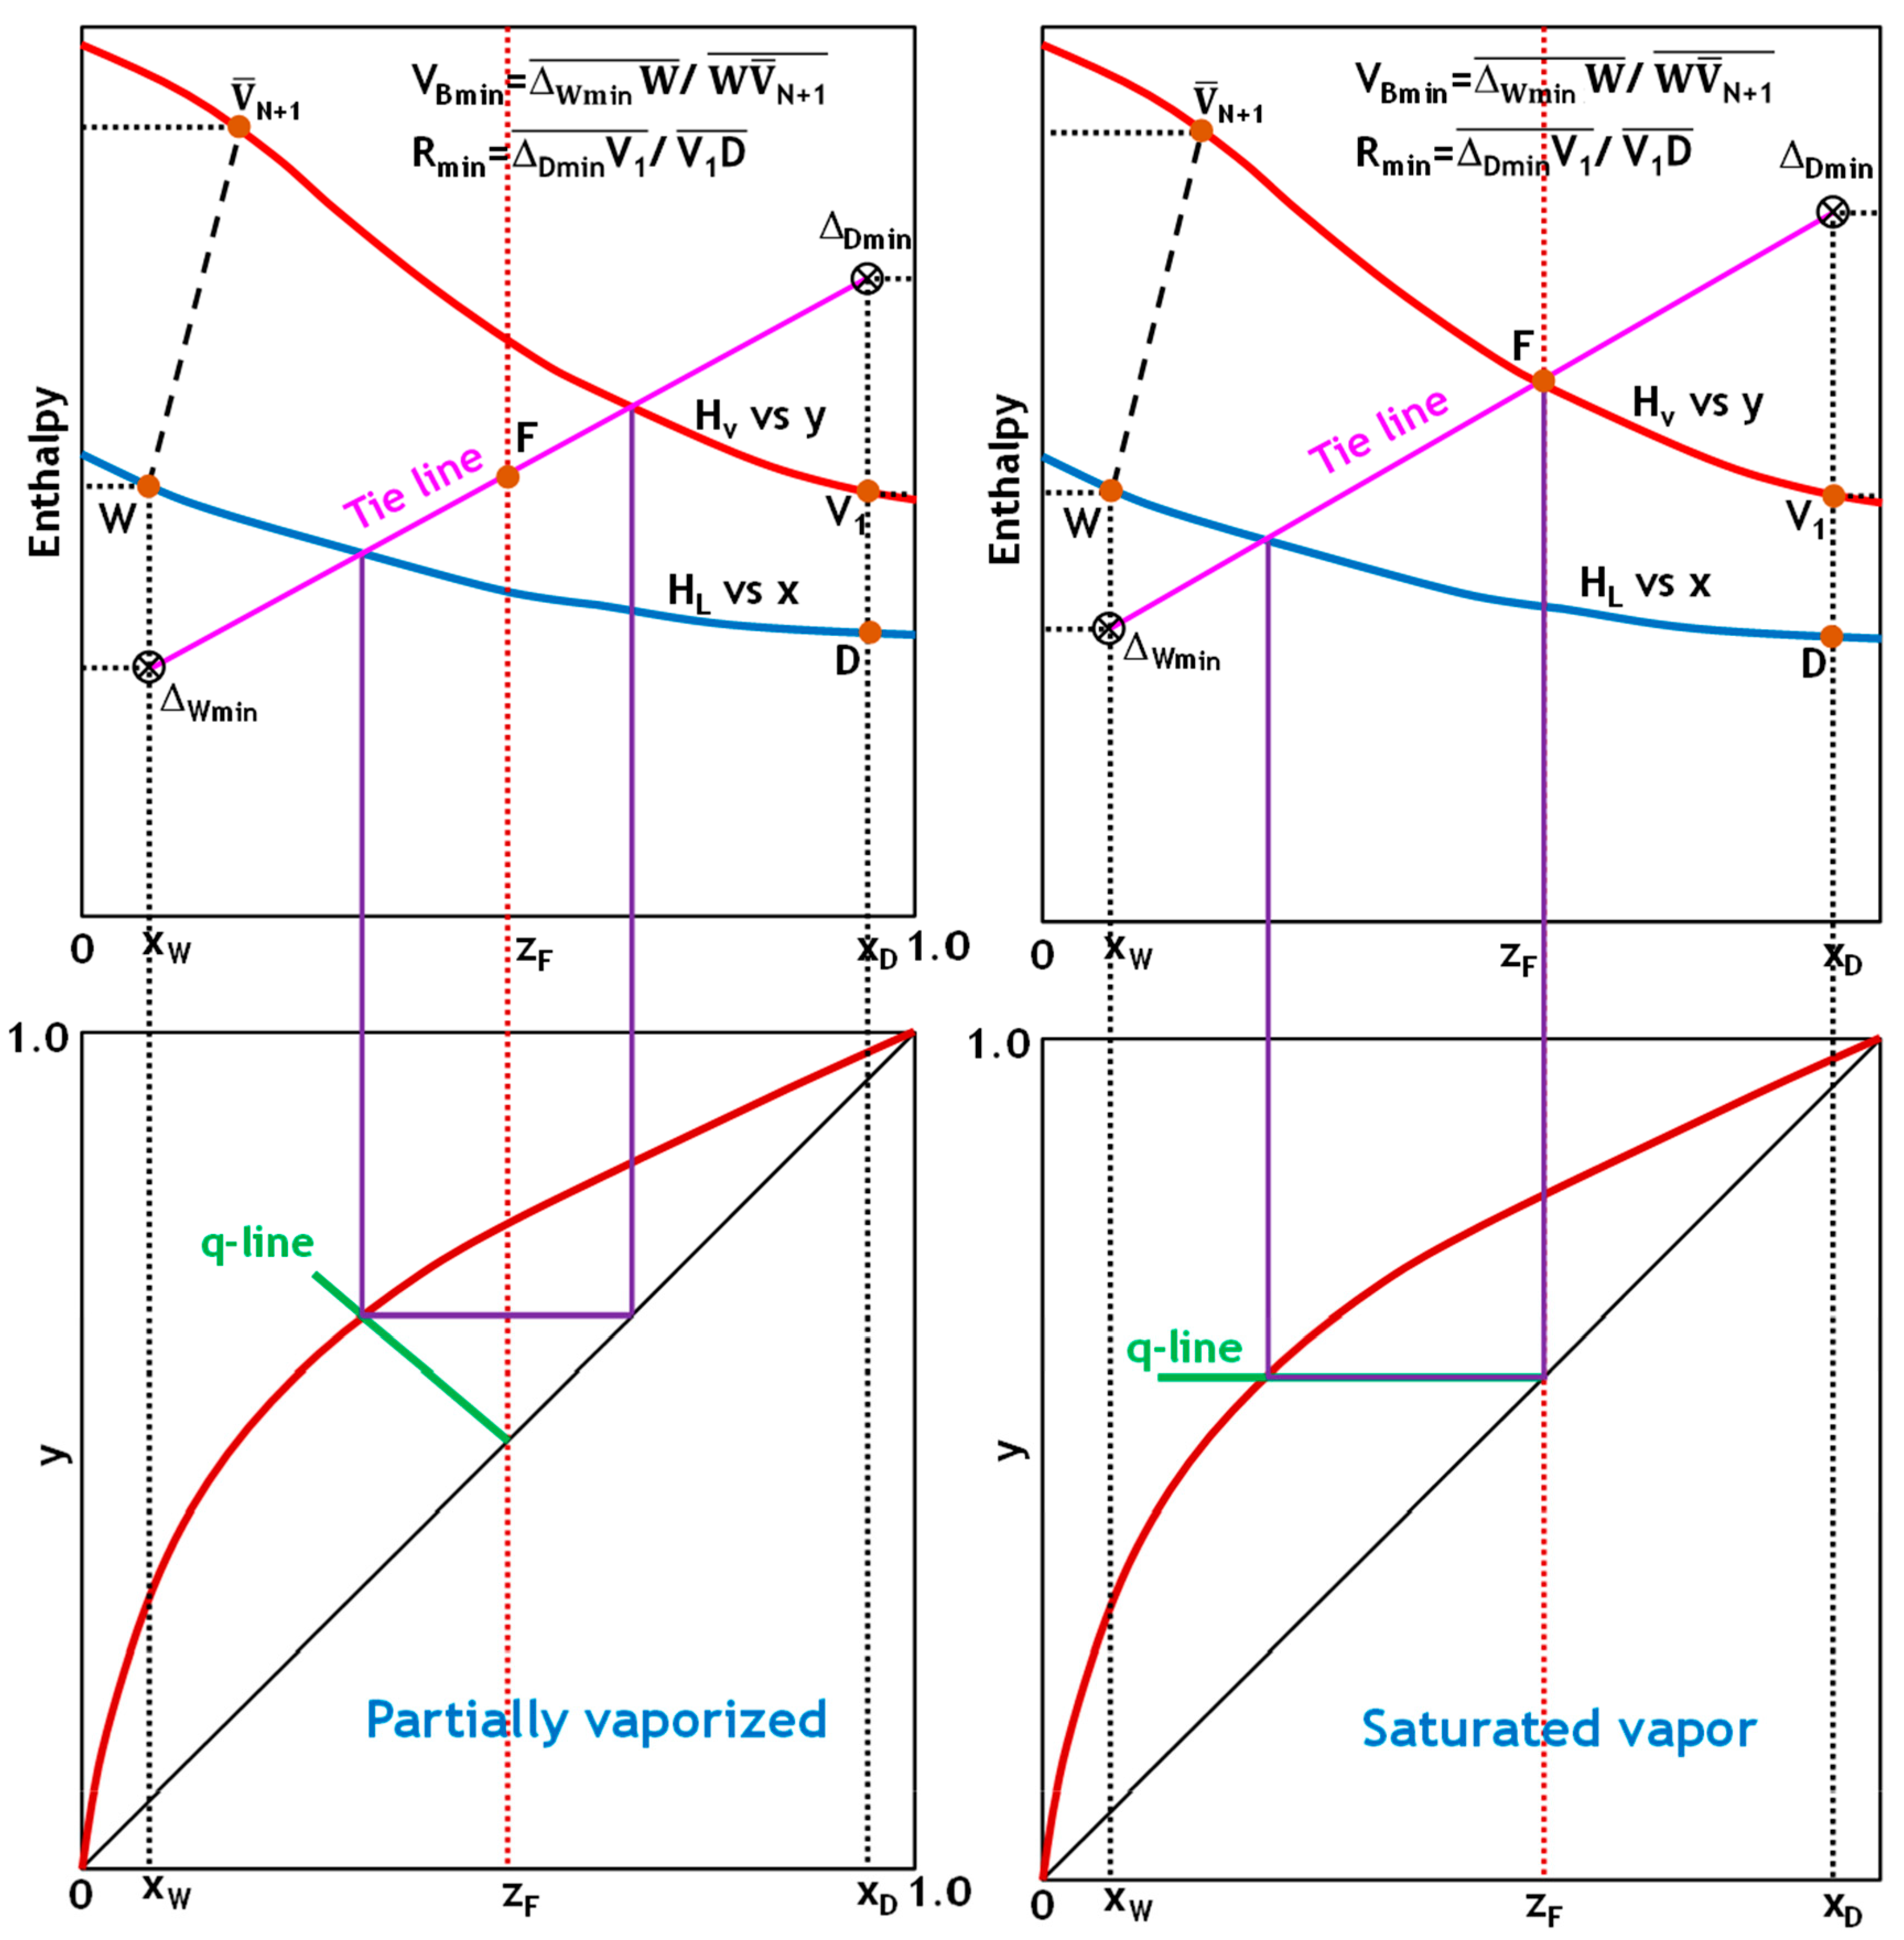
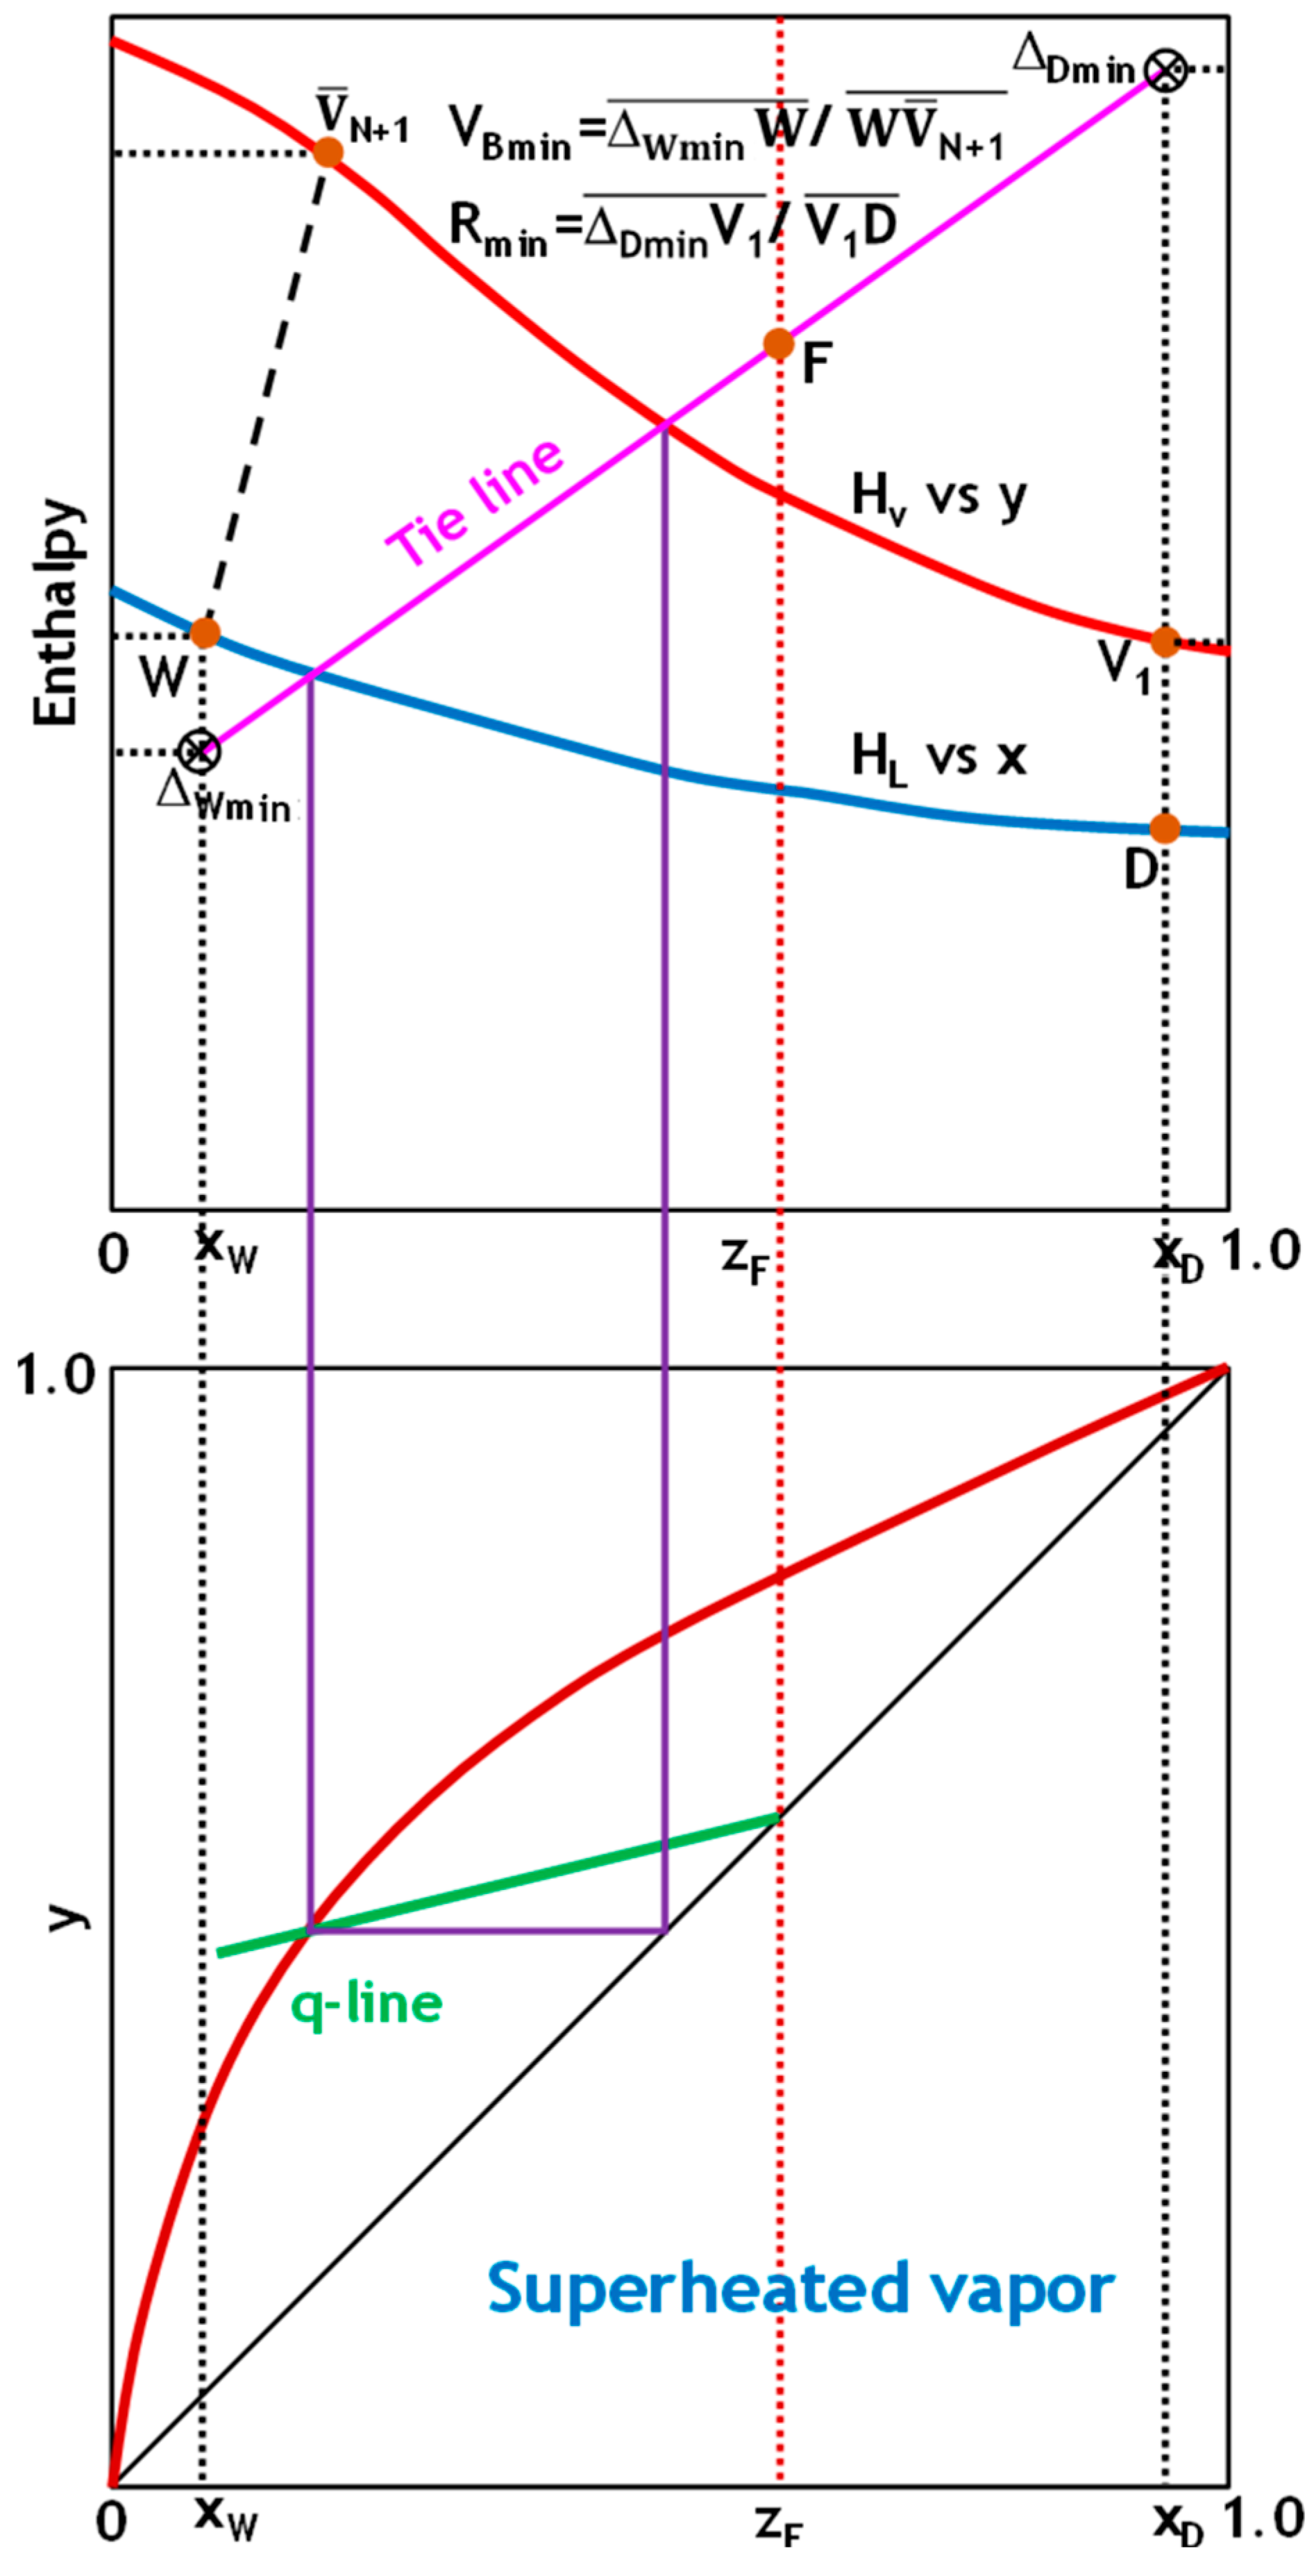
To demonstrate the robustness and general applicability of the implemented graphical analysis approach, the V
Bmin determination method was systematically applied to the five common thermal states of feed encountered in distillation operations (
Figure 4,
Figure 5 and
Figure 6). Evaluating the method across this comprehensive range of thermal conditions validates its reliability and usefulness in designing and optimizing processes under varying feed enthalpy scenarios.
Figure 4,
Figure 5 and
Figure 6 demonstrate how to determine the minimum reflux and boil-up ratios using the Ponchon–Savarit technique for the five states of the feed stream. In all cases, plotting the q-line of the feed on an x-y diagram intersects with the equilibrium distribution curve at a single point. This intersection point represents a tie line that, when projected onto an H-x,y diagram, passes through the feed point. Extending this tie line to intersect the x = x
D and x = x
W lines yields Δ
Dmin and Δ
Wmin. V
Bmin and R
min can then be determined using Equation (29), as shown in
Figure 4,
Figure 5 and
Figure 6.
In highly nonideal binaries that exhibit positive deviations or approach the critical locus of the component with higher volatility, the conventional tie line through the feed in the enriching section does not represent the tightest vapor–liquid relationship. Instead, one must consider all enriching-section tie lines and select the one that intersects the distillate-composition vertical (x = xD) at the maximum vapor fraction. Conversely, for mixtures with negative deviations, the controlling pinch lies at the stripping section tie line that intersects the bottoms composition vertical (x = xW) at the minimum vapor fraction. These extremal tie lines, rather than the feed-through line, pinpoint the limiting driving force in each section.
Once the enriching and stripping extremal intersections (labeled ΔDmin and ΔWmin, respectively) are located, the minimum boil-up operating line is established by plotting a straight line through ΔDmin, the feed point F, and ΔWmin. This ensures that ΔDmin, F, and ΔWmin are co-linear, creating the strictest possible approach pinch on the vapor-liquid equilibrium curve. If the enriching section intersection is higher than the stripping intersection, the rectifying section dictates the minimum boil-up. The opposite is true when the stripping-section intersection is lower.
When there are multiple feeds or side streams, each inter-section must be treated independently. Extreme tie lines are found for each feed-to-side stream segment, and all feed and withdrawal points are connected by a single straight line. The overall minimum boil-up ratio is determined by the most restrictive pinch point among these segments. This systematic approach ensures that the mass and energy balance constraints of each section are satisfied at the true limiting driving force.
5. Implemented Ponchon–Savarit-Based Method vs. Alternative Binary Distillation Techniques
The technique implemented in this work is built on the Ponchon–Savarit enthalpy–composition construction, which couples material and energy balances on the H-x,y diagram. Since the Ponchon–Savariti method does not rely on the CMO assumption, it can easily handle subcooled and superheated feeds, as well as significant heat effects. Additionally, the method explicitly defines the condenser and reboiler duties, as well as the internal flows. In this framework, VB and VBmin are derived from enthalpy segments and pinch conditions on the H-x,y plot (i.e., the limiting case requiring infinite stages).
For binary mixtures for which the CMO approximation is valid, the McCabe–Thiele method provides a quick overview via straight operating lines. The stripping section line has a slope of (VB + 1)/VB, and VBmin is defined at the pinch point where the operating lines intersect the equilibrium curve (infinite stages). These relationships make VB and VBmin easy to determine, provided the CMO approximation is valid. However, the McCabe–Thiele method can produce inaccurate boil-ups when heat effects or the feed’s thermal state violate the CMO approximation. In such cases, the Ponchon–Savarit-based construction implemented in this paper is preferred because it explicitly incorporates the energy balance.
The FUG (shortcut) method is excellent for determining targets such as Rmin via Underwood and stage estimates via Gilliland. However, it does not provide VB directly. Converting R to VB requires CMO-type relationships between section flows and thus inherits those assumptions. In contrast, the Ponchon–Savarit-based technique developed in this work reads VB and VBmin directly from the enthalpy–composition diagram independently of the CMO. This is advantageous whenever energy effects matter.
Once the thermodynamics are specified, full stage-wise simulations can accurately calculate the boil-up and identify the minimum-energy pinch point. These simulations are ideal for detailed designs. The implemented Ponchon–Savarit–based method provides transparent graphical diagnostics of duties and pinches in the binary case, offering a complementary approach. This method provides physical insight and reliable starting points that can be confirmed by rigorous models.
To assess the accuracy of the proposed integrated analytical and extended Ponchon–Savarit graphical method, both V
B and V
Bmin values were systematically compared with those obtained from established graphical and non-graphical techniques. For V
B, the graphical enthalpy-segment approach was benchmarked against the analytical expressions derived from global mass and energy balances (
Section 3.1) and, under CMO conditions, against the McCabe–Thiele construction. For V
Bmin, the extremal tie-line graphical procedure was cross-checked with values inferred from minimum reflux ratios calculated via the Underwood method and converted to boil-up ratios, as well as from rigorous stage-wise simulations. Across all tested binary mixtures, feed thermal states, and non-ideal scenarios, the proposed method yielded results in close agreement with these alternative approaches, with differences falling within diagram-reading or numerical-rounding tolerances. This concordance confirms that the method not only matches the accuracy of established techniques but also extends applicability to cases where CMO assumptions are invalid, while retaining the transparency and physical insight of a fully graphical framework.
Scope and Multicomponent Extension
The methodology presented in this work is formulated for binary systems, for which the enthalpy–composition diagram is two-dimensional and the tie lines can be represented unambiguously. Directly extending it to multicomponent mixtures is not trivial because the enthalpy surface becomes multidimensional and cannot be represented on a single H-x,y plot without projection or reduction.
A conceptual pathway for multicomponent adaptation involves three methods: (1) pseudo-binary sectioning, in which the column is divided into sections where the separation is dominated by two key components, with the remaining components grouped into pseudo-components; (2) enthalpy-mixing lines, constructed for each pseudo-binary pair using averaged or lumped enthalpy data. These lines are constructed using averaged or lumped enthalpy data for each pseudo-binary pair. This allows for a two-dimensional projection of the multicomponent enthalpy surface; and stagewise energy mapping involves projecting stagewise enthalpy balances from rigorous simulations onto pseudo-binary diagrams. This allows pinch points to be identified and VB and VBmin to be estimated graphically. These adaptations require the following assumptions: (i) the dominance of two key components in each section, (ii) the negligible impact of minor components on the enthalpy–composition relationship within each section, and (iii) the availability of accurate multicomponent vapor-liquid equilibrium and enthalpy data for the pseudo-binary reduction. Without these assumptions, the method is not directly applicable to multicomponent systems, particularly those with strong nonidealities, multiple azeotropes, or significant cross-component enthalpy effects. In such cases, rigorous multicomponent simulations are necessary.
6. Conclusions
Two rigorous frameworks for determining the boil-up ratio in binary distillation were developed. The first method uses global material and energy balances in the enriching and exhausting sections to derive the internal liquid and vapor flow requirements. This yields an analytical expression for the boil-up ratio based on enthalpy differences. The second method uses the Ponchon–Savarit enthalpy–composition diagram to graphically extract the boil-up ratio from the ratios of marked enthalpy segments. Both approaches trace the same thermodynamic driving forces from complementary analytical and graphical perspectives. When applied to columns with a large number of stages, the boil-up ratios obtained by each method were essentially identical. This concordance confirms the validity of using global-balance equations or direct enthalpy-diagram quantities for accurate design. The graphical method enhances intuitive understanding by visualizing ΔW and heat duties. The balance-based approach offers straightforward algebraic computation when rigorous stage wise data are available. Together, these methods provide process engineers with versatile tools: one offers quick graphical evaluation on the spot, and the other delivers precise calculations for detailed simulations. Using these methods interchangeably, especially for high-stage columns, ensures robust design choices and streamlined energy assessments, ultimately improving the speed and reliability of distillation column design in industrial practice.
A unified graphical methodology to determine the minimum boil-up ratio in binary distillation by extending the Ponchon–Savarit enthalpy–composition framework is used. VBmin can be extracted directly from enthalpy distances on the diagram by identifying extremal tie-line intersections (ΔDmin and ΔWmin), analogous to the reflux-pinch concept. This approach mirrors the well-established minimum reflux procedure, offering a clear physical interpretation and algebraic simplicity. Applying this method to the five canonical feed thermal states demonstrates its broad validity. For nonideal binaries with positive or negative deviations, selecting the controlling pinch line accurately estimates VBmin in the enriching and exhausting sections. This method overcomes the limitations of feed-through pinch assumptions for complex mixtures by selecting the controlling pinch line. The graphical VBmin construction can also accommodate multiple feeds and side-streams by treating each intersection independently and selecting the most restrictive pinch. Connecting all feed and withdrawal points through a single operating line reveals the true minimum boil-up constraint, satisfying mass and energy balances simultaneously. Consequently, this systematic graphical protocol provides process engineers with an intuitive, robust design tool that balances thermodynamic rigor with practical implementation for energy-efficient distillation column sizing.
