Abstract
In mountainous regions, forested areas, and other zones prone to natural disasters, power equipment faces heightened risks of shutdown. Such disruptions significantly elevate the risk of secondary cascading failures within the power grid. Consequently, devising cascading failure mitigation strategies from an operational perspective is of paramount importance for containing the spread of cascading failures in the power system during disasters and minimizing the losses incurred from disaster incidents. Firstly, based on the severity of natural disaster accident risks, this paper establishes a risk index for power equipment for the first time, providing a new perspective for the refined analysis of the development model of cascading failures in power systems. Subsequently, a new collaborative mitigation strategy for system cascading failures is proposed at the operational control level. This strategy, in conjunction with proactive prevention and control measures, aims to promptly sever potential cascading failure paths upon the occurrence of a disaster, thereby ensuring that the area of power outage is minimized to the greatest extent possible. The effectiveness of the proposed strategy is verified through simulation cases. The results show that in the scenario set in this article, the risk of cascading failures under natural disasters is nearly five times higher than that without natural disasters. At the same time, the cascading failure control method proposed in this study can reduce the risk of cascading failure by about 80%.
1. Introduction
In the context of global climate change, extreme weather and climatic events have occurred frequently [1]. According to statistics from the Chinese Electric Power Reliability Management Center, natural disasters and climatic factors are the primary causes of unplanned outages in overhead transmission lines [2]. The line failures triggered by natural disasters are unpredictable, and the resultant impacts heighten the risk of secondary cascading failures in power grids. Therefore, formulating cascading failure mitigation strategies at the operational level is of great significance in inhibiting the propagation of cascading failures in power systems during disasters and minimizing the losses incurred by disaster accidents.
To enhance the risk prevention capabilities of transmission lines and improve the operational reliability of overhead lines, extensive research has been conducted on the operational risk assessment of overhead transmission lines [3,4,5,6]. While the literature [7] divides the operational risk assessment process for overhead transmission lines into three stages: identification, quantification, and determination, it fails to provide a specific process for risk quantification. On the other hand, refs. [8,9] propose comprehensive operational risk assessment methods for overhead lines, with their assessment models and risk value calculation formulas offering insights and practical value. However, the specific calculation processes for individual components within the risk value are relatively simplified, which may compromise the accuracy and credibility of the assessment results.
Under disastrous weather conditions, a slight failure can propagate to a large area of the power system, potentially leading to significant load shedding as a result of cascading failures [10,11,12]. A comprehensive and accurate analysis of cascading failures can be effectively employed for risk assessment [13,14,15,16], identification of critical components [17,18], and addressing other pertinent issues.
In addition, any cascading path with an arbitrary independent failure combination is possible theoretically in cascading failure analysis [12,19,20]. However, the calculation of finding high-order n-k correlation is very complicated, and the computational cost of traditional enumeration and random search methods increases almost exponentially with the increase in fault order, so the enumeration method is almost impossible [21]. There have been some studies to reduce the complexity of cascading failure analysis by selecting a typical cascading failure propagation path [22]. However, these search criteria ignore the transmission lines whose outages are the most vulnerable to consequential failure.
Based on the timing of control, the strategies to mitigate large-scale blackouts caused by cascading failures can be broadly categorized into two types: preventive control before accidents and emergency mitigation during accidents [23,24,25]. Preventive control, implemented prior to accidents, involves taking corrective measures when the system is in an unsafe state to restore it to a safe state, thereby ensuring the secure and stable operation of the system. In contrast, emergency mitigation, enacted during accidents, involves severing the cascading failure paths to halt the further progression of the failure. Most existing research on cascading failure control has overlooked the impact of natural disasters on the operational risks of transmission lines [26,27,28,29], resulting in a relatively crude assessment of the actual operational risk level of power systems. Moreover, the current studies tend to treat preventive control and mitigation control in isolation, neglecting their complementary characteristics in terms of economic efficiency and safety.
To tackle this issue, this paper initially establishes equipment risk indicators grounded on the severity levels of disaster accidents. Utilizing these indicators, it refines the patterns of cascading failure progression within the system under various disaster scenarios. Following this, a collaborative mitigation strategy for system cascading failures during disasters is formulated from an operational control standpoint, incorporating optimal generator dispatch and load/generator shedding techniques to quickly reduce the line load. This strategy, coupled with proactive prevention measures, aims to swiftly sever potential cascading failure pathways post-disaster, thereby minimizing the outage-affected areas to the fullest extent feasible. The model proposed in this paper effectively quantifies both the risk index and potential cascading failure consequences in the context of extreme weather, offering a dependable strategy for mitigating such failures.
The innovation of this paper lies in its comprehensive consideration of the impact of natural disasters on cascading failure assessment in power systems and, accordingly, the proposition of a collaborative mitigation strategy. Compared with existing methods, this paper, for the first time, establishes equipment risk indices based on the severity levels of disaster accident risks, providing a refined analysis of the development patterns of cascading failures in systems under accident and disaster scenarios. Furthermore, at the system operation level, this paper proposes a cascading failure assessment method that takes into account natural disasters, along with a collaborative mitigation strategy for cascading failures under disaster conditions. This strategy, in conjunction with proactive prevention and control measures, aims to promptly sever potential cascading failure paths upon the occurrence of a disaster, thereby minimizing the power outage area to the greatest extent possible. The effectiveness of the proposed mitigation strategy is corroborated through simulation case studies, demonstrating that, in natural disaster scenarios, the method presented in this paper can significantly reduce the risk of cascading failures by approximately 80%, which has not been comprehensively discussed in previous literature.
2. Transmission Line Operation Risk Index Under Natural Disaster
Lorenz has introduced the contemporary definition of security risk, which encapsulates the comprehensive assessment of the likelihood of adverse effects and the gravity of hazards [30]. This definition has been broadened to encompass the risk table for overhead transmission lines in the context of natural disasters. That is:
where R represents the risk value associated with the impact of natural disasters on overhead transmission lines, p represents the probability of overhead line failure resulting from such disasters, and h represents the severity of the harm inflicted by the barriers.
p can be divided into two parts and calculated by statistical analysis, respectively.
where p1 represents the probability of natural disaster occurrence; p2 represents the probability of line failure caused by disasters.
The assessment method of risk hazards directly affects the scientific rationality of the assessment results. In order to comprehensively measure the severity of risk hazards, the severity of hazards caused by line failures is calculated based on Formula (3).
where Y represents the loss value of line failure transmission capacity, and S represents the social impact coefficient of risk.
Formula (3) is extended to the situation of the comprehensive effects of multiple natural disasters. Considering the different occurrence periods of different types of natural disasters, the corresponding risk characteristics and hazards are also different; the period coefficient of natural disaster risk and the risk weight of natural disasters are introduced, and the social impact coefficient of a certain natural disaster risk is:
where Si represents the social impact coefficient of line risk caused by natural disaster I, αi represents the risk period coefficient of natural disaster I, and wi represents the risk weight of natural disaster i.
To sum up, the disaster operation risk of overhead transmission lines is a comprehensive function of risk failure probability, loss value of line failure transmission capacity, and risk social impact coefficient, and its calculation formula is as follows:
where R represents the risk value of overhead line disaster operation; pi represents the probability of line failure caused by natural disaster i; hi represents the damage value of line failure under natural disaster i; Yi represents the loss value of transmission capacity due to line failure under natural disaster i.
In order to quantify the failure transmission capacity of the line, the product of p2 and Y is defined as the loss value y of the failure transmission capacity of the line when natural disasters occur.
Then, Equation (5) can be equivalent to:
where p1i represents the probability of occurrence of natural disaster i; yi represents the loss value of line failure transmission capacity when natural disaster i occurs; αi represents the risk period coefficient of the first kind of natural disaster; wi represents the risk weight of Type i natural disaster.
Based on the magnitude of the R-value, the risk can be categorized into distinct hazard levels. Specifically, an R-value exceeding 1000 is classified as level 1, posing a significant threat of incurring substantial losses. Values ranging between 300 and 1000 (exclusive) constitute level 2, indicating a high likelihood of heavy losses. R values between 60 and 300 (exclusive) are assigned to level 3, indicating a considerable risk of serious losses. Conversely, R values within the range of 20 to 60 (exclusive) represent level 4, which tends to trigger large losses. Levels 5, encompassing R-values between 5 and 20 (exclusive), indicate a moderate risk of general losses. Finally, an R-value below 5 falls into level 6, typically associated with minimal or no risk of incurring losses.
Pursuant to Formula (3), a comprehensive quantification of the gravity of risk hazards necessitates the induction of line failures stemming from diverse natural disaster risks. The load loss, resulting from the transmission capacity decrement Y or y caused by a line failure, is determined and then multiplied by the social impact coefficient S corresponding to the specific risk. This computation yields the severity of harm (h) inflicted by the line failure.
Utilizing statistical analysis, we derive the probability of line failure under various natural disasters. The Monte Carlo method is then employed to simulate the operational state of the line during a disaster, thereby calculating the potential forced outage duration [31]. This allows us to estimate the load loss incurred by the risk on the regional power grid. The degree of capacity loss during a line failure is assigned based on the proportion of load loss.
Considering the combined effects of multiple natural disasters, it is pertinent to note that different disaster types occur in varying periods, each with its corresponding risk causes, failure repair complexities, and varying degrees of impact and harm. Specifically, natural disaster wind risk is characterized by two indices: risk weight and risk period coefficient. These indices provide a description of a specific natural disaster and its implications.
The social impact coefficient of line risk caused by damage is outlined in Formula (4). For the risk period coefficient of natural disasters, statistical variations in the nature of these disasters are accounted for. Based on Bayesian estimation, we can obtain the risk period coefficient for various natural disasters, taking into consideration the period during which the overhead line is in the power supply phase when the risk occurs.
3. Cascading Failure Propagation Model Under Natural Disasters
The disruption of transmission lines can instigate a power flow redistribution, potentially straining neighboring lines to their operational limits, thereby precipitating a cascade of failures. Notably, the initial failure of transmission infrastructure, as aforementioned, is often contingent upon natural disasters that exhibit a high degree of randomness and unpredictability. To quantify the subsequent impact of a line outage on the power system’s stability, the inherent risk index of a transmission line is employed. This metric encapsulates the extent to which the outage of a particular line disrupts the power flow dynamics of other lines within the system; a higher index value signifies a more pronounced effect. Equation (7) serves as a tool for assessing the initial outage risk posed by transmission lines under the influence of natural disasters.
During natural disasters, the triggering of an initial chain failure event can swiftly escalate into the failure of multiple transmission lines, with each subsequent outage altering the power flow distribution within the system. Research has underscored that the redistribution of power flows following an outage heightens the vulnerability of certain lines to further disruptions, while adverse environmental conditions further amplify the likelihood of failure, fostering conditions conducive to overload-induced cascade failures.
In response to a transmission line shutdown stemming from a natural disaster, the prompt implementation of power balancing strategies is paramount to safeguarding the stability of the power system. The present study focuses on the DC power flow model, abstracting from the consideration of network loss parameters for simplicity. In the context of two consecutive transmission line outages caused by disasters, the simulation process encompassing power balancing and the subsequent updating of power flow states unfolds as follows:
- (a)
- Generator Ramping Scheduling Process under Disaster-Induced Outages
Upon the occurrence of a disaster, when the power system necessitates balancing measures, the optimal strategy involves prioritizing generator ramping for dispatch operations. This approach necessitates an assessment of the interplay between generator output and system load, leading to two distinct scenarios during the generator scheduling procedure:
If there is redundant output capacity from the generators, then their output should be reduced accordingly.
where represents the adjusted active power output of generator i after a downward adjustment in response to the disaster event. represents the active power output of generator i prior to the downward adjustment following the disaster event. represents the rate of downward ramping adjustment per minute for generator i after the disaster. LI and GI represent the sets of load nodes and generator nodes, respectively, within the system. ts represents the power adjustment time period following the disaster event, which is typically set to 5 min to expedite power balancing. represents the active load at the load node.
If the total output of the generator is lower than the load, it is necessary to increase the generator’s output:
where represents the upward ramping rate of generator i.
The dispatch process of the generator terminates when the generator’s output satisfies Equation (10) with respect to the load or when the output power reaches the maximum output power of the generator.
where represents a convergence coefficient that can be set according to precision conditions.
- (b)
- The process of generator tripping/load shedding
If the generator dispatch fails to meet the demand for power balance, it is necessary to implement coordinated load shedding and generator tripping measures to ensure that the power system achieves a balanced state. Generally, there are two scenarios:
After the generator has undergone a period of ramp-up, if its output power remains greater than the system load value, it is necessary to implement generator shedding in accordance with the shedding priority of the generator to achieve power balance. The shedding priority of generator node i is determined by its power generation output and the weight vector , and the calculation formula for this priority is as follows:
If, subsequent to a designated period of generator ramp-up, the system load persists in exceeding the generator’s output power, it becomes necessary to coordinate load-shedding measures in accordance with the load-shedding priority assigned to the loads. The load-shedding priority of a load node is jointly determined by its load magnitude and a weight vector . The formula for calculating this priority is:
Generator Ramping Scheduling Process and the process of generator tripping/load shedding can be concluded as:
Step 1: Detect that the total power output of the system’s generators does not equal the total load.
Step 2: If the total power output of the generators exceeds the total load, then the generating units reduce their output at a rate of rdown,i, based on their importance weights.
Step 3: If the total power output of the generators is less than the total load, then the generating units increase their output at a rate of rup,i, based on their importance weights.
Step 4: If, after increasing output at the rup,i rate for a period of time T or when the output limit is reached, the system still fails to achieve power balance, then disconnect the excess load from the system directly, based on their importance weights.
Step 5: Achieve power balance in the electric power system.
- (c)
- The identification of an islanded system based on BFS
During the progression of cascading failures, a power system may undergo disintegration, resulting in the formation of several isolated subsystems, commonly referred to as “islands.” These islands lose all interconnections among them, each possessing a distinct topological structure, power flow dynamics, and potential failure paths for the continuation of cascading failures.
This paper employs the Breadth-First Search (BFS) algorithm to identify the emergence of these islands. BFS is a traversal algorithm for graph data structures that initiates from a designated starting vertex and explores the graph layer by layer in a breadth-first manner until the target node is found or the entire graph is traversed. Essentially, BFS embodies an iterative approach, wherein the search originates from a source node and propagates outward, utilizing a queue to maintain the discovered nodes, which then serve as the basis for further expansion, thus enabling the traversal of the entire graph. The steps of BFS are as follows:
Step 1: Choose a starting node (‘start_node’) as the starting point of the search. Create an empty queue (denoted as a queue) to store nodes to be visited. Add the starting node to the ‘queue’ and mark it as ‘visited’.
Step 2: If the ‘queue’ is not empty, proceed to the next step.
Step 3: Remove a node (denoted as ‘current_node’) from the front of the ‘queue’. This is the current node to be processed.
Step 4: Visit the current node and expand the ‘neighbors’ of the current node.
Step 5: Obtain all neighbor nodes of ‘current_node’. And iterate through each node (denoted as ‘neighbor’) in ‘neighbors’.
Step 6: Check if ‘neighbor’ has been visited (i.e., if it exists in the ‘visited’). If ‘neighbor’ is not visited, add it to the ‘visited’ and append it to the end of the ‘queue’.
Step 7: Repeat Step 2 through Step 6 until the ‘queue’ is empty.
In the event of system disintegration into multiple isolated subsystems, the subsystem with the largest size and the highest weight coefficient is selected to constitute the new primary system. This selection criterion ensures the continued simulation of cascading failures within the newly formed primary system.
- (d)
- Update the system power flow status
After the completion of generator dispatch and generator/load shedding, the power flow distribution on each branch will be reconfigured. Consequently, the system transitions into a brand-new operating state, necessitating immediate recalculation of power flow conditions to ensure the stable operation of the power system. This paper performs calculations based on the direct current (DC) power flow.
According to the theory of operational reliability, the outage probability of transmission lines is closely related to the magnitude of power flow passing through them. It is common to use piecewise linear fitting to approximate the outage probability curve as a function of varying power flow. It is generally recognized that when the power flow through a transmission line exceeds a certain threshold, the outage probability gradually increases with the further augmentation of power flow.
- (e)
- Assessment of Consequences of Cascading Failure Risks
The severity of consequences is used to measure the scale of power system blackout caused by a cascading failure event with a complete failure path. The average blackout consequences of power system cascading failure is used to measure the risk of system cascading failure. The calculation formulas of and are as follows:
where ND represents the set of load nodes in the initial system; ND’ represents the set of load nodes in the final system; and represent the loads of the access node before and after the occurrence of the failure, respectively; represents the set of all branches in the system; represents the number of elements in set , the number of system branches. The higher the value of , the more severe the blackout consequences caused by potential cascading failure events in the system.
4. Cascading Failure Mitigation Strategy
According to the time sequence of control measures, the control of large-scale blackout accidents can be divided into prevention control before the accident and interruption control during the accident.
The logical relationship between the large-scale blackout and the various cascading failure paths is an OR gate, while the relationship between a cascading failure path and its constituent failure segments is an AND gate. The triggering process of failure segments within the same cascading failure path is directional, and the simultaneous triggering of all segments will lead to the activation of the cascading failure path and, ultimately, the large-scale blackout. Preventive control is implemented prior to the occurrence of failures, targeting the set of all cascading failure paths. In the logical diagram, it precedes the initial failure segments of each cascading failure path; thus, the triggering of these paths is only considered after the implementation of preventive control. Mitigation control, on the other hand, is enacted after the onset of failures, specifically targeting the current cascading failure path.
Since preventive control is implemented before the triggering of cascading failure paths, it acts instantaneously upon the occurrence of a failure, effectively minimizing the system’s exposure to its impacts. However, as it addresses all potential failure paths, while reducing risks associated with some paths, it may inadvertently increase risks on others. The contradictory requirements posed by different failure paths can limit the effectiveness of relying solely on preventive control to mitigate blackout risks. Conversely, mitigation control, enacted post-triggering, is tailored to individual failure paths, and conflicts arise only when paths intersect, and mitigation is applied prior to the intersection. This results in fewer conflicts among control measures. Nevertheless, due to its post-failure nature, mitigation control often involves significant control efforts as the failure has already significantly impacted the system.
By adopting preventive control before failures occur, the subsequent need for mitigation control is reduced, lowering control costs. Conversely, implementing mitigation control after failures can alleviate the contradictions inherent in preventive control, enhancing the overall capability to reduce system risks. Thus, preventive and mitigation controls exhibit strong complementarity.
When optimizing the operating state of a generator and adjusting the distribution of power flow for prevention (preventive control), part of the mitigation pressure should be transferred and should be taken into account after cascading failures are triggered. The core idea of coordinated control is to cooperate preventive control with emergency mitigation while optimizing in advance. The core idea of coordinated control is to coordinate prevention control with emergency mitigation to reduce the consequences of cascading failure. The coordinate mitigation strategy block diagram is as follows Figure 1:
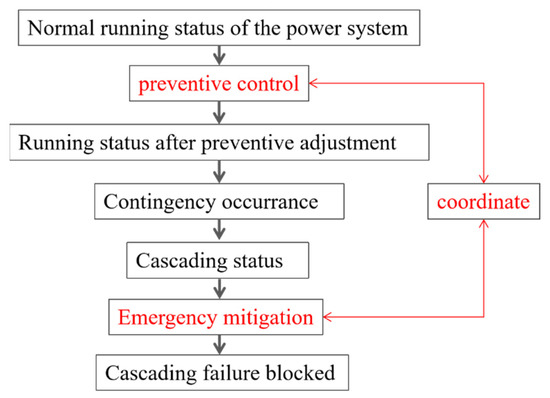
Figure 1.
The coordinate mitigation strategy block diagram.
- (a)
- Mitigation Control Cost Model
The economic indicator C of coordinated control refers to the sum of the prevention control cost and the probability-weighted interruption mitigation control cost. The power outage risk indicator represents the aggregate risk across all cascading failure paths. Since the impact of control measures on the power system manifests in the form of changes in outage risk, and these control measures themselves incur control costs, in order to comprehensively assess the variations in both outage risk and control costs, we define the system operational risk indicator E as the sum of the economic indicator and the outage risk indicator.
where represents the prevention costs. represents the cost of preventive control for cascading path Lk after control. represents the sum of emergency mitigation costs for each cascading failure path after preventive control. represents the sum of probability-weighted emergency mitigation costs for each cascading failure path after preventive control. , , , represent the active power of generator i before preventive control, the active power of generator i after preventive control, the active power rate of generator i after preventive control for cascading failure path Lk, and the tuning valence series of generator i, respectively. h represents the amplification factor. and represent the cutting load amount and load loss cost coefficient of load node i in emergency mitigation for the cascading failure path Lk, respectively. is the implementation probability of emergency mitigation for cascading failure path Lk.
- (b)
- Coordinated control model
The objective of the coordinated control model is to obtain the control scheme with the minimum operational risk under the given network topology and weather conditions—that is, to minimize the risk of power outages with the least control cost. The mathematical optimization model is as follows:
where represents load of load node i after preventive control; ,, represent the power flow of line ij after preventive control, the power flow of line ij after emergency mitigation for cascading failure path Lk, and the limit value of line ij power flow, respectively. , represent the upper and lower limits of the active output of generator i.
Equations (22) and (23) represent the maintenance of power balance after preventive control and emergency mitigation, respectively. Equations (24) and (25) signify that the power flow on line ij does not exceed its limits following preventive control and emergency mitigation, respectively. Equation (26) ensures that the adjusted load after emergency mitigation does not exceed its limit, assuming that the maximum load shedding at a load node is 50% of its total load. Lastly, Equations (27) and (28) represent the constraints that the adjusted generator output does not exceed its limits after preventive control and emergency mitigation, respectively.
Furthermore, if only preventive control measures targeting all cascading failure paths before the occurrence of failures are considered, i.e., retaining only in set E and removing constraint conditions (23), (25), (26), and (28), the model transforms into a pure preventive control model. Conversely, if only emergency mitigation measures specific to each cascading failure path are considered, i.e., retaining only in set E and removing constraint conditions (22), (24), and (27), the model transforms into a pure emergency mitigation model.
5. Case Study
5.1. Case Setting
The numerical case studies use the improved IEEE 39-node system as a test system. The base value is 100 MW, and the generator’s ramp-up and ramp-down rates are 5%/min relative to the capacity of each generator. The minimum output of the generator is considered 0, and the maximum output is the rated power of the generator. The statistical data of past natural disasters and line failures in one region are used to conduct the risk failure probability assessment of the actual overhead transmission line. The transmission lines are assumed to be under different weather conditions. A cascading failure simulation and cascading failure mitigation strategy simulation are conducted. The mitigation strategy model is solved by the commonly used particle swarm optimization algorithm. The solution method is based on the double-layer decomposition optimization scheme, which selects the initial value of the prevention control scheme and obtains the optimal solution of the blocking scheme under the given prevention scheme.
5.2. Quantification of Line Risk Under Natural Disasters
The major natural disasters in this region primarily include heavy rain and flooding, ice and snow, thunderstorms, gales, fire, and earthquakes. Table 1 outlines the occurrences of tripping in overhead lines due to natural disasters over a consecutive six-year period:

Table 1.
Trips of transmission lines in 6 years.
As evident from Table 1, the natural disasters that cause the most frequent transmission line trips in this region are thunderstorms, gales, heavy rain, and flooding, which is similar to the situation in most regions.
To facilitate the analysis of this case, we calculate the risk value associated with the impact of different natural disasters on overhead transmission lines, R, using simplified formulas as shown in Equation (7), which is derived from the comprehensive analysis starting from Equation (1) to Equation (6). The results are summarized in Table 2.
Table 2.
Risk Value of Transmission Lines under Various Disasters.
In the section on disaster weight calculation, the weight vectors of each level can be computed through the improved Analytic Hierarchy Process (AHP). Although this is not the focus of this paper, no additional calculations will be conducted here. Based on the different operational risk values, corresponding disaster operational risk levels for transmission lines can be determined. In practical engineering applications, the evaluated overhead lines can be subject to operational risk prevention measures commensurate with their assessed risk levels, thereby enhancing the resilience of the lines against natural disasters.
5.3. Assessment of Cascading Failures Under Natural Disasters
The natural disaster corresponding with the highest operational risk value, heavy rain, and flooding, has been selected as the target for the assessment of cascading failures in the power system under disaster conditions. The assessment results are shown in Figure 2 below. The ordinate of Figure 2 represents the ID of the transmission line that may trigger cascading failures under natural disasters, while the abscissa represents the simulation results of the Indl index for the corresponding transmission line triggering cascading failures. The higher value indicates the greater probability of cascading failure occurring on that line. The purple bar chart on the left side shows the simulation results of system-cascading failures without natural disasters, while the yellow bar chart on the right side represents the simulation results of system-cascading failures under heavy rain and flooding disasters. Placing them side by side facilitates a comparative analysis of their differences.
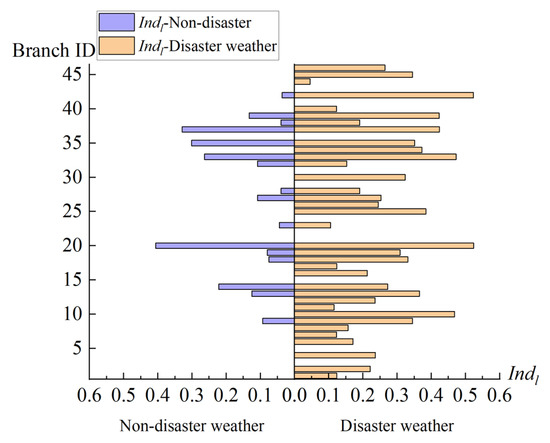
Figure 2.
Analysis of system cascading failure consequences before and after heavy rain and flooding natural disasters.
As can be seen from Figure 2, under normal conditions without natural disasters, there are only 16 potential cascading failure trigger points, while in the case of heavy rain and flooding disasters, the number of potential cascading failure trigger points soars to 35, with an increased rate of up to 219%. This indicates that natural disasters can significantly increase the likelihood of cascading failures occurring.
At the same time, there is also a significant increase in the severity of consequences Indl under natural disaster conditions. Taking Branch 9 and Branch 42 as examples, under normal conditions without disasters, the Indl of cascading failures potentially induced by these two trigger points are 0.093 and 0.036, respectively. After the occurrence of heavy rain and flooding disasters, the Indl of cascading failures potentially induced by these two trigger points increased to 0.345 and 0.523, respectively, with risk index increases of 371% and 1453%, respectively. Based on the data presented in the figure, we can use Equation (14) to calculate the average blackout consequences (IndR) of the system before and after the occurrence of natural disasters, which are 0.052 and 0.253, respectively, indicating a significant increase in the risk of cascading failures throughout the system.
The traditional Monte Carlo-based cascading failure evaluation method uses a large number of random samples to obtain the expected power outage size of the cascading failure [32]. The larger the sampling value, the more accurate the simulation result, and the evaluation result can be used as a standard value to verify the accuracy of the evaluation model in this paper. In the case of sampling 5000 times without considering weather disasters and weather disasters, the average outage size calculated by the traditional Monte Carlo-based cascading failure assessment method is 4.9% and 26.1%. The values calculated by the proposed method are 5.2% and 25.3%, and their relative errors are 5.77% and 3.16%, respectively. Compared with the traditional Monte Carlo method, the proposed method does not require a large amount of sampling, saving a lot of simulation time, and is more suitable for supporting the formulation of a cascading failure mitigation strategy.
Figure 3, as a supplement to Figure 2, shows the failure order of the cascading failure path that each branch may trigger before and after considering bad weather. It can be found that when experiencing extreme weather, the propagation path of cascading failure increases; that is, there will be more transmission line outage events.
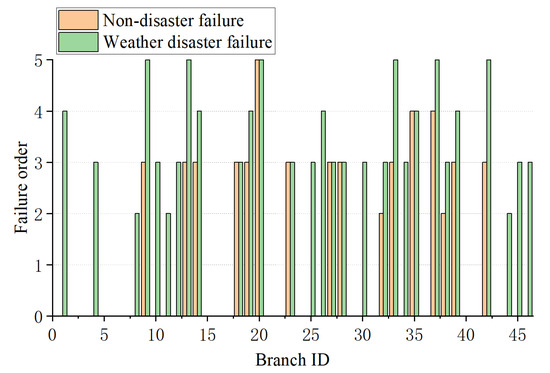
Figure 3.
Analysis of system cascading failure order before and after heavy rain and flooding natural disasters.
Combining the above analysis, it can be concluded that natural disasters, on the one hand, increase the likelihood of cascading failures occurring, and on the other hand, they also expand the potential impact of cascading failures, namely, the potential scope of power outages increases.
To further analyze the changes in cascading failure risk before and after the occurrence of other different natural disasters, we conducted individual cascading failure simulation analyses for the remaining five types of natural disasters outlined in Section 5.2. The results of the IndR calculations are presented in Table 3.
Table 3.
IndR under various disasters.
Table 3 presents the calculation results of the average blackout consequences (IndR) of cascading failures under different disasters. It can be observed that natural disasters indeed significantly elevate the risk of cascading failures in the system. Based on the historical natural disaster statistics of the selected region in the case study, the potential risk indices of cascading failures in the system following earthquakes, gales, thunderstorms, heavy rain and flooding, ice and snow, and fires are calculated to increase by 137%, 338%, 212%, 487%, 275%, and 342%, respectively. It is evident that the natural disasters with the most severe impact on system cascading failures are heavy rain and flooding, gales, fires, and ice and snow. However, given that the occurrence probabilities of fires, ice, and snow are relatively lower compared to heavy rain, flooding, and strong winds, special attention should be paid to the risk of cascading failures in the system during extreme weather conditions such as heavy rain and flooding and gales. Power grid authorities should, therefore, take proactive prevention and control measures in advance.
5.4. Cascading Failure Control Strategy Under Natural Disasters
To facilitate a comparative analysis of the effectiveness of control strategies, novel indicators, namely, the reduction in IndR, ΔIndR, and the reduction in E, ∆E, are defined. Furthermore, a unit cost of load shedding during control is set at 200 yuan/MW, and h is 500,000. Targeting the system with the highest risk of cascading failures, as outlined above, which is the scenario of heavy rain and flooding, a coordinated control model is formulated and solved as described in this paper. The details are presented in Table 4.
Table 4.
Comparison of the effects of different control strategies under heavy rain and flooding.
Control strategy 1 is a pure preventive control approach that excludes intervention from emergency mitigation. The control idea is to adjust the unit output to optimize the power flow distribution by optimizing (15), (20), and (21)–(28) of the model before the fault occurs so as to reduce the probability of cascading failure. It solely relies on increasing the operational costs of the system during normal operation to mitigate the control pressure once cascading failure paths are triggered, thereby reducing the occurrence of post-fault line overloads. However, the proactive prevention effect is limited, resulting in a small reduction in power interruption risk (ΔIndR), poor control performance, minimal reduction in operational risk (ΔE), and a relatively low cost-effectiveness ratio.
Control strategy 2, on the other hand, is a pure emergency mitigation strategy without any proactive prevention measures. The control idea is to control the spread of the fault by emergency cutting off the load and quickly restoring the normal operation of the overloaded line after the failure occurs, demonstrating enhanced control effectiveness and better economics compared to Control Strategy 1. Nevertheless, since control is implemented solely after cascading failure paths are activated, post-fault line overloads are more prevalent, leading to high emergency mitigation costs and significant control pressure post-failure.
Control strategy 3 represents a coordinated control approach combining preventive control with emergency mitigation. On the one hand, preventive control prior to faults reduces the probability of failure occurrence and alleviates line overloads triggered by cascading failure paths, thereby mitigating post-failure control pressure and reducing post-failure emergency mitigation costs. On the other hand, emergency mitigation after faults mitigates conflicts among cascading failure paths, increases the reduction in power interruption risk (ΔIndR), and enhances the overall control effectiveness. As such, this strategy offers the best control performance and the highest cost-effectiveness ratio.
Next, the results of the cascading failure control strategy for systems confronted with heavy rain and flooding will be elaborated upon.
During the prevention phase, adjustments to the output of generator units are made to optimize the power flow distribution, thereby reducing the operational pressure on the system and preemptively mitigating the severity of potential power flow overloads caused by faults. The outcomes of preventive control are illustrated in Figure 4.
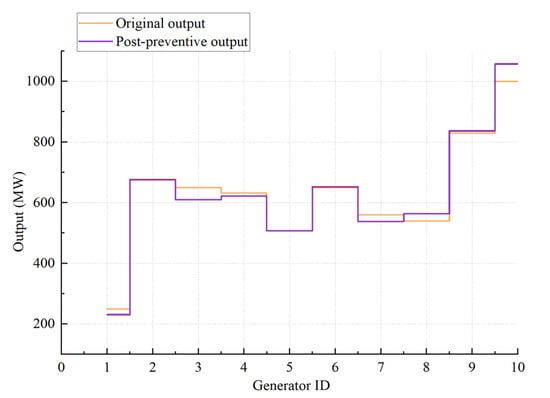
Figure 4.
Generator output before and after the intervention of preventive control under disaster conditions.
As illustrated in Figure 4, the proposed strategy in this paper is capable of optimizing and adjusting the generator output based on the actual grid operation conditions and the risk level of lines under disaster scenarios, thereby reducing the risk of system cascading failures at a lower cost and preemptively sharing a portion of the post-fault prevention and control pressure.
The generator output adjustment after preventive control is illustrated in Table 5.
Table 5.
The generator output adjustment after preventive control.
Following the implementation of preventive control and upon the occurrence of a fault, the active load-shedding volume during the intervention of emergency mitigation is depicted in Figure 5.
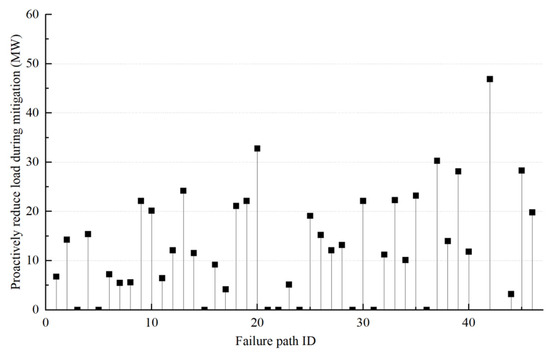
Figure 5.
Active load shedding volume for emergency mitigation under disaster conditions.
In Figure 5, the load reduction during emergency mitigation is shown. Through comparison and analysis with Figure 1, compared with the load loss caused by development without any control strategy of cascading failure, the load loss caused by the active load shedding in the implementation of the control strategy is lower, which proves that the control strategy can successfully block the chain fault and proves the effectiveness of the model.
6. Conclusions
This paper has established equipment risk indicators grounded in disaster accident risk levels; these indicators facilitated the refinement of the cascading failure development patterns within the system under accident and disaster conditions. Subsequently, a collaborative mitigation strategy for system cascading failures in disaster contexts was formulated at the operational control level, leveraging optimal generator dispatch and load/generator shedding techniques. This strategy, augmented by proactive prevention and control measures, ensures the swift severing of potential cascading failure paths upon disaster occurrence, thereby minimizing the area affected by power outages. The effectiveness of the proposed strategy was validated through simulation case studies, underscoring its potential to significantly reduce the risk of cascading failures in power systems during natural disasters.
Furthermore, this research has developed a comprehensive disaster risk quantification theory that considers the likelihood of risk occurrence, the extent of risk impact on transmission lines, and the severity of potential hazards. This framework enables a thorough quantification of the operational risks associated with overhead lines during disasters. Additionally, an assessment methodology for cascading failures under disaster scenarios has been established, quantifying the extent to which disasters elevate the risk of system-wide cascading failures.
The mitigation strategies presented in this paper effectively reduce the risk of cascading failures in power systems during natural disasters. By incorporating weather factors, the coordination control approach can provide tailored solutions that are adaptive to varying weather conditions, further enhancing the resilience of power grids in the face of adverse environmental challenges.
All calculations in this paper are carried out under the steady-state assumption, and no transient analysis is carried out. In the subsequent research, the transient response under the fault state should be further considered so as to obtain the simulation results closer to the actual situation and the control strategy with wider applicability.
The model does not consider the dynamic process of the power system after a cascading failure event, which could influence the assessment of mitigation strategies.
Future research directions will focus on refining the transient response analysis under fault conditions, building upon the steady-state assumptions employed in this paper. By incorporating transient analysis, we aim to obtain simulation results that more closely reflect real-world scenarios, enabling the development of control strategies with broader applicability and enhanced accuracy. This will further enhance the resilience of power grids against natural disasters, ensuring more reliable and adaptive solutions in the face of adverse environmental challenges.
Author Contributions
Conceptualization, P.L. (Ping Liu), P.L. (Penghui Liu), Y.Y., J.W., G.T., Z.Z. and L.C.; methodology, P.L. (Ping Liu), P.L. (Penghui Liu), Y.Y., J.W., G.T., Z.Z. and L.C.; software, P.L. (Ping Liu), P.L. (Penghui Liu), Y.Y., J.W., G.T., Z.Z. and L.C.; writing—original draft preparation, P.L. (Ping Liu), P.L. (Penghui Liu), Y.Y., J.W., G.T., Z.Z. and L.C. All authors have read and agreed to the published version of the manuscript.
Funding
This research was funded by the State Grid Corporation of China Soft Science Project: Research on Strategy for Improving Disaster Prevention Level of Power Grid Based on Whole Landform, Whole Element, and Whole Life Cycle (No. 8104BB230001).
Data Availability Statement
The original contributions presented in the study are included in the article, further inquiries can be directed to the corresponding author.
Conflicts of Interest
Authors Ping Liu, Penghui Liu, Yang Yang, Jilong Wu and Guang Tian were employed by the State Grid Hebei Electric Power Co., Ltd. The remaining authors declare that the research was conducted in the absence of any commercial or financial relationships that could be construed as a potential conflict of interest.
References
- Ding, Y.; Zhang, J.; Song, Y. Changes in weather and climate extreme events and their association with the global warming. Meteorol. Mon. 2002, 3, 3–7. [Google Scholar]
- Chen, L.J.; Li, X. Statistic analysis on reliability of power transmission and transformation facilities in China in 2011. Electr. Power 2012, 45, 89–93. [Google Scholar]
- Zeng, Y.B.; Wang, X.H.; Peng, X.G.; Huang, J.L.; Jian, S.C.; Lu, D. Research on risk modeling and forecasting method of transmission line defects. Power Syst. Prot. Control 2020, 48, 91–98. [Google Scholar]
- Huang, H.; Lei, J.; Zeng, H.; Gong, Q.; Zhao, L.; Qiao, H.; Huang, L. Integrated risk assessment system of transmission line under extreme external environment. J. Electr. Power Sci. Technol. 2019, 34, 119–127. [Google Scholar]
- Huang, X.Y.; Shen, Z.; Wang, X. Risk assessment method of bird damages for Yunnan power grid transmission line. High Volt. Appar. 2020, 56, 156–163. [Google Scholar]
- Entriken, R.; Lordan, R. Impacts of extreme events on transmission and distribution systems. In Proceedings of the IEEE Power and Energy Society General Meeting, San Diego, CA, USA, 22–26 July 2012; pp. 1–10. [Google Scholar]
- Wang, Q.; Qian, H.; Chang, A.; Song, Y.-H.; Deng, H.-L.; Lin, B.-Y.; Li, S.-W. Design and implementation of HV overhead transmission line expert system based on unified functional architecture of digital power grid. East China Electr. Power 2014, 42, 698–703. [Google Scholar]
- Li, S. Research on the Evaluation of Overhead Transmission Line Operation Risk Under the Bad Meteorological Disasters; South China University of Technology: Guangzhou, China, 2015. [Google Scholar]
- Deng, H.; Dai, D.; Li, S. Comprehensive operation risk evaluation of overhead transmission line based on hierarchical analysis-entropy weight method. Power Syst. Prot. Control 2017, 45, 28–34. [Google Scholar]
- Sun, K.; Hou, Y.; Sun, W.; Qi, J. Power System Control Under Cascading Failures: Understanding, Mitigation, and Restorafion; Wiley-IEEE Press: Hoboken, NJ, USA, 2019. [Google Scholar]
- Yang, Y.; Nishikawa, T.; Motter, A.E. Small vulnerable sets determine large network cascades in power grids. Science 2017, 358, 886–892. [Google Scholar] [CrossRef]
- Wang, A.; Luo, Y.; Tu, G.; Liu, P. Vulnerability assessment scheme for power system transmission networks based on the failure chain theory. IEEE Trans. Power Syst. 2011, 26, 442–450. [Google Scholar] [CrossRef]
- Rezaei, P.; Hines, P.; Eppstein, M.J. Estimating cascading failure risk with random chemistry. IEEE Trans. Power Syst. 2015, 30, 2726–2735. [Google Scholar] [CrossRef]
- Henneaux, P.; Labeau, P.; Maun, J.; Haarla, L. A two-level probabilistic risk assessment of cascading outages. IEEE Trans. Power Syst. 2016, 31, 2393–2403. [Google Scholar] [CrossRef]
- Sun, Y.; Wang, P.; Cheng, L.; Liu, H. Operational reliability assessment of power systems considering condition-dependent failure rate. IET Gener. Transm. Distrib. 2009, 4, 60–72. [Google Scholar] [CrossRef]
- Yao, R.; Huang, S.; Sun, K.; Liu, F.; Zhang, X.; Mei, S.; Wei, W.; Ding, L. Risk assessment of multi-timescale cascading outages based on Markovian tree search. IEEE Trans. Power Syst. 2017, 32, 2887–2900. [Google Scholar] [CrossRef]
- Zhang, Z.; Huang, S.; Chen, Y.; Mei, S.; Wei, W.; Ding, L. Key Branches identification for cascading failure based on Q-learning algorithm. In Proceedings of the 2016 IEEE International Conference on Power System Technology (POWERCON), Wollongong, NSW, Australia, 28 September–1 October 2016; pp. 1–6. [Google Scholar]
- Wei, X.; Zhao, J.; Huang, T.; Bompard, E. A novel cascading failures graph based transmission network vulnerability assessment method. IEEE Trans. Power Syst. 2018, 33, 2995–3000. [Google Scholar] [CrossRef]
- Jia, Y.; Liu, R.; Wang, P.; Han, X. Risk assessment of cascading failures in power grid based on complex network theory. In Proceedings of the 2016 14th International Conference on Control, Automation, Robotics and Vision (ICARCV), Phuket, Thailand, 3–15 November 2016; pp. 1–6. [Google Scholar]
- Yang, L.; Li, H.; Zhang, H.; Wu, Q.; Cao, X. Stochastic-Distributionally Robust Frequency-Constrained Optimal Planning for an Isolated Microgrid. IEEE Trans. Sustain. Energy 2024. early access. [Google Scholar] [CrossRef]
- Eppstein, M.; Hines, P. A “random chemistry” algorithm for iden-tifying collections of multiple contingencies that initiate cascading failure. IEEE Trans. Power Syst. 2012, 27, 1698–1705. [Google Scholar] [CrossRef]
- Yan, J.; Tang, Y.; He, H.; Sun, Y. Cascading Failure Analysis With DC Power Flow Model and Transient Stability Analysis. IEEE Trans. Power Syst. 2015, 30, 285–297. [Google Scholar] [CrossRef]
- Sami, N.M.; Naeini, M. Machine learning applications in cascading failure analysis in power systems: A review. Electric Power Systems Research 2024, 232, 110415. [Google Scholar] [CrossRef]
- Guo, H.; Zheng, C.; Iu, H.H.C.; Fernando, T. A critical review of cascading failure analysis and modeling of power system. J. Econom. 2017, 80, 9–22. [Google Scholar] [CrossRef]
- Xu, J.; Bai, X.; Huang, B. Research on wide area cooperative pre-control system for cascading failure. Power Syst. Technol. 2013, 37, 131–136. [Google Scholar]
- Iu, W.; Wang, J.; Xie, C.; Wang, W. A model to defense cascading failures in complex power grid based on multistage games with incomplete information. Power Syst. Technol. 2013, 37, 1005–1011. [Google Scholar]
- Li, B.; Fang, Y.; Xu, T. Review on online operational security risk assessment of power systems. Autom. Electr. Power Syst. 2012, 36, 171–177. [Google Scholar]
- Wang, Y.; Tang, W.; Liu, L.; Guo, C. Construction and application of power grid operation risk assessment and rating system. Autom. Electr. Power Syst. 2015, 39, 141–148. [Google Scholar]
- Wang, Y.; Yi, L.; Tu, G.; Liu, P.; Liu, W. Risk assessment of cascading failures in power system based on failure chain and fuzzy comprehensive evaluation. Proc. CSEE 2010, 30 (Suppl. S1), 25–30. [Google Scholar]
- Song, N.C.; Wang, R.Q.; Li, M.M.; Liu, Y.; Shen, Z.; Lu, H. Risk assessment of overhead transmission lines under multiple natural disasters. Power Syst. Prot. Control 2021, 49, 65–71. [Google Scholar]
- Billinton, R.; Li, W. Reliability Assessment of Electrical Power Systems Using Monte Carlo Methods; Plenum: New York, NY, USA, 1994; pp. 60–66. [Google Scholar]
- Liu, Y.; Wang, Y.; Yong, P.; Zhang, N.; Kang, C.; Lu, D. Fast power system cascading failure path searching with high wind power penetration. IEEE Trans. Sustain. Energy 2020, 11, 2274–2283. [Google Scholar] [CrossRef]
Disclaimer/Publisher’s Note: The statements, opinions and data contained in all publications are solely those of the individual author(s) and contributor(s) and not of MDPI and/or the editor(s). MDPI and/or the editor(s) disclaim responsibility for any injury to people or property resulting from any ideas, methods, instructions or products referred to in the content. |
© 2024 by the authors. Licensee MDPI, Basel, Switzerland. This article is an open access article distributed under the terms and conditions of the Creative Commons Attribution (CC BY) license (https://creativecommons.org/licenses/by/4.0/).