Article

Optimal Placement and Sizing of Modular Series Static Synchronous Compensators (M-SSSCs) for Enhanced Transmission Line Loadability, Loss Reduction, and Stability Improvement

by
Cristian Urrea-Aguirre
1,
Sergio D. Saldarriaga-Zuluaga
1,
Santiago Bustamante-Mesa
1,
Jesús M. López-Lezama
2,* and
Nicolás Muñoz-Galeano
2
1
Departamento de Eléctrica, Facultad de Ingeniería, Institución Universitaria Pascual Bravo, Calle 73 No. 73A-226, Medellín 050036, Colombia
2
Research Group on Efficient Energy Management (GIMEL), Department of Electrical Engineering, Universidad de Antioquia (UdeA), Medellín 050010, Colombia
*
Author to whom correspondence should be addressed.
Processes 2025, 13(1), 34; https://doi.org/10.3390/pr13010034
Submission received: 29 November 2024 / Revised: 12 December 2024 / Accepted: 19 December 2024 / Published: 27 December 2024

Abstract

:
This paper addresses the optimal placement and sizing of Modular Static Synchronous Series Compensators (M-SSSCs) to enhance power system performance. The proposed methodology optimizes four key objectives: reducing transmission line loadability, minimizing power losses, mitigating voltage deviations, and enhancing voltage stability using the L-index. The methodology is validated on two systems: the IEEE 14-bus test network and a sub-area of the Colombian power grid, characterized by aging infrastructure and operational challenges. The optimization process employs three metaheuristic algorithms—Genetic Algorithm (GA), Particle Swarm Optimization (PSO), and Teaching–Learning-Based Optimization (TLBO)—to identify optimal configurations. System performance is analyzed under both normal operating conditions and contingency scenarios (N − 1). The results demonstrate that M-SSSC deployment significantly reduces congestion, enhances voltage stability, and improves overall system efficiency. Furthermore, this work highlights the practical application of M-SSSC in modernizing real-world grids, aligning with sustainable energy transition goals. This study identifies the optimal M-SSSC configurations and placement alternatives for the analyzed systems. Specifically, for the Colombian sub-area, the most suitable solutions involve installing M-SSSC devices in capacitive mode on the Termocol–Guajira and Santa Marta–Guajira 220 kV transmission lines.

1. Introduction

With the growing demand for energy, the integration of renewable energy sources, and the shift toward more decentralized and flexible electrical systems, grid security and stability have become critical challenges in power system operation and planning [1]. In this context, optimizing these systems for efficiency and stability is essential, making the implementation of advanced power compensation technologies that provide greater controllability over power flows increasingly important [2].
Flexible AC Transmission Systems (FACTSs) are a well-established and widely researched technology in the literature. These systems enable control over power flows to prevent congestion or bottlenecks in transmission lines, thereby enhancing power transfer capacity and facilitating the dispatch of more cost-effective generators [3]. FACTSs are considered one of the most widely applied technologies in power systems to control various variables, such as bus voltage magnitude, active power, reactive power, and transmission line impedance [4]. Consequently, these devices can increase the security and stability of power systems, while also improving their performance [5].
FACTSs have been the subject of multiple research studies. In [6], the authors provided a comprehensive review of the optimal placement and sizing of FACTS devices in electrical systems, highlighting their role in improving both static and dynamic performance. Various metaheuristic optimization techniques, such as swarm-based and evolutionary algorithms, are examined for the placement of FACTS devices. The review covers 50 recent studies, comparing methodologies and proposing future directions, including the incorporation of total harmonic distortion (THD) reduction. In [7], the Brainstorming Optimization Algorithm (BSOA) is introduced for the placement and configuration of FACTS devices such as thyristor-controlled series compensators (TCSCs) and static VAR compensators (SVCs). The impact of the static synchronous compensator (STATCOM), TCSCs, static synchronous series compensators (SSSCs), and unified power flow controllers (UPFCs) on static voltage stability is studied in [8] using the Continuation Power Flow (CPF) method and node bifurcation theory. The comparative analysis conducted on the IEEE 14-bus test system provides insights into the effectiveness of each controller evaluated. A Generalized Unified Power Flow Controller (GUPFC) model is presented in [9], using a hybrid formulation of current and power mismatches in Newton–Raphson. The GUPFC enhances the modeling of complex power systems and improves the accuracy of power flow in interconnected networks. Additionally, a linear modeling technique for FACTS devices in direct current, employing injection shift factors, is introduced in [3], which enhances computational accuracy and efficiency in the planning of electrical systems.
In [10], the authors address the impact of increasing electric vehicle (EV) adoption on the stability of the power grid, recommending the installation of FACTS devices such as SVCs and TCSCs to mitigate challenges. The IEEE 39-bus test system is used as a reference to optimize the location of EV charging stations and FACTS devices, maximizing the loading factor at each bus. Additionally, the PSO algorithm is applied to optimize the size and installation costs of the FACTS devices, achieving an efficient and cost-effective improvement in grid stability. The study developed in [11] introduces a modified Group Search Optimization (GSO) algorithm for the optimal allocation of FACTS devices, using power flow entropy. This method enhances the power flow distribution, and its performance is tested in the IEEE 118-bus test system. A Bee Colony Algorithm (BCA) is presented in [12] for the placement of FACTS devices. In [13], the interaction between transmission switching (TS) and FACTS in optimizing electrical systems is investigated using an integrated model with mixed-integer linear programming (MILP). The results demonstrate cost savings through the strategic integration of TS and FACTS. The authors of [14] review the application of Particle Swarm Optimization (PSO) in the placement of FACTSs, highlighting its use in nonlinear and mixed-integer optimization problems; such research categorizes PSO variants and multi-objective techniques, providing valuable insights for FACTS optimization. Finally, in [15], the optimal allocation of FACTS devices in the IEEE 30-bus test system is analyzed, considering the integration of wind generators. The objective is to minimize generation costs and power losses using multi-objective functions. Various optimization algorithms, both traditional and recent, are compared to identify the most efficient one for the optimal allocation of FACTS devices.
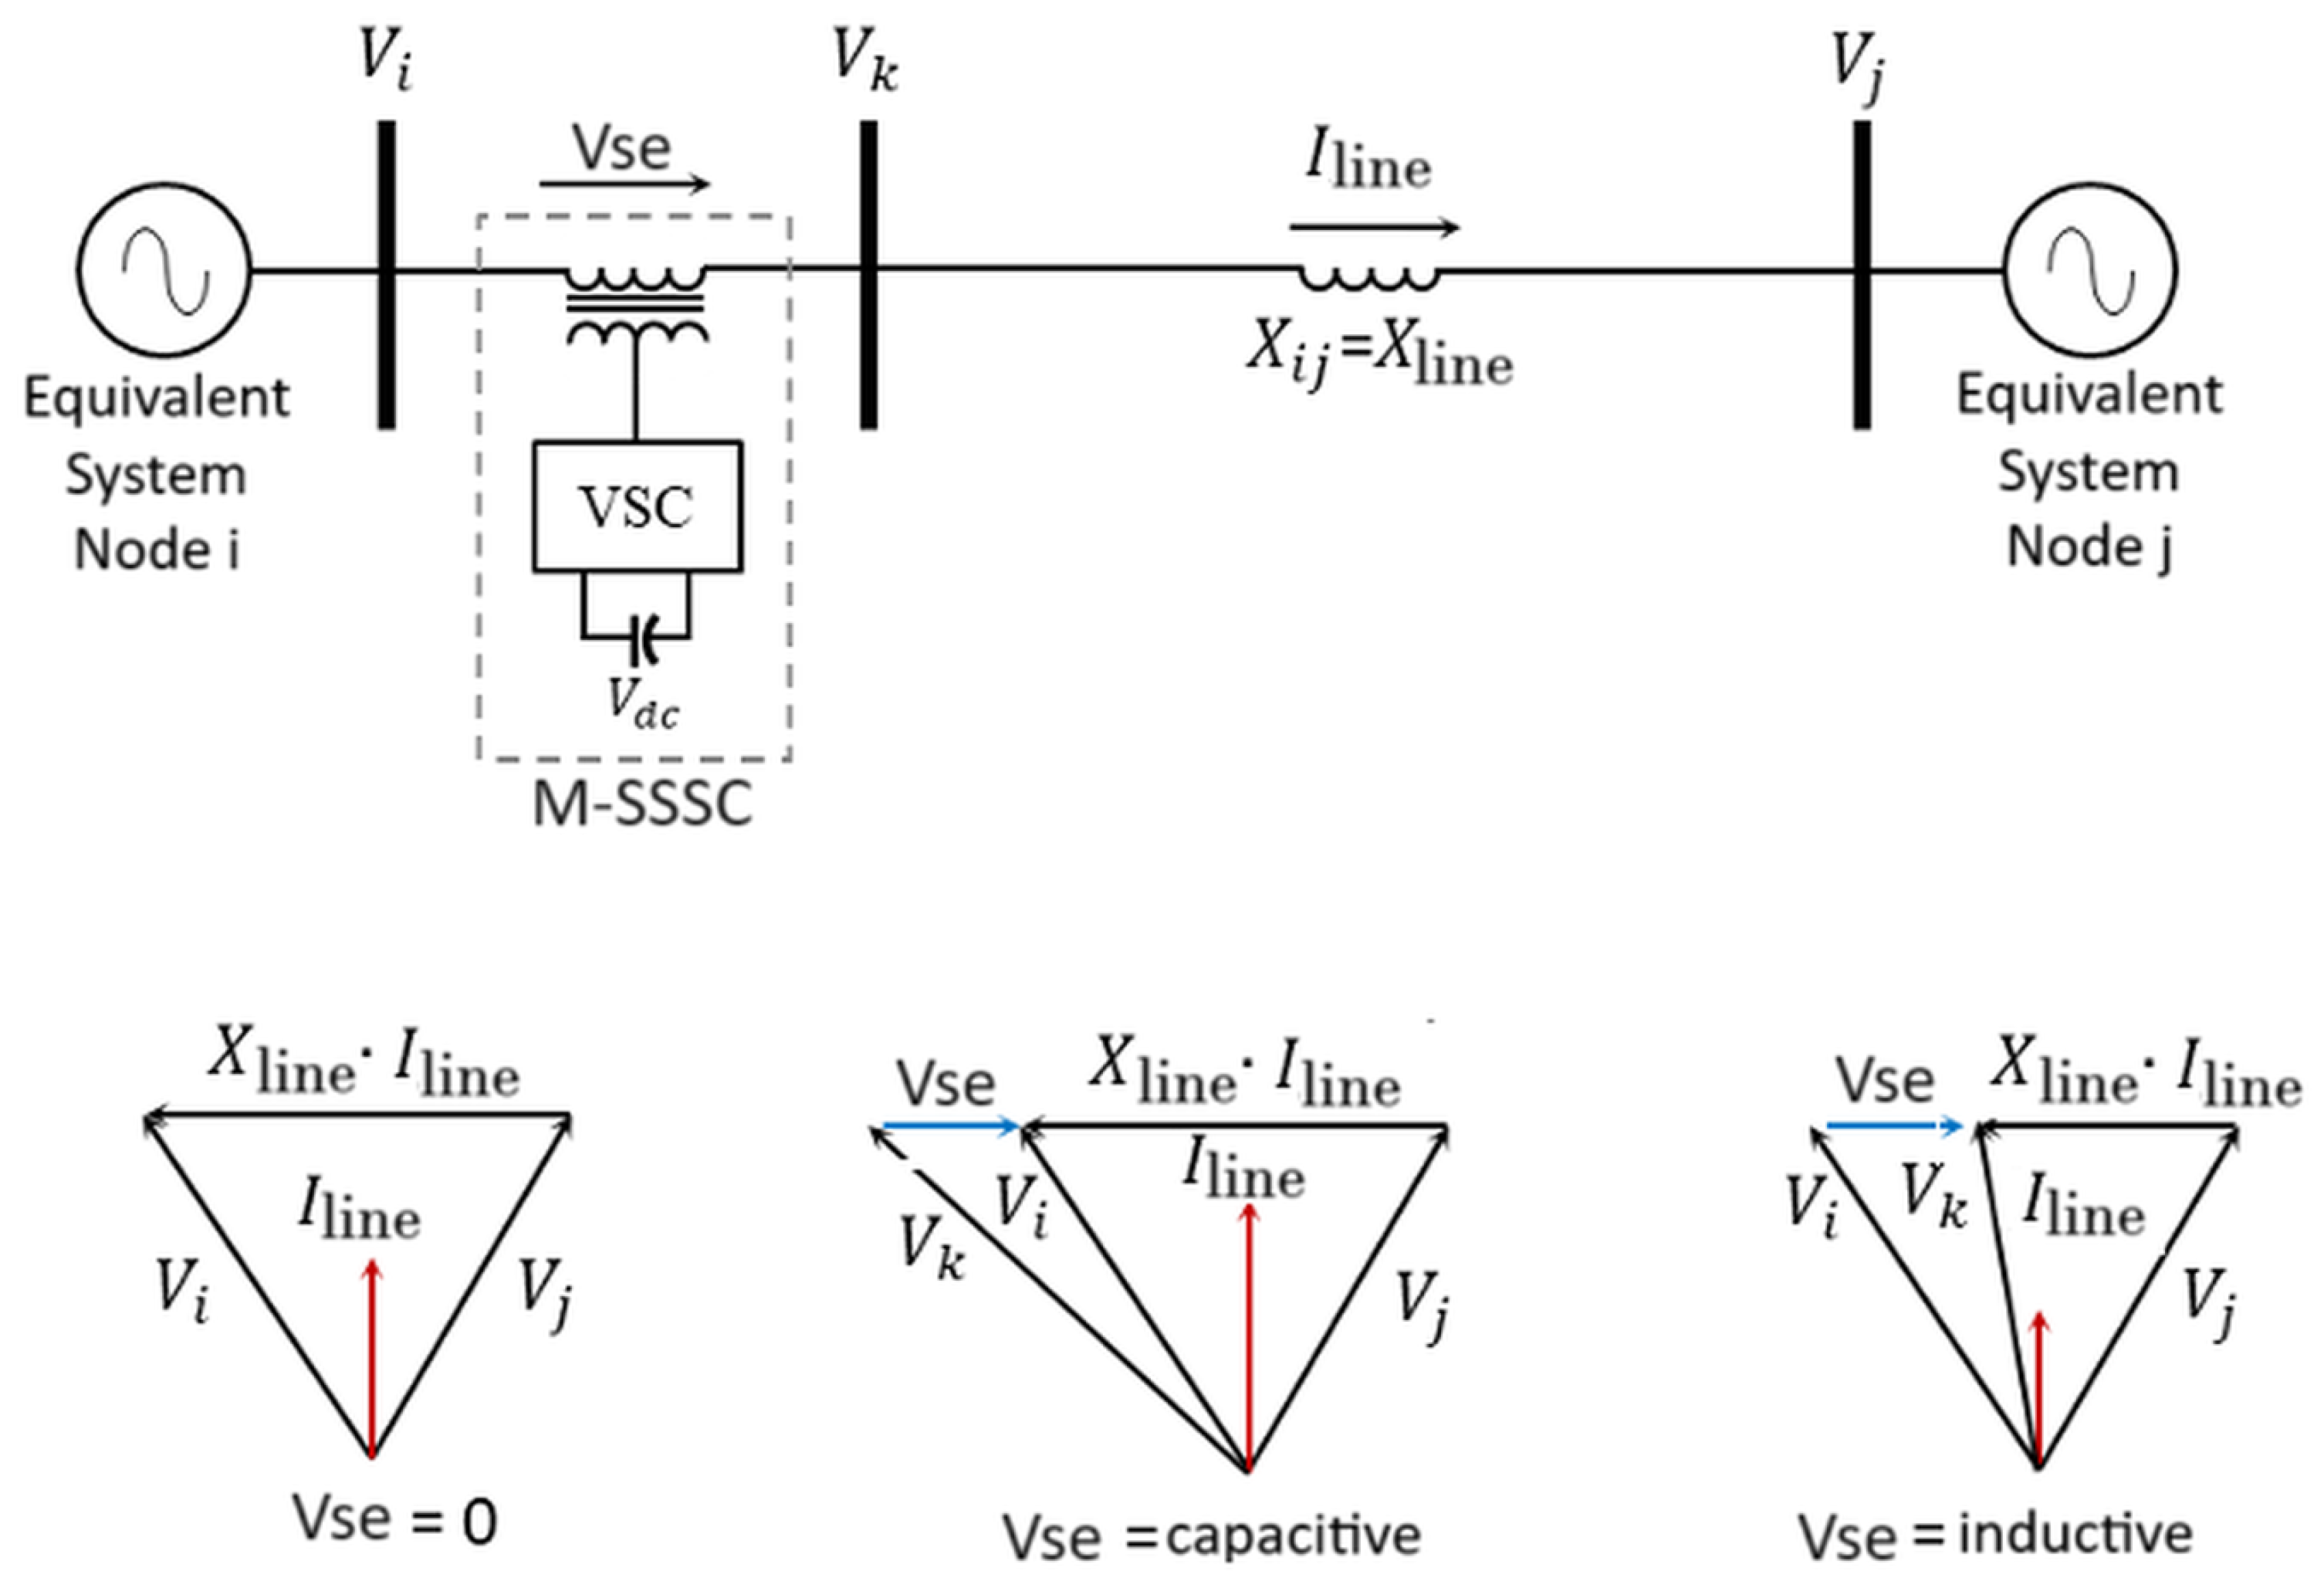
The SSSC is part of FACTSs and is connected in series through transmission lines to control active and reactive power flows by injecting a well-regulated AC voltage with a specific magnitude and phase angle [16,17]. Ref. [18] analyzes the optimal reactive power dispatch (ORPD) problem considering the SSSC in the IEEE 30-bus system to improve voltage profile and stability using Grey Wolf Optimization (GWO). On the other hand, ref. [19] solves the ORPD problem using chemical reaction optimization (CRO) while considering SSSC operation to minimize power losses. The IEEE 30-bus and 57-bus test systems are used to verify the performance of ORPD. Ref. [20] proposes an approach for the optimal placement and sizing of SSSC in electrical systems through an Improved Harmony Search (IHS) algorithm. This method overcomes traditional optimization limitations by handling non-smooth cost functions and dynamically adjusting algorithm parameters. The study demonstrates the effectiveness of the simplified SSSC model in the IEEE 30-bus test system, achieving significant improvements in controlling and optimizing power flow. Modular or distributed FACTSs (M-FACTSs or D-FACTSs) have also emerged in the electrical industry as a solution to the controllability of power flows. For example, the SmartValve device is a modular SSSC (M-SSSC) that allows for the modification of the inductive and capacitive reactance in transmission lines, offering flexibility and scalability in its implementation [21].
In [22], the authors introduce the design of M-SSSC, highlighting its scalability and flexibility to address the temporary needs of electrical system, such as congestion management and outages. The M-SSSC, implemented in Greece’s transmission system, demonstrated superior adaptability to changing system demands, overcoming limitations of traditional FACTS devices. In [23], an open-source tool based on a DCOPF model is developed for the optimal placement of M-SSSC in the Irish transmission network. This methodology enhances energy flow management, mitigating congestion and renewable energy limitations. The application of the M-SSSC in New York’s electric grid is addressed in [24] to increase transfer capacity and mitigate risks such as subsynchronous resonance, facilitating the integration of renewable energy in alignment with the state’s climate goals. The pilot project, conducted in collaboration with EPRI, validated the effectiveness of the M-SSSC in improving grid reliability. In Colombia, the integration of M-SSSC at the 220 kV Santa Marta substation demonstrated its effectiveness in mitigating thermal overloads and enhancing system stability. Real-time simulations using the Hardware in the Loop (C-HIL) methodology validated the impact of the M-SSSC on protection coordination [25]. Finally, an analysis of an M-SSSC in synergy with HVDC-LCC links reveals that this device can mitigate challenges such as switching failures and voltage fluctuations, improving the reliability of connections to weak grids. Simulations in DIgSILENT PowerFactory demonstrated significant improvements in voltage control and reactive power support [26]. The authors in [27] proposed a simple, non-iterative method to optimize the placement of FACTS devices in power systems, improving rotor angle stability and voltage profile without increasing power losses. The approach, applied to Nigeria’s 50-bus 330 kV system, improves angle stability, providing a cost-effective solution to address the growing electricity demand and delay the immediate expansion of high-voltage transmission lines. Ref. [28] proposes a novel approach for solving Optimal Power Flow (OPF) problems by integrating the optimal placement of FACTS devices with a hybrid renewable energy system (wind and photovoltaic). It uses the Enhanced Multi-Strategies Sparrow Search Algorithm (EMSSA) to minimize power loss, voltage deviation, and total cost. The results show significant improvements in power system performance, providing valuable tools for operators and planners in integrating FACTS and renewable energy sources.
As evidenced in the literature review, there are many studies dealing with the optimal location and sizing of FACTS device in power systems; nonetheless, to the best of the authors’ knowledge, the optimal placement and sizing of M-SSSC through metaheuristic techniques, considering the objectives of the proposed approach, has not been reported in the specialized literature. In this case, the optimal placement and sizing of M-SSSC is carried out with four objectives in mind: reducing the loadability of transmission lines, improving voltage stability, minimizing power losses, and voltage deviations. M-SSSCs represent an innovative solution to enhance the stability, efficiency, and controllability of transmission networks. However, most studies reported in the technical literature focus solely on reducing power losses when planning M-SSSC deployment. In contrast, this work adopts a more comprehensive approach by considering four objective functions: minimizing transmission line loadability, reducing power losses, mitigating voltage deviations, and improving voltage stability through the L-index. Moreover, while the majority of M-SSSC placement and sizing studies are based on standard test networks, this research extends beyond conventional practices. In addition to employing the IEEE 14-bus test system, a real-world power system is also used to validate the proposed methodology. The latter begin a sub-area of the Colombian electrical system that requires modernization. This dual-system validation not only demonstrates the robustness of the approach but also provides valuable insights into its practical application. Regarding the Colombian transmission infrastructure under study, 75% of the 500 kV and 230 kV lines have been in service for over 35 and 40 years, respectively, indicating an aging system that may eventually fail [29].
The reliability of an electrical system is highly dependent on the robustness of its transmission infrastructure [8], so a limited transmission system capacity can lead to congestion in the network and potentially cause violations of safety limits [30]. Therefore, enhancing the capacity of the transmission infrastructure results in economic improvements in system operation and increased reliability while facilitating the integration of renewable generation. Transfer capacity can be increased by constructing new transmission lines. However, building these lines is a long and costly process due to social and environmental considerations [31]. However, this is neither the only alternative nor the quickest, as improving power flow control can improve network performance, potentially increasing transfer capacity by up to 30% [3,32]. To summarize, the main contributions of this paper are as follows:
  • Optimal placement and sizing of M-SSSC devices in a real electrical system: This work focuses on the application and validation of M-SSSC devices in an existing electrical system, specifically in a subregion of the Colombian power grid, highlighting its practical contribution.
  • Simultaneous consideration of multiple aspects of power system performance: The proposed methodology comprehensively addresses the minimization of transmission line loadability, reduction in power losses, mitigation of voltage deviations, and improvement of voltage stability using the L-index.
  • Analysis under normal operating conditions and contingencies: The approach not only evaluates the system under normal operating conditions but also considers its performance under contingency scenarios (N − 1).
Additionally, in Table 1, the contrast between the proposed work and previous research reported in the specialized literature can be observed. In Table 1, the x represents that the marked calculation was performed on that article.
The remainder of the document is organized as follows. Section 2 presents the methodology for the optimal location and sizing of M-SSSC devices, including their mathematical model and the formulation of the optimization problem. Section 3 presents the results for an IEEE 14-bus test system and for a sub-area of the Colombian electrical system. In both scenarios, two simulations are considered: the first one focusing on the objective function related only to the loadability of the lines, and the second one incorporating the loadability of transmission lines, losses, voltage deviations at the buses, and improving voltage stability using the L-index into the objective function. Finally, Section 4 presents the main observations and conclusions.

2. Methodology for the Optimal Location and Sizing of M-SSSC

2.1. M-SSSC Modeling

The M-SSSC controller is part of the series devices used for power system compensation. According to the IEEE-CIGRE definition [8], the M-SSSC is a series compensation scheme that uses a switching power converter as a synchronous voltage source to produce a controllable voltage in quadrature with the line current. Figure 1 presents the schematic of the series connection of the M-SSSC with the transmission line. The characteristics of these devices allow for the resolution of steady-state operational issues within the system without the need for generation rescheduling, thereby making the grid more flexible [3].
The basic operating principle of the M-SSSC is to inject the voltage V s e in quadrature (±90°) with respect to the line current ( I l i n e ) , as shown in Figure 1. Therefore, the M-SSSC exchanges only reactive power with the transmission line. The compensator effectively changes the equivalent line impedance and, consequently, only the magnitude of the line current. As shown in Figure 1, with V s e = 0, the magnitude of the line current remains unchanged; with capacitive V s e , the magnitude of the line current increases, and with inductive V s e , the magnitude of the line current decreases [34].
The line current magnitude effectively controls the real power flow in the transmission line. That is, the real power flow can be increased or decreased with respect to the nominal line power flow without compensation, depending on the polarity of the injected voltage [34]. The maximum effective reactance that the device injects is calculated using Equation (1) [4]:
X e f = V s e / I l i n e
where the following definitions apply:
  • X e f is the effective series reactance injected by the M-SSSC device.
  • V s e is the voltage injected by the M-SSSC.
  • I l i n e is the current of the line.
Figure 2 shows the expected characteristic in the operation of the M-SSSC element.

2.2. Mathematical Formulation

The optimal location and sizing of M-SSSC can be formulated for several purposes such as reducing transmission line loading and power losses as well as improving voltage profile and voltage stability. The general formulation of this problem can be stated as indicated in Equations (2)–(4):
M i n F ( x )
Subject to
g j ( x , u ) = 0 ; j = 1 , 2 , , m
h j ( x , u ) 0 ; j = 1 , 2 , , p
In this case, Equation (2) denotes the objective function; g j and h j in Equations (3) and (4) are, respectively, the set of equality and inequality constraints; x and u represent the dependent and independent control variables, respectively; while m and p are the numbers of equality and inequality constraints. The set of independent variables (u) can be represented as in Equation (5):
u = [ P G 2 P G N G , V G 1 V G N G , Q C 1 Q C N C , T 1 T N T , P S P , Q S P , X e f , L C ]
where the following definitions apply:
  • P G is the active power output of the generator.
  • V G is the voltage at the generation bus.
  • Q C is the reactive power of the shunt compensator.
  • T is the transformer tap.
  • N G is the number of generators.
  • N C is the number of shunt compensating units.
  • N T is the number of transformers.
  • P S P is the specified active power.
  • Q S P is the specified reactive power.
  • L C is the location of the M-SSSC.
  • X e f is the impedance of the M-SSSC.
In this case, the decision variables are X e f and L C ; associated with the sizing and location of the device, respectively, while the dependent variables are indicated in Equation (6):
x = [ P G 1 , V L 1 V L N P Q , Q G 1 . Q G N G , S T L 1 S T L N T L , | V s e | , θ s e ]
where the following definitions apply:
  • P G 1 is the power generated at the reference bus.
  • V L 1 represents the voltages at buses.
  • Q G indicates the reactive power provided by the generators.
  • S T L is the power flow in transmission lines.
  • | V s e | and θ s e are the magnitude and angle of the voltage injected by the SSSC, respectively.
  • NBS is the number of buses of the system.
  • NTL is the number of transmission lines.

2.2.1. Objective Function

The objective function, denoted as F ( x ) , is defined as the sum of four terms as follows:
  • Loadability of transmission lines: This is equivalent to the percentage of current flowing through the link ( I i l i n e ) relative to the declared nominal capacity for this element ( I i n o m i n a l ), as shown in Equation (7):
    L o a d a b i l i t y i = I i l i n e I i n o m i n a l 100 %
    As indicated in [34], loadability can be classified into relevance ranges according to its proximity to the critical value, defined under normal operation as 100%. According to Colombian regulations [35], for 220 kV lines, the maximum loadability under contingency conditions is 120%, while for the IEEE 14-bus test system, it is 130%. Table 2 presents the loadability ranges and their stipulated relevance or weighting. Notably, a loadability below 60% is considered normal, posing no issues for the network, and thus, receives a weight of 0.00. Conversely, a loadability exceeding the critical threshold (100%) carries high relevance or impact, with a significantly elevated weight (10.0) compared to values below 100%. Therefore, alternatives that yield lower total relevance values relative to the base case contribute to a greater reduction in network loadability. In contrast, alternatives with higher relevance values indicate an increase in the loadability of the lines analyzed.
    Similarly, the relevance ranges for the N − 1 contingency situation are defined for the IEEE 14-bus test system and the Colombian system as indicated in Table 3 and Table 4, respectively.
    Finally, this term of the objective function is established using relevance values, both under normal operation and in contingency, for each line. The arithmetic sum of these values provides a single result for each scenario, as indicated in Equation (8):
    F ( 1 ) = i = 1 N T L R e l e v a n c e i
    where the following definitions apply:
    • R e l e v a n c e i is the weight assigned according to the line’s loadability.
    • NTL represents the number of transmission lines.
  • Power losses: The minimization of active power losses is given by Equation (9), where P l o s s e s i represents the power loss in each transmission line.
    F ( 2 ) = i = 1 N T L P l o s s e s i
  • Voltage deviations: The third term of the objective function represents the voltage deviations (VDs) indicated in Equation (10):
    F ( 3 ) = V D = i = 1 N B S [ V i V r e f ]
    where the following definitions apply:
    • NBS is the number of buses in the system.
    • V i is the voltage magnitude at bus i.
    • V r e f is the reference voltage, which is commonly equivalent to 1.0 p.u.
  • Voltage stability index (VSI): The fourth term of the objective function seeks to improve the voltage stability, which is proportional to the minimization of the voltage stability indicator called the L-index. This enhanced objective can be achieved by reducing the maximum value of the L-index in the power networks. This indicator is shown in Equation (11):
    F ( 4 ) = L i = M a x | 1 j = 1 N g Y i j V i V j | ; i = 1 , 2 , , N B S
    where the following definitions apply:
    • L i represents the stability value of bus i.
    • Y i j is the mutual admittance value between buses i and j.
    • NBS is the number of buses of the system.
    • N g is the number of generators.
With the information from the previous items, the objective function can be rewritten as shown in Equation (12):
M i n F ( x ) = M i n [ F ( 1 ) + F ( 2 ) + F ( 3 ) + F ( 4 ) ]
Each of the previous terms of the objective function became dimensionless, and for the sake of simplicity, equal weights are considered.

2.2.2. Constraints

  • Equality constraints.
    Equality constraints are given by active and reactive power balances in each bus of the system as indicated in Equations (13) and (14), respectively. In this case, P G i and Q G i are the active and reactive power provided by the generator on the bus i, respectively; P D i and Q D i are the active and reactive power demands at bus i, respectively; finally, Y i j and θ i j are the magnitude and phase of the element i and j of the admittance matrix.
    P G i P D i = j = 1 N B S | V i | | V j | | Y i j | c o s ( θ i j δ i j )
    Q G i Q D i = j = 1 N B S | V i | | V j | | Y i j | s i n ( θ i j δ i j )
  • Inequality constraints.
    These constraints represent the operational limits of the system components. Equations (15) and (16) account for the loadability limits in normal operation and under contingency, respectively. In this case, F i m a x c indicates the maximum loadability allowed under contingency, which can vary (120%, 130%, etc.) depending on specific regulations.
    I i l i n e I i n o m i n a l 100 % 100 % ; i = 1 , 2 , , N T L
    I i l i n e I i n o m i n a l 100 % F i m a x c ; i = 1 , 2 , , N T L
    Generation and voltage magnitudes must be kept within limits to assure a proper operation of the power system, in normal operation and under contingency. Equations (17) and (18) represent the limits of active and reactive power generation, respectively, while Equation (19) indicates the limits associated with voltage magnitudes of generation buses.
    P G i m i n P G i P G i m a x ; i = 1 , 2 , , N G
    Q G i m i n Q G i Q G i m a x ; i = 1 , 2 , , N G
    V G i m i n V G i V G i m a x ; i = 1 , 2 , , N G
    Equation (20) indicates upper and lower limits of transformer taps for each of these devices. Equation (21) represents the limits of reactive power provided by shunt compensators. Equation (22) indicates the limits associated to the apparent power flows in each transmission lines, and Equation (23) represents the limits of voltage magnitudes at load buses.
    T i m i n T i T i m a x ; i = 1 , 2 , , N T
    Q C i m i n Q C i Q C i m a x ; i = 1 , 2 , , N C
    S L i S L i m i n ; i = 1 , 2 , , N T L
    V L i m i n V L i V L i m a x ; i = 1 , 2 , , N P Q
    Finally, Equations (24) and (25) represent the limits of voltage magnitude and phase associated to the M-SSSC.
    V s e m i n V s e V s e m a x
    θ s e m i n θ s e θ s e m a x

2.3. Optimization Algorithms

Nature-based optimization algorithms, such as Genetic Algorithm (GA), Particle Swarm Optimization (PSO), and Teaching–Learning-Based Optimization Algorithm (TLBO), are techniques inspired by biological and social processes that seek to solve complex optimization problems [36]. In this work, GA, PSO, and TLBO are used to solve the M-SSSC device placement and sizing problem described by Equations (2)–(25). The advantages of these metaheuristic techniques compared to conventional methods lie in their ability to solve non-convex optimization problems, such as the one under study. These techniques require less computational power and address the problem in a way that is more reflective of real-world conditions as they can easily incorporate nonlinear constraints. However, their primary drawback is that they do not guarantee finding the global optimum. Instead, they typically provide high-quality solutions that are close to optimal.

2.3.1. Genetic Algorithm

GAs are metaheuristics that simulate the evolutionary process described by Darwin, where the fittest individuals are more likely to inherit their characteristics to the next generation. This technique mimics natural selection. The process starts with a set of candidate solutions or individuals, each represented by a vector (also called a chromosome), which corresponds to a possible solution to the M-SSSC sizing and location problem. The flowchart of the implemented GA is illustrated in Figure 3.
The initial population of the GA is randomly generated within the defined boundaries of the decision variables. Once the initial population is set, the objective function (fitness) of each individual is evaluated in a process known as fitness evaluation. Following this, a tournament selection is conducted by choosing a subset of individuals and selecting the best one. The tournaments are carried out in pairs, and the winners advance to the crossover stage. In this stage, selected individuals recombine at a random position, exchanging information to create new solution candidates (offspring). Next, these new individuals must pass to the mutation stage, which is a modification introduced with a certain probability to prevent the GA from becoming stuck in local optima. Mutations are applied within the bounds of the affected variable to ensure feasible solutions. In each generation, the best individuals are selected from both parents and offspring to maintain a constant population size. The process concludes once a maximum number of evaluated generations is reached. GAs have been successfully applied to a variety of problems in electrical engineering such as vulnerability assessment [37,38], protection coordination [39], expansion planning [40], under-frequency load shedding scheme dimensioning [41], etc. Furthermore, it has been demonstrated that GAs are effective in addressing the problem of optimal location and sizing of FACTSs, as indicated in [42,43,44].

2.3.2. Particle Swarm Optimization

PSO is a stochastic, population-based optimization method, used in [45], inspired by the collective behavior of flocks of birds or schools of fish. Unlike GAs, PSO does not incorporate crossover or mutation mechanisms; instead, solutions, represented by particles, move through an n-dimensional solution space following two fundamental rules that govern their position and velocity. The flowchart of the implemented PSO is shown in Figure 4.
The PSO algorithm begins with a population of particles, each representing a candidate solution, randomly distributed within an n-dimensional search space. Each particle is assigned two vectors: one for position and another for velocity. In each iteration, particles adjust their velocity and position based on both the best historical position of each individual particle and the best global position reached by the entire group up to that point. The expressions for updating the velocity and position vectors are described by Equations (26) and (27), respectively.
v i ( t + 1 ) = ω ( t ) v i ( t ) + c 1 r 1 [ x p B e s t i x i ( t ) ] + c 2 r 2 [ x g B e s t x i ( t ) ]
x i ( t + 1 ) = x i ( t ) + v i ( t + 1 )
In this case, t indicates the iteration; w ( t ) is the inertia weight; v i is the i-th particle’s velocity vector; x i is the i-th particle’s position vector; x g B e s t is the historically best position of the entire swarm; x p B e s t i is the historically best position of particle i; c 1 and c 2 are the personal and global learning coefficients, respectively; and r 1 and r 2 are uniformly distributed random numbers in the range [0,1]. PSO has been applied to solve a variety of problems in electrical engineering such as control applications [46], wireless sensor allocations [47], demand-side management [48], the optimal allocation of FACTS devices [33], etc.

2.3.3. Teaching–Learning Based Optimization Algorithm

TLBO is a population-based algorithm used in [49] that mimics the teaching–learning interaction in a classroom. Unlike evolutionary and swarm intelligence-based algorithms, TLBO only requires two parameters: population size and number of iterations. Figure 5 illustrates the flowchart of the implemented TLBO algorithm where X i is the i-th candidate solution (learner) and r is a uniformly distributed random number. Note that TLBO incorporates a greedy component in both Teacher and Learner phases in which the new solution is only accepted if it is better than the one that generates it.
TLBO starts with a set of randomly generated population, which is known as Learners. The best solution of the current population is considered as the Teacher. The TLBO algorithm is divided into Teacher and Student phases. In the Teacher phase, the current solutions ‘learn’ from the best solution (Teacher), while in the Student phase, they ‘learn’ through the interaction among them. In every iteration, each solution undergoes the Teacher phase followed by the Learner phase. TLBO has been successfully applied to several problems in electrical engineering such as modeling of synchronous machines [50], dispatch of electrical vehicles [51], and trajectory planning of robotic arms [52], among others. A review of TLBO applications can be consulted in [53].

3. Tests and Results

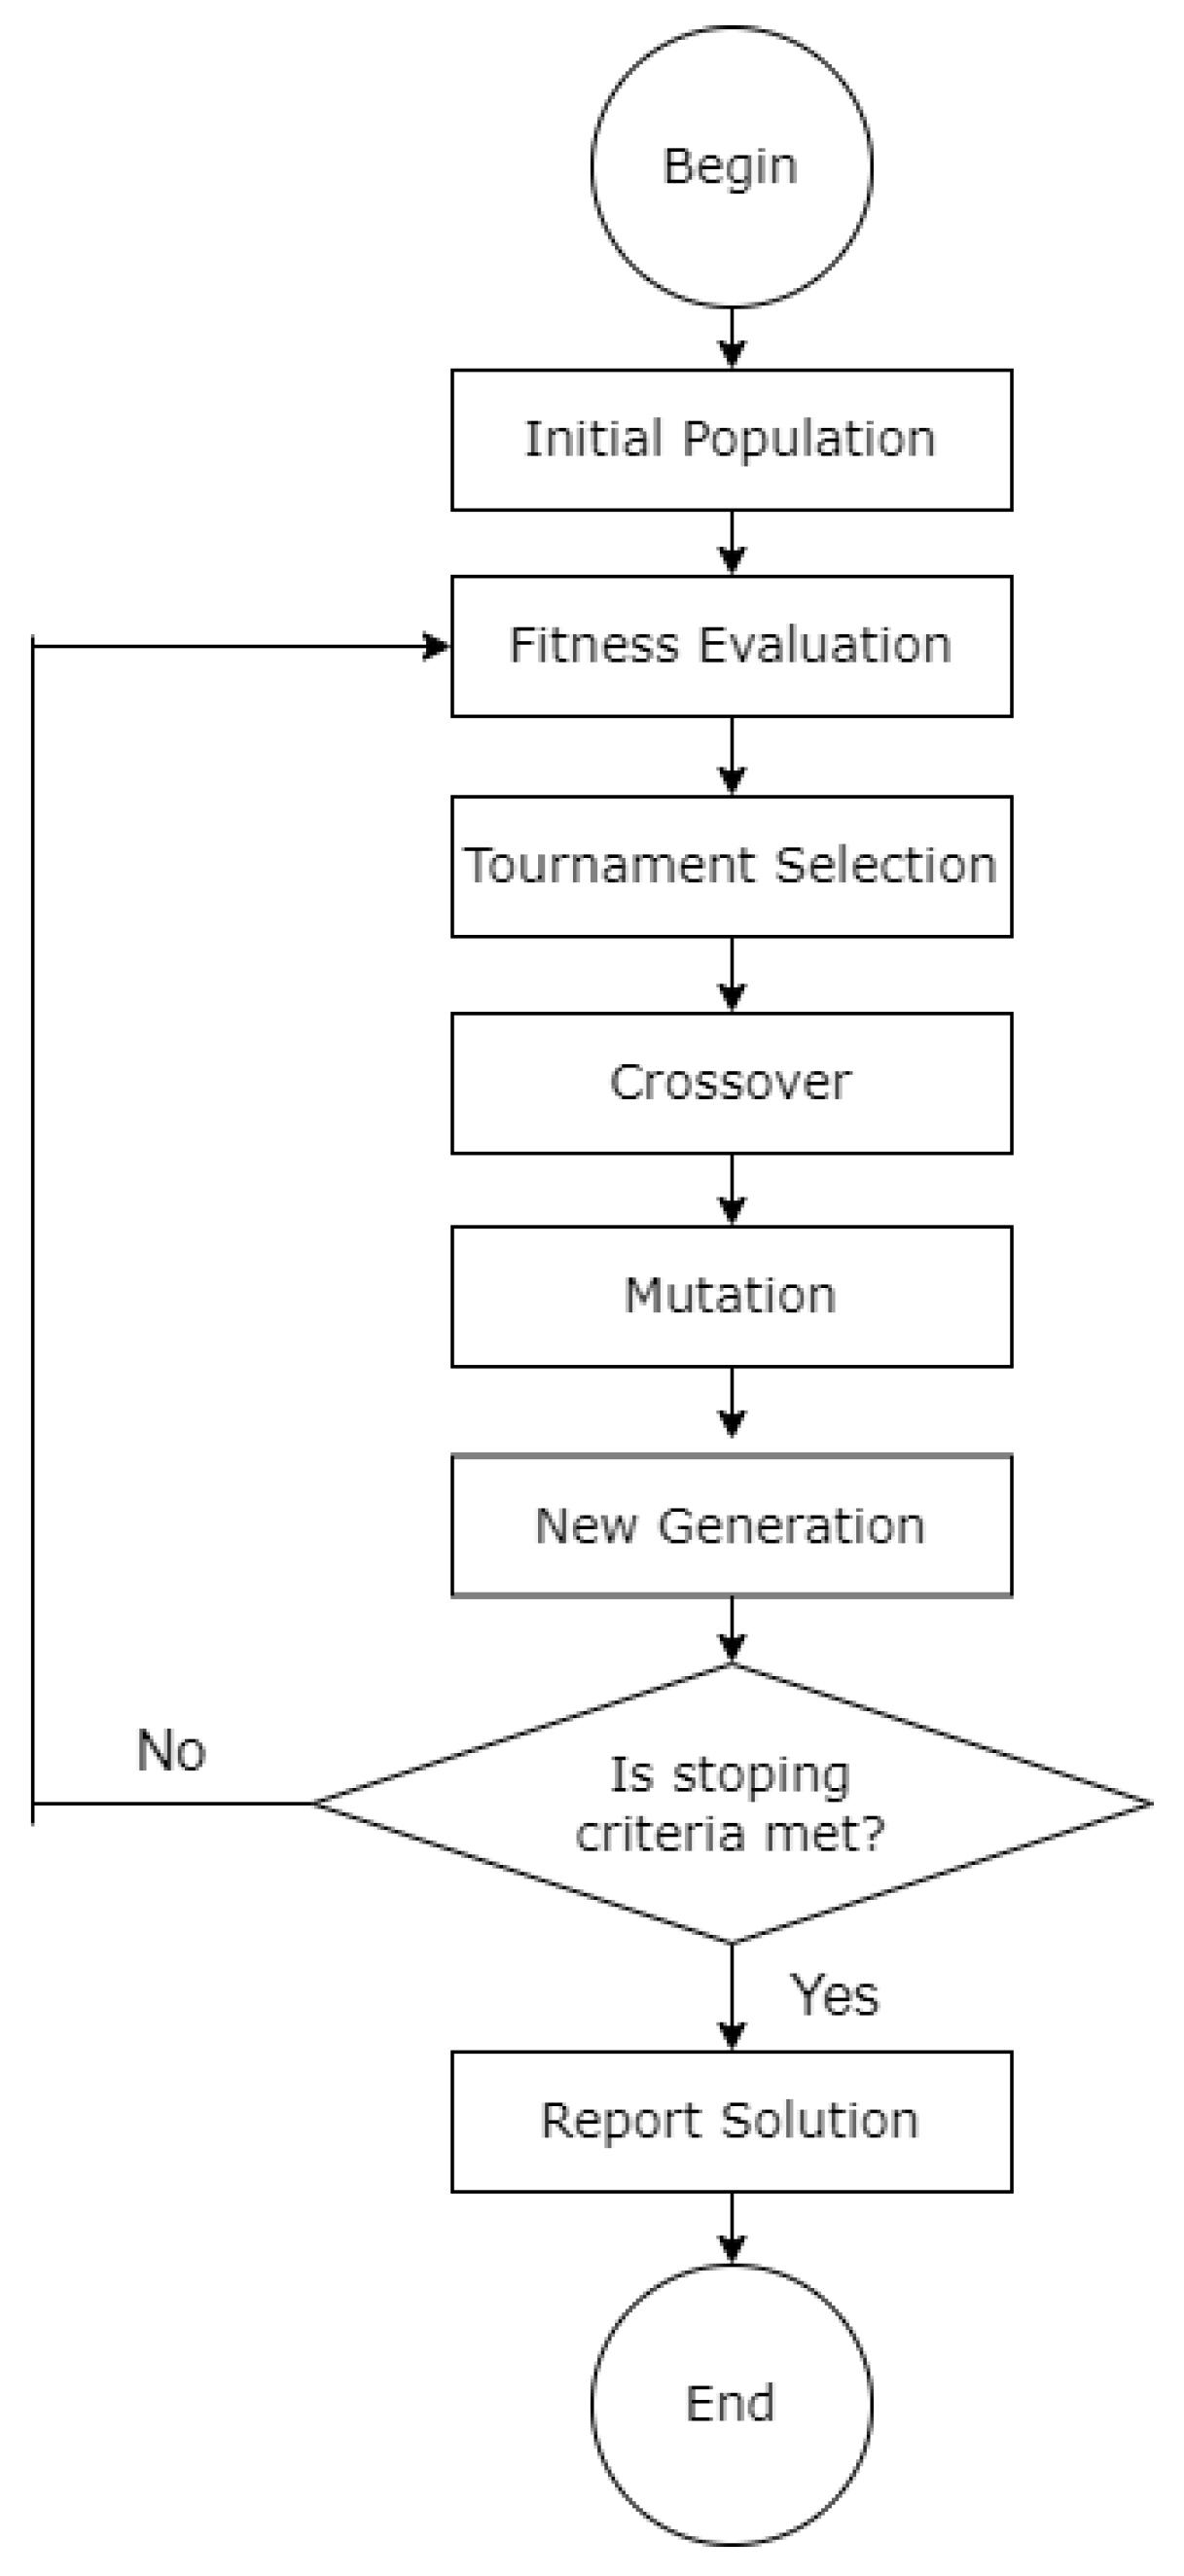
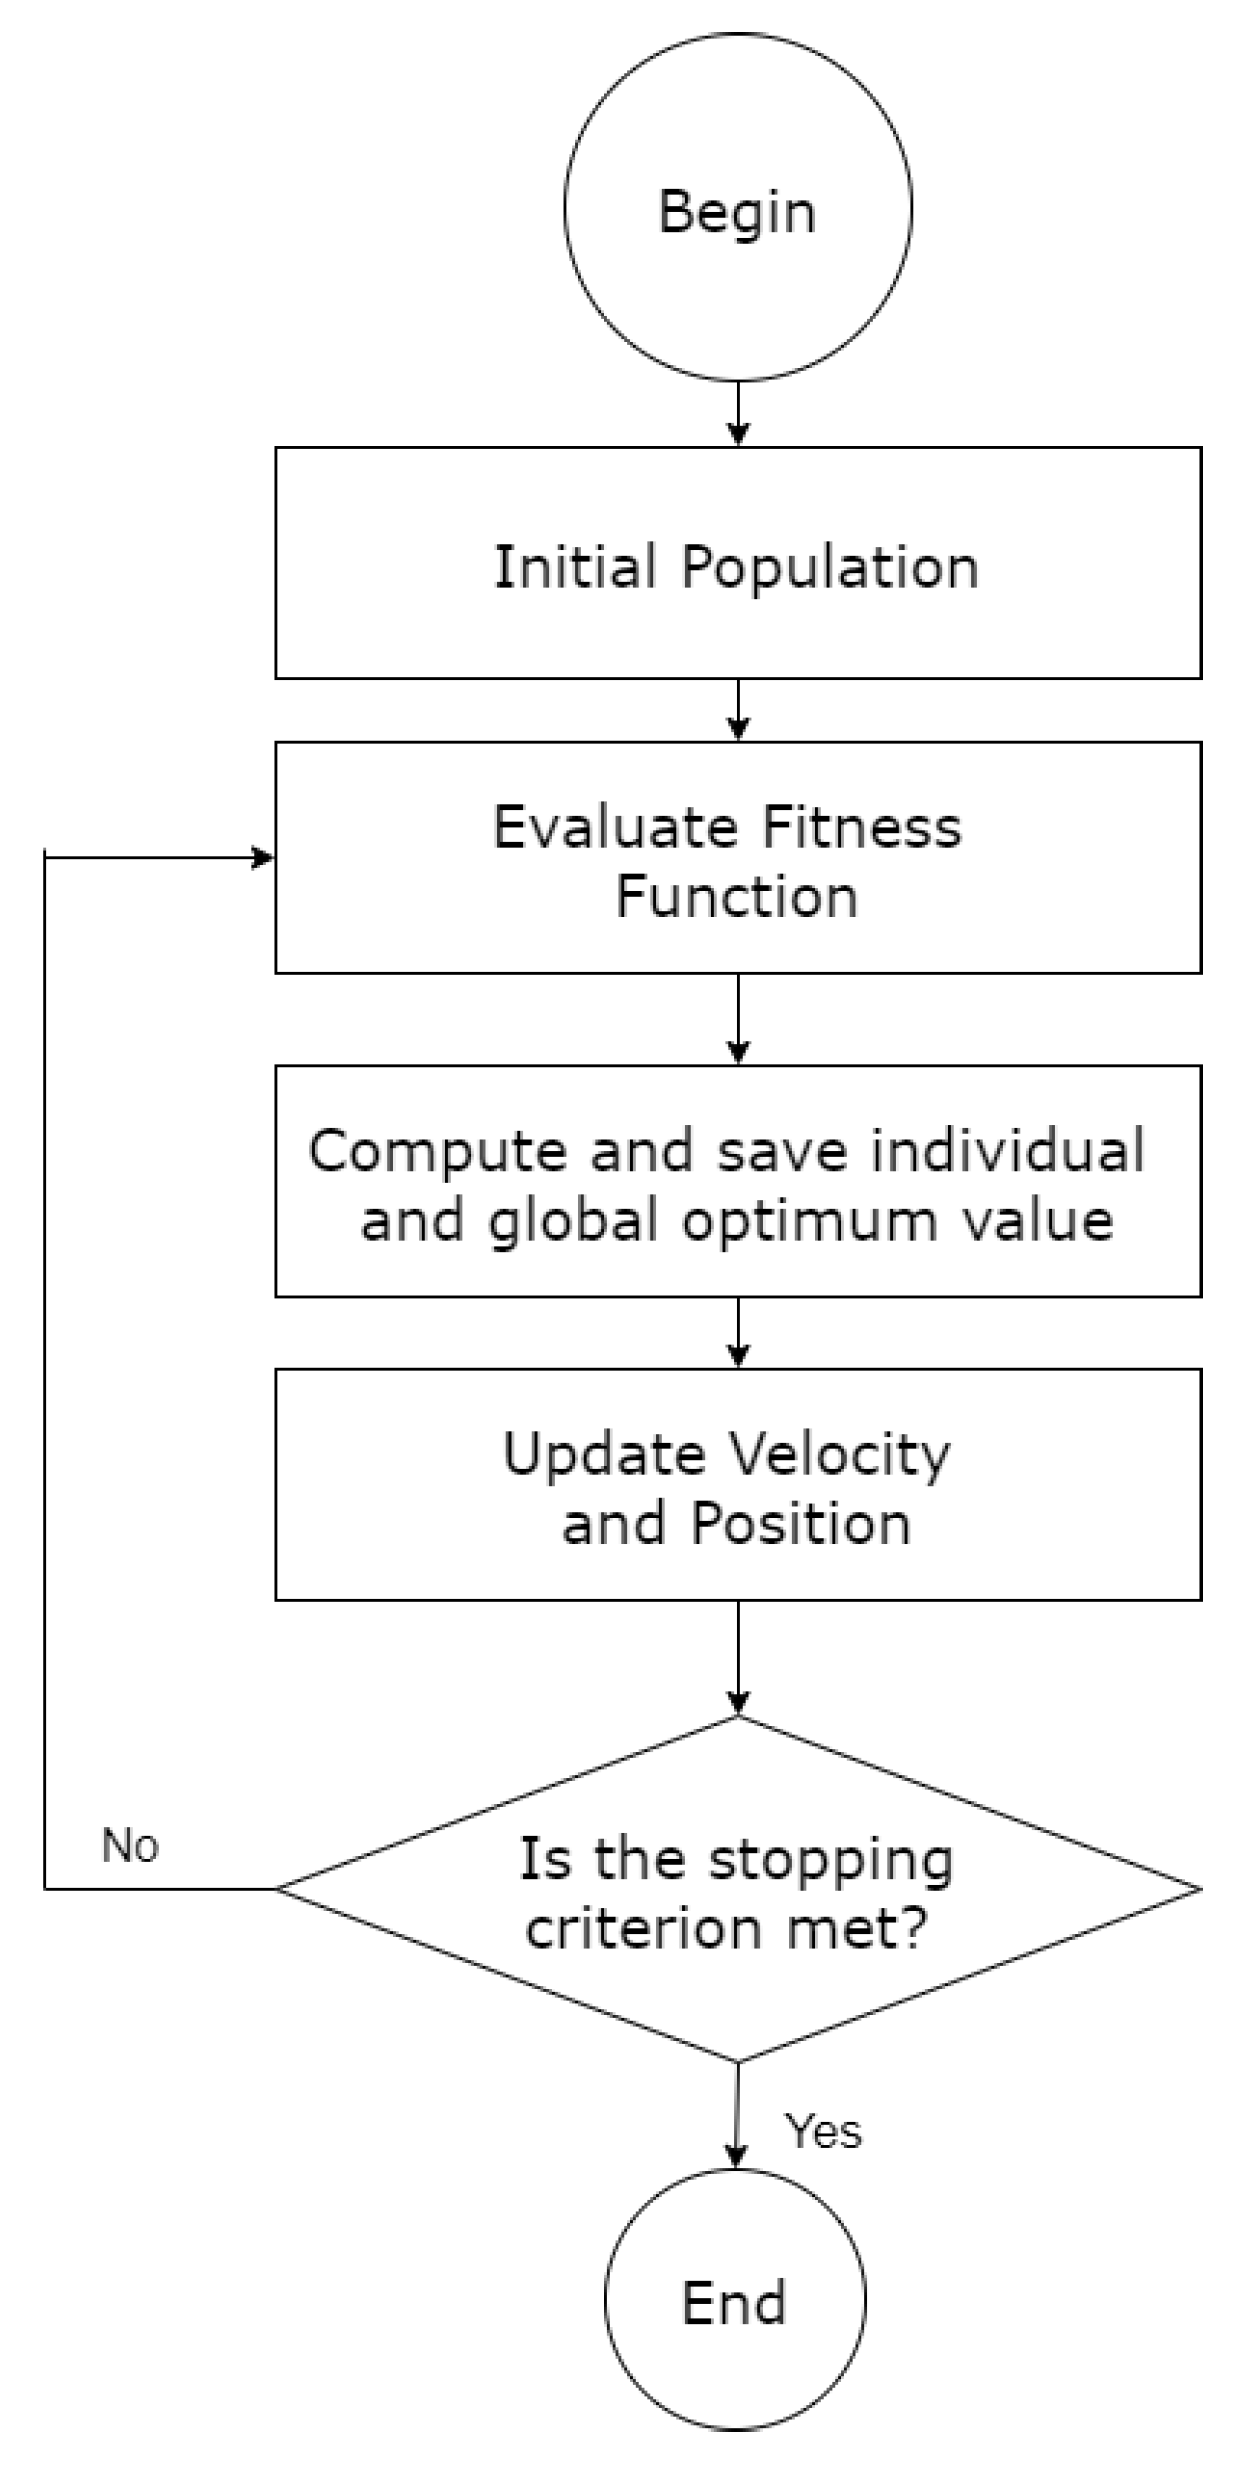
To show the applicability of the proposed approach, several tests were carried out in two transmission systems: the IEEE-14 bus test system and a sub-area of the Colombian transmission system known as GCM (Guajira–Cesar–Magdalena). Initially, only F(1) was considered as the main function of the M-SSSC device to reduce the loading of the transmission lines; subsequently, the other terms of the objective function are also introduced and analyzed. The following parameter settings were considered for the GA technique: a population of 10 individuals, 20 iterations, a crossover percentage of 0.7, an additional range factor for a crossover of 0.4, a mutation percentage of 0.3, and a mutation rate of 0.1. For the PSO technique, the following parameter settings were considered: a population of 10 individuals, 20 iterations, an inertia weight of 1, an inertia weight damping ratio of 0.99, a personal learning coefficient of 1.5, and a global learning coefficient of 2.0. And for the TLBO technique, the parameter settings considered were a population of 10 individuals and 20 iterations. These parameters were adjusted experimentally by conducting various tests with different settings and ultimately selecting those that yielded the best results.

3.1. Results with the IEEE 14-Bus Test System

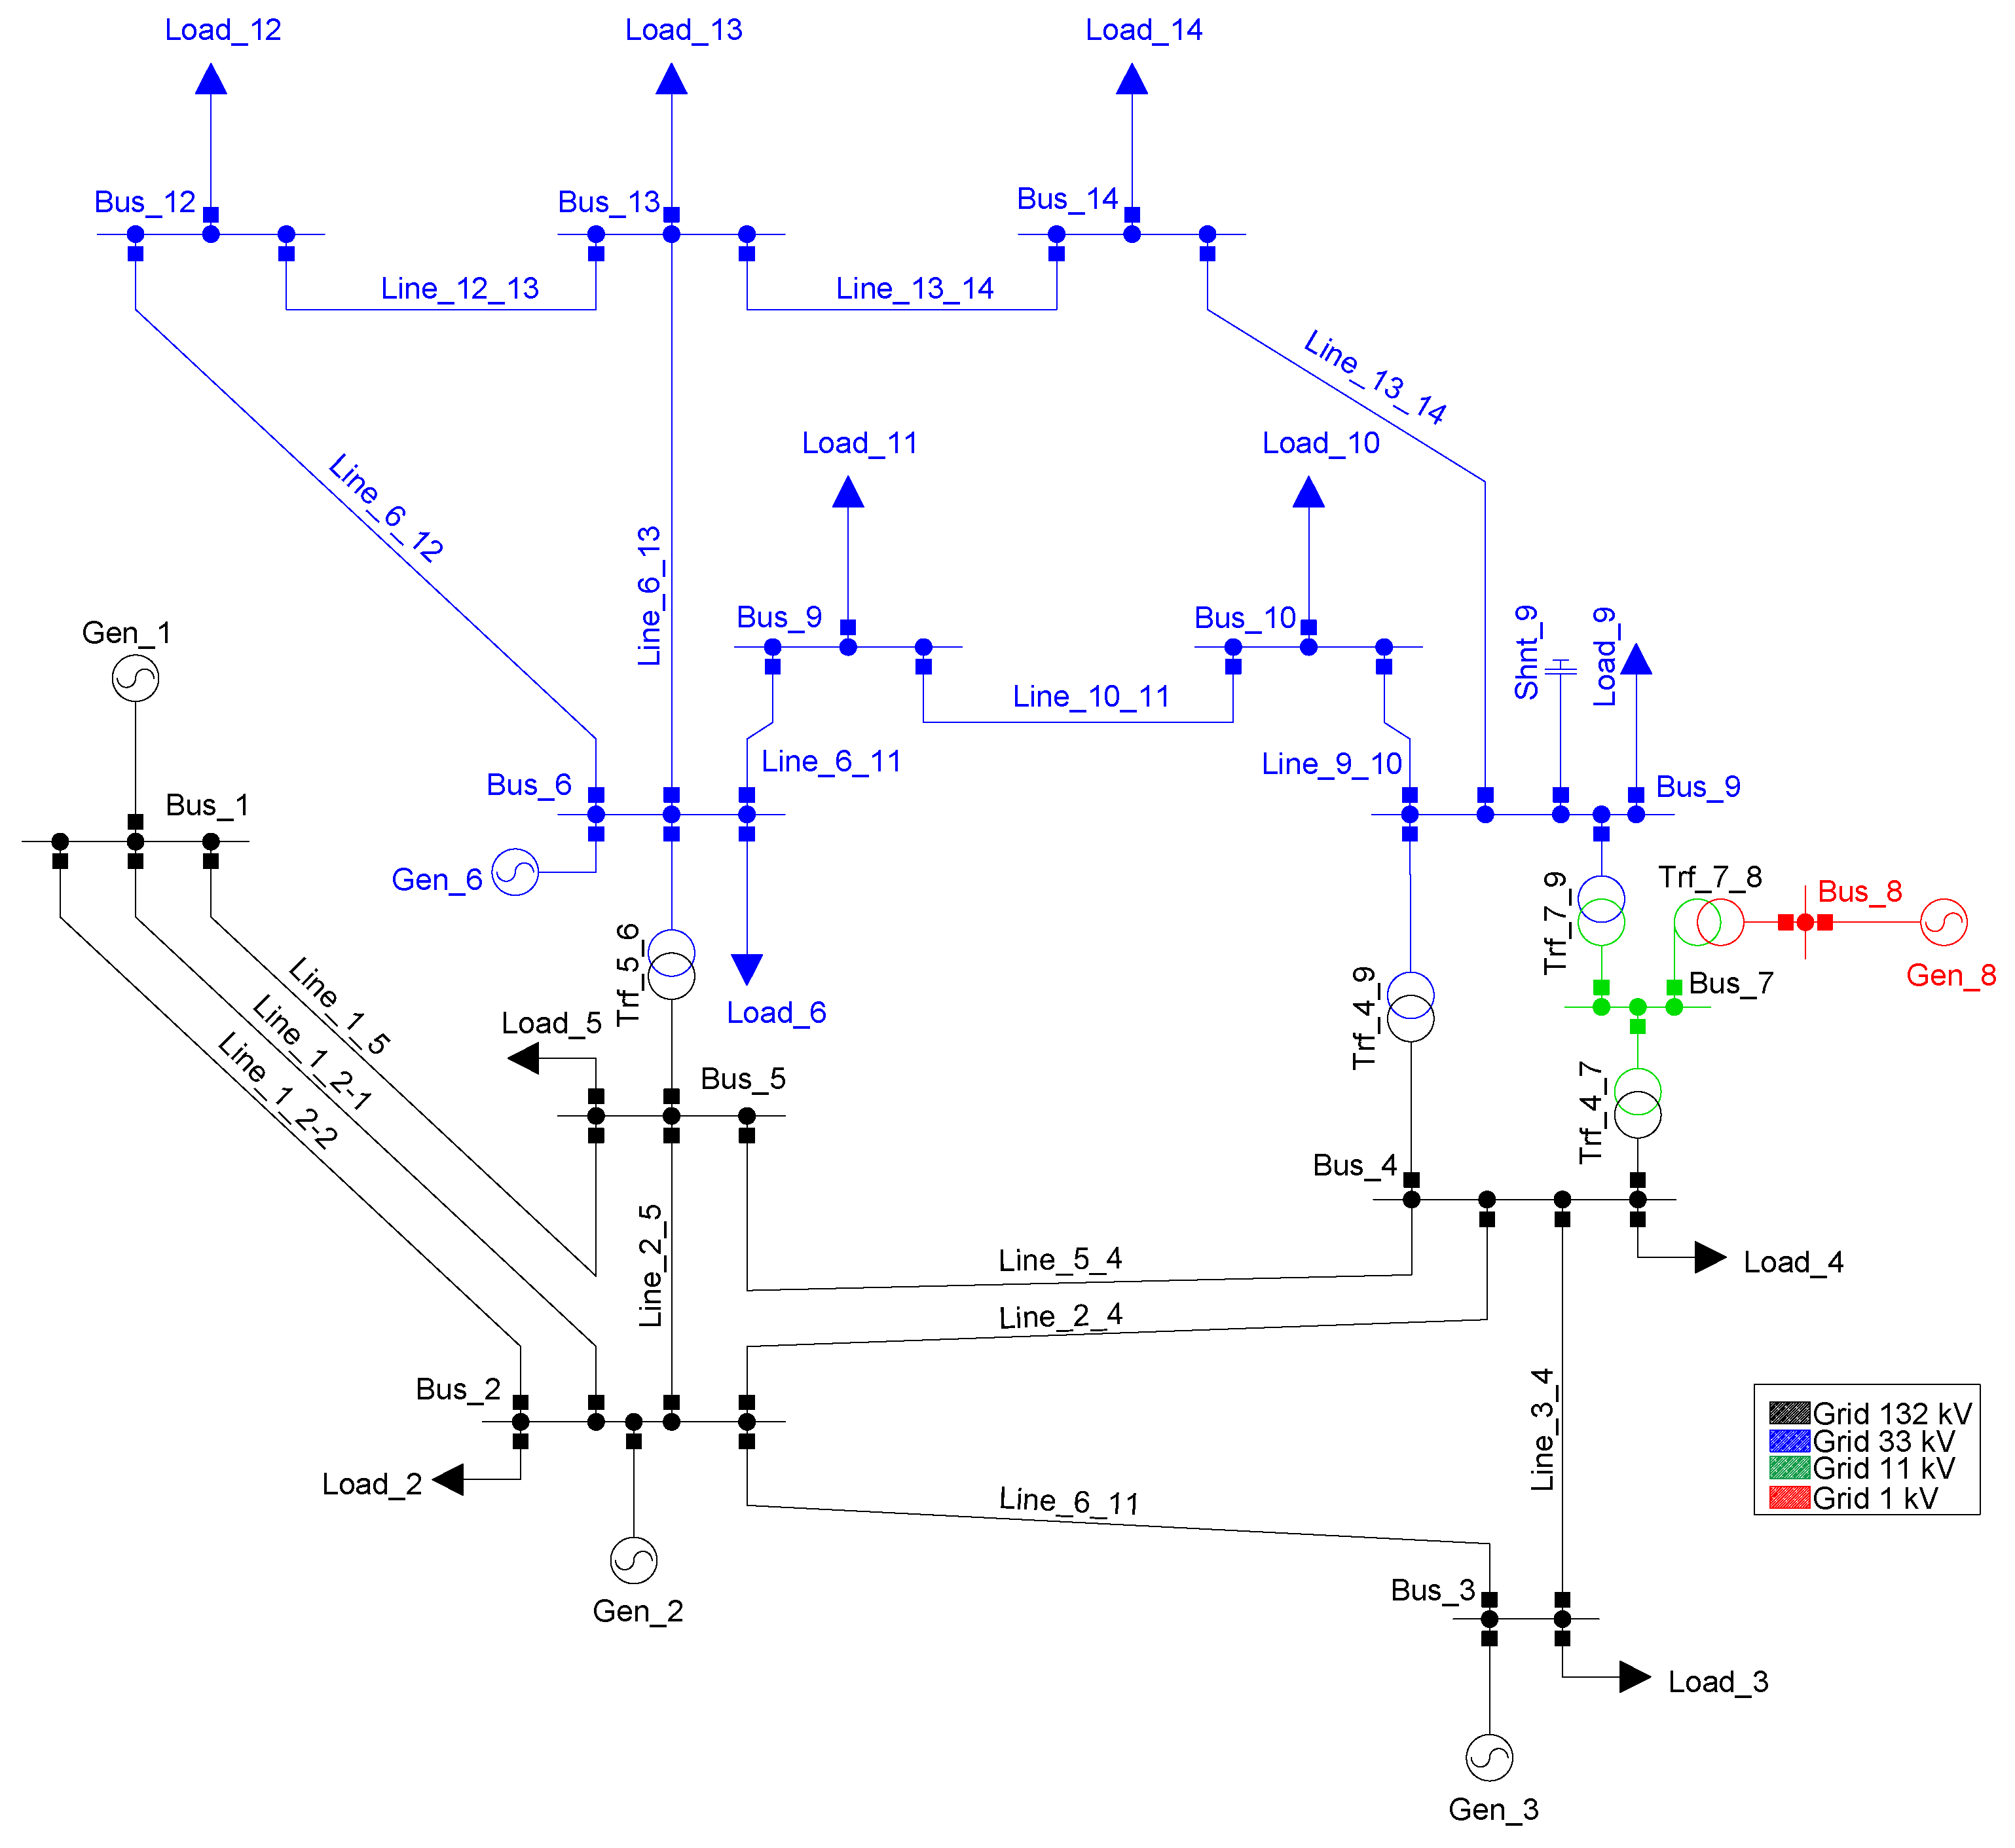
The IEEE 14-bus test system is depicted in Figure 6. In this case, only the transmission portion of the system was considered suitable for the optimal placement and sizing of M-SSSC. This test system has 3 generators, 8 transmission lines, 8 feeders at the distribution level, 5 substations at 132 kV, and 7 substations at 33 kV, along with 3 transformers (133/33 kV), 3 loads directly connected at 133 kV, and 7 loads connected at the 33 kV level. Detailed information on the IEEE 14-bus test system can be found in [34]. The test system was simulated in Matlab R2023b using Matpower [54], and multiple tests were performed using the proposed metaheuristic techniques.
Initial tests focused on minimizing line loadability, indicated as F(1) in the objective function, using the relevance index proposed in [34]. After running multiple trials, the best results are those reported in Table 5. The first column of Table 5 indicates the metaheuristic technique; the second and third columns indicate the value of F(1) without and with the M-SSSC device, respectively. Note that all metaheuristics achieved the same value of the objective function. The fourth column indicates the value of X e f , while the last column indicates the location of the M-SSSC device.
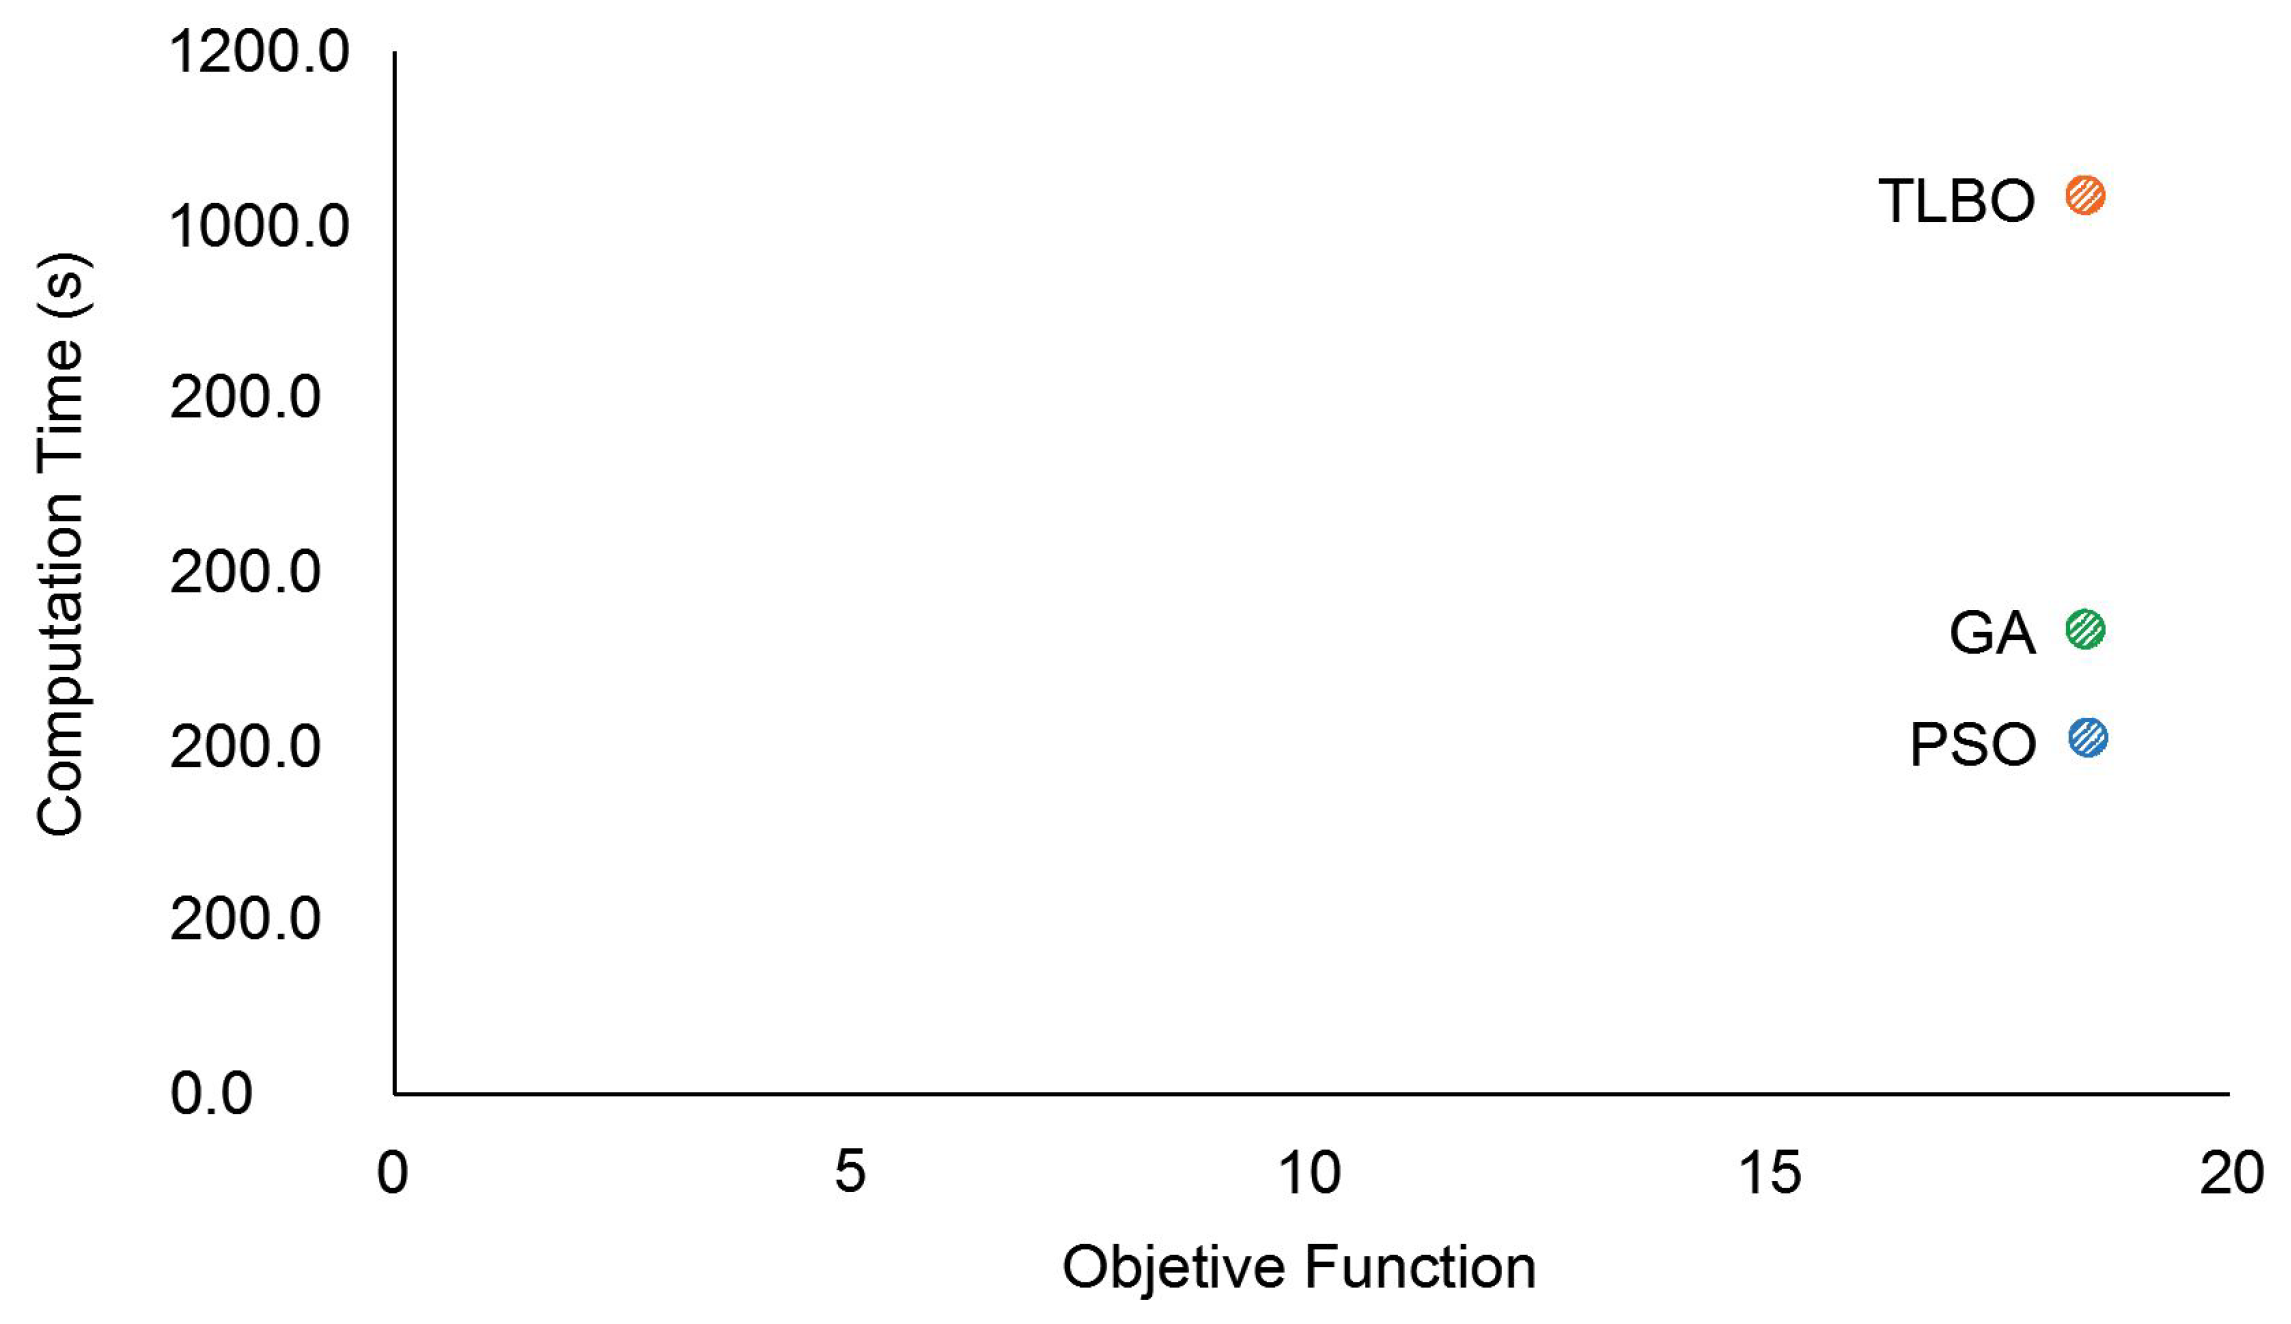
Figure 7 provides a quick comparison of metaheuristic performance in terms of solution quality and computation time. Since all techniques achieved the same value of F(1), the main difference in performance is the computation time. Notably, the PSO technique demonstrates the best performance, followed by GA.
A second test was carried out considering the four components of the objective function. The best results are reported in Table 6, obtained after multiple trials, with the same parameter settings indicated above. Table 6 shows that, in terms of loadability, voltage deviation, and stability, the results for the three metaheuristic techniques are identical. The only difference lies in the power losses. From the results presented in 
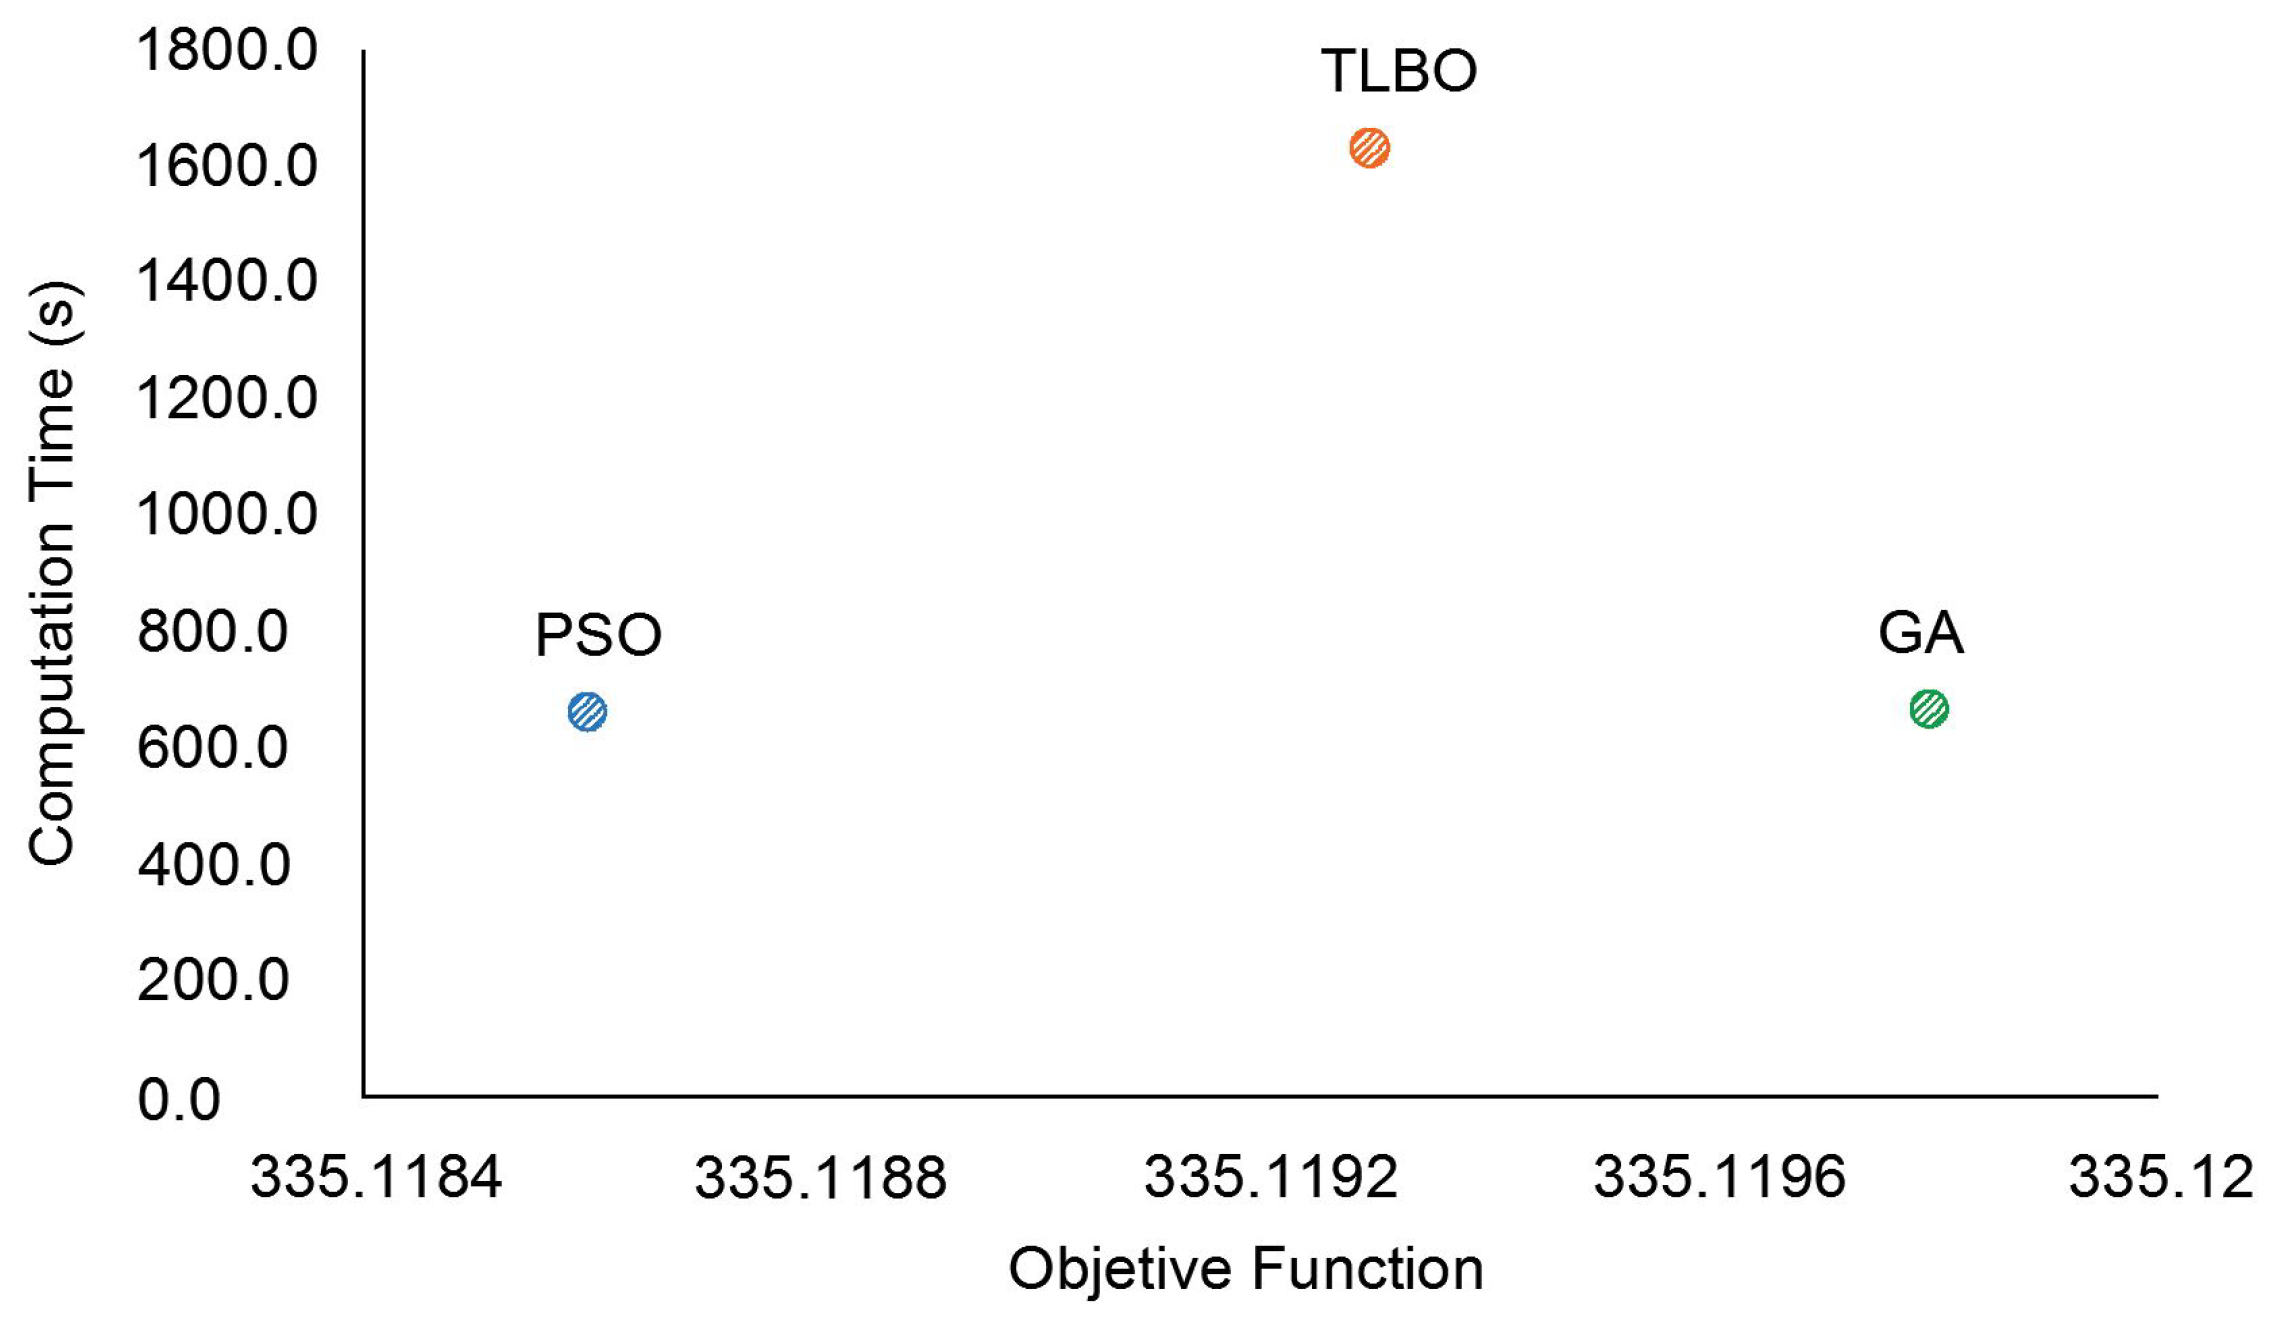
Table 6, it can be observed that an improvement of the total objective function is achieved (with and without M-SSSC), indicating a reduction in loadability, power losses, voltage deviations, and improvement of voltage stability. Note that the best objective function value (335.1222) was achieved using the PSO technique.
Figure 8 provides a quick comparison of metaheuristic performance in terms of solution quality and computation time. Notably, all three metaheuristic techniques yield similar solutions, though the TLBO technique presented the longest computation time.

3.2. Results with the GCM Sub-Area of the Colombian System

The GCM sub-area of the Colombian power system, comprising the departments of La Guajira, Cesar, and Magdalena, is a critical region for energy production and transmission in Colombia. Located in the northern part of Colombia, the GCM sub-area stretches from the Caribbean coast to the inland regions of Cesar and Magdalena. This sub-area is characterized by its diverse geographic and climatic conditions, which significantly influence its role in the national grid. The analysis of this sub-area was carried out for the years 2024 and 2026. In both cases, for the analysis of the sizing and placement of the M-SSSC, only the 220 kV transmission portion was considered.
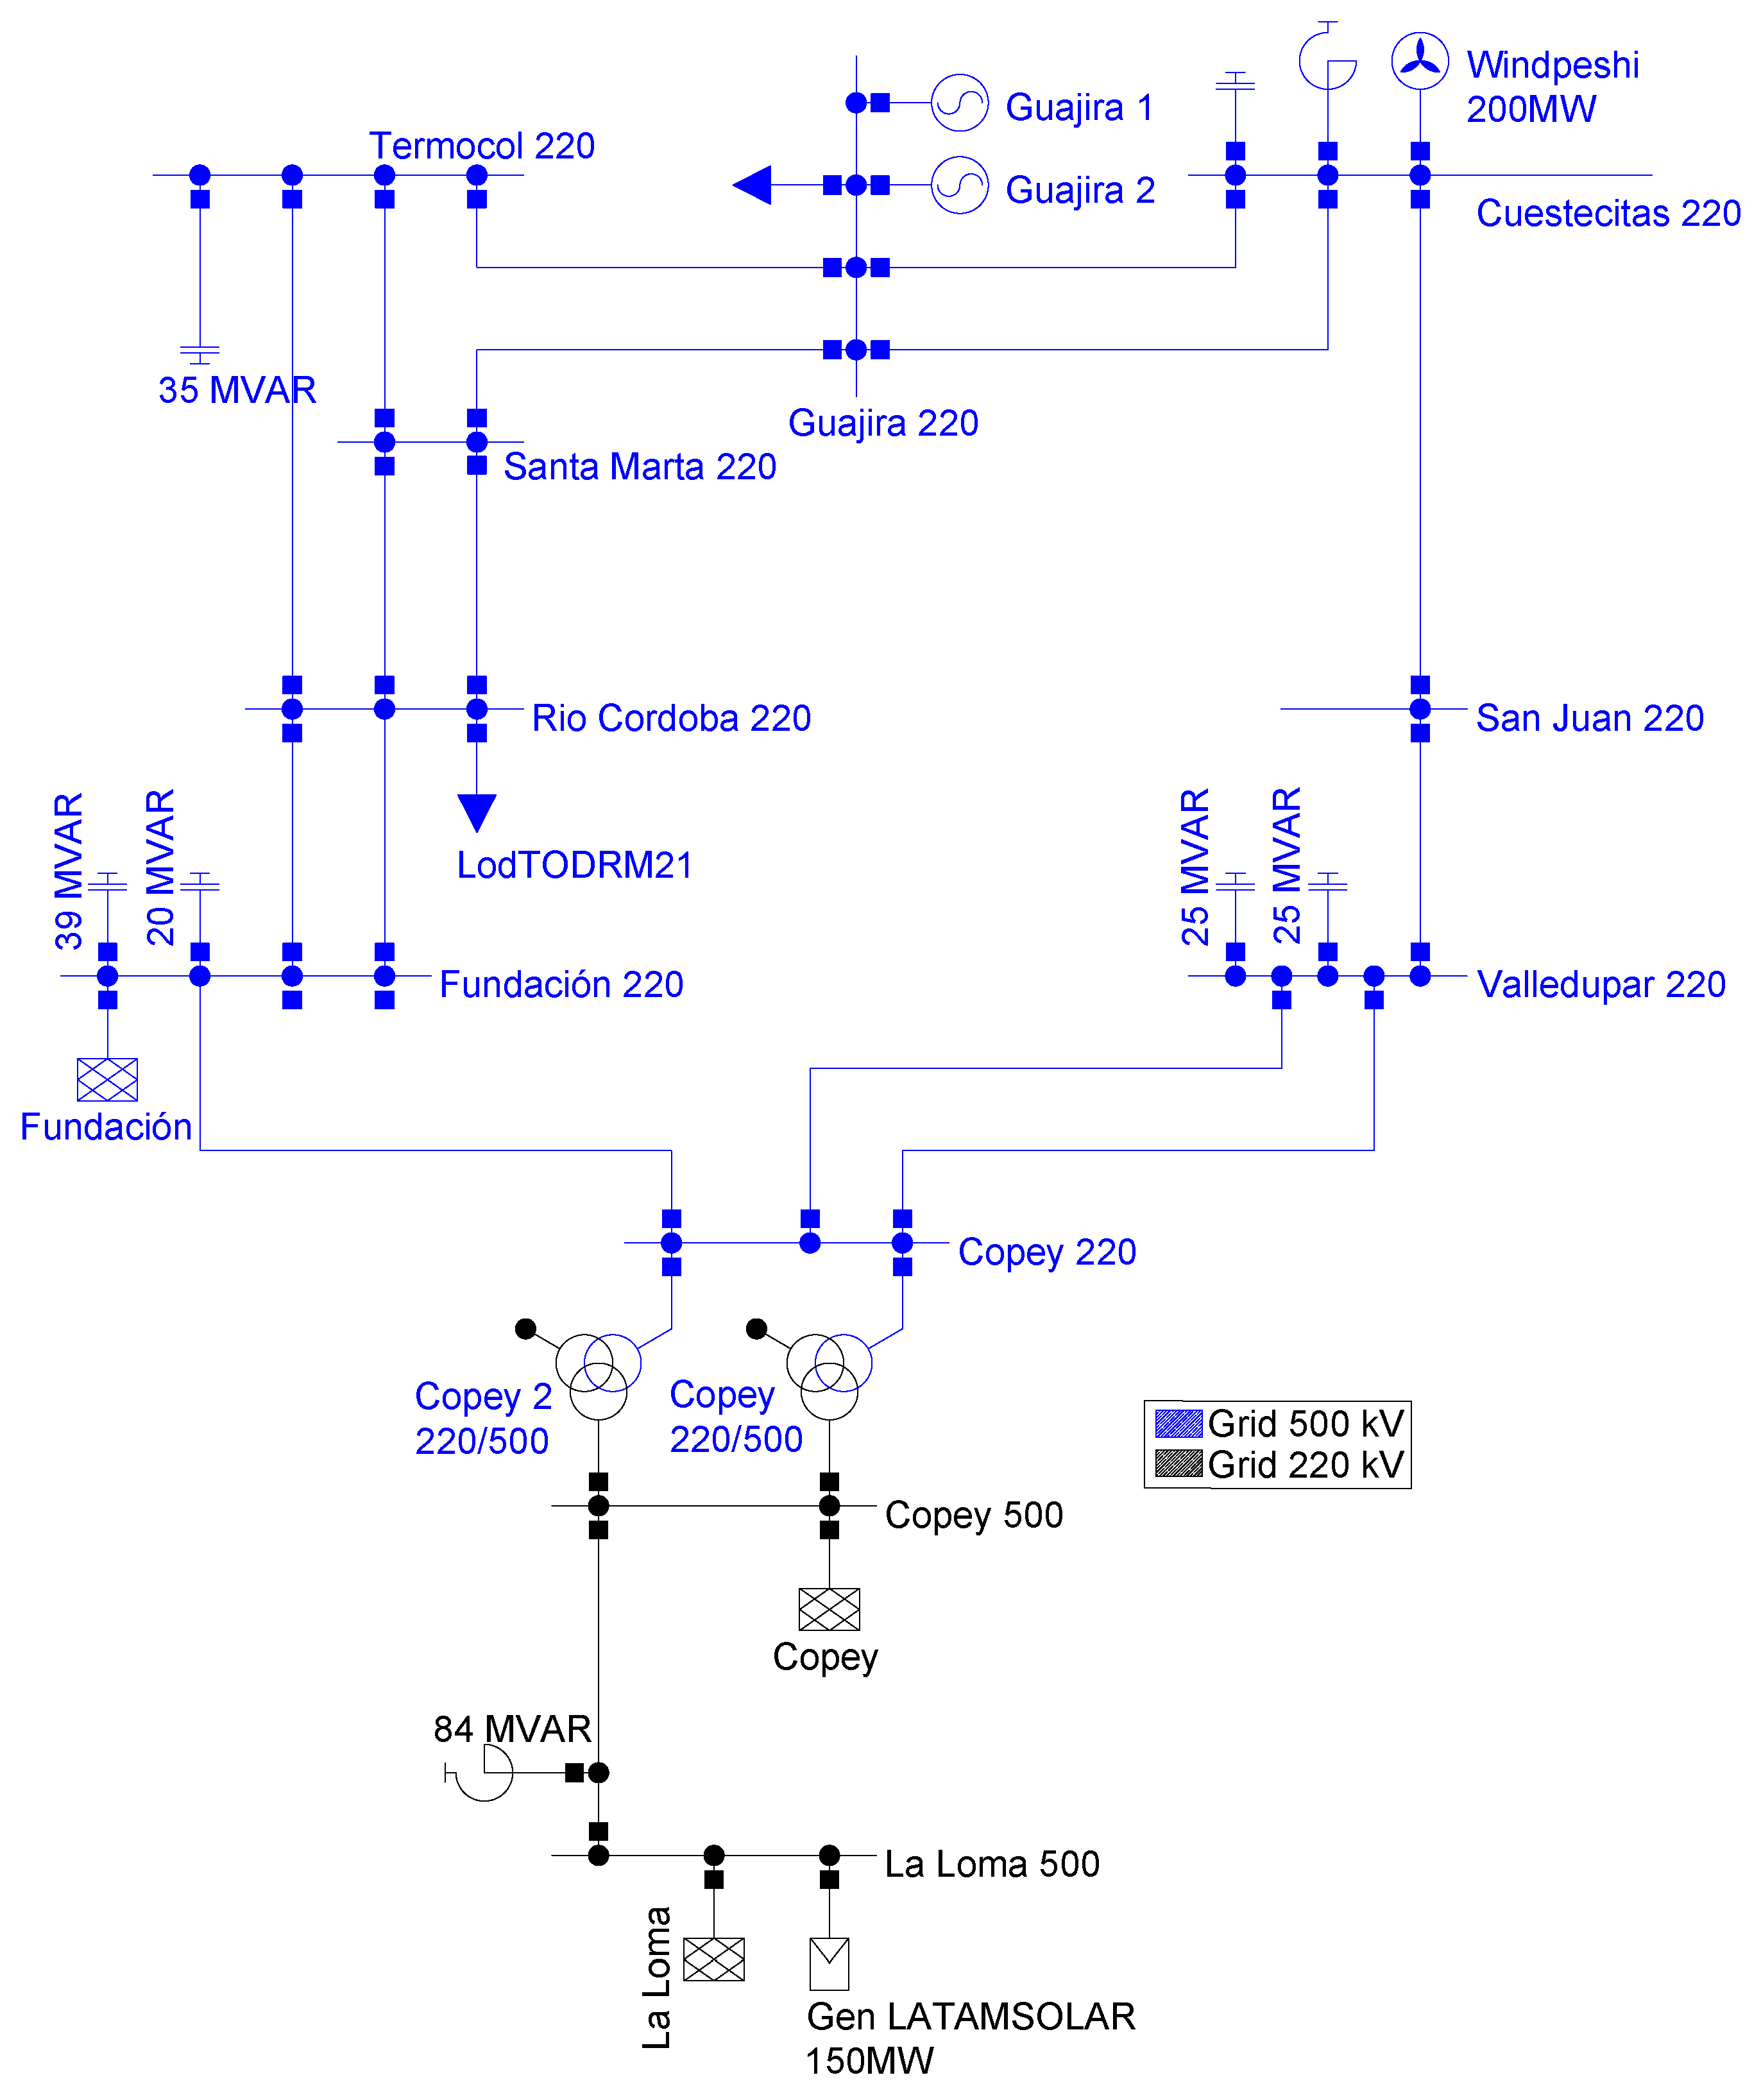
The GCM sub-area of the Colombian power system, for the year 2024, comprises 11 nodes, as shown in Figure 9. This system includes substations at 220 kV and 500 kV transmission levels, featuring 5 generators, 14 transmission lines at 220 kV, and 1 transmission line at 500 kV.
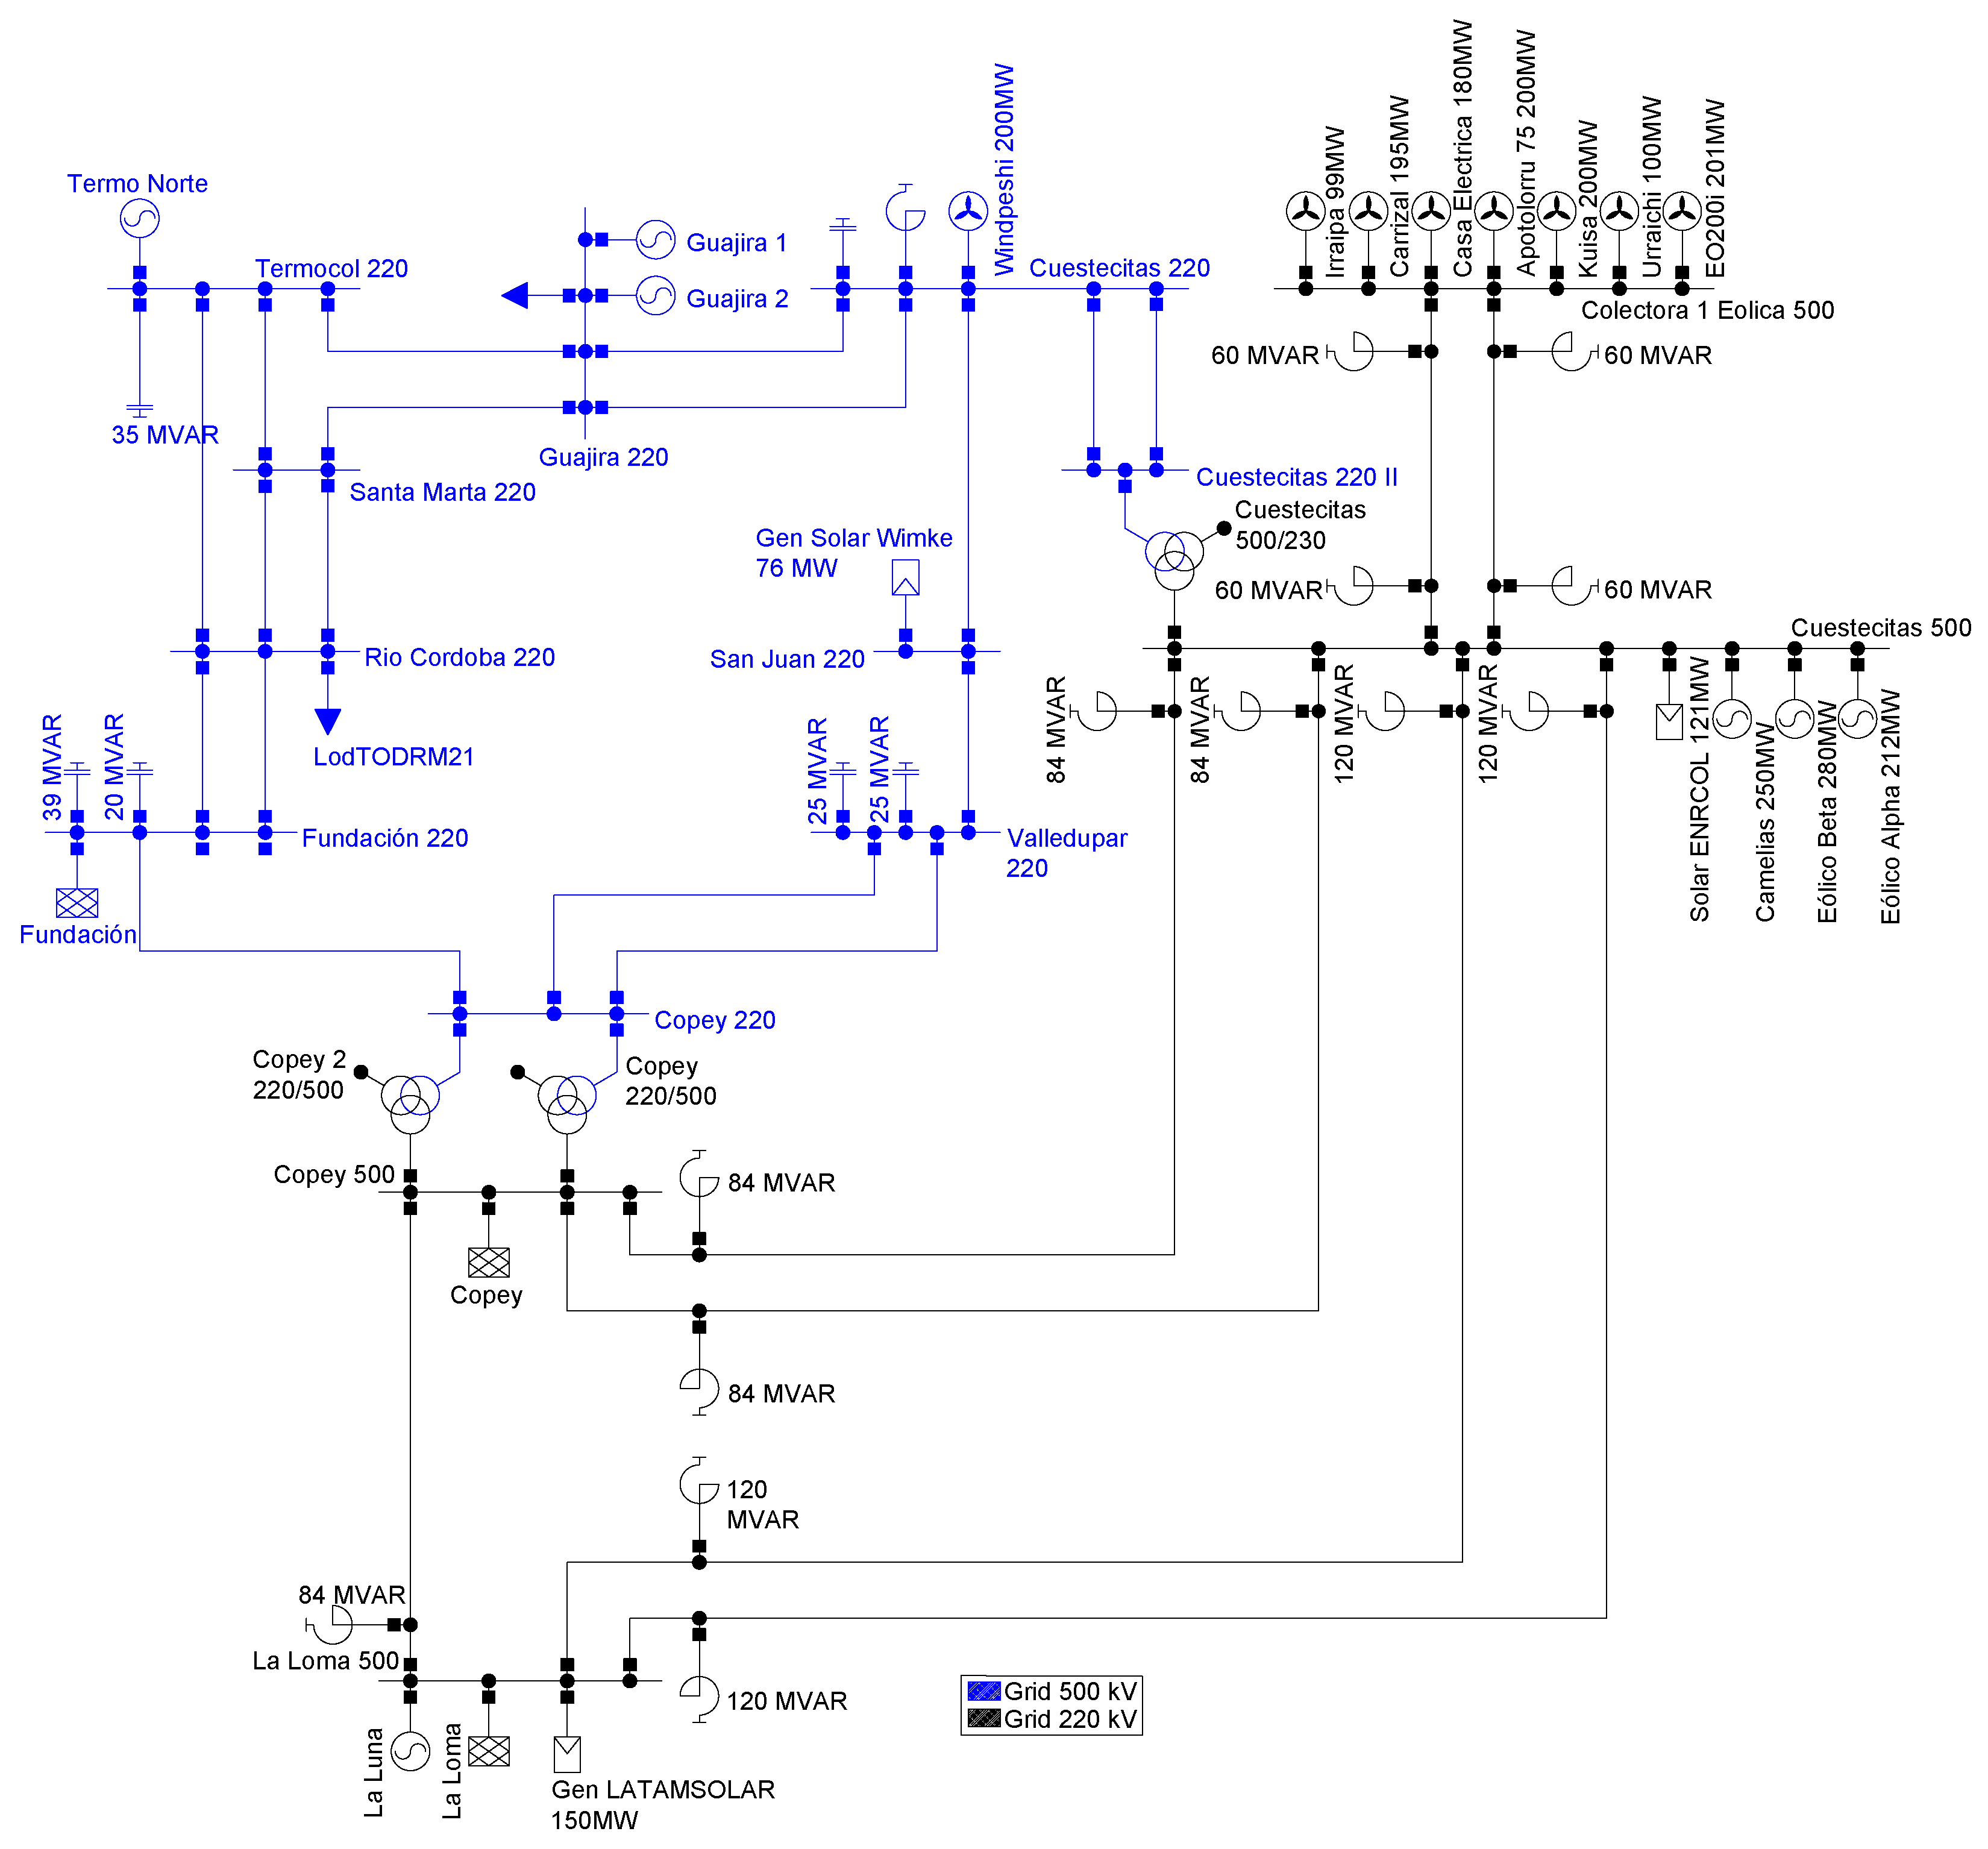
By the year 2026, the GCM sub-area will have 14 nodes, as shown in Figure 10. This system consists of substations at 220 kV and 500 kV transmission levels. It includes 17 generators, 18 transmission lines at 220 kV, and 7 transmission lines at 500 kV. Detailed information regarding this network can be consulted in [34]. The test system was simulated in Matlab R2023b using the MATPOWER program version 8.0, and several tests were performed using the proposed metaheuristic techniques.
In this case, three boundary substations are defined to locate network equivalents that represent the rest of the National Interconnected System. These are “La Loma 500 kV”, “Copey 500 kV”, and “Fundación 220 kV”. The parameters assigned to the network equivalents located at these substations were obtained from [34].
According to the transmission and generation expansion plan of UPME [35], there are some relevant scenarios in the GCM zone that allow for identifying problems under critical operating conditions. The proposed scenarios consist of combining different generation dispatches, system demands, and new generation and transmission projects. The analyses aim to cover the variables that affect the results and interfere with the evaluation of the impact of FACTS devices on the network, which are as follows:
  • Topological changes, for which two years are modeled, including the projects planned by UPME in the expansion plans [35]. The year 2024 features a transmission and generation system similar to the current one, while the year 2026 incorporates the new generation and transmission projects.
  • Key demand scenarios, including minimum and maximum demand.
  • Critical generation dispatch scenarios, corresponding to the minimum and maximum generation of the plants in the area, including the new non-conventional renewable generation projects.
  • Unavailability of transmission elements, which modify the network topology and represent more demanding cases for system operation, primarily in terms of loadability values.
Using these variables, the different scenarios shown in Table 7 are constructed.
As previously indicated, an N − 1 contingency analysis is performed, taking each element out of service, one at a time. There are other variables that may affect the analysis results. One is the operation of the existing reactive compensations in the area, and another is the operation of the power transformer taps. To eliminate the uncertainty that these elements may generate, each scenario maintains the same operating conditions. Additionally, the following criteria are considered to narrow the scope of this study:
  • The loadability analysis is narrowed down to the 220 kV transmission networks.
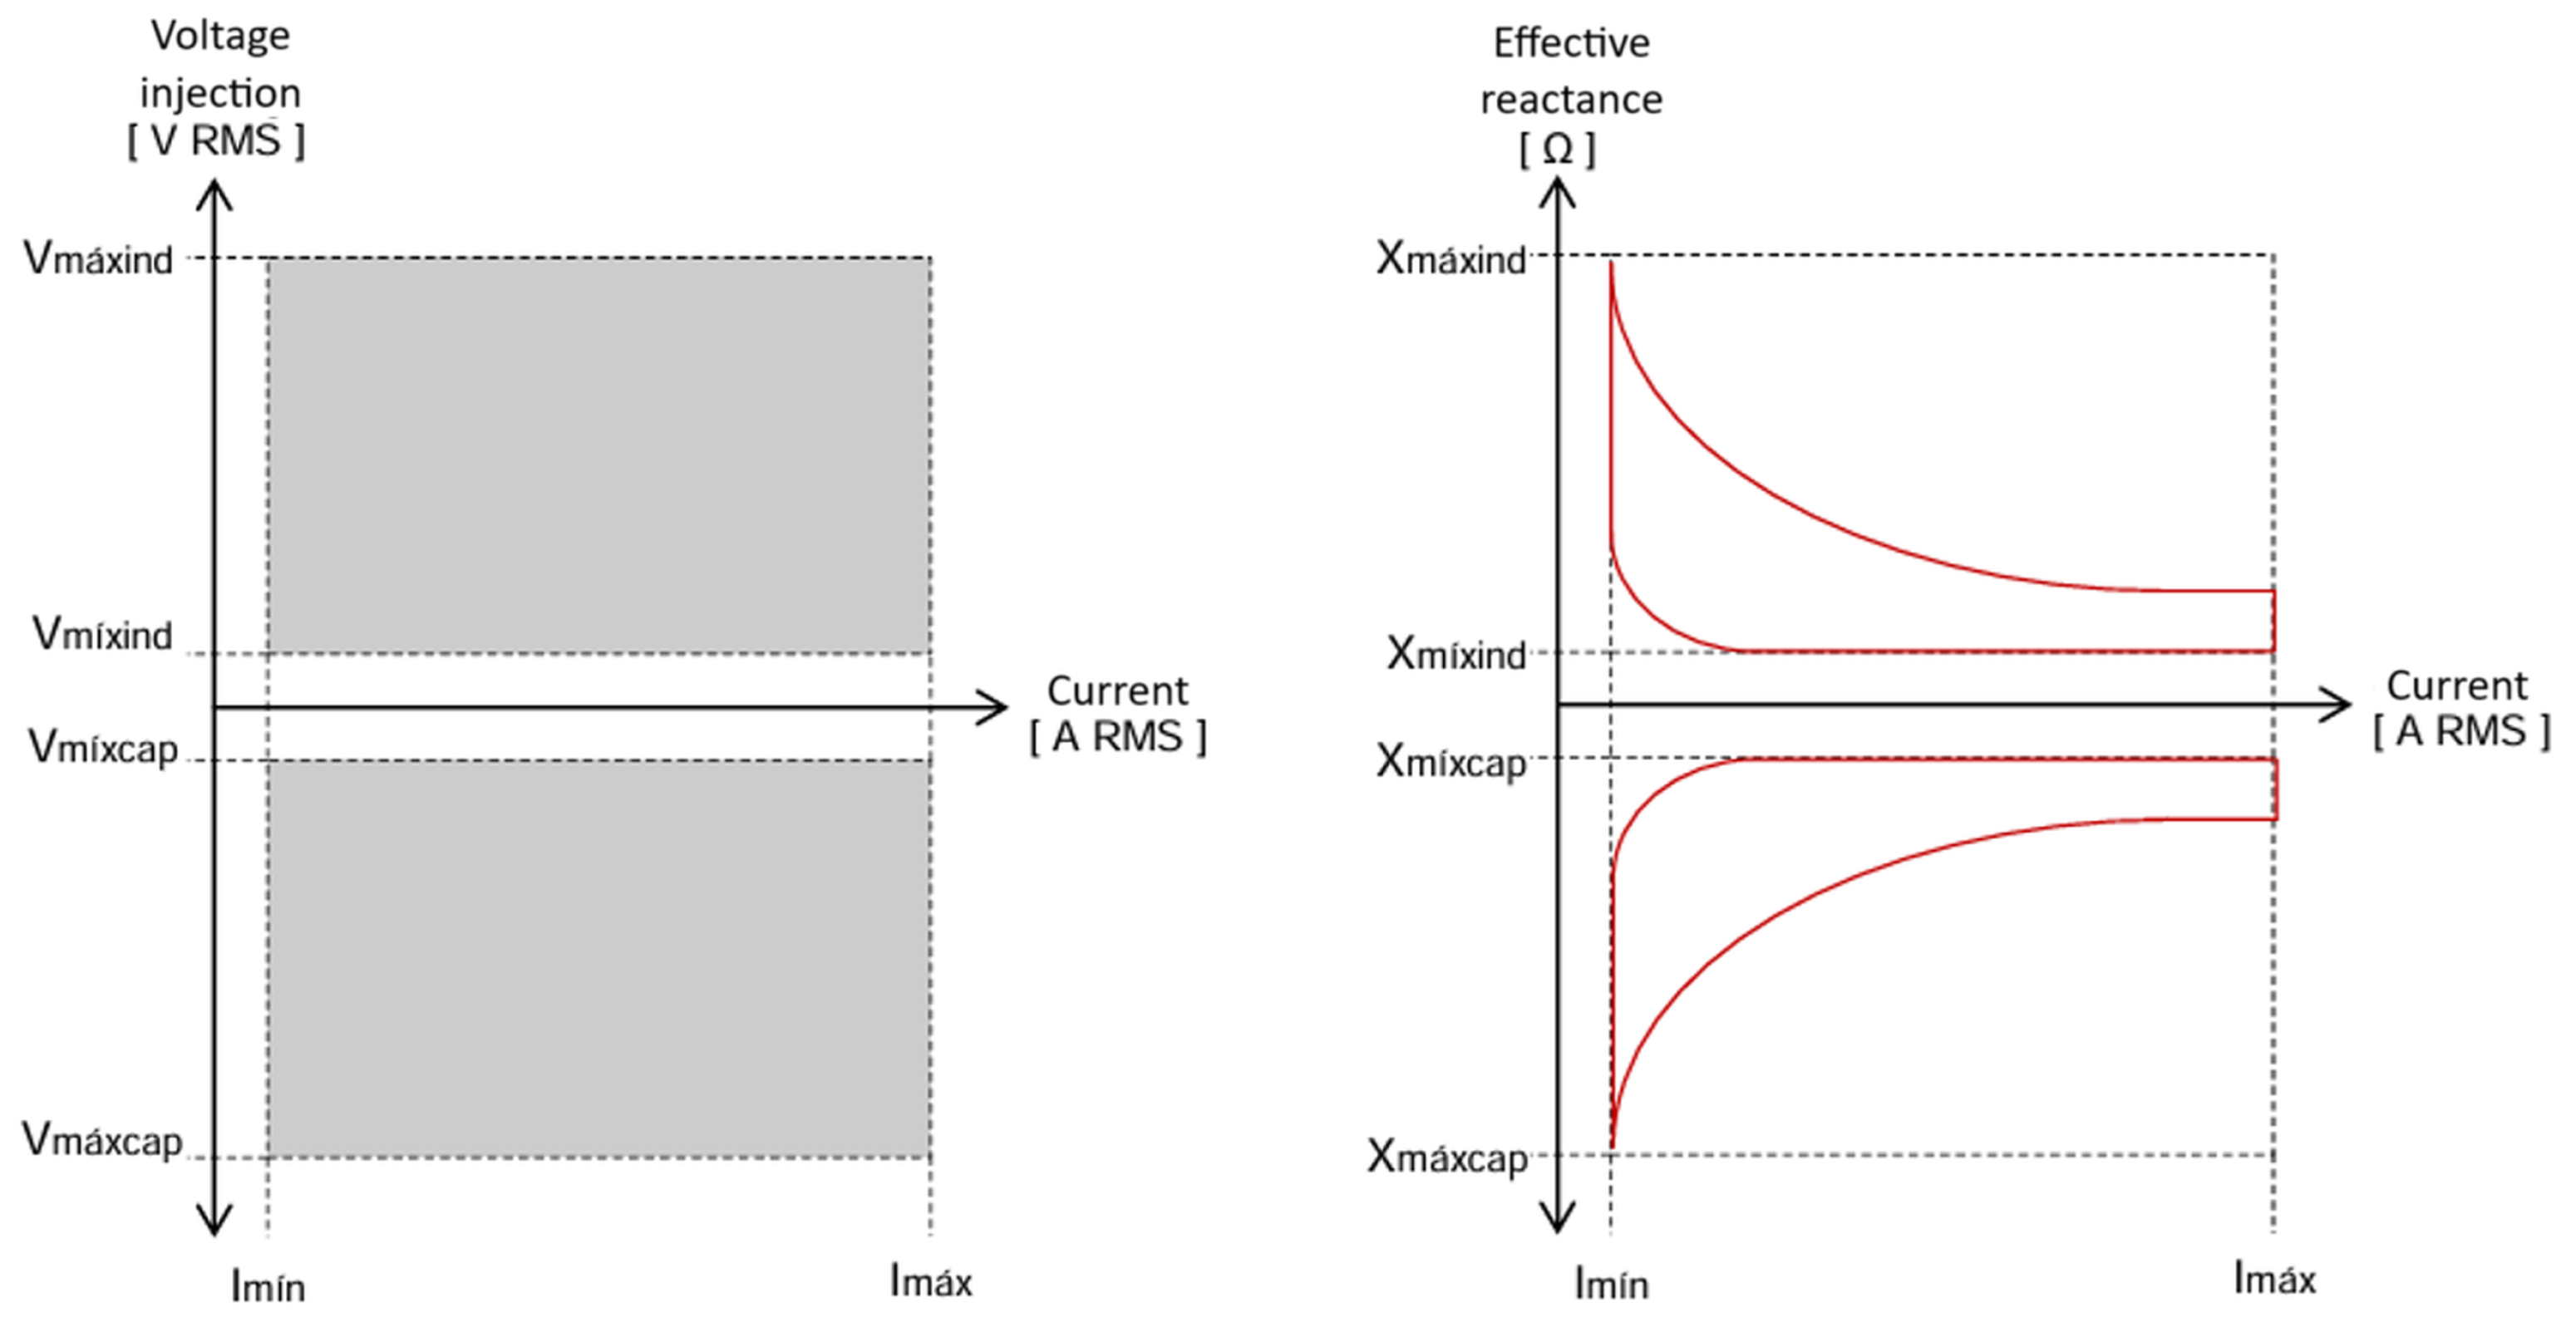
  • The performance of the M-SSSC device will be evaluated using an optimal module, which could operate as an inductive or capacitive reactance.
  • Transmission lines may operate up to a loadability of 100% under normal operating conditions, and up to 120% under contingency conditions.
For the purpose of visualizing the results, the scenarios will follow the following nomenclature: Year–Generation Dispatch–Demand. For example, the scenario 2024-Gmin-Dmin indicates the year 2024, minimum generation dispatch, and minimum demand. Also, Table 8 presents the nomenclature of the transmission lines for better visualization.
Initially, the tests were conducted considering only the loadability of the transmission lines in the objective function (F(1)). After running several tests, the parameters that yielded the best results were those reported in Table 9 and Table 10, which provide a quick comparison of the performance of the metaheuristics in terms of solution quality and computation time. Note that, as in the IEEE 14-bus system, PSO is the technique that presents the best performance, followed by GA. Similarly, the objective function is compared before and after the installation of the compensator. For the Gmin Dmin scenario, there is no loading on any of the transmission lines, so compensation with an M-SSSC device is not required.
Based on the evaluation of alternatives, five locations and operating modes for the M-SSSC device were identified to improve the system’s performance compared to the base case (without compensation). However, considering that the most critical scenario for defining reactive power absorption needs corresponds to minimum demand and maximum generation, the M-SSSC placement alternatives are narrowed down to two options: an M-SSSC system with a total impedance of 30 ohms in the Fundación–Copey transmission line or an M-SSSC system with a total impedance of 20 ohms in the Termocol–Guajira transmission line operating in capacitive mode.
These two M-SSSC placement solutions align with the findings reported in [25,34]. The former suggests the installation of a single M-SSSC device operating in capacitive mode on the Fundación–Copey line, while the latter recommends relocating 15 M-SSSC units from the Santa Marta–Termocol 220 kV transmission line to the Termocol–Guajira 220 kV transmission line, as this results in a better reduction in transmission line loadability. However, the added value of this result lies in identifying both M-SSSC locations within the same analysis and using devices with lower impedances.
Subsequently, tests were conducted considering transmission line loadability, power losses, voltage deviation, and improved voltage stability using the L-index as part of the objective function. After running several tests, the parameters that yielded the best results, with the same parameter settings indicated above, are reported in Table 11 and Table 12. These tables provide a quick comparison of the metaheuristics’ performance in terms of solution quality and computation time. Notably, all three metaheuristic techniques produced very similar solutions; however, PSO demonstrated the shortest computation time.
Observing that the most critical scenario for defining reactive power absorption requirements corresponds to minimum demand and maximum generation, the most suitable M-SSSC placement alternatives, according to the four terms of the objective function, are the Termocol–Guajira 220 kV transmission line or the Santa Marta–Guajira 220 kV transmission line, both operating in capacitive mode.
Based on the results obtained, it is recommended to install an M-SSSC device with an impedance of 9 ohms on the Fundación–Copey transmission line and another M-SSSC device with an impedance of 20 ohms on the Termocol–Guajira 220 kV transmission line.

4. Conclusions

This research presents a novel methodology for the optimal placement and sizing of Modular Static Synchronous Series Compensators (M-SSSCs) using metaheuristic techniques. Unlike previous works, this study integrates four critical objectives, namely minimizing transmission line loadability, reducing power losses, mitigating voltage deviations, and improving voltage stability through the L-index.
The methodology was validated on two test systems: the IEEE 14-bus system and a sub-area of the Colombian power grid, where aging infrastructure and increasing operational demands necessitate modernization. The results highlight the potential of M-SSSCs to address congestion issues, enhance voltage stability, and optimize power flow.
The analysis carried out identified the optimal locations and configurations for installing M-SSSC devices to enhance the performance of the electrical system under critical conditions of minimum demand and maximum generation. The most suitable alternatives consider the operation in capacitive mode of the Termocol–Guajira and Santa Marta–Guajira 220 kV transmission lines. It is recommended to install an M-SSSC device with an impedance of 9 ohms on the Fundación–Copey line and another with 20 ohms on the Termocol–Guajira line. These configurations not only optimize the loadability of the transmission lines but also reduce power losses, improve voltage stability, and minimize voltage deviations. In summary, these integrated solutions highlight the added value of using lower-impedance devices in strategic locations, aligning with the objectives of improving the efficiency and stability of the electrical system in challenging scenarios.
Furthermore, the analysis includes both normal operating conditions and contingency scenarios (N − 1), ensuring the robustness and resilience of the proposed solutions. The findings underline the practicality of M-SSSCs for enhancing grid performance in real-world systems, emphasizing their role in modernizing aging infrastructure and supporting sustainable energy transitions.

Author Contributions

Conceptualization, C.U.-A., S.D.S.-Z. and S.B.-M.; methodology, C.U.-A., S.D.S.-Z. and S.B.-M.; software, C.U.-A., S.D.S.-Z. and S.B.-M.; validation, C.U.-A., S.D.S.-Z., S.B.-M., J.M.L.-L. and N.M.-G.; formal analysis, C.U.-A., S.D.S.-Z. and S.B.-M.; investigation, C.U.-A., S.D.S.-Z., S.B.-M., J.M.L.-L. and N.M.-G.; resources, C.U.-A., S.D.S.-Z., S.B.-M., J.M.L.-L. and N.M.-G.; data curation, C.U.-A. and S.D.S.-Z.; writing—original draft preparation, C.U.-A.; writing—review and editing, C.U.-A., S.D.S.-Z., S.B.-M., J.M.L.-L. and N.M.-G.; visualization, C.U.-A., S.D.S.-Z., S.B.-M., J.M.L.-L. and N.M.-G.; supervision, N.M.-G.; project administration, S.D.S.-Z., S.B.-M., J.M.L.-L. and N.M.-G.; funding acquisition, S.D.S.-Z., J.M.L.-L. and N.M.-G. All authors have read and agreed to the published version of the manuscript.

Funding

This work was funded by the Colombian Ministry of Science, Technology, and Innovation “MinCiencias” through “Patrimonio Autónomo Fondo Nacional de Financiamiento para la Ciencia, la Tecnología y la Innovación, Francisco José de Caldas” (Perseo Alliance, Contract No. 112721-392-2023).

Data Availability Statement

The original contributions presented in this study are included in the article. Further inquiries can be directed to the corresponding author.

Acknowledgments

The authors would like to acknowledge Institución Universitaria Pascual Bravo, Proyecto de Investigación “Regulación de frecuencia eléctrica empleando resortes eléctricos en sistemas con alta penetración de energías renovables”, código PCT00036. The authors also gratefully acknowledge the financial support provided by the Colombian Ministry of Science, Technology, and Innovation “MinCiencias” through “Patrimonio Autónomo Fondo Nacional de Financiamiento para la Ciencia, la Tecnología y la Innovación, Francisco José de Caldas” (Perseo Alliance, Contract No. 112721-392-2023).

Conflicts of Interest

The authors declare no conflicts of interest.

Abbreviations

The following abbreviations are used in this manuscript:
BCABee Colony Algorithm
BSOABrainstorming Optimization Algorithm
C-HILHardware in the Loop
CPFContinuation Power Flow
CROChemical Reaction Optimization
D-FACTSDistributed FACTS
FACTSsFlexible AC Transmission Systems
GAGenetic Algorithm
GCMGuajira–Cesar–Magdalena
GSOGroup Search Optimization
GUPFCGeneralized Unified Power Flow Controller
GWOGrey Wolf Optimization
IHSImproved Harmony Search
M-FACTSModular FACTS
M-SSSModular Static Synchronous Series Compensator
M-SSSModular SSSC
MILPmixed-integer linear programming
MOEAMulti-objective Evolutionary Algorithm
ORPDOptimal Reactive Power Dispatch
PSOParticle Swarm Optimization
SVCsStatic VAR Compensators
SMIBSingle-Machine Infinite Bus
SSSCStatic Synchronous Series Compensator
STATCOMStatic Synchronous Compensator
TCSCThyristor-Controlled Series Compensators
THDTotal Harmonic Distortion
TLBOTeaching–Learning-Based Optimization Algorithm
TSTransmission Switching
UPFCUnified Power Flow Controller
VDVoltage Deviation
VSIVoltage Stability Index

Nomenclature

The nomenclature used throughout the paper is provided here for quick reference:
Indexes and Notations
iIndex of buses, 1 to i
jIndex of buses, 1 to j to elements connected between two buses
Parameters
F i m a x c Maximum loadability allowed under contingency [ % ]
I l i n e Current of the line [kA]
L C Location of the M-SSSC
L i Stability value of bus i
N B S Number of buses of the system
N C Number of shunt compensating units
N g Number of generators
N G Number of generators
N T Number of transformers
N T L Number of transmission lines
P D i Active power demands at bus i [MW]
P G Active power output of the generator [MW]
P G i Active power provided by the generator on the bus i [MW]
P G 1 Power generated at the reference bus [MW]
P S P Specified active power [MW]
Q C Reactive power of the shunt compensator [MVAr]
Q D i Reactive power demands at bus i [MVAr]
Q G Reactive power provided by the generators [MVAr]
Q G i Reactive power provided by the generator on the bus i [MVAr]
Q S P Specified reactive power [MVAr]
S T L Power flow in transmission lines [MVA]
TTransformer tap
V G Voltage at the generation bus [p.u.]
V i Voltage magnitude at bus i [p.u.]
V L 1 Voltages at buses [p.u.]
V r e f Reference voltage which is commonly equivalent to 1.0 p.u.
V s e Voltage injected by the M-SSSC [p.u.]
| V s e | Magnitude of the voltage injected by the SSSC [p.u.]
X e f Effective series reactance injected by the M-SSSC device [ Ω ]
Y i j Mutual admittance value between buses i and j  [ ]
θ i j Phase of the element i , j of the admittance matrix [rad]
θ s e Angle of the voltage injected by the SSSC [rad]

References

  1. ALAhmad, A.K.; Verayiah, R.; Ramasamy, A.; Marsadek, M.; Shareef, H. Optimal planning of energy storage system for hybrid power system considering multi correlated input stochastic variables. J. Energy Storage 2024, 82, 110615. [Google Scholar] [CrossRef]
  2. Motta, V.N.; Anjos, M.F.; Gendreau, M. Survey of optimization models for power system operation and expansion planning with demand response. Eur. J. Oper. Res. 2024, 312, 401–412. [Google Scholar] [CrossRef]
  3. Rui, X.; Sahraei-Ardakani, M.; Nudell, T.R. Linear modelling of series FACTS devices in power system operation models. IET Gener. Transm. Distrib. 2022, 16, 1047–1063. [Google Scholar] [CrossRef]
  4. Khan, N.H.; Wang, Y.; Tian, D.; Jamal, R.; Kamel, S.; Ebeed, M. Optimal Siting and Sizing of SSSC Using Modified Salp Swarm Algorithm Considering Optimal Reactive Power Dispatch Problem. IEEE Access 2021, 9, 49249–49266. [Google Scholar] [CrossRef]
  5. Bambaravanage, T.; Rodrigo, A.; Kumarawadu, S. Modeling, Simulation, and Control of a Medium-Scale Power System; Springer: Berlin/Heidelberg, Germany, 2018. [Google Scholar]
  6. Ahmad, A.A.; Sirjani, R. Optimal placement and sizing of multi-type FACTS devices in power systems using metaheuristic optimisation techniques: An updated review. Ain Shams Eng. J. 2020, 11, 611–628. [Google Scholar] [CrossRef]
  7. Jordehi, A.R. Brainstorm optimisation algorithm (BSOA): An efficient algorithm for finding optimal location and setting of FACTS devices in electric power systems. Int. J. Electr. Power Energy Syst. 2015, 69, 48–57. [Google Scholar] [CrossRef]
  8. Chethan, M.; Kuppan, R. A review of FACTS device implementation in power systems using optimization techniques. J. Eng. Appl. Sci. 2024, 71, 18. [Google Scholar] [CrossRef]
  9. Kamel, S.; Jurado, F.; Chen, Z.; Abdel-Akher, M.; Ebeed, M. Developed generalised unified power flow controller model in the Newton–Raphson power-flow analysis using combined mismatches method. IET Gener. Transm. Distrib. 2016, 10, 2177–2184. [Google Scholar] [CrossRef]
  10. Pal, K.; Verma, K.; Gandotra, R. Optimal location of FACTS devices with EVCS in power system network using PSO. E-Prime Electr. Eng. Electron. Energy 2024, 7, 100482. [Google Scholar] [CrossRef]
  11. Li, C.; Xiao, L.; Cao, Y.; Zhu, Q.; Fang, B.; Tan, Y.; Zeng, L. Optimal allocation of multi-type FACTS devices in power systems based on power flow entropy. J. Mod. Power Syst. Clean Energy 2014, 2, 173–180. [Google Scholar] [CrossRef]
  12. Kamarposhti, M.A.; Shokouhandeh, H.; Colak, I.; Band, S.S.; Eguchi, K. Optimal Location of FACTS Devices in Order to Simultaneously Improving Transmission Losses and Stability Margin Using Artificial Bee Colony Algorithm. IEEE Access 2021, 9, 125920–125929. [Google Scholar] [CrossRef]
  13. Sang, Y.; Sahraei-Ardakani, M. The Interdependence Between Transmission Switching and Variable-Impedance Series FACTS Devices. IEEE Trans. Power Syst. 2018, 33, 2792–2803. [Google Scholar] [CrossRef]
  14. Jordehi, A.R. Particle swarm optimisation (PSO) for allocation of FACTS devices in electric transmission systems: A review. Renew. Sustain. Energy Rev. 2015, 52, 1260–1267. [Google Scholar] [CrossRef]
  15. Awad, A.; Kamel, S.; Hassan, M.H.; Jurado, F. Optimal Allocation of FACTS Devices in Power Systems: A Multi-Objective Optimization Approach with Consideration of Wind Generation Integration. In Proceedings of the 2024 International Conference on Artificial Intelligence, Computer, Data Sciences and Applications (ACDSA), Victoria, Seychelles, 1–2 February 2024; pp. 1–6. [Google Scholar]
  16. Jain, A.; Yadav, L.K.; Omer, A.; Bhullar, S. Analysis of Effectiveness of SSSC in Transmission Network using PI Controlled Technique. Energy Procedia 2017, 117, 699–707. [Google Scholar] [CrossRef]
  17. Kamel, S.; Jurado, F.; Chen, Z. Power flow control for transmission networks with implicit modeling of static synchronous series compensator. Int. J. Electr. Power Energy Syst. 2015, 64, 911–920. [Google Scholar] [CrossRef]
  18. Amin, A.; Kamel, S.; Ebeed, M. Optimal reactive power dispatch considering SSSC using Grey Wolf algorithm. In Proceedings of the 2016 Eighteenth International Middle East Power Systems Conference (MEPCON), Cairo, Egypt, 27–29 December 2016; pp. 780–785. [Google Scholar] [CrossRef]
  19. Dutta, S.; Roy, P.K.; Nandi, D. Optimal allocation of static synchronous series compensator controllers using chemical reaction optimization for reactive power dispatch. Int. J. Energy Optim. Eng. (IJEOE) 2016, 5, 43–62. [Google Scholar] [CrossRef]
  20. Ebeed, M.; Kamel, S.; Nasrat, L.S. Optimal siting and sizing of SSSC using improved harmony search algorithm considering non-smooth cost functions. In Proceedings of the 2017 Nineteenth International Middle East Power Systems Conference (MEPCON), Cairo, Egypt, 19–21 December 2017; pp. 1286–1291. [Google Scholar] [CrossRef]
  21. Mirzapour, O.; Rui, X.; Pruneau, B.; Sahraei-Ardakani, M. Flexible Transmission: A Comprehensive Review of Concepts, Technologies, and Market. Electr. Eng. Syst. Sci. 2023. [Google Scholar] [CrossRef]
  22. Xenos, P.; Krommydas, K.F.; Karavas, C.S.G.; Melissaris, D.; Plakas, K.A.; Dikaiakos, C.N.; Moraitis, I. A Modular Static Synchronous Series Compensator Offering Improved Scalability and Replicability Properties. In Proceedings of the 2022 2nd International Conference on Energy Transition in the Mediterranean Area (SyNERGY MED), Thessaloniki, Greece, 17–19 October 2022; pp. 1–6. [Google Scholar] [CrossRef]
  23. Zhao, Z.; Soroudi, A. Optimal Deployment of Mobile MSSSC in Transmission System. Energies 2022, 15, 3878. [Google Scholar] [CrossRef]
  24. Hojsak, I.; Longoria, M. Improving Transfer Capability Without Series Compensation Challenges: Utilizing M-SSSC Technology to Provide Series Compensation while Avoiding Sub-Synchronous Resonance Risk. IEEE Power Energy Mag. 2022, 20, 74–82. [Google Scholar] [CrossRef]
  25. Hincapie, S.; Calderon, J.A.; Borda, C.E.; Duque, A.; Macedo, P.; Gallego, J.P. Real-Time Simulations to Validate the Impact of M-SSSC Devices on Protection Coordination in Power Systems. Electr. Eng. Syst. Sci. 2023. [Google Scholar] [CrossRef]
  26. Hincapie, S.; Ordonez, C.A.; Patino, M.; Duque, A. Test Case: Modular SSSC and LCC-based HVDC Link Technical Synergies. In Proceedings of the 17th International Conference on AC and DC Power Transmission (ACDC 2021), Online, 7–8 December 2021; Volume 2021, pp. 210–215. [Google Scholar] [CrossRef]
  27. Ugwuanyi, N.S.; Nwogu, O.A.; Ozioko, I.O.; Ekwue, A.O. An easy method for simultaneously enhancing power system voltage and angle stability using STATCOM. Sci. Afr. 2024, 25, e02248. [Google Scholar]
  28. Jaya, J.; Linda, M.M. A New-Fangled Approach for Optimal Placement of Facts Controllers in a Hybridized System. In Electric Power Components and Systems; Taylor & Francis: Abingdon, UK, 2024; pp. 1–17. [Google Scholar]
  29. Hernandez, D. El Sistema Eléctrico de Colombia está Envejecido; Alerta la Contraloría: Bogotá, Colombia, 2024.
  30. Del Rosso, A.D.; Eckroad, S.W. Energy Storage for Relief of Transmission Congestion. IEEE Trans. Smart Grid 2014, 5, 1138–1146. [Google Scholar] [CrossRef]
  31. Zhang, X.; Shi, D.; Wang, Z.; Zeng, B.; Wang, X.; Tomsovic, K.; Jin, Y. Optimal Allocation of Series FACTS Devices Under High Penetration of Wind Power Within a Market Environment. IEEE Trans. Power Syst. 2018, 33, 6206–6217. [Google Scholar] [CrossRef]
  32. Almarzooqi, A.H.; Osman, A.H.; Shabaan, M.; Nassar, M. An Exploratory Study of the Perception of Peer-to-Peer Energy Trading within the Power Distribution Network in the UAE. Sustainability 2023, 15, 4891. [Google Scholar] [CrossRef]
  33. Alajrash, B.H.; Salem, M.; Swadi, M.; Senjyu, T.; Kamarol, M.; Motahhir, S. A comprehensive review of FACTS devices in modern power systems: Addressing power quality, optimal placement, and stability with renewable energy penetration. Energy Rep. 2024, 11, 5350–5371. [Google Scholar] [CrossRef]
  34. Botero, D.M. Compensadores Serie Estáticos Síncronos para Reducir Cargabilidad en Líneas y Pérdidas Eléctricas para Redes de Transmisión en Colombia. Ph.D. Thesis, Universidad Nacional de Colombia, Bogotá, Colombia, 2022. [Google Scholar]
  35. UPME. Plan de Expansión de Referencia Generación-Transmisión 2020–2034. In Plan de Expansión en Transmisión, 2020; UPME: Bogota, Colombia, 2020; Volume 3, p. 145. [Google Scholar]
  36. Saldarriaga-Zuluaga, S.D.; López-Lezama, J.M.; Muñoz-Galeano, N. Optimal coordination of overcurrent relays in microgrids considering a non-standard characteristic. Energies 2020, 13, 922. [Google Scholar] [CrossRef]
  37. Agudelo, L.; López-Lezama, J.M.; Muñoz-Galeano, N. Vulnerability assessment of power systems to intentional attacks using a specialized genetic algorithm. Dyna 2015, 82, 78–84. [Google Scholar] [CrossRef]
  38. López-Lezama, J.M.; Cortina-Gómez, J.; Muñoz-Galeano, N. Assessment of the Electric Grid Interdiction Problem using a nonlinear modeling approach. Electr. Power Syst. Res. 2017, 144, 243–254. [Google Scholar] [CrossRef]
  39. Castillo Salazar, C.A.; Conde Enriquez, A. Coordination of Overcurrent Relays Using Genetic Algorithms and Unconventional Curves. IEEE Lat. Am. Trans. 2014, 12, 1449–1455. [Google Scholar] [CrossRef]
  40. Huamannahui Huanca, D.; Gallego Pareja, L.A. Chu and Beasley Genetic Algorithm to Solve the Transmission Network Expansion Planning Problem Considering Active Power Losses. IEEE Lat. Am. Trans. 2021, 19, 1967–1975. [Google Scholar] [CrossRef]
  41. Bustamante-Mesa, S.; Gonzalez-Sanchez, J.W.; Saldarriaga-Zuluaga, S.D.; López-Lezama, J.M.; Muñoz-Galeano, N. Optimal Estimation of Under-Frequency Load Shedding Scheme Parameters by Considering Virtual Inertia Injection. Energies 2024, 17, 279. [Google Scholar] [CrossRef]
  42. Dandotia, A.; Gupta, M.K.; Banerjee, M.K.; Singh, S.K.; Đurin, B.; Dogančić, D.; Kranjčić, N. Optimal Placement and Size of SVC with Cost-Effective Function Using Genetic Algorithm for Voltage Profile Improvement in Renewable Integrated Power Systems. Energies 2023, 16, 2637. [Google Scholar] [CrossRef]
  43. Ersavas, C.; Karatepe, E. Optimum allocation of FACTS devices under load uncertainty based on penalty functions with genetic algorithm. Electr. Eng. 2017, 99, 73–84. [Google Scholar] [CrossRef]
  44. Bakir, H.; Kulaksiz, A.A. Modelling and voltage control of the solar-wind hybrid micro-grid with optimized STATCOM using GA and BFA. Eng. Sci. Technol. Int. J. 2020, 23, 576–584. [Google Scholar] [CrossRef]
  45. Águila-León, J.; Vargas-Salgado, C.; Díaz-Bello, D.; Montagud-Montalvá, C. Optimizing photovoltaic systems: A meta-optimization approach with GWO-Enhanced PSO algorithm for improving MPPT controllers. Renew. Energy 2024, 230, 120892. [Google Scholar] [CrossRef]
  46. Iqbal, A.; Singh, G.K. PSO based controlled six-phase grid connected induction generator for wind energy generation. CES Trans. Electr. Mach. Syst. 2021, 5, 41–49. [Google Scholar] [CrossRef]
  47. Gharghan, S.K.; Nordin, R.; Ismail, M.; Ali, J.A. Accurate Wireless Sensor Localization Technique Based on Hybrid PSO-ANN Algorithm for Indoor and Outdoor Track Cycling. IEEE Sens. J. 2016, 16, 529–541. [Google Scholar] [CrossRef]
  48. Zaini, F.A.; Sulaima, M.F.; Razak, I.A.W.A.; Zulkafli, N.I.; Mokhlis, H. A Review on the Applications of PSO-Based Algorithm in Demand Side Management: Challenges and Opportunities. IEEE Access 2023, 11, 53373–53400. [Google Scholar] [CrossRef]
  49. Saldarriaga-Zuluaga, S.D.; López-Lezama, J.M.; Muñoz-Galeano, N. Optimal coordination of over-current relays in microgrids considering multiple characteristic curves. Alex. Eng. J. 2021, 60, 2093–2113. [Google Scholar] [CrossRef]
  50. Cheon, J.; Bae, S.B.; Min, S.G. Analytical Modeling and Optimization of PM Synchronous Machines Using Novel R262-TLBO Algorithm. IEEE Trans. Magn. 2023, 59, 8104516. [Google Scholar] [CrossRef]
  51. Yang, Z.; Li, K.; Niu, Q.; Xue, Y.; Foley, A. A self-learning TLBO based dynamic economic/environmental dispatch considering multiple plug-in electric vehicle loads. J. Mod. Power Syst. Clean Energy 2014, 2, 298–307. [Google Scholar] [CrossRef]
  52. Savsani, P.; Jhala, R.L.; Savsani, V.J. Comparative Study of Different Metaheuristics for the Trajectory Planning of a Robotic Arm. IEEE Syst. J. 2016, 10, 697–708. [Google Scholar] [CrossRef]
  53. Xue, R.; Wu, Z. A Survey of Application and Classification on Teaching-Learning-Based Optimization Algorithm. IEEE Access 2020, 8, 1062–1079. [Google Scholar] [CrossRef]
  54. Zimmerman, R.D.; Murillo-Sánchez, C.E.; Thomas, R.J. MATPOWER: Steady-State Operations, Planning, and Analysis Tools for Power Systems Research and Education. IEEE Trans. Power Syst. 2011, 26, 12–19. [Google Scholar] [CrossRef]
Figure 1. Basic operating diagram of the M-SSSC.
Processes 13 00034 g001
Figure 2. I-V and I-X characteristic of the M-SSSC device.
Processes 13 00034 g002
Figure 3. Flowchart of the implemented GA.
Processes 13 00034 g003
Figure 4. Flowchart of the implemented PSO.
Processes 13 00034 g004
Figure 5. Flowchart of the implemented TLBO algorithm.
Processes 13 00034 g005
Figure 6. IEEE 14-bus test system.
Processes 13 00034 g006
Figure 7. Results for different metaheuristics (IEEE 14-bus test system).
Processes 13 00034 g007
Figure 8. Computation time vs. value of the OF.
Processes 13 00034 g008
Figure 9. Sub-area GCM in 2024.
Processes 13 00034 g009
Figure 10. Sub-area GCM in 2026.
Processes 13 00034 g010
Table 1. Contrast with previous research work.
ReferenceLoadabilityPower LossesVoltage DeviationsL-IndexReal Application
[18] x x
[33] xx
[19] x
[20]x
[21]x
[22]x x
[23]xx x
[24] xx
[25]x x
[26] x xx
Proposedxxxxx
Table 2. Loadability relevance ranges in normal operation.
RangeRelevance
60 > Loadability ≥ 00.0
70 > Loadability ≥ 600.10
80 > Loadability ≥ 700.15
90 > Loadability ≥ 800.25
100 > Loadability ≥ 900.50
Loadability > 10010.00
Table 3. Relevance ranges of loadability under contingency (IEEE 14-bus test system).
RangeRelevance
110% > Loadability ≥ 100%0.20
120% > Loadability ≥ 110%0.30
130% > Loadability ≥ 120%0.5
Loadability ≥ 130%10.00
Table 4. Relevance ranges of loadability under contingency (Colombian system).
RangeRelevance
105% > Loadability ≥ 100%0.10
110% > Loadability ≥ 105%0.15
115% > Loadability ≥ 110%0.25
120% > Loadability ≥ 115%0.25
Loadability ≥ 120%10.00
Table 5. Results of the metaheuristic techniques (IEEE 14-bus test system).
TechniqueWithout M-SSSCWith M-SSSC X ef L C
GA21.8518.4512.0694line 1_2-1 and 1_2-2
PSO21.8518.4512.1618line 1_2-1 and 1_2-2
TLBO21.8518.4511.8908line 1_2-1 and 1_2-2
Table 6. Results of meta-heuristic techniques.
TechniqueWithout M-SSSCWith M-SSSCF(1)F(3)F(2)F(4) X ef L C
GA337.3458335.119318.8256.4047137.48320.97511.7421line 1_2-1 and 1_2-2
PSO337.3458335.122218.8256.4047137.48360.97511.7375line 1_2-1 and 1_2-2
TLBO337.3458335.118518.8256.4047137.48340.97511.7400line 1_2-1 and 1_2-2
Table 7. Scenarios for the sub-area GCM.
YearGeneration DispatchDemand
2024GminDmin
2024GminDmax
2024GmaxDmin
2024GmaxDmax
2026GminDmin
2026GminDmax
2026GmaxDmin
2026GmaxDmax
Table 8. Nomenclature of transmission lines.
Name of the Transmission LineNomenclature
Termocol–GuajiraT_C
Guajira–Santa MartaG_S
Guajira–CuestecitasG_C
Termocol–Santa MartaT_S
Santa Marta–Rio CordobaS_R
Cuestecitas–San JuanC_J
Rio Cordoba–FundaciónR_F
San Juan–ValleduparJ_V
Fundación–CopeyF_Y
Valledupar–CopeyV_Y
Table 9. Results for the sub-area GCM in 2024 (F(1)).
ScenarioTechniqueTime (s)Without M-SSSCWith M-SSSC X ef L C
Gmin DminGANot applicable0Not applicable0Not applicable
Gmin DminPSONot applicable0Not applicable0Not applicable
Gmin DminTLBONot applicable0Not applicable0Not applicable
Gmin DmaxGA581.5436.9321.2529.47F_C
Gmin DmaxPSO501.2536.9321.2529.08F_C
Gmin DmaxTLBO946.7136.9321.2529.09F_C
Gmax DminGA505.6236.7317.138.66F_C
Gmax DminPSO435.8436.7317.138.98F_C
Gmax DminTLBO867.4736.7317.138.65F_C
Gmax DmaxGA501.1911.3311.158.27T_G
Gmax DmaxPSO521.3211.3311.158.28T_G
Gmax DmaxTLBO1289.8311.3311.158.30T_G
Table 10. Results for the sub-area GCM in 2026 (F(1)).
ScenarioTechniqueTime (s)Without M-SSSCWith M-SSSC X ef L C
Gmin DminGA1336.172102109.44Not applicable
Gmin DminPSO870.1021021020.61Not applicable
Gmin DminTLBO1664.142102105.46Not applicable
Gmin DmaxGA991.58230.38220.6317.87R_F-1 and R_F-2
Gmin DmaxPSO943.71230.38220.6324.92R_F-1 and R_F-2
Gmin DmaxTLBO2884.88230.38220.5829.78R_F-1 and R_F-2
Gmax DminGA1040.71231.13227.1520.06T_G
Gmax DminPSO1017.32231.13227.1520.15T_G
Gmax DminTLBO1651.51231.13227.1520.03T_G
Gmax DmaxGA929.81220.60211.0318.63T_S
Gmax DmaxPSO971.98220.60211.0325.00T_S
Gmax DmaxTLBO1962.72220.60211.0323.95T_S
Table 11. Results for the sub-area GCM in 2024.
ScenarioTechniqueTime (s)Without M-SSSCWith M-SSSCF(1)F(3)F(2)F(4) X ef L C
Gmin DminGA1782.39161.38158.3503.5674.670.9530G_C-1 and G_C-2
Gmin DminPSO1113.51161.38158.3503.5674.670.9530G_C-1 and G_C-2
Gmin DminTLBO1926.48161.38158.3503.5674.670.9530G_C-1 and G_C-2
Gmin DmaxGA1085.32404.73403.2037.184.64158.820.9713.86G_C-1 and G_C-2
Gmin DmaxPSO1036.11404.73403.1937.184.64158.810.9714G_C-1 and G_C-2
Gmin DmaxTLBO1969.77404.73403.1836.984.74159.060.9614.04G_C-1 and G_C-2
Gmax DminGA1101.85425.22415.4131.804.13170.800.983.09T_G
Gmax DminPSO1016.37425.22415.4131.804.13170.800.983.08T_G
Gmax DminTLBO2068.76425.22415.4131.854.13170.800.983.03T_G
Gmax DmaxGA1059.24280.31278.7511.452.57124.23130R_F-1 and R_F-2
Gmax DmaxPSO967.62280.31278.7511.452.57124.23130R_F-1 and R_F-2
Gmax DmaxTLBO1872.24280.31278.7511.452.57124.23130R_F-1 and R_F-2
Table 12. Results for the sub-area GCM in 2026.
ScenarioTechniqueTime (s)Without M-SSSCWith M-SSSCF(1)F(3)F(2)F(4) X ef L C
Gmin DminGA3218.17521.56519.782102.6246.27130G_C-1 and G_C-2
Gmin DminPSO2547.27521.56519.782102.6246.27130G_C-1 and G_C-2
Gmin DminTLBO4444.62521.56519.782102.6246.27130G_C-1 and G_C-2
Gmin DmaxGA3086.80935.45918.85225.635.08227.750.9730G_C-1 and G_C-2
Gmin DmaxPSO2545.05935.45918.85225.635.08227.750.9730G_C-1 and G_C-2
Gmin DmaxTLBO4575.74935.45918.85225.635.08227.750.9730G_C-1 and G_C-2
Gmax DminGA2987.201155.191145.35227.403.55340.750.9817.24G_S
Gmax DminPSO2145.031155.191145.33227.403.55340.730.9817.15G_S
Gmax DminTLBO4483.121155.191145.33227.403.55340.730.9817.14G_S
Gmax DmaxGA2987.20961.30947.15216.033.85252.710.9930G_S
Gmax DmaxPSO1983.90961.30947.15216.033.85252.710.9930G_S
Gmax DmaxTLBO4687.82961.30947.15216.033.85252.710.9930G_S
Disclaimer/Publisher’s Note: The statements, opinions and data contained in all publications are solely those of the individual author(s) and contributor(s) and not of MDPI and/or the editor(s). MDPI and/or the editor(s) disclaim responsibility for any injury to people or property resulting from any ideas, methods, instructions or products referred to in the content.

