Abstract
Ground source heat pump systems rely on soil conductivity for optimal performance, and soil conductivity is primarily influenced by soil moisture content. In this study, we investigate how biochar, a porous material derived from biomass gasification and pyrolysis, influences capillary water rise and moisture retention in soil. Mixtures of biochar with soil and sand in varying ratios, along with control mixtures, were prepared and tested on lab-scale equipment. The results showed that biochar-amended samples exhibited a significantly higher capillary water rise. At a height of 0.25 m above the water level, the minimum moisture content in the biochar-treated samples was 43.5%, much higher than the 6.5% recorded in the control group, which consisted of soil or soil and sand only. Even in the long term, mixtures with biochar maintained high moisture content, ranging from 36% to 57%, compared to the control’s 8%, at heights near 0.5 m over the free surface of the water. Moreover, the utilization of biochar as a soil improver in geothermal application is an innovative way for carbon sequestration which, in the analyzed conditions, leads to the storage of up to 0.7 tons of CO2eq per square meter of geothermal field.
1. Introduction
In accordance with the ideals set forth in the UN 2030 Agenda [1], with a focus on Sustainable Development Goal 7, which emphasizes the importance of “affordable and environmentally sustainable energy”, the global scientific community and policy institutions are being called upon to change the ways in which people produce and consume electricity [2]. This mission includes reducing and optimizing energy consumption, improving the efficiency of power generation systems, decarbonizing the production of energy, and improving the efficiency of electric and thermal energy user systems. All these previous elements should be combined with the exploration of innovative technologies, use of new materials, and combinations of the previous elements [1]. A central focus of this effort is to expand the contribution of renewable energy to the global energy landscape by the year 2030. At the same time, the European Union has committed to achieving carbon dioxide (CO2) neutrality by 2050 [3]. In this context, is crucial to move the research on two different fronts: (1) combining carbon storage technologies with renewable energy production and (2) integrating waste materials or byproducts into the energy production cycle, in a circular perspective.
To date, the scientific community has proposed numerous solutions (none of which is a strong silver bullet) [4], and among these, atmospheric carbon capture and bioenergy carbon capture and storage technologies (BECCS) play a prominent role [4]. One of the most promising strategies is the production of biochar through pyrolysis and gasification thermo-conversion of waste biomass. Biochar is charcoal-like material similar to activated carbons and shows a high carbon content, up to 80% [5]. Thanks to the high recalcitrance characteristic, it remains stable for decades in the soil and for this reason it is recognized by the scientific community as a long-term storage method: in fact, 100 kg of biochar correspond to at least 150 kg of CO2eq [6,7]. Moreover, the highly porous structure provides to biochar a high capacity to absorb and retain water [8]. Consequently, when incorporated into soil, biochar enhances the moisture level and sustains it for an extended duration at high level.
As anticipated, the decarbonization of energy systems has led to crediting heat pumps (HP) as a central strategy for the electrification of the heating systems in civil or industrial buildings [9]. HP also contributes to a reduction in the environmental impacts of the heating systems, compared to domestic boilers, in terms of Global Warming Potential (GWP) and emission of both domestic greenhouse gases (GHGs) or other toxic gases such as NOx [10].
The most common HPs are the Air Source Heat Pumps (ASHPs), which use ambient air as a free energy source. Although ASHP are cheap, compact and easy-to-install systems and they do not require special installation work [11], they are penalized by the high variability of ambient air temperature and achieve the best performance when the temperature of the air and the operating fluid are similar [12]. One of the ways to increase the efficiency of HPs is to use the ground as a heat source. Soil temperature remains approximately constant over the year due to higher thermal inertia, especially when greater depths are reached. Ground Source Heat Pumps (GSHPs) therefore allow more effective heat exchange with the energy source, and for this reason the overall system is more efficient [11,13]. On the other hand, GSHPs are more expensive, require excavation or drilling in the ground, and often require several cubic meters of soil for a successful heat transfer [14].
The process of heat exchange with the ground occurs through pipes usually made of high-density polyethylene (HDPE), called geothermal probes (GPs), that extract or release heat to the ground via a working fluid, i.e., water or a water-and-antifreeze mix. GPs can be installed vertically or horizontally:
- Vertical probes—borehole heat exchangers (VGPs). They require deep vertical boreholes, installation of casing pipes, use of filler materials and insertion of probes, which can be single U-pipe, double U-pipe and coaxial probes [15]. Therefore, installation is expensive, but heat exchange occurs very efficiently. VGPs require a small surface area field.
- Horizontal probes—shallow ground heat exchangers (HGPs). They require trenches, usually of high volume. High depths are not reached (1.5 to 2.5 m) but are compensated by high surface areas [16,17]. There are three types of probe distribution: linear distribution, slinky distribution and helical distribution [18]. The cost is lower than VGPs, and the heat transfer efficiency is also lower [19].
This paper considers GSHPs geothermal systems with horizontal probes, as they are the most popular systems in residential applications, mainly due to their lower installation costs. Since the HGPs are immersed in the soil at relatively shallow depths, the atmospheric conditions (humidity, temperature, precipitation, etc.) can influence the variation of soil temperature and soil moisture content. In addition, the parameters to be evaluated when aiming for the maximum ratio between plant efficiency and cost are several, and they vary depending on the configuration adopted. To date, many studies are unanimous in stating that soil thermal conductivity is a key factor affecting the system efficiency [20]. Moreover, the greatest thermal resistance lies between the HGPs and the soil, which significantly impacts the overall system performance. This means that the soil (or other material) around the probes has a great influence on the global system efficiency [21].
This research focuses on improving probe–soil heat transfer effectiveness by targeting not the technological or plant design of the system, but the material used to bury the HGPs, the so-called backfill material (BM). As also suggested by Hou (2022) [18], future high-interest developments in the GSHP area include the research for innovative BMs to replace conventional soils to make geothermal systems more efficient. The BMs can often be found among building materials (e.g., bentonite, grout or expanded clay aggregates) that, once mixed with the soil and placed around the GSHPs, significantly affect the heat transfer, depending mainly on their thermo-physical properties [22,23]. BMs usually are fractured or porous material, applied as it is or mixed in a solid matrix. The heat transfer in these materials occurs via conduction both in the matrix and water retained in the pores and slightly by convection due to water flowing through the porosities [24,25]. The parameters that most influence thermal conductivity in soil are (a) water content, (b) microporosities of soil components and (c) saturation level of the soil matrix. Bulk density and texture of the soil matrix (above all, the sand content), together with the thermal conductivity of the lattice, also play a secondary role on the thermal conductivity of the soil matrix [26].
Since an increase in soil moisture corresponds to a significant increase in the intrinsic thermal conductivity l of the soil matrix, and since BMs are materials with high water retention potential, the synergy can considerably increase the effectiveness of heat transfer in the porous medium. The novelty and the main objective of this study is to explore the potential use of biochar as a backfill material (BM) for horizontal ground source heat pumps. By incorporating biochar into soil–sand mixtures, this research aims to increase capillary water rise and improve moisture retention, leading to more efficient heat transfer in geothermal systems. Biochar, due to its water retention capacity, increases the thermal conductivity of the matrix, especially when high soil moisture levels or saturation is reached, as also demonstrated in the work of Morselli et al. (2023) [27].
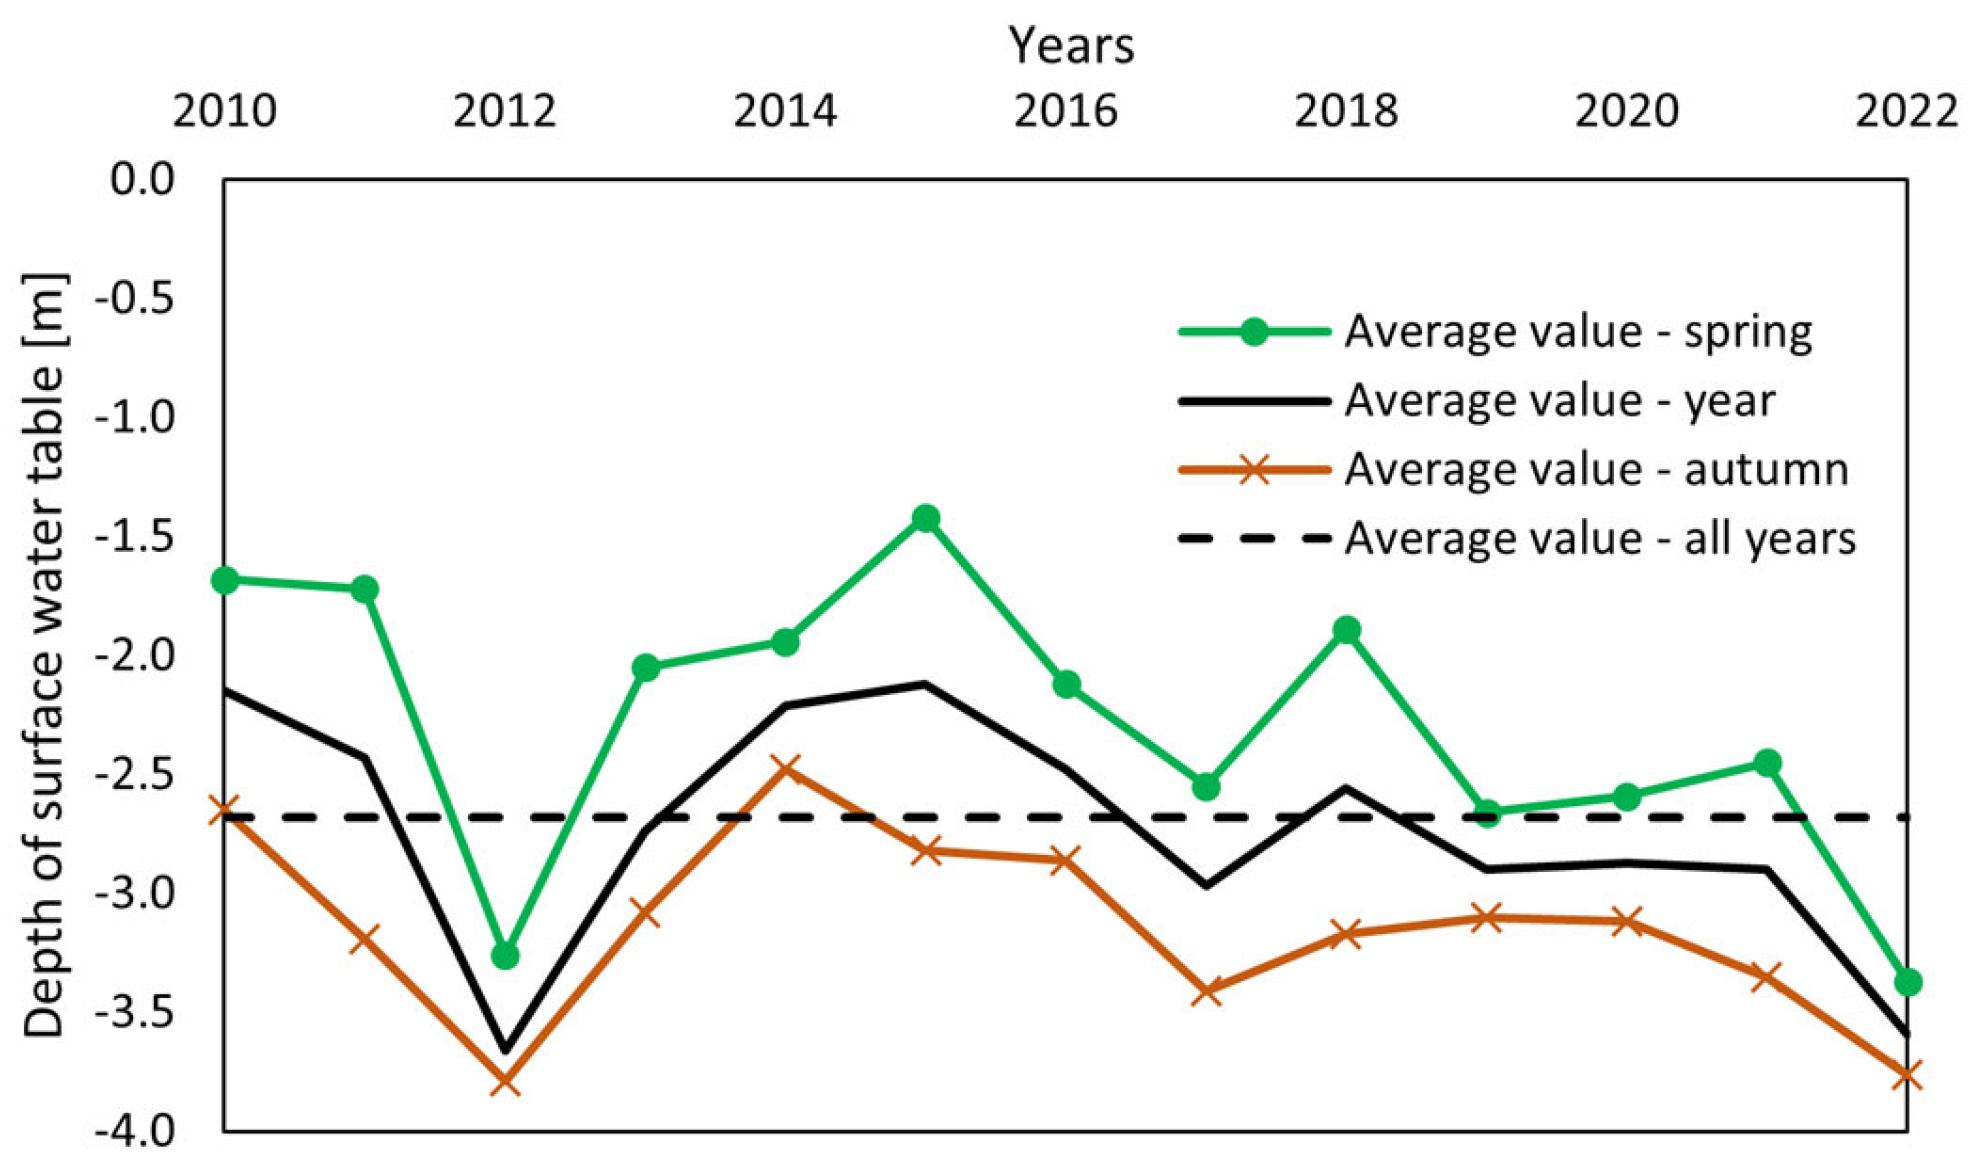
Using biochar as a BM in geothermal fields situated above a water table would potentially result, compared to the case without biochar, in higher saturation levels, increased moisture content at the same soil depth, and less time variability of water content, since the porous material improves water retention. Geothermal fields located in alluvial plains, where the water table varies seasonally from 4 m to 1.5 m below ground level, could be the main sites of this biochar application. Figure 1 [28] shows the annual trend of the surface water table depth in meters below the ground level of the Emilia Romagna region alluvial plain.
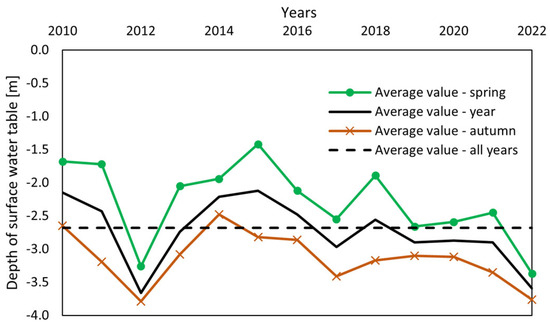
Figure 1.
Seasonality variation of the surface water table depth in meters below the ground level. Adapted from “Agency for the environment prevention and the energy” of Emilia Romagna region [28].
Given the current selling price of biochar (approximately EUR 300 ton−1) and the relatively undeveloped market, the proposed idea is to incorporate a fraction of biochar into soil or soil–sand mixtures, rather than opting for complete soil replacement. Therefore, different combinations of soil, biochar and sand are presented to identify the option that allows the best capillary rise of water.
Lastly, by mixing biochar with the excavated soil and reusing the obtained mixture using biochar as soil additive for BMs in HGPs, a long-term carbon sink is effectively achieved. The benefits of this approach are twofold: it potentially enhances the operational efficiency of GSHPs and provides a sustainable method for carbon sequestration, contributing to climate change mitigation.
This research contributes to the growing body of knowledge on innovative backfill materials and offers a potential pathway to optimize geothermal systems while also addressing climate goals, such as carbon sequestration and energy efficiency improvements.
2. Materials and Methods
2.1. Method of Measuring Capillary Rise
The utilized test methodology follows the studies conducted by Lane and Washburn [29], who proposed a simplified method for evaluating the permeability of soils to rising water. Although the method dates back almost a century, it is still used today as a reference in the development of empirical or analytical models for calculating capillarity rise [30,31].
The original method consists of repeated measurements of the height and rate of capillary rise in carefully controlled columns of air-dried soil placed into transparent tubes with a diameter of 2″ or 4″ for direct visualization of the wetted front and consequent measurement of the height of the water rising. The lower part of the tube is closed with a perforated copper plate and the soil is compacted with a mallet to obtain a compact medium reproducing the real case of undisturbed soil. The columns are then immersed vertically in a pan of tap water.
The measurements of the height of the water front are taken hourly or daily until no variation in the front is observed. The trend of the capillarity rise, measured in cm, versus time, is then drawn.
The method adopted in this work employs the use of opaque PVC tubes with an internal diameter of 10 cm (approx. 4″) and a height of 100 cm. The bottom of each tube was capped using a nylon net to allow the flow of water from the pan into the soil and its upward rise. The tubes were filled with the sample to be tested, subjected to a pressure of 2 kPa and placed vertically on a pan containing 3 cm of gravel and 4 cm of water. The net water head was set to 1 cm, and it was kept constant throughout the duration of the experiment with continuous refills. Differently from the method suggested by Lane and Washburn, to compensate for the adoption of opaque tubes, instead of visualizing the water front, the moisture content of the samples was measured using a proper sensor. The moisture measurements were carried out through a ECH2O EC-5 soil humidity probe (Meter Group, München, Germany) [32] inserted periodically into special slits made in the cylindrical wall of the tube and spaced 5 cm one from the other. This allowed the quantitative, not only qualitative, evaluation of the performance of each sample. It must be pointed out that each slit was sealed with duct tape after the humidity measurement to avoid any contact between samples and air.
Figure 2a shows a photo of the experimental apparatus, while Figure 2b shows the insertion of the humidity probe in the tube through the slit.
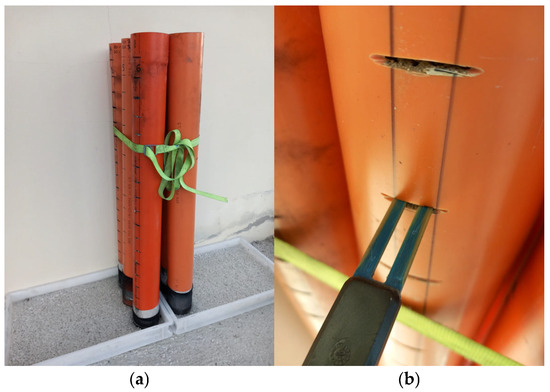
Figure 2.
Experimental setup (a) and detail of the humidity probe insertion (b).
2.2. Soil Mixture Preparation
In this work, 6 different types of matrixes are tested. Samples are realized using the three main components of soil, sand and biochar.
- Plain soil: the soil used for creating the samples of this work was analyzed by core drilling up to 108 cm deep. It is characterized by the prevalence of silt and clay from 4 to 105 cm and the appearance of medium sand from 105 to 108 cm (Figure 3a). Given the limited depth of the excavations for the installation of horizontal geothermal probes, it was decided to use the predominantly silt and clay sample. Plain soil is used as control sample and as basis for the other mixtures.
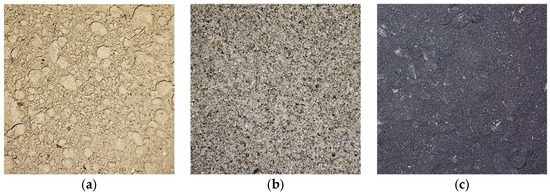 Figure 3. Components used for the formation of the mixtures. (a) Plain soil, (b) fine sand, and (c) biochar. Each picture represents a 10 × 10 cm sample.
 - Sand: since sand is present to a depth higher than 105 cm and its content is an important factor that influences thermal conductivity apart from water content, porosity and saturation level [26], it was decided to include it among the components of the tested mixtures. Fine standard sand was selected for this work (Figure 3b).
- Biochar: the biochar used in this experiment (Figure 3c) was produced by a Imbert-type reactor of a Urbas biomass gasification power plant with a nominal power of 150 kW. This is a co-current reactor, operating between 800 and 1000 °C, where the biochar is extracted from the reduction zone. This architecture guarantees a carbonized material that is, on average, higher in micro- and nanoporosity when compared to pyrolysis chars. This biochar is certified as a soil improver, according to Italian legislation [33], and can therefore be applied as an amendment to the soil. Unlike construction materials such as sand, which have a defined particle size distribution, biochar lacks a standard granulometry. Therefore, it is essential to report its particle size distribution to contextualize the tests carried out, since it affects the capillary water absorption, increasing moisture retention and, consequently, influencing soil conductivity. The particle size distribution of the Urbas gasifier biochar is detailed in Table 1, showing a notable proportion of fine particles (<0.5 mm) alongside a well-balanced range of coarser fractions [34].
 Table 1. Biochar characteristics declared by the producer [35].
The proportions between the various components were measured volume-to-volume to guarantee simpler measurement, both during the tests and in any future field applications. The soil was mixed both with biochar (in different proportions) and sand to create a map of different mixtures to be tested with the open-tube method.
The compositions of the samples are presented in Table 2, with ratios expressed as volume-to-volume percentages (% v/v).
Table 2.
Description of the composition of the different samples.
All the mixtures were previously air-dried, and the starting moisture contents, reported as mass-to-mass ratios on a dry basis, are reported in Figure 4. The results show moisture content ranging from 4.7% for the 100M sample to 10.5% for the 50T-50C and 65M-35C.
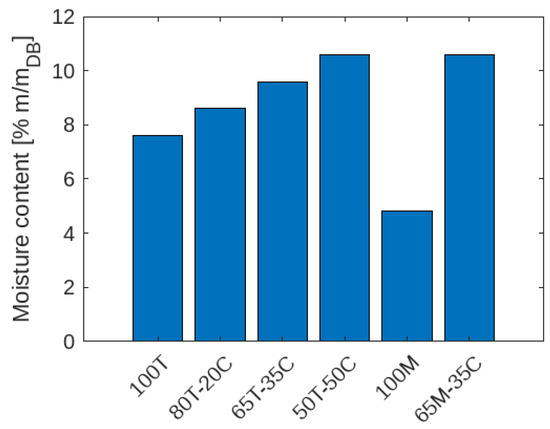
Figure 4.
Moisture content of the different samples at the beginning of the experiment.
2.3. Carbon Storage Calculation
When buried in soil, biochar has good stability, up to hundreds of times the starting feedstock. This happens as a portion of organic carbon remains stable in the soil for centuries. VERRA proposes a strict methodology for quantifying both the emission reductions and the storage of carbon, examining (a) the biomass handling before biochar production, (b) the process used for the biochar production, and (c) the final application of biochar (in soil or another application) [36]. Using the VERRA method, a simple computation of carbon stored in a typical shallow geothermal field, with biochar as BM, was carried out. The computation followed some assumptions: short distances for biomass and biochar transport, production of biochar through gasification, the use of renewable energy sources for auxiliary operations of the gasifier, and no greenhouse gas emission during the production process.
Under these conditions, the calculation of the tons of CO2eq stored in the biochar () is simplified as follows:
where is the fixed carbon content in the biochar and is the conversion factor to transform fixed carbon (measured as carbon mass) into CO2eq.
The calculation of is determined using the following equation:
where:
- is the mass of biochar applied to the geothermal field
- is the organic carbon content in biochar per ton, determined via laboratory analysis and reported in Table 1.
- is the permanence factor accounting for biochar decay over time. In this case, , since biochar from a high-temperature process (gasification > 600 °C) was considered. For example, biochar produced through lower-temperature processes can exhibit a reduced permanence factor, with values dropping as low as 0.65.
3. Results
3.1. Capillary Rise
The capillary rise tests took place over 11 days, and the moisture content measurements of the different substrates were recorded every 12 h with a spatial resolution of 5 cm along the cylindrical test column.
The environmental conditions during the test were the same for each tube, with an average temperature and relative humidity of 19.2 °C and 62% RH.
Figure 5 reports the results obtained in the test. The x-axis shows the hours from the start of the test, and the y-axis shows the height of the measurement column. The color bar indicates the substrate humidity level recorded over time at intervals of 5 cm, while the black lines identify the maximum humidity gradient between one height and the next, aiming at reproducing the position over time of the wet front that would be observed following the Lane and Washburn methodology using transparent tubes. The images show how plain soil (100T) and soil mixed with sand (100M) lead to an equal maximum (over a 11-day period) capillary rise ( cm) and water content (see Figure 6a,b).
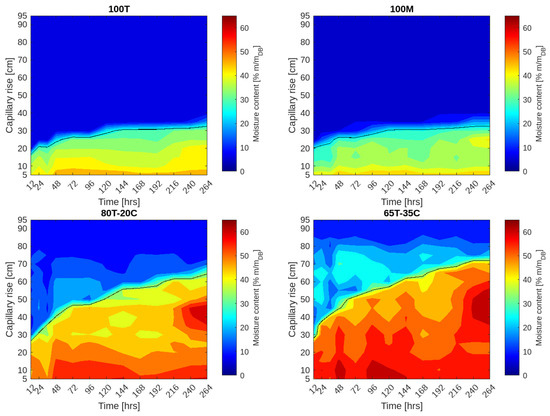
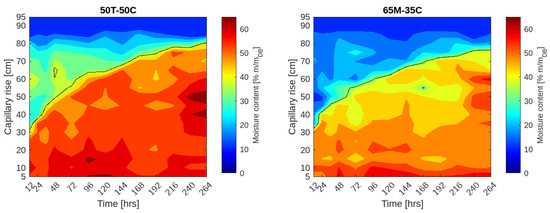
Figure 5.
Capillary rise over time for each tested sample and visualization of the moisture content of the columns.
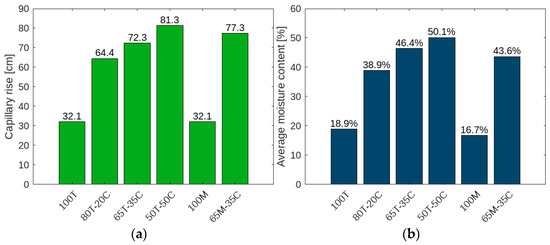
Figure 6.
Comparison between the maximum capillary rise (height of the wetted front) (a) and the average column moisture (b) at the end of the sampling period of 11 days.
In the work of Lane and Washburn, very similar results are reported for class II soils, with a capillary rise of 17.0 cm after 12 h and 28.4 cm after 3 days of testing [29].
It is observed that the addition of biochar significantly increases both the capillary rise and the water content of the mixture, and this behavior intensifies by increasing the volume percentage of the biochar used. By adding 20% v/v of biochar (80T-20C sample), a doubling of the average column humidity and the maximum capillary rise is observed. These values rise to over 2.5 times if 50% v/v biochar (50T-50C sample) is added. In particular, the 50T-50C sample does not show a significantly greater rise in the level of the wet front than the 65T-35C sample; only, the moisture level seems to be more homogeneous along the column at each instant of measurement. This is an important finding, as it allows us to identify the optimal amount of biochar to be mixed and the balance between improves and economic costs.
Figure 6a shows the maximum levels reached by the water, above the free water surface in the pan, during the test period. The best result was achieved by sample 50T-50C: 81.3 cm and a 154% improvement over the control. Similar results were obtained by the 65M-35C sample (sand–soil–biochar mixture) which reached 77.3 cm, a 141% increase over both the control, 100T and 100M control, which reached the same level, even if 100M shows a lower final average moisture content that is probably due to the lower initial humidity of the 100M sample. The sand-less analogue sample 65T-35C reached a level of 72.3 cm, equivalent to a 125% increase. Finally, with a 100% increment, the sample 80T-20C was the least performing among the biochar mixed samples.
These results show that the performance increases as the percentage of biochar increases, with excellent results in terms of capillary rise achieved with biochar content as low as 20%. Slight improvements in soil moisture have been shown by going from 35% to 50% biochar use in the mix. This suggests that percentages of biochar close to 50% could be the maximum conveniently applicable for this type of use.
Instead, to increase the performance of the 35% biochar mix, a fraction of sand (19.5% over the total) can be added to allow for slightly greater water uptake. The 65M-35C sample exhibits a good water retention of 43.6%, but it is lower compared to the sand-less sample (65T-35C), as observed in Figure 6b, likely due to the absence of micropores that are instead present in biochar. The best in terms of average moisture at the end of the period is the 50T-50C sample, followed by 65T-35C, respectively, at 50.1% and 46.4%. Finally, the 80T-20C sample has a moisture content of 38%, an effect of the low amount of biochar used.
In summary, Figure 7 shows the comparison between the different capillary rise trends in the substrates, indicating the wet-front line.

Figure 7.
Trend comparison of the waterfronts over the sampling period of 11 days.
3.2. Carbon Storage Capability
Following the methodology proposed by VERRA, carbon storage is quantified in 2.363 kg of CO2eq for each kg of biochar applied to the soil [36]. The carbon storage potentials for each scenario are reported in terms of equivalent carbon dioxide (CO2eq) in Table 3.
Table 3.
Carbon storage potential of the different mixtures, per cubic meter.
As the amount of applied biochar increases, the amount of carbon potentially stored also increases. Furthermore, carbon credits can be sold in the carbon trading market: one carbon credit corresponds to 1 ton of CO2eq stored for a value of EUR 80 [37]. This means that carbon credits can be an economic profit for the owner of the geothermal plant. To date, in an underdeveloped market framework, the cost of biochar is EUR 300 ton−1, while EUR 190 is gained from the sale of the corresponding carbon credits. It is pointed out that for an excavation of a geothermal field of 100 m2 and 3 m deep, in the case of the 50T-50C mixture, 32.7 tons of dry biochar are needed, for a cost of EUR 9800. Considering the conversion into carbon credits, a carbon storage of 77.2 tons of CO2eq is realized and corresponds to an income of EUR 6170, equal to 63% of the initial investment. This payback mechanism is not available for any other BMs.
To give context to this application, let us consider a house with a surface area of 100 m2 in central Europe, with a 111 kWh m−2 average space heating consumption per year [38] equipped with a 4 kW heat pump that operates for 3000 h per year. Coupling the heating system with a geothermal field and estimating 25 m2 kW−1 for its surface area extension [39], a geothermal field of 100 m2 is considered for this analysis. European statistics estimate the average carbon footprint of households in Europe at 7 kg CO2eq m−2 y−1 [40]. Therefore, the impact for the space heating of the case considered is equal to 0.7 ton CO2eq y−1. According to the carbon storage results calculated before, if 50% of biochar is used as BM mixed with soil, a household with the explained characteristics has a carbon-neutral heating operation until approximately the 100th year from construction. In fact, the carbon stored in the biochar balances the carbon dioxide emitted during the operation of the heating system.
4. Conclusions
In conclusion, our study demonstrates that the utilization of biochar as backfill material for HGPs significantly enhances water uptake, with a notable 150% improvement observed when biochar constitutes 50% v/v of the solid matrix surrounding geothermal probes. Notably, the second most promising application mode involves a biochar mixture at 35% v/v, sand at 19.5% v/v and soil at 45.5% v/v. Biochar has proved to be an effective method of maintaining high moisture levels in the soil in contrast to sand, increasing water retention due to its microporosity, a key feature of biochar that makes it an excellent fluid retainer.
These findings provide valuable insights for determining the optimal biochar application rate, while also highlighting a high carbon storage potential per unit area in geothermal applications compared to the maximum biochar quantities applied in cultivated fields. Looking ahead, future investigations could focus on measuring thermal conductivity and specific heat capacity through experimental campaigns with variable shares of biochar as BM, providing further insights into how biochar influences heat transfer effectiveness in geothermal systems. Additionally, further studies could explore the long-term impact of biochar in maintaining soil moisture and its potential to improve the overall performance of geothermal systems under various environmental conditions.
Author Contributions
Conceptualization, N.M. and F.O.; methodology, N.M. and F.O.; investigation, N.M., F.O. and M.P.; data curation, N.M. and F.O.; writing—original draft preparation, N.M. and F.O.; writing—review and editing, N.M., F.O. and M.P.; visualization, S.P., G.A. and P.T.; supervision, N.M., S.P., G.A. and P.T.; All authors have read and agreed to the published version of the manuscript.
Funding
This research was funded by: Avviso pubblico per la presentazione di Proposte di intervento per la creazione e il rafforzamento di “ecosistemi dell’innovazione”, costruzione di “leader territoriali di R&S”—Ecosistemi dell’Innovazione—nell’ambito del Piano Nazionale di Ripresa e Resilienza, Missione 4 Istruzione e ricerca—Componente 2 Dalla ricerca all’impresa—Investimento 1.5, finanziato dall’Unione europea—NextGenerationEU-DD. 3277/2021. Ecosystem For Sustainable Transition of Emilia-Romagna (ECOSISTER): CUP: E93C22001100001.
Data Availability Statement
The original contributions presented in this study are included in the article. Further inquiries can be directed to the corresponding author.
Acknowledgments
The authors are thankful to Mr. Alex Duzzi for his support in the preparation of the test rig.
Conflicts of Interest
The authors declare no conflicts of interest.
References
- A/RES/70/1 Transforming Our World: The 2030 Agenda for Sustainable Development. 2015. Available online: https://sdgs.un.org/2030agenda (accessed on 18 January 2025).
- Sustainable Development Goals (SDG 7). Available online: https://unric.org/en/sdg-7/ (accessed on 25 October 2023).
- Net Zero by 2050—A Roadmap for the Global Energy Sector. Available online: https://www.iea.org/reports/net-zero-by-2050 (accessed on 18 January 2025).
- Shukla, P.R.; Skea, J.; Slade, R. Working Group III Contribution to the Sixth Assessment Report of the Intergovernmental Panel on Climate Change. Available online: https://www.ipcc.ch/report/sixth-assessment-report-working-group-3/ (accessed on 18 January 2025).
- Mulabagal, V.; Baah, D.A.; Egiebor, N.O.; Sajjadi, B.; Chen, W.-Y.; Viticoski, R.L.; Hayworth, J.S. Biochar from Biomass: A Strategy for Carbon Dioxide Sequestration, Soil Amendment, Power Generation, CO2 Utilization, and Removal of Perfluoroalkyl and Polyfluoroalkyl Substances (PFAS) in the Environment. In Handbook of Climate Change Mitigation and Adaptation; Lackner, M., Sajjadi, B., Chen, W.-Y., Eds.; Springer International Publishing: Cham, Switzerland, 2022; pp. 1023–1085. ISBN 978-3-030-72578-5. [Google Scholar]
- Smith, P. Soil Carbon Sequestration and Biochar as Negative Emission Technologies. Glob. Change Biol. 2016, 22, 1315–1324. [Google Scholar] [CrossRef] [PubMed]
- Woolf, D.; Amonette, J.E.; Street-Perrott, F.A.; Lehmann, J.; Joseph, S. Sustainable Biochar to Mitigate Global Climate Change. Nat. Commun. 2010, 1, 56. [Google Scholar] [CrossRef] [PubMed]
- Adhikari, S.; Mahmud, M.A.P.; Nguyen, M.D.; Timms, W. Evaluating Fundamental Biochar Properties in Relation to Water Holding Capacity. Chemosphere 2023, 328, 138620. [Google Scholar] [CrossRef] [PubMed]
- Abd Alla, S.; Bianco, V.; Scarpa, F.; Tagliafico, L.A. Electrification of the Residential Heat Demand: An Analysis of the Power Market Potential to Accommodate Heat Pumps. Therm. Sci. Eng. Prog. 2022, 27, 101173. [Google Scholar] [CrossRef]
- Naumann, G.; Schropp, E.; Gaderer, M. Life Cycle Assessment of an Air-Source Heat Pump and a Condensing Gas Boiler Using an Attributional and a Consequential Approach. Procedia CIRP 2022, 105, 351–356. [Google Scholar] [CrossRef]
- Song, M.; Deng, S.; Dang, C.; Mao, N.; Wang, Z. Review on Improvement for Air Source Heat Pump Units during Frosting and Defrosting. Appl. Energy 2018, 211, 1150–1170. [Google Scholar] [CrossRef]
- Kim, B.-J.; Jo, S.-Y.; Jeong, J.-W. Energy Performance Enhancement in Air-Source Heat Pump with a Direct Evaporative Cooler-Applied Condenser. Case Stud. Therm. Eng. 2022, 35, 102137. [Google Scholar] [CrossRef]
- Le, A.T.; Wang, L.; Wang, Y.; Li, D. Measurement Investigation on the Feasibility of Shallow Geothermal Energy for Heating and Cooling Applied in Agricultural Greenhouses of Shouguang City: Ground Temperature Profiles and Geothermal Potential. Inf. Process. Agric. 2021, 8, 251–269. [Google Scholar] [CrossRef]
- Cheng, X. Integrated Energy System in a Green Energy Lab. In Handbook of Energy Systems in Green Buildings; Wang, R., Zhai, X., Eds.; Springer: Berlin/Heidelberg, Germany, 2017; pp. 1–40. ISBN 978-3-662-49088-4. [Google Scholar]
- Raymond, J.; Mercier, S.; Nguyen, L. Designing Coaxial Ground Heat Exchangers with a Thermally Enhanced Outer Pipe. Geotherm. Energy 2015, 3, 7. [Google Scholar] [CrossRef]
- Cui, Y.; Zhu, J.; Twaha, S.; Chu, J.; Bai, H.; Huang, K.; Chen, X.; Zoras, S.; Soleimani, Z. Techno-Economic Assessment of the Horizontal Geothermal Heat Pump Systems: A Comprehensive Review. Energy Convers. Manag. 2019, 191, 208–236. [Google Scholar] [CrossRef]
- Go, G.-H.; Lee, S.-R.; Yoon, S.; Kim, M.-J. Optimum Design of Horizontal Ground-Coupled Heat Pump Systems Using Spiral-Coil-Loop Heat Exchangers. Appl. Energy 2016, 162, 330–345. [Google Scholar] [CrossRef]
- Hou, G.; Taherian, H.; Song, Y.; Jiang, W.; Chen, D. A Systematic Review on Optimal Analysis of Horizontal Heat Exchangers in Ground Source Heat Pump Systems. Renew. Sustain. Energy Rev. 2022, 154, 111830. [Google Scholar] [CrossRef]
- Florides, G.; Theofanous, E.; Iosif-Stylianou, I.; Tassou, S.; Christodoulides, P.; Zomeni, Z.; Tsiolakis, E.; Kalogirou, S.; Messaritis, V.; Pouloupatis, P.; et al. Modeling and Assessment of the Efficiency of Horizontal and Vertical Ground Heat Exchangers. Energy 2013, 58, 655–663. [Google Scholar] [CrossRef]
- Rashid, F.L.; Dhaidan, N.S.; Hussein, A.K.; Al-Mousawi, F.N.; Younis, O. Ground Heat Exchanger in Different Configuration: Review of Recent Advances and Development. Geoenergy Sci. Eng. 2023, 227, 211872. [Google Scholar] [CrossRef]
- Bortoloni, M.; Bottarelli, M.; Su, Y. A Study on the Effect of Ground Surface Boundary Conditions in Modelling Shallow Ground Heat Exchangers. Appl. Therm. Eng. 2017, 111, 1371–1377. [Google Scholar] [CrossRef]
- Maghrabie, H.M.; Abdeltwab, M.M.; Tawfik, M.H.M. Ground-Source Heat Pumps (GSHPs): Materials, Models, Applications, and Sustainability. Energy Build. 2023, 299, 113560. [Google Scholar] [CrossRef]
- Wan, R.; Kong, D.; Kang, J.; Yin, T.; Ning, J.; Ma, J. The Experimental Study on Thermal Conductivity of Backfill Material of Ground Source Heat Pump Based on Iron Tailings. Energy Build. 2018, 174, 1–12. [Google Scholar] [CrossRef]
- Bernier, M.A.; Chahla, A.; Pinel, P. Long-Term Ground-Temperature Changes in Geo-Exchange Systems. ASHRAE Trans. 2008, 114, 342–351. [Google Scholar]
- Zimmerman, R.W. Thermal Conductivity of Fluid-Saturated Rocks. J. Pet. Sci. Eng. 1989, 3, 219–227. [Google Scholar] [CrossRef]
- Liu, W.; Li, R.; Wu, T.; Shi, X.; Zhao, L.; Wu, X.; Hu, G.; Yao, J.; Xiao, Y.; Ma, J.; et al. Simulation of Soil Thermal Conductivity Based on Different Schemes: An Empirical Comparison of 13 Models. Int. J. Therm. Sci. 2023, 190, 108301. [Google Scholar] [CrossRef]
- Morselli, N.; Puglia, M.; Ottani, F.; Pedrazzi, S.; Allesina, G.; Muscio, A.; Tartarini, P. Experimental Investigation of Moisture Influence on Biochar and Biochar-Soil Blends Thermophysical Properties. J. Phys. Conf. Ser. 2024, 2685, 012031. [Google Scholar] [CrossRef]
- ARPAE Livello Delle Acque Sotterranee. Available online: https://webbook.arpae.it/indicatore/Livello-delle-acque-sotterranee-00001/?id=19a0fc0d-7558-11e4-8845-11c9866a0f33 (accessed on 17 November 2023).
- Lane, K.S.; Washburn, D.E.; Krynine, D.P. Capillarity tests by capillarimeter and by soil filled tubes. In Proceedings of the Highway Research Board Proceedings, Washington, DC, USA, 5–8 December 1946; National Academy of Science: Washington, DC, USA, 1947; Volume 26. [Google Scholar]
- Lu, N.; Likos, W.J. Rate of Capillary Rise in Soil. J. Geotech. Geoenvironmental Eng. 2004, 130, 646–650. [Google Scholar] [CrossRef]
- Liu, Q.; Yasufuku, N.; Miao, J.; Ren, J. An Approach for Quick Estimation of Maximum Height of Capillary Rise. Soils Found. 2014, 54, 1241–1245. [Google Scholar] [CrossRef]
- ECH20 EC-5. Available online: https://www.metergroup.com/en/meter-environment/products/ech20-ec-5-soil-moisture-sensor (accessed on 17 November 2023).
- MIIPAF. Decreto Legislativo 29 Aprile 2010, n.75—Riordino e Revisione Della Disciplina in Materia Di Fertilizzanti, a Norma Dell’articolo 13 Della Legge 7 Luglio 2009, n. 88; Gazzetta Ufficiale Della Repubblica Italiana: Rome, Italy, 2010; p. 126. [Google Scholar]
- Homepage—URBAS Energietechnik und Stahlbau. Available online: https://www.urbas.at/ (accessed on 18 January 2025).
- Ottani, F.; Parenti, M.; Pedrazzi, S.; Moscatelli, G.; Allesina, G. Impacts of Gasification Biochar and Its Particle Size on the Thermal Behavior of Organic Waste Co-Composting Process. Sci. Total Environ. 2022, 817, 153022. [Google Scholar] [CrossRef] [PubMed]
- Verra. VM0044 Methodology for Biochar Utilization in Soil and Non-Soil Applications, v1.1; Verra: Washington, DC, USA, 2021. [Google Scholar]
- EU Carbon Permits—Price—Chart—Historical Data—News. Available online: https://tradingeconomics.com/commodity/carbon (accessed on 20 November 2023).
- Household Energy Consumption for Space Heating per M2—European Environment Agency. Available online: https://www.eea.europa.eu/data-and-maps/daviz/unit-consumption-of-space-heating#tab-chart_1 (accessed on 21 November 2023).
- Musurmonov, M. Experimental Analysis of Geothermal Heat Pump. Ph.D. Thesis, Politecnico di Torino, Turin, Italy, 2021. [Google Scholar]
- Gervasio, H.; Dimova, S. Environmental Benchmarks for Buildings. EFIResources: Resource Efficient Construction towards Sustainable Design; Publications Office: Luxembourg, 2018. [Google Scholar]


Disclaimer/Publisher’s Note: The statements, opinions and data contained in all publications are solely those of the individual author(s) and contributor(s) and not of MDPI and/or the editor(s). MDPI and/or the editor(s) disclaim responsibility for any injury to people or property resulting from any ideas, methods, instructions or products referred to in the content. |
© 2025 by the authors. Licensee MDPI, Basel, Switzerland. This article is an open access article distributed under the terms and conditions of the Creative Commons Attribution (CC BY) license (https://creativecommons.org/licenses/by/4.0/).