Article

Synthesis of Cellulose-Based Fluorescent Carbon Dots for the Detection of Fe(III) in Aqueous Solutions

by
Lindokuhle P. Magagula
1,
Clinton M. Masemola
1,
Tshwafo E. Motaung
2,
Nosipho Moloto
1 and
Ella C. Linganiso-Dziike
1,2,*
1
Molecular Sciences Institute, School of Chemistry, University of the Witwatersrand, Private Bag 3, Johannesburg 2050, South Africa
2
Department of Chemistry, Sefako Makgatho Health Science University, P.O. Box 94, Medunsa, Ga-Rankuwa, Pretoria 0204, South Africa
*
Author to whom correspondence should be addressed.
Processes 2025, 13(1), 257; https://doi.org/10.3390/pr13010257
Submission received: 2 December 2024 / Revised: 8 January 2025 / Accepted: 13 January 2025 / Published: 17 January 2025
(This article belongs to the Special Issue New Trends and Processes in Nanofluids and Carbon-Based Nanoparticles)

Abstract

:
The need for eco-friendly, cost-effective, and scalable methods to synthesize carbon quantum dots (CQDs) remains a critical goal in nanotechnology. In this work, nitrogen-doped carbon quantum dots (N-CQDs) were successfully synthesized using cellulose nanocrystals (CNCs) derived from microcrystalline cellulose (MCC) and urea through a rapid one-step microwave-assisted method. The use of renewable cellulose as a precursor aligns with sustainable practices, offering a pathway to transform agricultural waste into valuable nanomaterials. Characterized by TEM, XRD, Raman, XPS, and PL spectroscopy, the N-CQDs demonstrated outstanding optical properties, including strong excitation-dependent fluorescence with an emission maximum at 420 nm. The N-CQDs exhibited exceptional selectivity and sensitivity toward Fe3+, achieving a detection limit of 75 nM. Additionally, the pH-dependent fluorescence and stability in diverse conditions highlight the N-CQDs’ versatility in environmental monitoring. This study establishes a foundation for using agricultural waste to produce high-performance nanostructures for sensing applications, advancing green nanotechnology and environmental solutions.

1. Introduction

With the increase in industrial and wastewater effluents, water pollution has become a serious threat to human and aquatic life [1]. One of the major concerns is the presence of heavy metal ions from industrial waste such as Fe3+, Hg2+, Pb2+, Cu2+, Cr6+, Zn2+, Co2+, etc. [2,3,4,5,6,7]. Ferric ion (Fe3+) is the most abundant and essential metal ion in living organisms; it plays crucial roles such as cellular metabolism, oxygen transport, enzyme catalysis, deoxyribonucleic acid (DNA), and ribonucleic acid (RNA) synthesis [8,9,10,11]. Although Fe3+ plays vital roles in the biological system, excess Fe3+ can cause liver damage, kidney failure, cell oxidation, and the annihilation of blood circulation in human body [12,13]. Moreover, high concentrations of Fe3+ in water bodies play a role in the primary production of phytoplankton, besides nitrate, phosphate, and silicate which negatively affect the environment and aquatic life [13]. Hence, it is a necessity to develop effective analytical methods for the detection of Fe3+ ions and other metal ions.
So far, several approaches for the determination of Fe3+ in aqueous solutions have been developed, including plasma optical emission spectroscopy, atomic absorption spectrometry, inductively coupled plasma mass spectrometry, etc. [9,14,15]. However, these methods are complicated, expensive, and require several steps for sample preparation [16]. To overcome these shortcomings, fluorescence quenching has been used for the detection of Fe3+ owing to the high sensitivity, great simplicity, easy monitoring, and rapid response [10]. The most widely used fluorescence sensors include organic dyes, semiconductor quantum dots (QDs), fluorescent metal–organic frameworks, and fluorescence metal nanoclusters [1,16,17,18,19]. However, there are concerns rising from their photo instability, toxicity, low sensitivity, and environmental unfriendliness, which restrict their real applications [20,21]. Thus, highly efficient, sensitive, photo-stable, and eco-friendly nanostructures are desirable.
Since their discovery in 2004 by Xu et al. during the purification of single-walled carbon nanotube (SWCNT) through preparative electrophoresis, and then via the laser ablation of graphite powder and cement in 2006 by Sun et al., CQDs have gradually become a rising star in the carbon nanomaterials family [22], owing to their unique tunable photoluminescence, size-dependent optical properties, good biocompatibility, facile synthesis, and low toxicity as compared to their counterparts, the semiconductor quantum dots (QDs) [23,24]. Recently, CQDs have been widely used as fluorescence sensors in the detection of Fe3+ due to their fluorescence quenching effect, which may originate from the formation of CQD–Fe3+ complexes through the interaction of Fe3+ with surface functional groups of the CQDs such as phenolic hydroxyl, carboxyl, and amino groups [14]. Different synthesis methods have been developed for the preparation of CQDs such as microwave-assisted synthesis, hydrothermal methods, solid-phase methods, ultrasonic treatment, electrochemical methods, and so on [10,25]. Among these methods, microwave-assisted synthesis is highly desirable because of the simplicity and short synthesis time, which result in homogeneous and fast heating that is beneficial in the synthesis of CQDs [26,27]. Recently, there has been increasing interest in using agricultural waste, such as fruit peels, husks, stalks, and leaves, as precursors for CQDs synthesis. This approach not only provides a sustainable source of carbon for the production of CQDs but also addresses the environmental challenge of waste disposal. By utilizing these abundant agricultural by-products, the synthesis of CQDs becomes more eco-friendly and cost-effective, contributing to the development of greener nanomaterials for various applications, such as Fe3+ detection through fluorescence quenching [28].
In this paper, we report a simple, one-step microwave synthesis to prepare nitrogen-doped carbon quantum dots (N-CQDs) from microcrystalline cellulose-derived cellulose nanocrystals and urea. The as-prepared N-CQDs exhibit an excitation-dependent emission behavior with an optimum fluorescence excitation at 340 nm and an emission maximum of 420 nm. These N-CQDs were explored for the detection of Fe3+ in solution.

2. Materials and Methods

2.1. Materials and Reagents

Microcrystalline cellulose (MCC), sulfuric acid (H2SO4, 98%), and urea (CH4N2O) were obtained from Sigma-Aldrich (Johannesburg, South Africa). Metal salts, namely KCl, Ni(NO3)2·6H2O, CdCl2·H2O, Cu(NO3)2, Mg(NO3)2·6H2O, Zn(NO3)2·6H2O, Al(NO3)3·9H2O, Ca(NO3)2, Fe(NO3)2, Co(NO3)2·6H2O, and NaNO2, were all purchased from Sigma-Aldrich (Johannesburg, South Africa). All the chemicals and reagents were of analytical grade and were used as received without further purification. Deionized water was used for the preparation of aqueous solutions.

2.2. Preparation of Cellulose Nanocrystal (CNCs) from Microcrystalline Cellulose

Microcrystalline cellulose (MCC) was used to prepare cellulose nanocrystals by acid hydrolysis according to previously documented methods [29], with some minor modifications. Briefly, 5 g of MCC was hydrolyzed with 50% of H2SO4 (v/v) solution at 45 °C for 30 min under continuous stirring. This reaction was then quenched by the addition of 10-fold cold distilled water to the reaction mixture, followed by centrifugation at 5000 rpm for 20 min. The suspension was dialyzed against distilled water for several days until a constant pH in the range of 6–7 was obtained, resulting in a colloidal suspension that was sonicated in an ice bath for 1 h to homogenize the generated cellulose nanocrystals before storage in a refrigerator for further use.

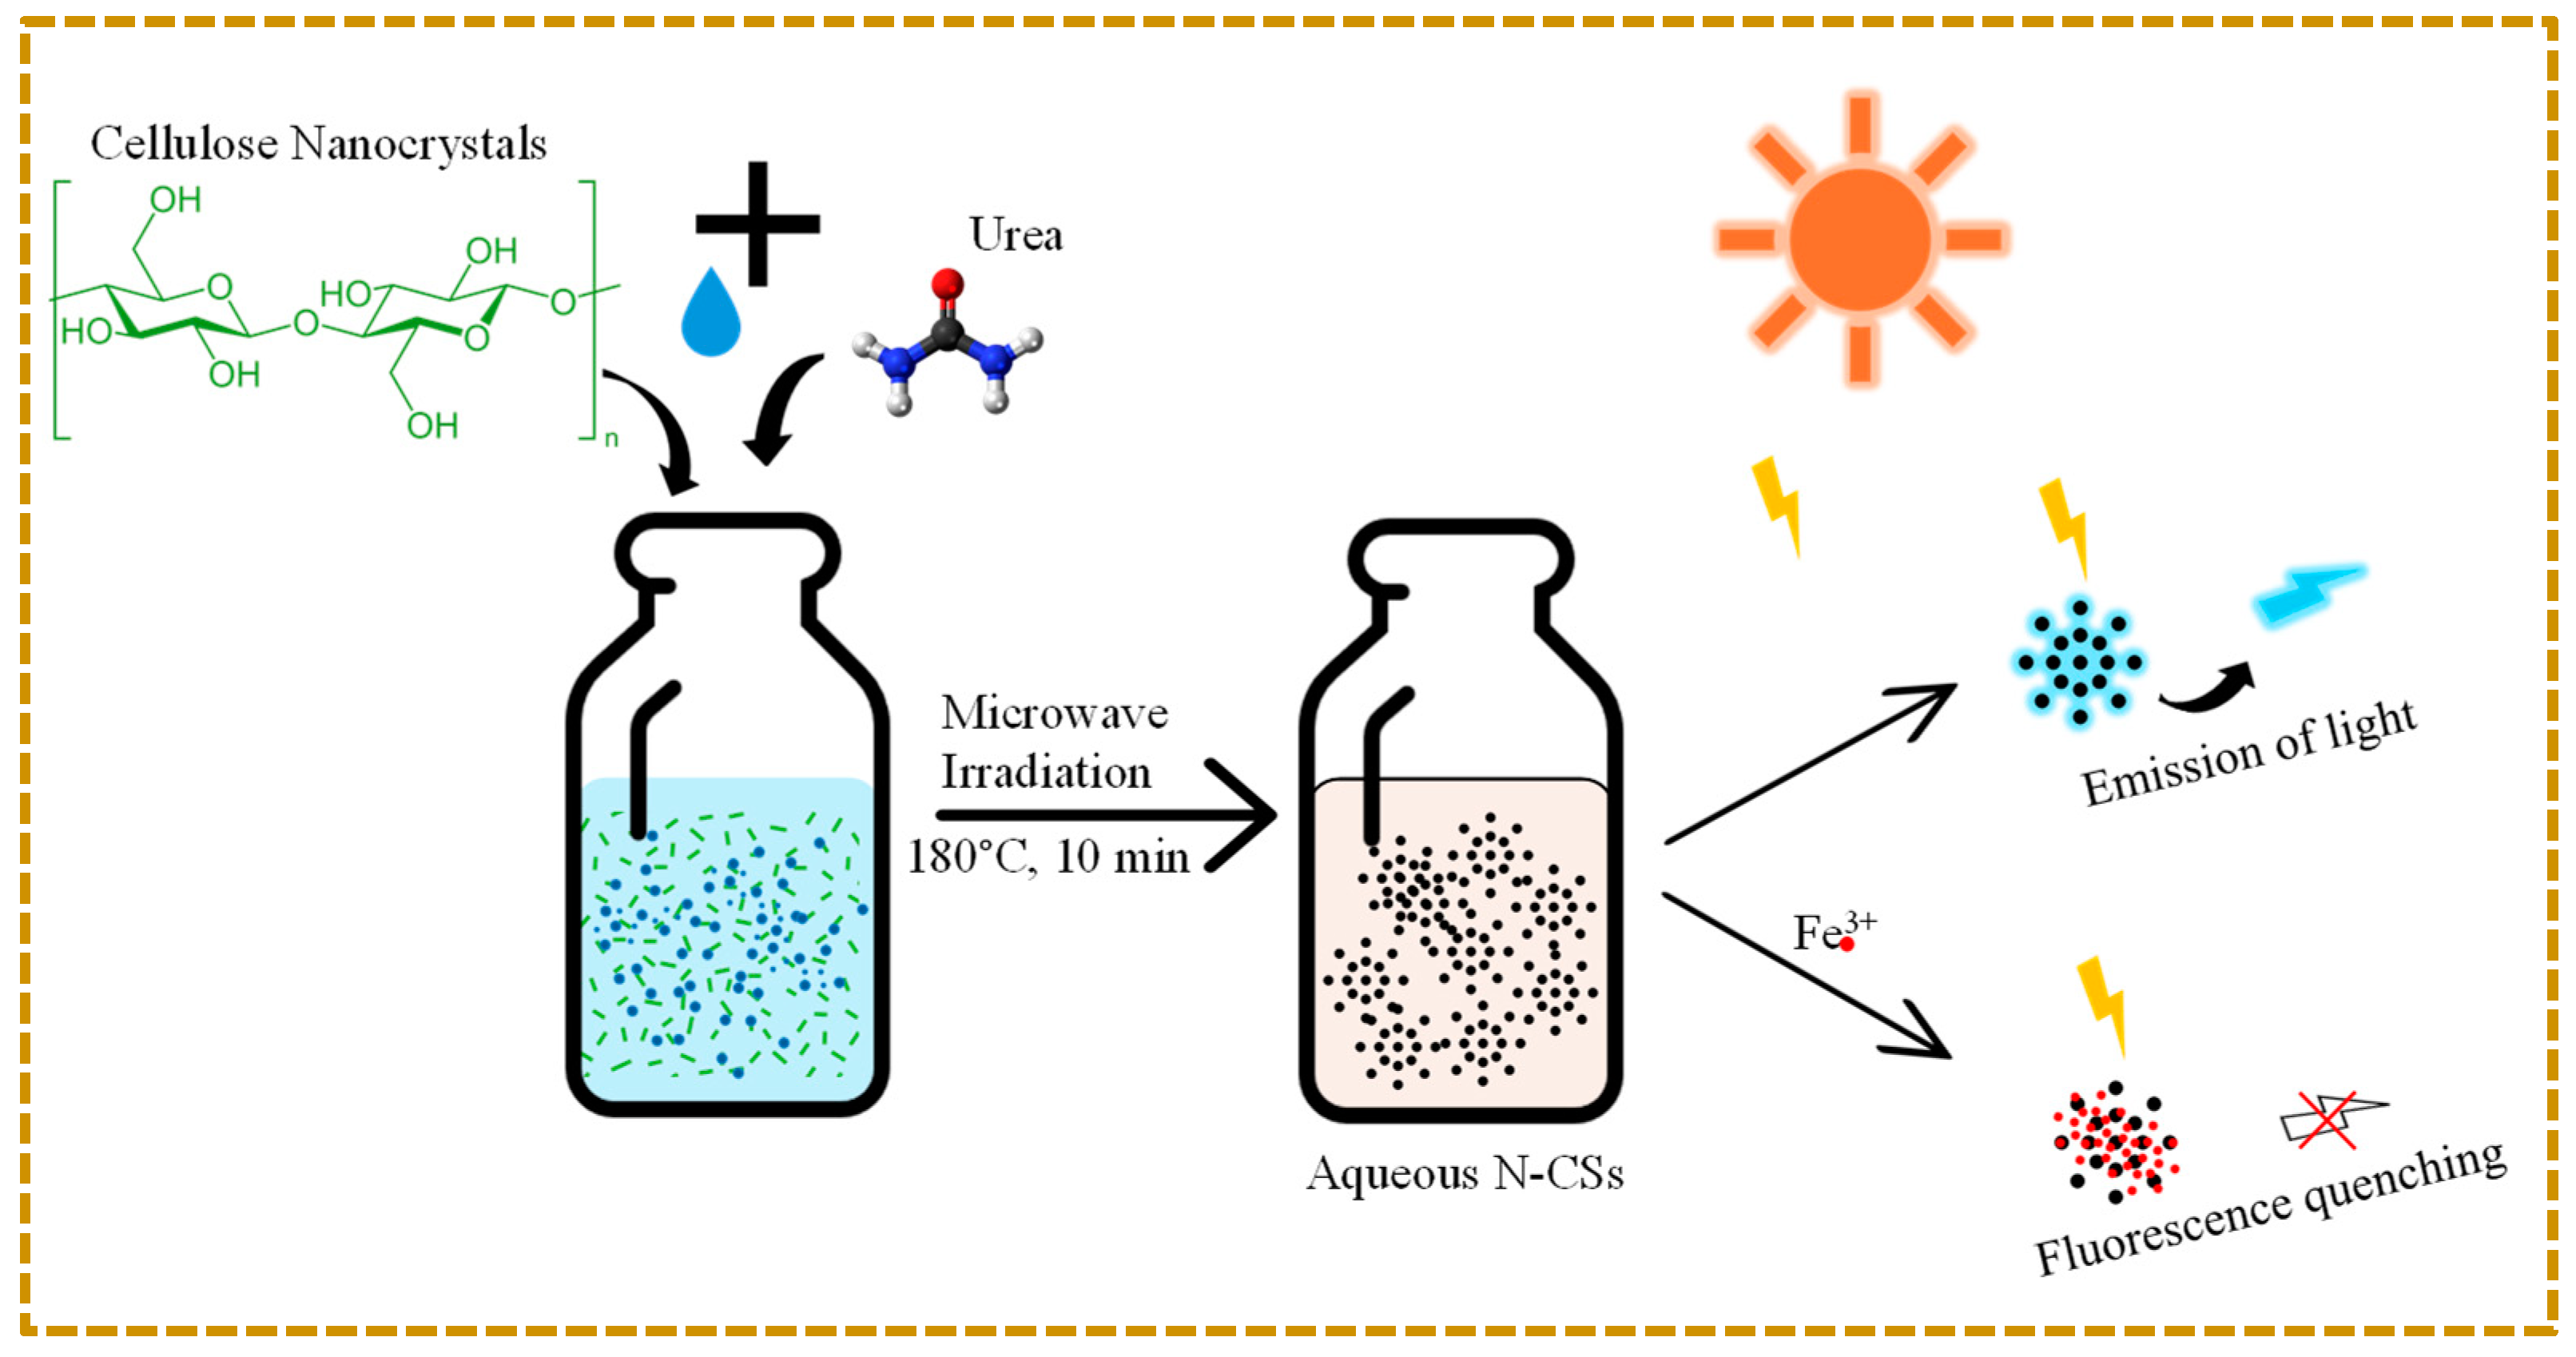
2.3. Synthesis of Nitrogen-Doped Carbon Quantum Dots (N-CQDs) from Cellulose Nanocrystals (CNCs)

Figure 1 illustrates the schematic diagram of the synthesis of N-CQDs from CNCs. Briefly, 0.5 g dry powdered CNCs was mixed with 0.35 g of urea and placed in a 35 mL microwave tube with 15 mL of distilled water. To perform the synthesis, the sample was heated from room temperature to 180 °C and maintained at this temperature for 10 min before fast cooling to room temperature. The reaction mixture was centrifuged to remove large particles and impurities and then passed over a 0.22 µm filter membrane to isolate the N-CQDs, which were stored in the refrigerator for further analysis, including characterization and application.

2.4. Detection of Fe3+ Using N-CQDs

For the detection of Fe3+, N-CQDs (100 µL of the original fluid was diluted with 2 mL of distilled water) were mixed with varying concentrations of ferric nitrate (0–3000 µM) at a 1:1 v/v ratio. To study the selectivity of the prepared N-CQDs towards the detection of Fe3+ in aqueous solutions, other metal ions with a concentration of 1000 µM were prepared (K+, Cd2+, Mg2+, Zn2+, Ni2+, Al3+, Co2+, Na+, and Cu2+), and examined similarly to Fe3+. The fluorescence emission spectra of the above solutions were collected at the optimum excitation wavelength of 340 nm. The pH effect was determined by gradually adding 0.1 M HCl or 0.1 M NaOH to the N-CQDs solution.

2.5. Characterization

The functional groups of N-CQDs were analyzed using a Fourier transform infrared spectroscopy (FT-IR) (Bruker TENSOR 27 FT-IR, Johannesburg, South Africa). The crystalline phases of the prepared materials were studied using powder X-ray diffraction (PXRD) (Bruker D2 phaser equipped with Cu-Kα radiation (λ = 1.5405 Å), Johannesburg, South Africa) at an operating voltage of 30 kV and a current of 10 mA. Transmission electron microscopy was used to determine the morphology of the prepared N-CQDs (TEM, FEI Tecnai G2 Spirit, Johannesburg, South Africa) operated at 120 kV. ImageJ software version 1.8.0 was used to determine the particle size distribution from TEM images; more than 150 particles were measured. The fluorescence characteristics of the N-CQDs were analyzed using a photoluminescence (PL) spectrophotometer (Varian Cary 2656 Eclipse EL04103870 fluorescence spectrophotometer, Johannesburg, South Africa). The UV-vis absorption spectra of the N-CQDs were recorded using a spectrophotometer (SPECORD 210 plus UV-vis spectrophotometer, Johannesburg, South Africa). X-ray photoelectron spectroscopy (XPS) data provide surface elemental composition and chemical states of the N-CQDs; these were acquired in an ultra-high vacuum (UHV) chamber equipped with a SPECS PHOIBOS 150 hemispherical electron energy analyzer (Al Kα excitation line; hν = 1486.71 eV) (Pretoria, South Africa). Raman spectroscopy was employed to determine the area and peak positions of the D and G bands of N-CQDs using a Jobin Yvon T6400 micro-Raman spectrometer (Johannesburg, South Africa), which is equipped with a 514.9 nm argon ion laser and a liquid nitrogen-cooled charge-coupled detector (CCD). During the analysis, significant noise was observed in the signal output due to interference from the fluorescent nature of the functional groups present in the N-CQDs. To mitigate this issue, the laser power was increased to 50% for a few seconds, which helped to suppress the fluorescence and leave behind the carbon skeleton of the N-CQDs for clearer analysis.

3. Results

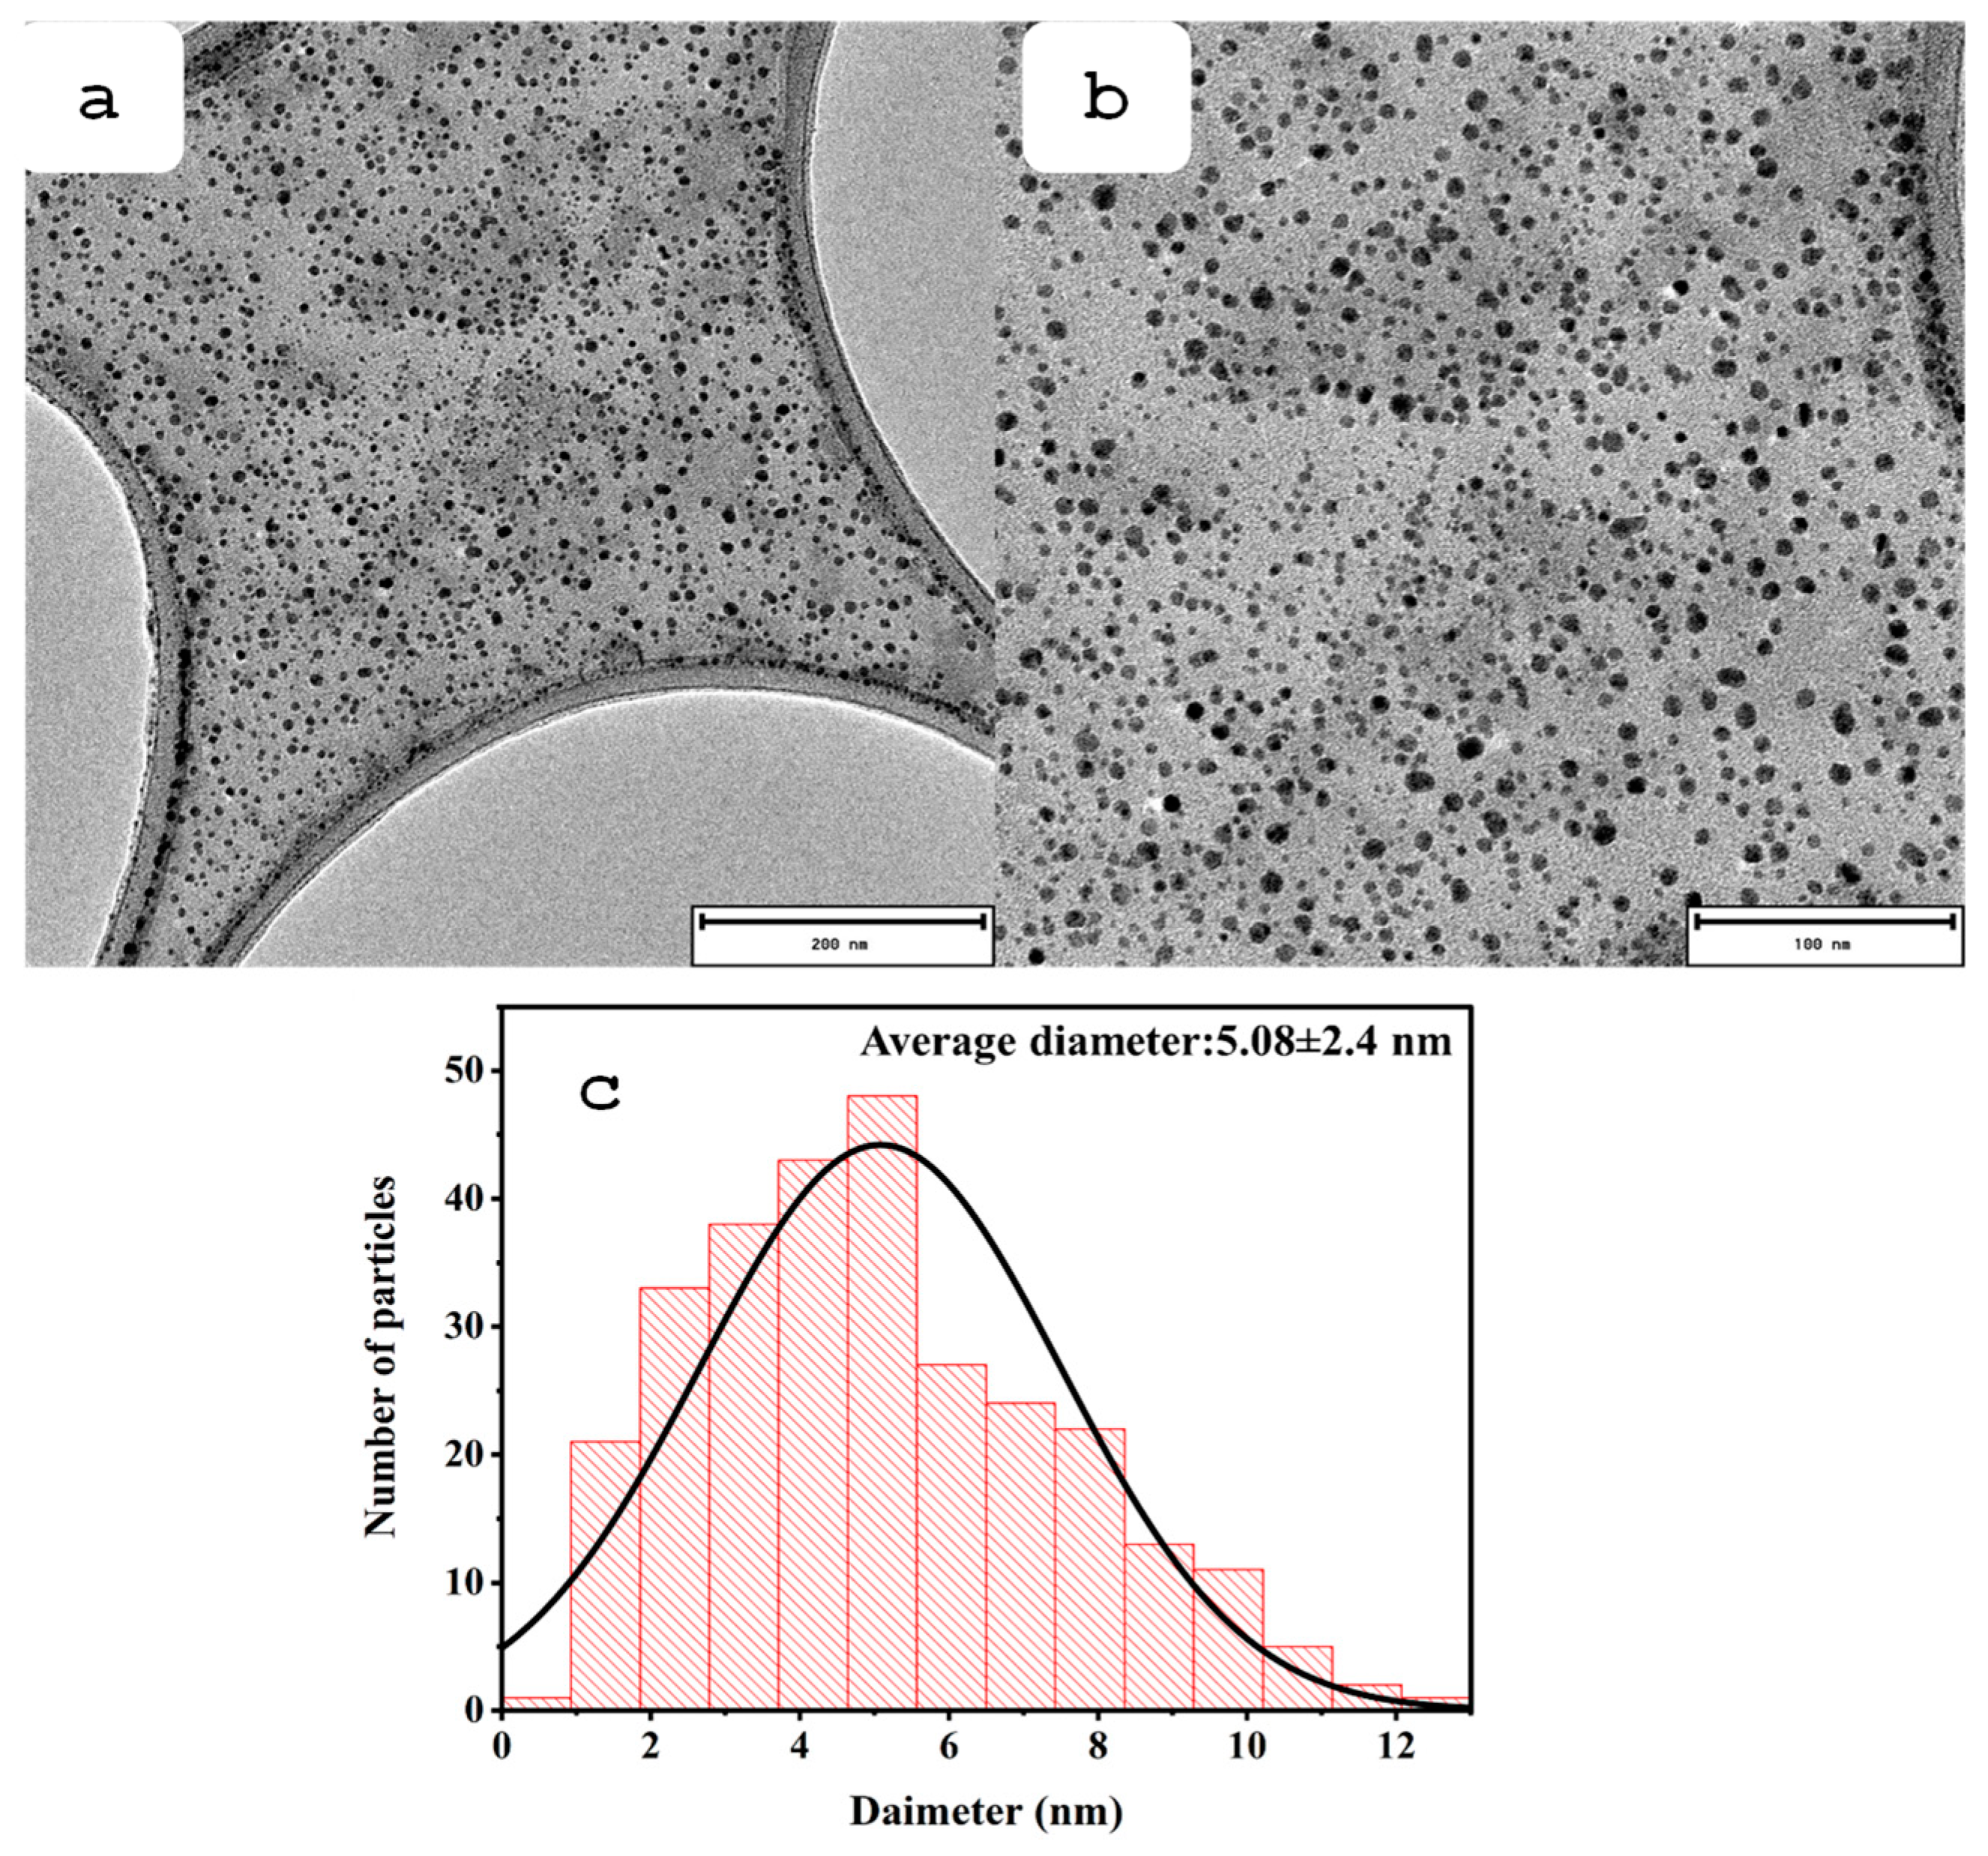
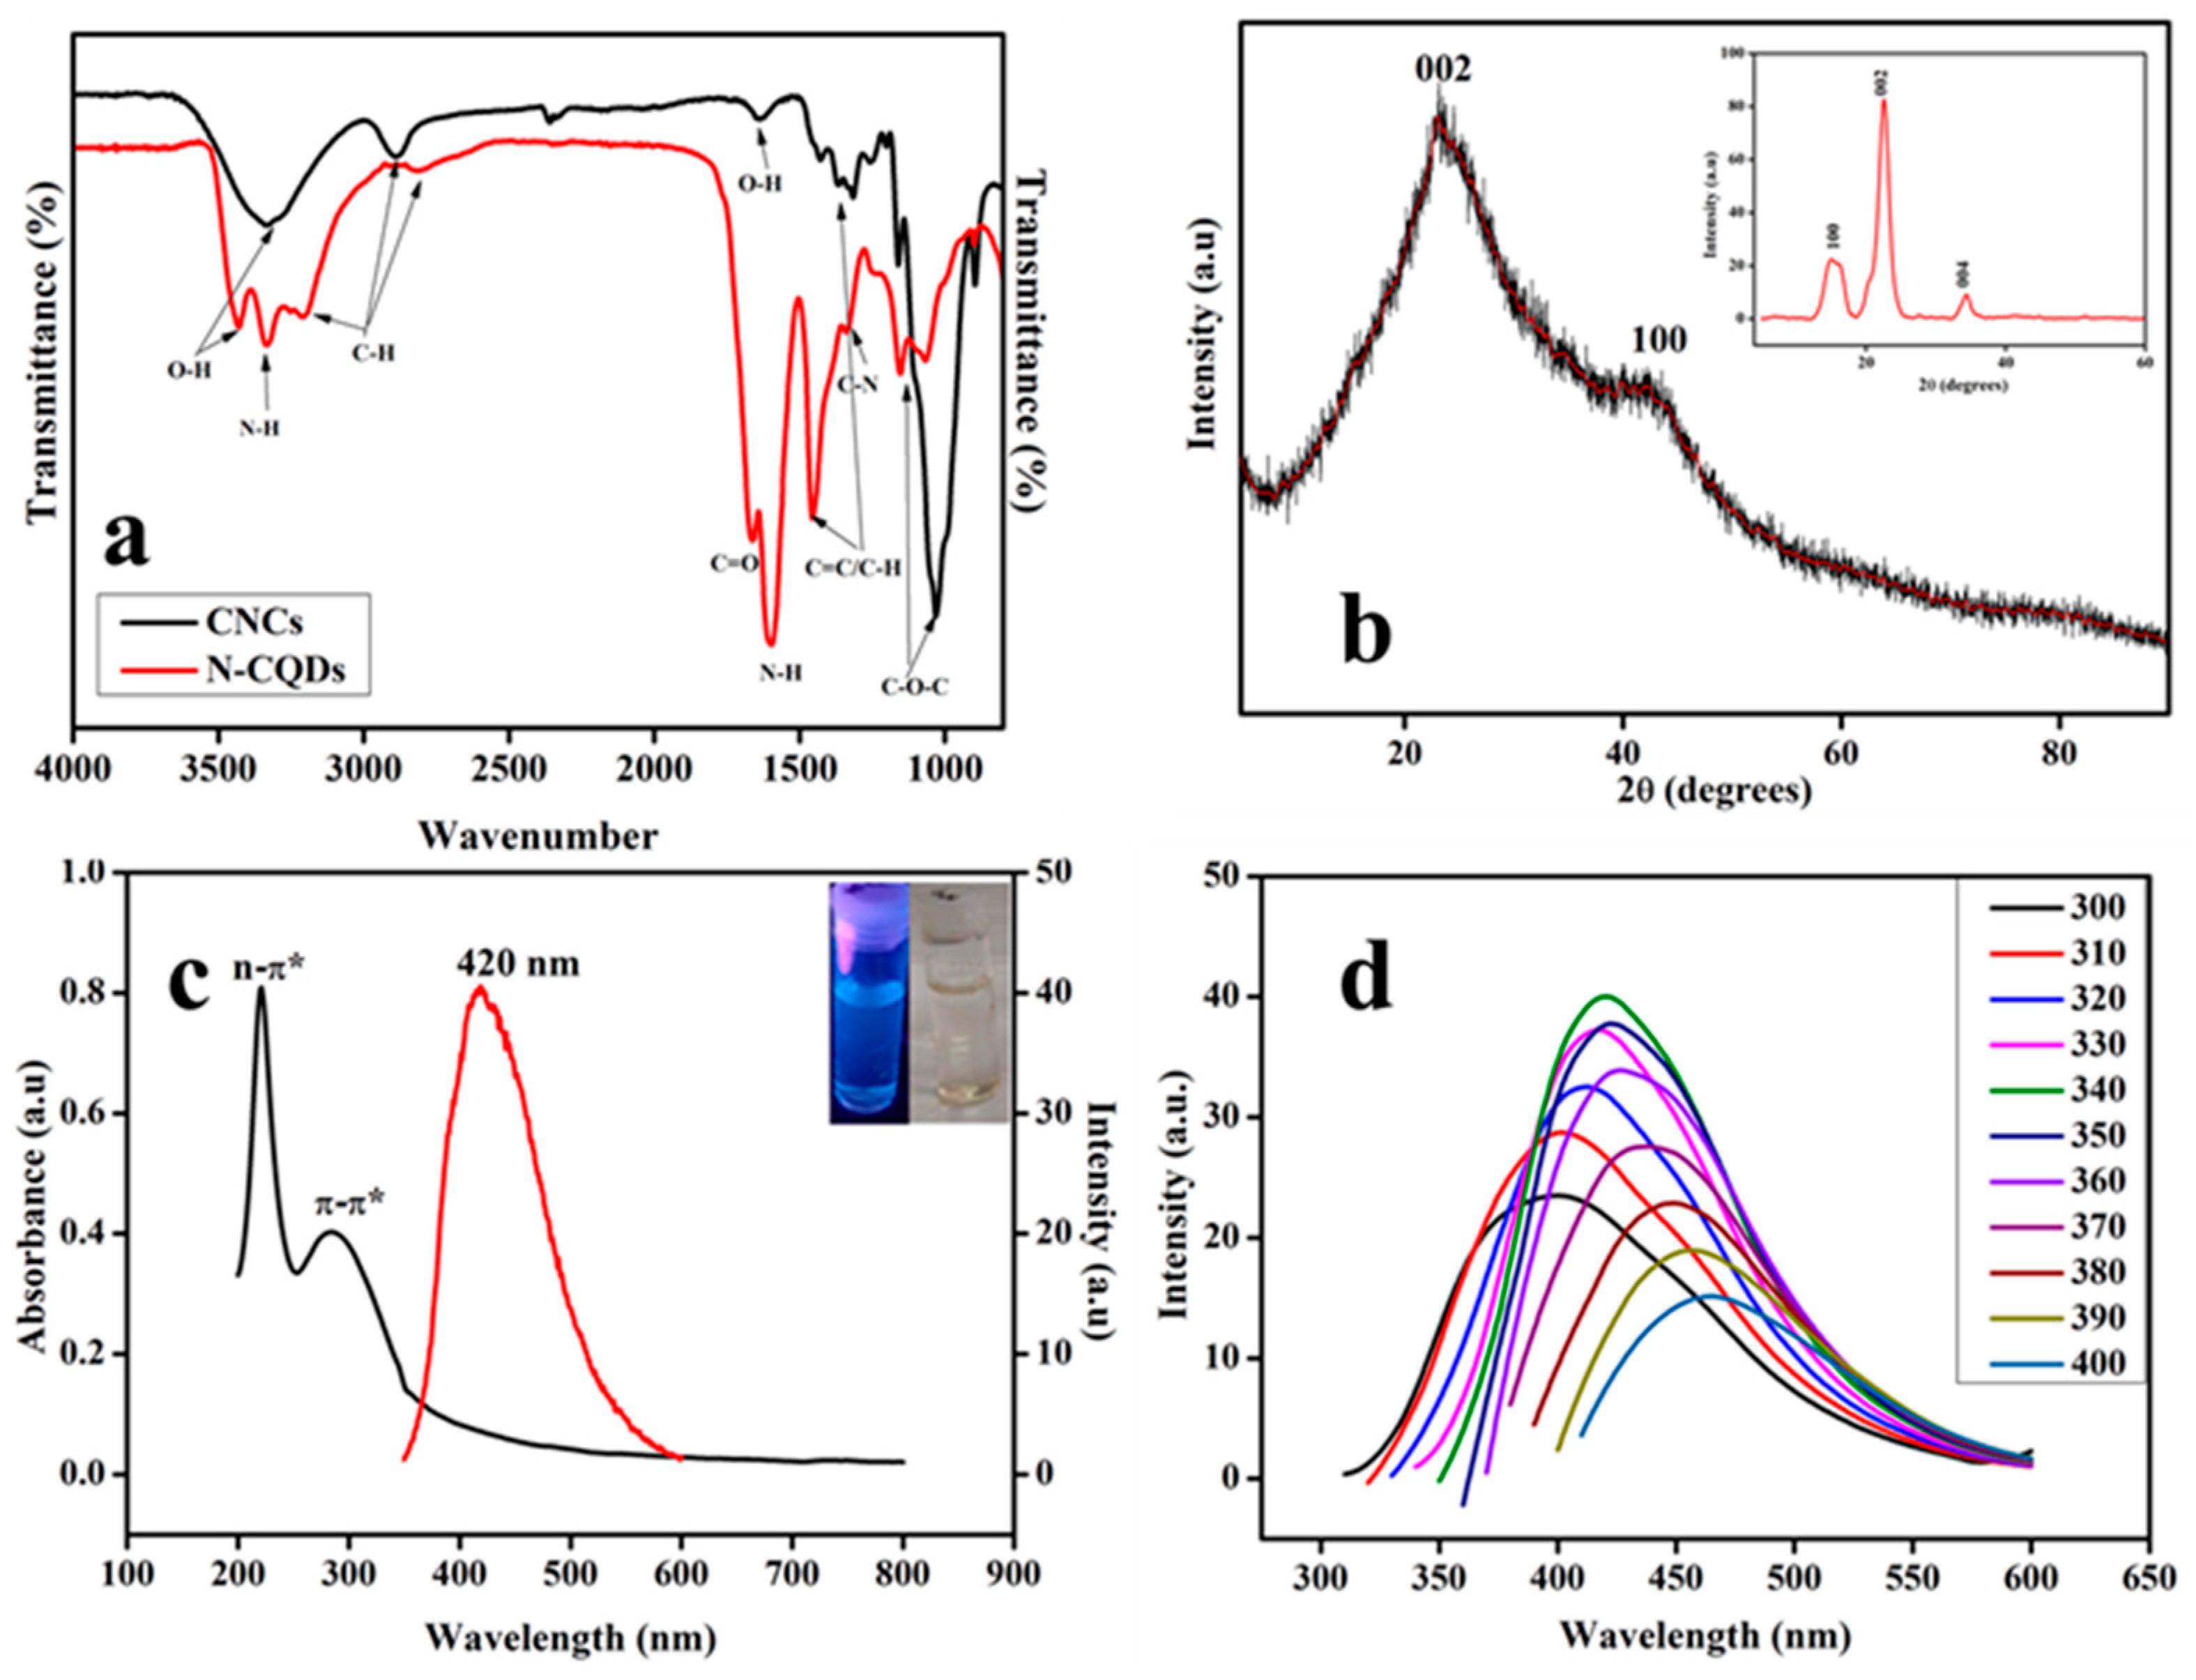
3.1. Properties of the Prepared N-CQDs

Transmission electron microscope (TEM) images (Figure 2a,b) demonstrate that the prepared N-CQDs exhibited spherical particles with diameters ranging from 1 to 13 nm and an average size of 5 ± 2 nm (the diameters of the particles were determined from the TEM images using ImageJ software as shown in Figure 2c). FT-IR spectroscopy was employed to determine the functional groups (Figure 3a). The characteristic absorption peaks of the CNCs at 3046–3675 cm−1 and 2805–2990 cm−1 can be attributed to the O-H and C-H stretching vibrations [30]; these peaks slightly shifted on the N-CQDs appearing around 2735–3522 cm−1, with an additional adsorption band around 3272–3389 cm−1, which is due to N-H stretching vibration [31]. Comparatively, the spectrum of N-CQDs consists of special bands between 1324 cm−1 and 1610 cm−1, which correspond to the characteristic stretching vibration of C-N bonds and N-H bonds, respectively, suggesting that nitrogen was successfully incorporated into the carbon matrix during the synthesis. The XRD pattern of the N-CQDs is shown in Figure 3b. These peaks are attributed to the (002) and (100) planes of graphitic carbon, respectively. The broad peak at 23° indicates the presence of highly disordered carbon atoms, while the weak shoulder at 42° reflects the underlying graphitic structure. These results suggest that the N-CQDs possess a predominantly amorphous nature with some degree of a graphitic character [32]. The inset in Figure 3b shows the XRD pattern of the cellulose nanocrystals (CNCs); three peaks appeared at 16°, 22°, and 34° which were assigned to the amorphous and crystalline carbon framework. This indicates that the CNCs were thoroughly carbonized. The optical properties of the as-prepared N-CQDs were studied using both UV-vis and photoluminescence spectroscopy.
Figure 3c shows the UV-Vis of the N-CQDs; two characteristic peaks at 220 and 285 nm were observed. The peak at 220 nm is attributed to the π-π* electronic transition of the π-conjugated sp2 carbon core, while the peak at 285 nm corresponds to the n-π* electronic transition, arising from the non-bonding orbitals of functional groups attached to the sp2 hybridized carbon core [33]. Under the UV lamp (365 nm), the N-CQDs exhibited a blue fluorescence (shown in the inset of Figure 3c). Figure 3d shows the excitation-dependent fluorescence emission spectra of N-CQDs obtained at varying excitation wavelengths from 300 nm to 400 nm with an increment of 10 nm, which resulted in an emission redshift [30]. This property may be due to the distribution of different functional groups with different emission traps, the difference in particle size, and multi fluorescence components in N-CQDs [25]. Emission maximum was obtained at 340 nm for the prepared N-CQDs.
The Raman spectrum of the N-CQDs exhibits characteristic carbon peaks centered at 1335 cm−1 and 1549 cm−1, corresponding to the D-band and G-band, respectively, as shown in Figure 4. The D-band is associated with sp3 carbons, arising from structural defects such as dangling bonds and disordered graphite, while the G-band corresponds to sp2-hybridized graphitic carbons, representing the vibrations within the graphitic lattice of carbon atoms in a two-dimensional (2D) hexagonal lattice [34]. The area ratio of the D-band to the G-band (AD/AG) for the N-CQDs was determined to be 2.9. This high ratio indicates a highly disordered structure, with significant functionalization and incorporation of heteroatoms, which increases the proportion of sp3 carbons [35]. The Raman analysis highlights that the N-CQDs are highly amorphous, consistent with the XRD results. The D-band reflects the vibrations of carbon atoms with dangling bonds in disordered regions, while the G-band represents the vibrations of sp2-bonded carbon atoms. X-ray photoelectron spectroscopy (XPS) was used to investigate the surface chemistry, bonding interactions, and purity of the prepared N-CQDs. The XPS survey spectrum (Figure 5a) identified the presence of carbon (C), oxygen (O), nitrogen (N), and silicon (Si), which are the primary constituents of the material. The high-resolution C 1s spectrum (Figure 5b) reveals four different chemical environments, such as sp2/sp3 carbon (C–C, C=C and C–H), C–N/C–OH, C=O/C–O–C, and N–C=O/O–C=O at 284.2, 284.8, 286.0, 287.6, and 288.7 eV, respectively [36]. These results confirm the presence of graphitic carbon and functionalized carbon within the N-CQDs, with sp3 carbons arising from structural defects such as functional groups and sp2-hybridized graphitic carbon contributing to the in-plane structure. This is consistent with the XRD pattern, which shows a broad amorphous peak, indicating a highly disordered carbon phase. The findings align with the FT-IR analysis, which identified various functional groups, and the Raman spectroscopy results, which verified the presence of graphitic structures and structural defects. Similarly, the O 1s spectrum (Figure 5c) deconvolutes into two prominent peaks at 531.6 eV and 533.17 eV, which correspond to C=O and C–O bonds, respectively [37]. The high-resolution N 1s spectrum (Figure 5d) demonstrates peaks at 327.2 eV and 400.2 eV, attributed to organic nitrogen species and cyanide groups, respectively. These nitrogen species, particularly pyridinic and graphitic N, are known to enhance electronic properties and catalytic activity, making the N-CQDs suitable for applications in sensing, energy conversion, and biomedicine [38]. Overall, the XPS results are consistent with the FT-IR analysis, indicating the presence of nitrogen and oxygen on the prepared N-CQDs.

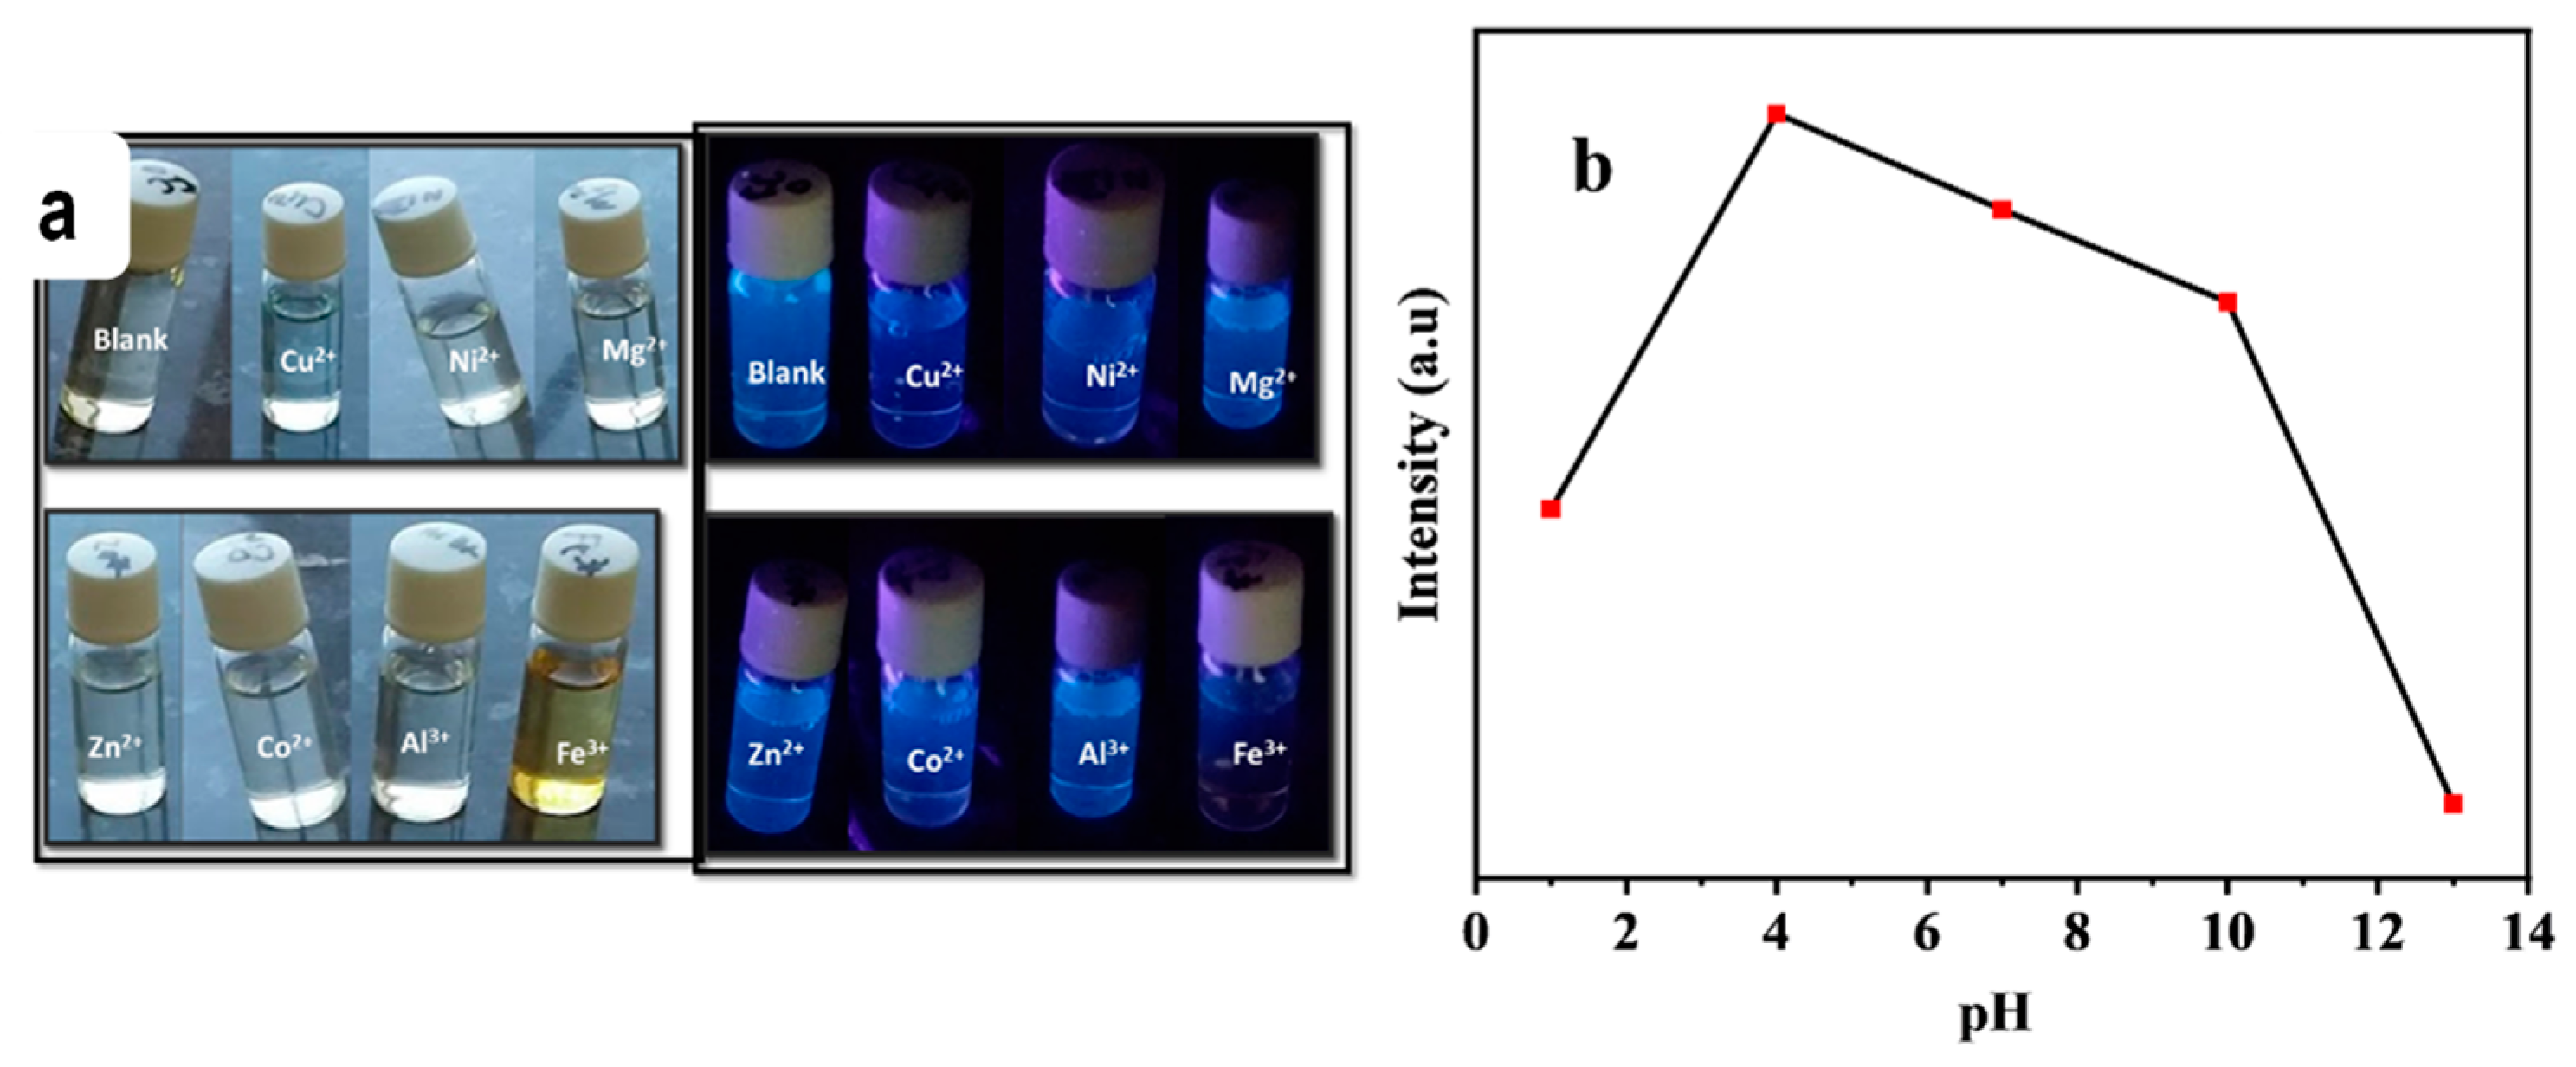
3.2. N-CQDs Sensitivity and Selectivity Towards Fe3+

The sensitivity of the N-CQDs towards Fe3+ was studied by adding different concentrations of Fe3+ (0 µM to 3000 µM) to the N-CQDs suspension and measuring the fluorescence emission intensity at the optimum excitation wavelength of 340 nm. As shown in Figure 6a, the fluorescence intensity of the N-CQDs decreased gradually with the increasing concentration of the Fe3+, indicating that the addition of Fe3+ ions can effectively quench the fluorescence emission of the N-CQDs. Based on previous studies, the mechanism of fluorescence quenching of N-CQDs in the presence of Fe3+ is caused by the formation of the N-CQDs-Fe3+ complexes, which facilitate electron transfers between N-CQDs and Fe3+ and which restrict excitation recombination, leading to fluorescence quenching [10,14]. The quenching constant was calculated using the Stern–Volmer equation, F0/F − 1 = Ksv [Fe3+], where Ksv represents the static Stern–Volmer constant and F0 and F represent the fluorescence intensities of the N-CQDs in the absence and presence of Fe3+ ions, respectively. The Stern–Volmer plots in Figure 6b showed good linearity in the Fe3+ range of 0–500 μM, with Ksv equal to 0.164 × 10⁴ M−1 and a correlation coefficient (R2) value of 0.9949. The limit of detection (LOD) was calculated to be 75 nM using the formula LOD = 3σ/s (where σ is the standard deviation and s is the slope of the linear response), which is comparable to previously reported fluorescence detection methods for Fe3+ ion detection, as shown in Table 1 [39,40,41]. UV-Vis was used to further study the mechanism of fluorescence quenching of the N-CQDs in the presence and absence of Fe3+ (Figure 6c). After adding 1000 µM Fe3+, the absorption peak at 285 nm disappeared and the spectrum resembled the absorption spectrum of the undiluted Fe3+, indicating Fe3+ saturated the surface of N-CQDs, which resulted in a color change from a bright blue to brown color under UV irradiation (the inset of Figure 5c).
To investigate the selectivity of the N-CQDs towards Fe3+, the fluorescence emissions of different metal ions with the potential of interfering with Fe3+ (1000 µM of Ca2+, Cd2+, Cu2+, Co2+, Mg2+, Ni2+, Zn2+, Al3+, K+, or Na+) were measured at the optimum excitation wavelength of 340 nm. Figure 6d shows the quenching effect of the different metal ions. It is seen that Fe3+, Cu2+, Ni2+, and Co2+ tend to decrease the fluorescent intensity, with Fe3+ showing the strongest effect. This is due to the ions having strong binding affinities for the functional groups (e.g., amine, hydroxyl, carboxyl) on the surface of N-CQDs [41]. In the present case, according to the FTIR results, many amino- and hydroxyl-containing functional groups appeared on the surface of the N-CQDs; these functional groups may have chelated Fe3+, resulting in the interaction of lone pairs of electrons on the nitrogen atoms to form complexes via coordination effects. The quenching occurs via an electron transfer between N-CQDs and the metal ion’s partially filled or empty 3d orbitals. For Fe3+, the half-filled 3d orbitals allow for efficient electron transfers, disrupting the radiative recombination of excited states and thus leading to fluorescence quenching [14]. Specifically, when Fe3+ is added to the N-CQDs, the fluorescence intensity decreases from an initial value (F0/F) of 1.0 to 0.23 when 1000 µM Fe3+ is added, indicating a considerable quenching effect of 77%. Cd2+, Ca2+, and K+ slightly increase the fluorescent intensity; this is due to the ions having moderate charge densities and forming weak electrostatic interactions with negatively charged or polar functional groups (e.g., carboxyl and hydroxyl groups) on the N-CQDs [42]. These interactions may stabilize the excited electronic states of the N-CQDs, reducing non-radiative decay pathways and increasing the radiative recombination, which enhances fluorescence [43]. No effect was observed after adding Na+, Mg2+, Zn2+, and Al3+; this is due to their inability to bind strongly to the functional groups of N-CQDs or the fact that their interaction does not facilitate electron transfer. To further study the interference of Fe3+ with other metal ions, Fe3+ detection in the presence of other ions was also measured. As shown in Figure 6d after the addition of Fe3+, the other metal ions start to exhibit a slight quenching effect on the fluorescence of the N-CQDs. The obtained results indicate that the prepared N-CQDs have a high sensitivity and selectivity towards the detection of Fe3+ and can be used as a chemosensor in an aqueous environment with competing ions.
Figure 7a shows the different metal ions in solution under normal light and UV light. They all show a blue emission, with Fe3+ appearing to weakly fluoresce followed by Cu2+ when compared to the others. The pH level is one of the critical parameters that affect the sensing performance of the N-CQDs. As shown in Figure 7b, the fluorescence emission intensity decreases slightly between pH 4 and pH 10, while larger variations are observed outside this range. The stability can be attributed to the behavior of the surface functional groups under different pH conditions, which influence the electronic and chemical interactions on the quantum dot surface [44]. The ability of the metal free N-CQDs to maintain stable fluorescence at slightly acidic to neutral pH conditions suggests their applicability in diverse aqueous environments. For instance, they can be effectively used in monitoring water quality in acid mine drainage, where high levels of Fe3+ ions are commonly encountered. Additionally, the pH-dependent fluorescence behavior observed in the N-CQDs suggests their potential as a fluorescence-based pH sensor, providing a dual functionality for detecting both specific ions, like Fe3+, and variations in pH.

4. Conclusions

In this study, highly fluorescent N-CQDs with sensitivity towards Fe3+ in aqueous solutions and a bright blue emission were synthesized by a one-step microwave synthesis from a mixture of cellulose nanocrystals and urea in 10 min. N-CQDs with an average diameter of 5 ± 2 nm were obtained. The prepared N-CQDs showed excitation-dependent fluorescence, good selectivity toward Fe3+, and a pH-dependent fluorescence. The LOD was determined to be 75 nM, which is comparable to previously reported Fe3+ fluorescence detection methods, while exhibiting the highest sensitivity when compared to a majority of reported data. Characterization using TEM, FT-IR, XPS, XRD, and Raman spectroscopy confirmed the spherical morphology, successful nitrogen incorporation, and predominantly amorphous structure of the N-CQDs with some graphitic features. These results demonstrate that N-CQDs possess a combination of structural, optical, and functional properties suitable for environmental monitoring and analytical sensing applications. Despite these promising findings, the reusability of the N-CQDs and their long-term stability in aqueous solutions remain unexplored. Future studies will investigate these aspects to assess their practicality for repeated use and durability in real-world conditions. Further research will also focus on optimizing reaction parameters to enhance sensitivity and selectivity, as well as exploring the impact of heteroatom doping and quantitative analysis comparisons. This work underscores the potential of transforming sustainable agricultural materials into high-performance nanostructures, contributing to green nanotechnology and offering innovative solutions for environmental monitoring and sensing applications.

Author Contributions

Conceptualization, E.C.L.-D.; writing—original draft preparation, L.P.M.; writing—review and editing, E.C.L.-D., L.P.M., C.M.M., T.E.M. and N.M. All authors have read and agreed to the published version of the manuscript.

Funding

This research was funded the National Research Foundation of South Africa Africa (Thuthuka grant number 129532) and the University of the Witwatersrand. This work is based on the research supported in part by the WITS Chancellor’s Female Academic Leaders Fellowship.

Data Availability Statement

The original contributions presented in the study are included in the article; further inquiries can be directed to the corresponding author.

Acknowledgments

The authors would like to acknowledge the financial support received from the National Research Foundation of South Africa and the University of the Witwatersrand.

Conflicts of Interest

The authors declare no conflicts of interest.

References

  1. Akram, M.A.; Ye, J.; Wang, G.; Shi, L.; Liu, Z.; Lu, H.; Zhang, S.; Ning, G. Bifunctional chemosensor based on a dye-encapsulated metal-organic framework for highly selective and sensitive detection of Cr2O72− and Fe3+ ions. Polyhedron 2020, 185, 114604. [Google Scholar] [CrossRef]
  2. Guo, H.; Wang, X.; Wu, N.; Xu, M.; Wang, M.; Zhang, L.; Yang, W. In-situ synthesis of carbon dots-embedded europium metal-organic frameworks for ratiometric fluorescence detection of Hg2+ in aqueous environment. Anal. Chem. Acta 2021, 1141, 13–20. [Google Scholar] [CrossRef] [PubMed]
  3. Jiang, Y.; Wang, Y.; Meng, F.; Wang, B.; Cheng, Y.; Zhu, C. N-doped carbon dots synthesized by rapid microwave irradiation as highly fluorescent probes for Pb2+ detection. New J. Chem. 2015, 39, 3357–3360. [Google Scholar] [CrossRef]
  4. Chaudhary, S.; Kumari, M.; Chauhan, P.; Chaudhary, G.R. Upcycling of plastic waste into fluorescent carbon dots: An environmentally viable transformation to biocompatible C-dots with potential prospective in analytical applications. Waste Manag. 2021, 120, 675–686. [Google Scholar] [CrossRef] [PubMed]
  5. Ji, X.; Wang, S.; Luo, Y.; Yuan, X.; Wei, Y.; Zhang, Q.; Qin, K.; Tu, Y. Green synthesis of weissella-derived fluorescence carbon dots for microbial staining, cell imaging and dual sensing of vitamin B12 and hexavalent chromium. Dye. Pigment. 2021, 184, 108818. [Google Scholar] [CrossRef]
  6. Wang, Y.; Lao, S.; Ding, W.; Zhang, Z.; Liu, S. A novel ratiometric fluorescent probe for detection of iron ions and zinc ions based on dual-emission carbon dots. Sensors Actuators B Chem. 2019, 284, 186–192. [Google Scholar] [CrossRef]
  7. Dutta, A.; Rooj, B.; Mondal, T.; Mukherjee, D.; Mandal, U. Detection of Co2+ via fluorescence resonance energy transfer between synthesized nitrogen-doped carbon quantum dots and Rhodamine 6G. J. Iran. Chem. Soc. 2020, 17, 1695–1704. [Google Scholar] [CrossRef]
  8. Jiang, Y.; Han, Q.; Jin, C.; Zhang, J.; Wang, B. A fluorescence turn-off chemosensor based on N-doped carbon quantum dots for detection of Fe3+ in aqueous solution. Mater. Lett. 2015, 141, 366–368. [Google Scholar] [CrossRef]
  9. Qi, H.; Teng, M.; Liu, M.; Liu, S.; Li, J.; Yu, H.; Teng, C.; Huang, Z.; Liu, H.; Shao, Q.; et al. Biomass-derived nitrogen-doped carbon quantum dots: Highly selective fluorescent probe for detecting Fe3+ ions and tetracyclines. J. Colloid Interface Sci. 2019, 539, 332–341. [Google Scholar] [CrossRef]
  10. Wu, F.; Yang, M.; Zhang, H.; Zhu, S.; Zhu, X.; Wang, K. Facile synthesis of sulfur-doped carbon quantum dots from vitamin B1 for highly selective detection of Fe3+ ion. Opt. Mater. 2018, 77, 258–263. [Google Scholar] [CrossRef]
  11. Gao, G.; Jiang, Y.-W.; Jia, H.-R.; Yang, J.; Wu, F.-G. On-off-on fluorescent nanosensor for Fe3+ detection and cancer/normal cell differentiation via silicon-doped carbon quantum dots. Carbon 2018, 134, 232–243. [Google Scholar] [CrossRef]
  12. Zulfajri, M.; Gedda, G.; Chang, C.-J.; Chang, Y.-P.; Huang, G.G. Cranberry Beans Derived Carbon Dots as a Potential Fluorescence Sensor for Selective Detection of Fe3+ Ions in Aqueous Solution. ACS Omega 2019, 4, 15382–15392. [Google Scholar] [CrossRef] [PubMed]
  13. Xu, T.-T.; Yang, J.-X.; Song, J.-M.; Chen, J.-S.; Niu, H.-L.; Mao, C.-J.; Zhang, S.-Y.; Shen, Y.-H. Synthesis of high fluorescence graphene quantum dots and their selective detection for Fe3+ in aqueous solution. Sensors Actuators B Chem. 2017, 243, 863–872. [Google Scholar] [CrossRef]
  14. Deng, X.; Feng, Y.; Li, H.; Du, Z.; Teng, Q.; Wang, H. N-doped carbon quantum dots as fluorescent probes for highly selective and sensitive detection of Fe3+ ions. Particuology 2018, 41, 94–100. [Google Scholar] [CrossRef]
  15. Zhao, S.; Song, X.; Chai, X.; Zhao, P.; He, H.; Liu, Z. Green production of fluorescent carbon quantum dots based on pine wood and its application in the detection of Fe3+. J. Clean. Prod. 2020, 263, 121561. [Google Scholar] [CrossRef]
  16. Wang, K.; Chen, J.; Li, H.; Zhang, M.; Liao, Q.; Wang, L.; Zhang, Y.; Niu, X. A fluorescent probe for selective detection of Fe3+ by using a self-assembled nitrogen-doped carbon quantum dots-3,4,9,10-perylenetetracarboxylic acid composite. Ionics 2021, 27, 4907–4916. [Google Scholar] [CrossRef]
  17. Guo, R.; Zhou, S.; Li, Y.; Li, X.; Fan, L.; Voelcker, N.H. Rhodamine-functionalized graphene quantum dots for detection of Fe3+ in cancer stem cells. ACS Appl. Mater. Interfaces 2015, 7, 23958–23966. [Google Scholar] [CrossRef] [PubMed]
  18. Ji, W.-J.; Pei, W.-W.; Wang, Q.-B.; Liu, G.-F.; Yan, B.; Yao, S.-Q.; Zhai, Q.-G. Decoration of bare carboxyl group on the pore surface of metal-organic frameworks for high selective fluorescence Fe3+ detection. J. Solid State Chem. 2019, 274, 18–25. [Google Scholar] [CrossRef]
  19. Yuan, G.; Zhang, C.; Hao, X.-R.; Li, X.-M.; Yu, X.-H.; Zheng, Y.-P.; Su, Z.-M. Two water-stable Cd(II)-MOFs as multiresponsive chemosensors with high sensitivity and selectivity for Fe3+, Cr2O72−, and MnO4 ions. J. Solid State Chem. 2021, 303, 122538. [Google Scholar] [CrossRef]
  20. Lu, M.; Duan, Y.; Song, Y.; Tan, J.; Zhou, L. Green preparation of versatile nitrogen-doped carbon quantum dots from watermelon juice for cell imaging, detection of Fe3+ ions and cysteine, and optical thermometry. J. Mol. Liq. 2018, 269, 766–774. [Google Scholar] [CrossRef]
  21. Chen, Y.; Sun, X.; Pan, W.; Yu, G.; Wang, J. Fe3+-Sensitive carbon dots for detection of Fe3+ in aqueous solution and intracellular imaging of Fe3+ inside fungal cells. Front. Chem. 2020, 7, 911. [Google Scholar] [CrossRef] [PubMed]
  22. Xu, X.; Ray, R.; Gu, Y.; Ploehn, H.J.; Gearheart, L.; Raker, K.; Scrivens, W.A. Electrophoretic analysis and purification of fluorescent single-walled carbon nanotube fragments. J. Am. Chem. Soc. 2004, 126, 12736–12737. [Google Scholar] [CrossRef]
  23. Zhuo, Y.; Miao, H.; Zhong, D.; Zhu, S.; Yang, X. One-step synthesis of high quantum-yield and excitation-independent emission carbon dots for cell imaging. Mater. Lett. 2015, 139, 197–200. [Google Scholar] [CrossRef]
  24. Tan, X.W.; Romainor, A.N.B.; Chin, S.F.; Ng, S.M. Carbon dots production via pyrolysis of sago waste as potential probe for metal ions sensing. J. Anal. Appl. Pyrolysis 2014, 105, 157–165. [Google Scholar] [CrossRef]
  25. Guo, Y.; Cao, F.; Li, Y. Solid-phase synthesis of nitrogen and phosphorus co-doped carbon quantum dots for sensing Fe3+ and enhanced photocatalytic degradation of dyes. Sensors Actuators B Chem. 2018, 255, 1105–1111. [Google Scholar] [CrossRef]
  26. Liu, Y.; Xiao, N.; Gong, N.; Wang, H.; Shi, X.; Gu, W.; Ye, L. One-step microwave-assisted polyol synthesis of green luminescent carbon dots as optical nanoprobes. Carbon 2014, 68, 258–264. [Google Scholar] [CrossRef]
  27. Qu, S.; Wang, X.; Lu, Q.; Liu, X.; Wang, L. Carbon nanodots: A biocompatible fluorescent ink based on water-soluble luminescent carbon nanodots. Angew. Chem. Int. Ed. 2012, 124, 12381–12384. [Google Scholar] [CrossRef]
  28. Magagula, L.P. Synthesis and Characterization of Agricultural Waste Carbon-Based Structures for Application in Sensing. Master’s Thesis, University of the Witwatersrand, Johannesburg, South Africa, 2022. Available online: https://wiredspace.wits.ac.za (accessed on 2 January 2023).
  29. Johar, N.; Ahmad, I.; Dufresne, A. Extraction, preparation, and characterization of cellulose fibres and nanocrystals from rice husk. Ind. Crops Prod. 2012, 37, 93–99. [Google Scholar] [CrossRef]
  30. Xu, J.; Krietemeyer, E.F.; Boddu, V.M.; Liu, S.X.; Liu, W.-C. Production and characterization of cellulose nanofibril (CNF) from agricultural waste corn stover. Carbohydr. Polym. 2018, 192, 202–207. [Google Scholar] [CrossRef]
  31. Hu, C.; Zhu, Y.; Zhao, X. On-off-on nanosensors of carbon quantum dots derived from coal tar pitch for the detection of Cu2+, Fe3+, and L-ascorbic acid. Spectrochim. Acta A Mol. Biomol. Spectrosc. 2021, 250, 119325. [Google Scholar] [CrossRef]
  32. Zhao, L.; Wang, Y.; Zhao, X.; Deng, Y.; Xia, Y. Facile Synthesis of Nitrogen-Doped Carbon Quantum Dots with Chitosan for Fluorescent Detection of Fe3+. Polymers 2019, 11, 1731. [Google Scholar] [CrossRef]
  33. Ali, M.S.; Bhunia, N.; Ali, M.S.; Karmakar, S.; Mukherjee, P.; Chattopadhyay, D. Fluorescent N-doped carbon quantum dots: A selective detection of Fe3+ and understanding its mechanism. Chem. Phys. Lett. 2023, 825, 140574. [Google Scholar] [CrossRef]
  34. He, G.; Shu, M.; Yang, Z.; Ma, Y.; Huang, D.; Xu, S.; Wang, Y.; Hu, N.; Zhang, Y.; Xu, L. Microwave formation and photoluminescence mechanisms of multi-state nitrogen doped carbon dots. Appl. Surf. Sci. 2017, 422, 257–265. [Google Scholar] [CrossRef]
  35. Masemola, C.M. Nitrogen Doped Graphene Quantum Dots Modified Polyaniline for Room Temperature Alcohol Sensing. Master’s Thesis, University of the Witwatersrand, Johannesburg, South Africa, 2021. Available online: https://wiredspace.wits.ac.za/server/api/core/bitstreams/4be13bf1-8f08-4fc5-9e03-d51ac348dd49/content (accessed on 5 November 2024).
  36. Bhakare, M.A.; Bondarde, M.P.; Lokhande, K.D.; Dhumal, P.S.; Some, S. Quick transformation of polymeric waste into highly valuable N-self-doped carbon quantum dots for detection of heavy metals from wastewater. Chem. Eng. Sci. 2023, 281, 119150. [Google Scholar] [CrossRef]
  37. Murugan, N.; Prakash, M.; Jayakumar, M.; Sundaramurthy, A.; Sundramoorthy, A.K. Green synthesis of fluorescent carbon quantum dots from Eleusine coracana and their application as a fluorescence ‘turn-off’ sensor probe for selective detection of Cu2+. Appl. Surf. Sci. 2019, 476, 468–480. [Google Scholar] [CrossRef]
  38. Kaur, M.; Kaur, M.; Sharma, V.K. Nitrogen-doped graphene and graphene quantum dots: A review onsynthesis and applications in energy, sensors, and environment. Adv. Colloid Interface Sci. 2018, 259, 44–64. [Google Scholar] [CrossRef] [PubMed]
  39. Elizabeth, A.T.; Arockiaraj, S.D.; Rajasekaran, A.; Vasu, A.E. Morinda coreia fruits derived green-emissive nitrogen-doped carbon quantum dots: Selective and sensitive detection of ferric ions from water. Inorg. Chem. Commun. 2024, 164, 112390. [Google Scholar] [CrossRef]
  40. Elizabeth, A.T.; James, E.; Jesan, L.I.; Arockiaraj, S.D.; Vasu, A.E. Green synthesis of value-added nitrogen doped carbon quantum dots from Crescentia cujete fruit waste for selective sensing of Fe3+ ions in aqueous medium. Inorg. Chem. Commun. 2024, 149, 110427. [Google Scholar] [CrossRef]
  41. Patra, S.; Singh, M.; Subudhi, S.; Mandal, M.; Nayak, A.K.; Sahu, B.B.; Mahanandia, P. One-step green synthesis of in–situ functionalized carbon quantum dots from Tagetes patula flowers: Applications as a fluorescent probe for detecting Fe3+ ions and as an antifungal agent. J. Photochem. Photobiol. A Chem. 2023, 442, 114779. [Google Scholar] [CrossRef]
  42. Bi, J.; Wang, H.; Kamal, T.; Zhu, B.-W.; Tan, M. A fluorescence turn-off-on chemosensor based on carbon nanocages for detection of ascorbic acid. RSC Adv. 2017, 7, 30481–30487. [Google Scholar] [CrossRef]
  43. Zhou, Y.; Chen, G.; Ma, C.; Yang, T.; Li, L.; Gu, J.; Zhu, C.; Hu, A.; Li, X.; Guan, W.; et al. Carbon quantum dots as a turn-on fluorescent probe for the sensitive detection of Cd2+. Spectrochim. Acta Part A Mol. Biomol. Spectrosc. 2024, 317, 124453. [Google Scholar] [CrossRef]
  44. Li, L.; Wang, C.; Luo, J.; Guo, Q.; Liu, K.; Liu, K.; Zhao, W.; Lin, Y. Fe3+-functionalized carbon quantum dots: A facile preparation strategy and detection for ascorbic acid in rat brain microdialysates. Talanta 2015, 144, 1301–1307. [Google Scholar] [CrossRef]
Figure 1. Synthesis of N-CQDs using microwave synthesis and their application in the detection of Fe3+ using photoluminescence spectroscopy.
Processes 13 00257 g001
Figure 2. TEM images of the N-CQDs (a,b) and particle size distribution of the N-CQDs (c).
Processes 13 00257 g002
Figure 3. (a) FT-IR of CNCs and the N-CQDs. (b) XRD of the N-CQDs, the inset in (b) shows the XRD of the cellulose nanocrystals. (c) UV-vis absorption spectra of the as-prepared N-CQDs sample in water (black) and fluorescence emission of the N-CQDs at 340 nm excitation wavelength (red); the inset in (c) shows the N-CQDs sample solution in water during daylight and under a UV lamp (365 nm). (d) Fluorescence spectra of N-CQDs obtained from different wavelengths of excitation 300–400 nm (with 10 nm increments starting from 300 nm).
Processes 13 00257 g003
Figure 4. Raman spectrum of the as-synthesized N-CQDs.
Processes 13 00257 g004
Figure 5. (a) XPS survey spectrum of N-CQDs. (bd) High resolution spectra of C 1s, O 1s, and N 1s from as synthesized N-CQDs, respectively. The colored peaks in (bd) show the deconvolution of the C 1s, O 1s, and N 1s peaks, respectively.
Processes 13 00257 g005
Figure 6. (a) Fluorescence spectra of N-CQDs in different concentrations of Fe3+ (5–3000 μM), (b) linear relationship between F0/F and Fe3+ concentration (5–500 µM), (c) UV-Vis spectra of the N-CQDs with and without different concentrations of Fe3+, and (d) changes in the fluorescence intensity ratio (I/I0) of N-CQDs after the addition of various metal ions. The inset in (c) shows the N-CQDs sample with different concentrations of Fe3+ under the UV lamp (365 nm).
Processes 13 00257 g006
Figure 7. (a) Picture of different metal ions in solution under normal light and UV lamp (365 nm). (b) Effect of pH on the fluorescence emission of N-CQDs.
Processes 13 00257 g007
Table 1. Comparison of different methods used for the detection of Fe3+.
Detection MethodSensor MaterialSynthesis MethodAverage Particle Size (nm)Linear Range (µM)LOD (µM)Reference
FluorescenceN-CQDs from
Morinda coreia
Hydrothermal, 180 °C, 24 h1.990–2501.32[39]
FluorescenceN-CQDs from Crescentia cujete fruitHydrothermal, 200 °C, 10 h4.360–2500.257[40]
FluorescenceN-CQDs from
Tagetes patula flowers
Hydrothermal, 220 °C, 5 h5.151–40.32[41]
FluorescenceN-CQDs from cellulose nanocrystalsMicrowave,
180 °C, 10 min
5 ± 20–5000.075This work
Disclaimer/Publisher’s Note: The statements, opinions and data contained in all publications are solely those of the individual author(s) and contributor(s) and not of MDPI and/or the editor(s). MDPI and/or the editor(s) disclaim responsibility for any injury to people or property resulting from any ideas, methods, instructions or products referred to in the content.

