Article

Heat Enhancement of Ethylene Glycol/Water Mixture in the Presence of Gyroid TPMS Structure: Experimental and Numerical Comparison

1
Department of Mechanical and Industrial Engineering, Toronto Metropolitan University, Toronto, ON M5B 2K3, Canada
2
Department of Chemistry and Biology, Toronto Metropolitan University, Toronto, ON M5B 2K3, Canada
3
New York University in Abu Dhabi, Abu Dhabi 51133, United Arab Emirates
*
Author to whom correspondence should be addressed.
Processes 2025, 13(1), 228; https://doi.org/10.3390/pr13010228
Submission received: 26 November 2024 / Revised: 6 January 2025 / Accepted: 13 January 2025 / Published: 15 January 2025
(This article belongs to the Section Chemical Processes and Systems)

Abstract

:
Cooling small components is becoming an attractive topic for researchers. In this paper, an attempt is made to use an ethylene glycol/water mixture as a cooling liquid. This liquid is a helpful application for when the fluid is in a harsh environment and should not freeze. The experiment uses an ethylene glycol/water mixture circulating through a triply periodic minimal surface structure (TPMS) made of aluminum and silver. A constant heat flux equal to 38,000 W/m2 is applied, and three different flow rates, 11.8 cm3/s, 15.5 cm3/s, and 19.6 cm3/s, are studied. The experimental setup is complemented with numerical modelling by solving the Navier–Stokes equation and the energy equation using the finite element technique. The flow is Newtonian, and a laminar regime is implemented. Results reveal that the performance of the ethylene glycol/water mixture did not enhance heat removal when compared to water. The average Nusselt number is similar regardless of the concentration of ethylene glycol in the mixture. This average Nusselt number, Nuaverage, in the presence of aluminum TPMS ranges between 60 and 80 (60 < Nuaverage < 80) and between 65 and 85 (65 < Nuaverage < 85) using silver TPMS. The increase in the mixture’s viscosity due to ethylene glycol increased the pressure drop. The performance evaluation criteria reach the maximum value of 90 when the mixture is composed of 5%vol ethylene glycol in water with aluminum TPMS. In the presence of silver TPMS, the maximum performance evaluation criterion is around 95 with a 5% ethylene glycol/water mixture. Finally, it is proven experimentally and confirmed numerically that the TPMS structure secures uniform heat extraction from the hot surface.

1. Introduction

Heat extraction or heat enhancement plays a vital role in industrial applications. Nowadays, the focus is on cooling systems such as lithium-ion batteries. Different approaches have been adopted for this cooling process. Researchers use porous structures [1], channels, and fins [2], and recently triply periodic minimal surface structures [3]. Different liquids have been used to transport heat, such as water, water with nanoparticles referred to as nanofluids, and a mixture of water with a solution that is miscible with water. Amongst them, which is the subject of this manuscript, are water and ethylene glycol (EG) for different concentrations of EG.
Water and ethylene glycol, despite their different thermal properties, are miscible, making them a practical choice for industrial applications. The mixture’s thermal conductivity, specific heat, and viscosity vary with the concentration of EG in water. As the concentration of EG increases, the mixture’s viscosity rises accordingly, a factor that must be considered in practical applications. Ethylene glycol’s role as an antifreeze agent and coolant further highlights its practical relevance in the industry.
Few researchers have used an ethylene glycol/water mixture to study heat enhancement for different configurations. Sanitjai and Goldstein [4] measured experimentally the local heat transfer for an EG/water mixture around a cylinder. The fluid mixtures had different concentrations of ethylene glycol, with a Prandtl number varying from 6 to 176. Results reveal that the Nusselt number varied with the Reynolds number, not the EG concentration. Gowen and Smith [5] investigated different ethylene glycol and water mixtures in a turbulent pipe. The aim was to determine the effect of the Prandtl number on the temperature profile when the flow is in a turbulent regime. A temperature profile relation was determined when the Prandtl number equaled 15. Obot et al. [6,7] investigated the importance of an ethylene glycol/water mixture in pressure drop and friction coefficient. Their experiment covered a range of flow regimes from laminar to turbulent. In the laminar regime, the Nusselt number was directly proportional to the square root of the Reynolds number. Their correlation is found to be close to the experimental measurement. In addition, it was found that such a mixture has a tremendous pressure and friction coefficient due to its high viscosity compared to water only.
Keklikcioglu et al. [8] investigated the heat enhancement technique using a mixture of ethylene glycol and water in a modified heat exchanger. Due to the mixture’s viscosity, the Bejan number is lower as the ethylene glycol concentration increases. It was also concluded that using water instead of the EG/water mixture is more efficient. Jafari et al. [9] investigated the heat transfer enhancement via a four-point star swirl generator in the presence of water–ethylene glycol mixtures. It was found and confirmed that water or a lower ethylene glycol/water mixture concentration is the best fluid for such applications. As shown, the high viscosity of ethylene glycol and its low specific heat and density can reduce the heat enhancement of such liquid.
Ma et al. [10] investigated the friction characteristics of an ethylene glycol solution in an internal helical-finned horizontal tube. Friction factors were accurately measured under the adiabatic condition. An empirical friction factors relation has been proposed in the presence of an EG/water mixture. Dehghandokht et al. [11] studied a water and ethylene glycol mixture flow in a multi-port serpentine meso-channel heat exchanger. Results revealed that water and a low concentration of ethylene glycol in a water solution can provide experimentally similar results. Jiang et al. [12] conducted a molecular dynamic modelling to evaluate the thermal conductivity of the EG/water mixture. The results were compared with the measured experimental data, and a good agreement was reached. Joy et al. [13] investigated a series of liquids for cooling a solar photovoltaic collector. Amongst the fluids used is a mixture of ethylene glycol and water. It was found that water had better performance than the proposed mixture of ethylene/water due to its higher thermal conductivity. On the other hand, Go et al. [14] estimated the heat transfer coefficient of ethylene glycol water mixture in a nanopipe—a sudden boundary layer developed due to the high viscosity of the mixture. Mahdavi et al. [15] investigated experimentally and solved numerically the thermal and hydrodynamic characteristics of laminar flow in a cavity. Different fluids were used, including a mixture of ethylene glycol in water. It was found that it is challenging to maintain thermal boundary conditions at the cavity wall in the presence of a mixed ethylene glycol/water solution.
Yang et al. [16] developed a heat transfer correlation for a single-phase flow in a plate heat exchanger using ethylene glycol and water solution as the circulating fluid. Zhou et al. [17] used an ethylene glycol/water mixture solution to study spray cooling experimentally and investigated the heat transfer performance. It was found that the best performance was when the ethylene glycol was at its lowest concentration in a water mixture. This is due to the low conductivity, heat capacity, and high viscosity of the mixture.
Gemicioglu and Demircan [18] investigated the heat transfer performance in a heat exchange using different ethylene glycol/water mixtures. Results revealed that the freezing temperature decreased due to ethylene glycol in one mixture. On the other hand, the radiator’s performance was negatively impacted using this mixture. The best performance was recorded when water alone was used in the radiator. Thiyana et al. [19] investigated the heat transfer coefficient in a copper pipe flow using an ethylene glycol/water mixture. The highest performance was found when the flow rate increased with an increase in pressure drop. Additional researchers used ethylene glycol/water mixtures as circulating fluids [20,21] or as a fluid base with nanoparticles [22,23].
The novelty of this paper is to study experimental heat enhancement in a triply periodic minimal surfaces (TPMS) structure subject to constant heat flux and different flow rates using mixtures of ethylene glycol in water. The concentration of EG in water is varied from 5%vol to 30%vol. The structure itself is made using a gyroid with 70% porosity. Then, a comparison with the numerical data is used to prove the efficiency of the numerical model. Using a neural network, heat enhancement is adopted at a higher concentration of ethylene glycol in water, and the results are compared with those of the numerical model. Section 2 presents the experimental measurement data, followed by Section 3, used for the numerical modelling. Section 4 compares the measured experimental data and the numerical results. Section 5 shows the prediction by the neural network of the heat enhancement at a concentration of EG higher than 50% and compared with numerical modeling. The conclusion is left for Section 5.

2. Experimental Study

A mixture of water and ethylene glycol, known as antifreeze or coolant, is typically used in automotive and industrial applications. Ethylene glycol mixtures contain additives to prevent the corrosion of metal components in cooling systems. Thus, it helps cool different hot surfaces. On the other hand, ethylene glycol in a mixture with water increases its viscosity. A high viscosity mixture can affect the flow rate measuring sensor. Thus, an optimum concentration must be determined. In the current study, ethylene glycol concentrations in water vary between 5%vol% and 30%vol%.
TPMS are structures characterized by repeating, non-self-intersecting surfaces that divide space into two continuous, interwoven regions. These structures are known for their high surface area-to-volume ratio and interconnected porosity, making them useful in a heat exchanger application. Herein, the TPMS and an ethylene glycol/water mixture were used to investigate heat enhancement on a surface with dimensions of 37.5 mm by 37.5 mm by 12.7 mm. This surface size is typical of an intel ship, and the aim is to find the optimum mixture for cooling the hot surface.

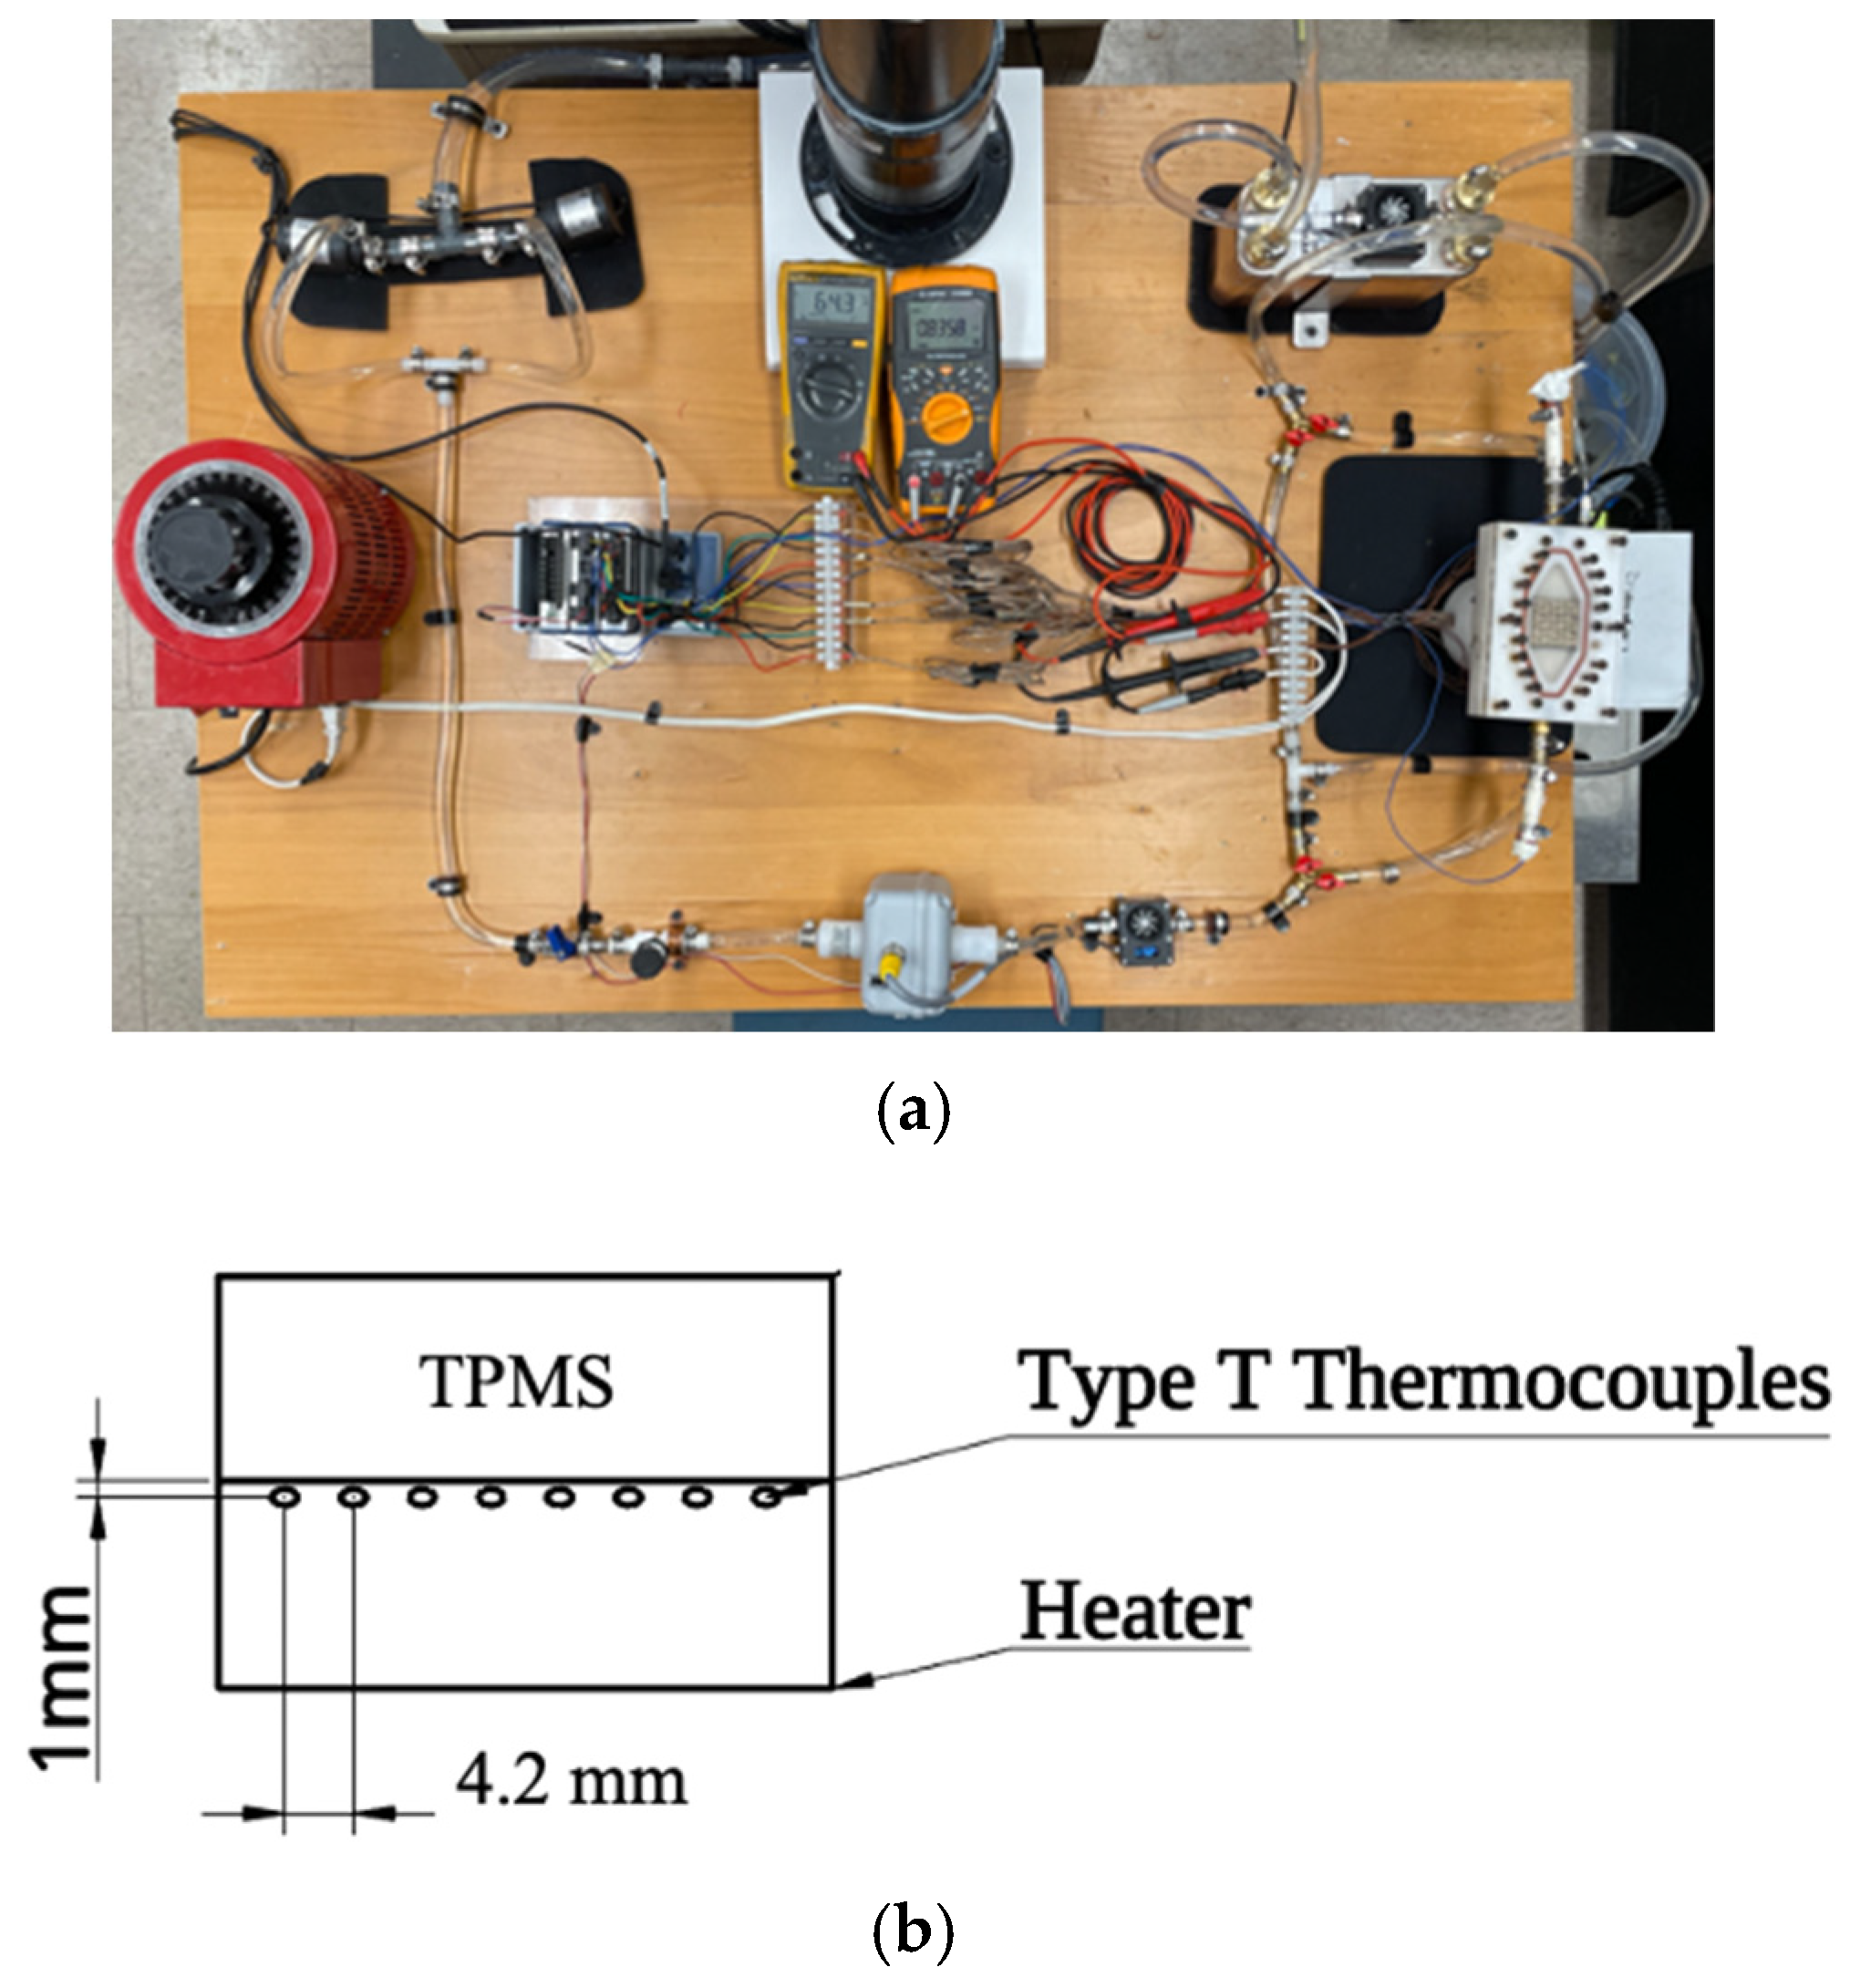
2.1. Experiment Description

The experimental setup used in this study is an extension of the one used by Saghir and Kilic [24]. The differences include different fluids, flow rates, and heating conditions. Figure 1 presents the experimental setup used in this paper. It consists of two pumps running in parallel to force the fluids through the TPMS test section and maintain the fluid circulation in the system, where the inlet and outlet temperatures are continuously measured.
A data acquisition is used to measure and record the temperature by seven T-type thermocouples evenly distributed along the test sample and located 1 mm under the sample holder, as shown in Figure 1b. A flow meter controls the constant flow rate passing through the test section. The test section is mounted on top of an aluminum block (see Figure 2a) with dimensions of 37.5 mm × 37.5 mm × 12.7 mm and heated from the bottom side with a constant heat flux equal to 38,000 W/m2. The liquid being used here, identified as a mixture of ethylene glycol and water, is entering the test section with multiple inlet velocities of 0.15 cm/s, 0.2 cm/s, and 0.25 cm/s, which correspond to a flow rate of 11.8 cm3/s, 15.7 cm3/s, and 19.6 cm3/s, respectively. The flow remains in a laminar regime with a Reynolds number of 301, 402, and 502, respectively. It is important to note that the mixture’s physical properties change as the ethylene glycol concentration increases, leading to different Reynolds numbers.
As shown in Figure 2b, the test section consists of the TPMS structure mounted on top of an aluminum plate connected to the heated aluminum block. Flow enters at a constant Tin temperature and velocity, circulates through the heated TPMS, and exits from the opposite side. The outlet temperature is also measured. As illustrated in Figure 2c,d, two types of TPMS structures made of AlSi10Mg and the second made of silver were used in the experiment. The test section is made of Teflon to suppress any heat losses to the environment. Different flow rates have been applied for the TPMS structure at a constant heat flux of 38,000 W/m2. Additional details about the experiment can be found in Saghir and Kilic’s manuscript [24]. The thermal conductivity of the aluminum is equal to 237 W/m·K, whereas the silver is equal to 429 W/m·s.

2.2. Sensitivity Analysis

All the calculations of this study are based on measuring the parameters with laboratory equipment with different accuracies and having different systematic and random errors. The Taylor series method (TSM) is used to identify the systematic uncertainty in the experimental results [25]. The experimental result is a function of J measurement variables, which Xi indicates. The combined standard uncertainty in results is given by Equation (1), where Ui denotes the combined standard uncertainties in the measured variables error. This work calculates the uncertainty analysis for the local Nu number. According to the error of each measurement instrument, the temperature uncertainty was 0.75% °C for the T-type thermocouple, as explained in Table 1. The flow rate’s uncertainty was 0.44%, obtained by the calibration process. For the local Nusselt number, if measurement quantities are considered as x, y, and z, the uncertainty of this parameter is expressed as Equation (2), where δx, δy, and δz are the uncertainty of each variable. The local Nusselt number’s uncertainty was calculated to be ±2.44%.
U r = [ i = 1 J ( r X i ) 2 U i 2 ] 1 2
δ N u x = N u x x · δ x 2 + + N u x y · δ y 2 + N u x z · δ z 2

2.3. Experimental Results for EG/Water Using Aluminum TPMS

In aluminum TPMS, the ethylene glycol mixtures and water consist of 5%vol, 10%vol, 20%vol, and 30%vol of ethylene glycol in the water solution, respectively. Table 2 presents the physical properties of the mixtures.
As shown in Table 2, as the concentration of ethylene glycol increases, the conductivity decreases, so does the heat capacity. On the other hand, the viscosity increases accordingly, thus expanding the friction inside the TPMS structure. The Prandtl number, on the other hand, increases with the concentration. It was worth mentioning that as the concentration of ethylene glycol increases, the Prandtl number increases but in a modest way. Obot et al. [7] explain that the Nusselt number will increase as the Prandtl number increases. According to Table 2, the changes in Prandtl number for different concentrations of EG is marginal; thus, the Nusselt number increase will not be substantial.
Further in this analysis, Table 3 presents the corresponding Reynolds number, and the inlet velocity used in this experiment. Two variables were used in the experiment. The first is the flow rate represented by the inlet velocity at the tube and the inlet temperature. An hour’s wait time is adopted between runs to cool the fluid to a desired inlet temperature, Tin. For all cases, the inlet temperature is in the range of 11 °C; however, it is mentioned in the harvested data for completeness.
The highest Reynolds number is less than 2000; thus, the experiment maintains a laminar regime. In addition, as the concentration of ethylene glycol increases, the Reynolds number decreases due to the increase in viscosity.

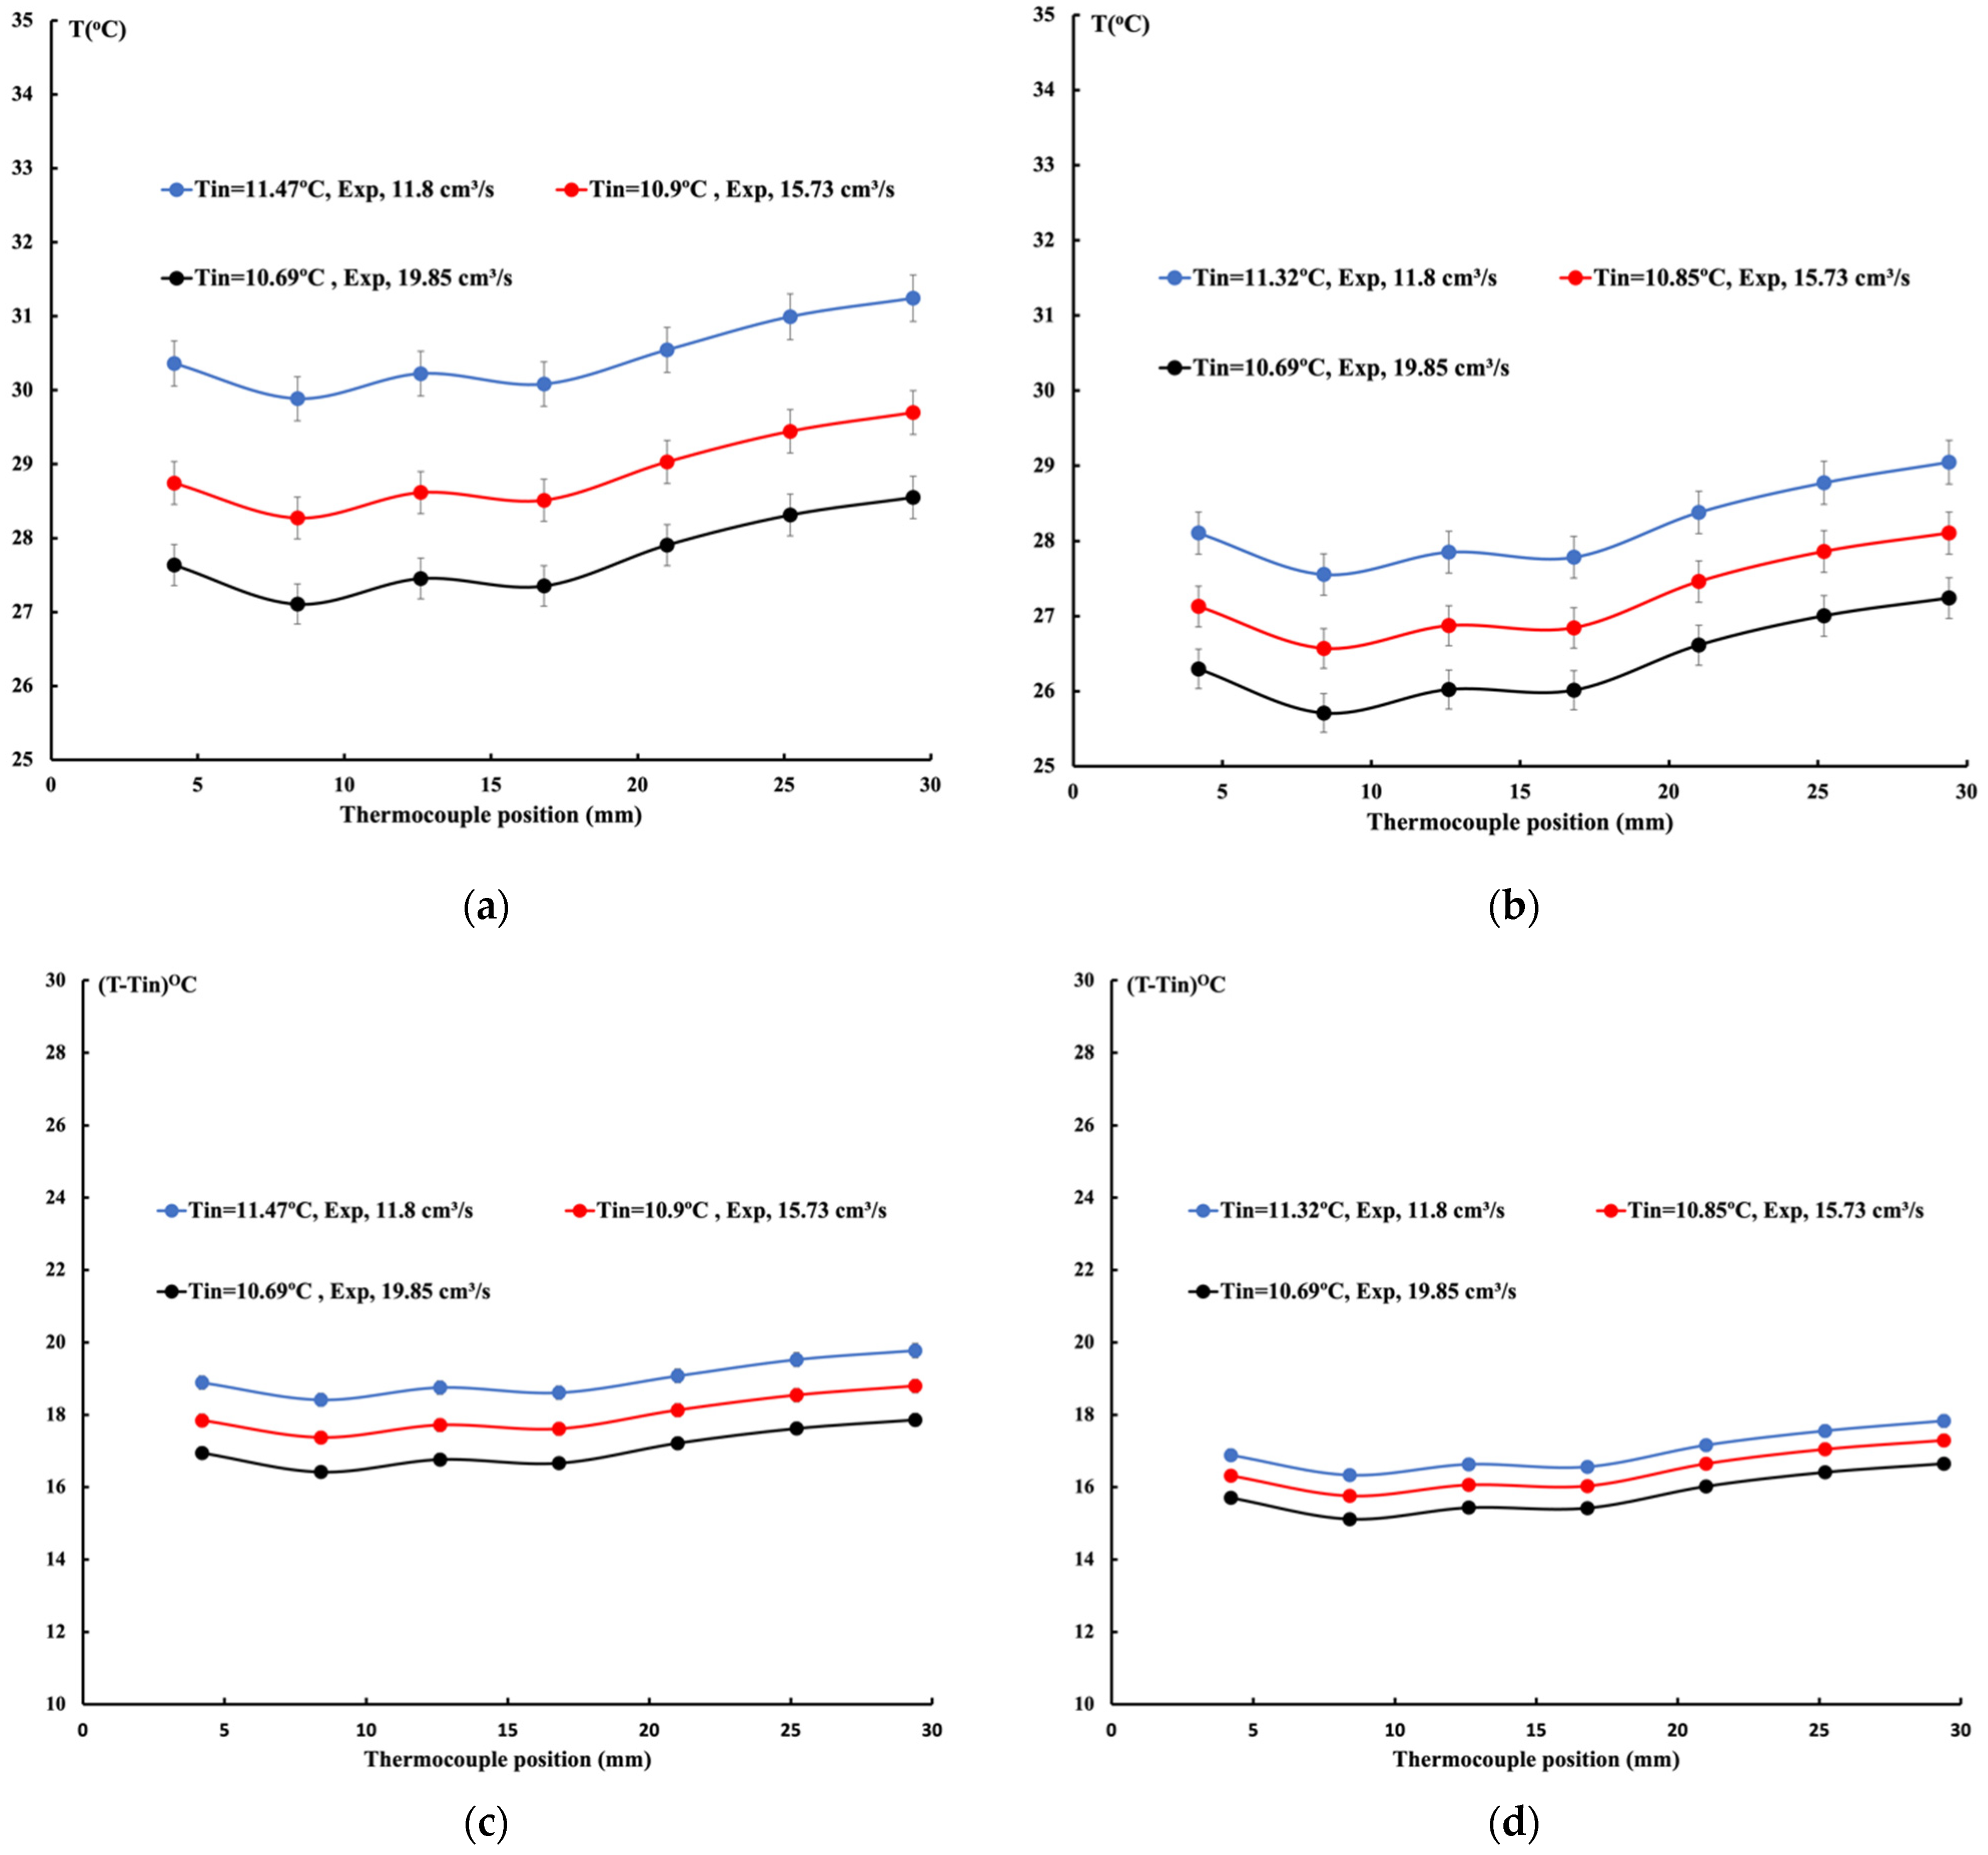
2.3.1. 10%vol Ethylene Glycol/Water Mixture

Table 3 presents the three different flow rates for the 10%EG/water mixture. In all cases studied, the flow is laminar, and the Reynolds number is less or equal to 829. The inlet temperature is between 10 °C and 11 °C. Figure 3 presents the experimental data measured for the applied flow rate with an aluminum and silver gyroid. As shown in Figure 3a, the inlet temperature varies between 11.32 °C when the flow rate is 11.8 cm3/s to 10.69 °C and when the flow rate is 19.85 cm3/s. Heat removal is noticeable as the flow rate increases, translating into a lower temperature 1 mm below the interface. What is also evident is that the change in temperature along the flow is minimal, leading to a uniform temperature distribution.
A more uniform temperature distribution is detected by removing the inlet temperature from the results, as shown in Figure 3c. The same experiment is conducted on an aluminum and silver gyroid. The aluminum and the silver gyroids have identical structures and porosity; however, the thermal conductivity of the silver is higher than that of the aluminum. Significant heat removal is observed for a similar flow rate as the temperature decreased, as shown in Figure 3b. The same behaviour is observed; by removing the inlet temperature from the plot, a uniform distribution temperature is obtained with a lower value due to the enhanced heat removal compared to aluminum, as shown in Figure 3d. The experimental data reveal a uniform temperature distribution and better heat removal in the presence of TPMS, which increases with increases in the TPMS thermal conductivity.

2.3.2. 20%vol Ethylene Glycol/Water Mixture

The investigation is repeated by increasing the concentration of ethylene glycol from 10%vol to 20%vol concentration. As the concentration increases, the thermal conductivity of the mixture decreases, accompanied by a slight increase in viscosity; this behaviour is shown in Table 2. The same procedure is used to investigate the second data set with the next ethylene glycol concentration, and the results are presented in Figure 4. Figure 4a,b presents the temperature variation along the flow direction. The temperature variation and behaviour are identical to the previous case, where the temperature value is observed to be close to the one reported in Figure 3. An important observation is that this mixture’s inlet temperature is identical to the mixture with 10% vol ethylene glycol for both aluminum and silver TPMS structures, as shown in Figure 4. Removing the inlet temperature from the obtained data makes the temperature variation smaller, as illustrated in Figure 4c,d. Thus, the eligibility is compared to Figure 4c,d with Figure 3c,d. Similar temperature variations and value levels are detected. This indicates that increasing the concentration of ethylene glycol does not improve heat removal.
In this case, the Reynolds number decreased with a maximum value of 502. This is due to the increase in the viscosity and a slight increase in the density; with a mixture of 20% EG, the density increases by around 1%, and the viscosity increases by 40%. The thermal conductivity decreased by 6%. Thus, one expects a more significant pressure drop due to the high friction.

2.3.3. 30%vol Ethylene Glycol/Water Mixture

The concentration of ethylene glycol is increased further to 30%vol of EG, and the experiment is performed for two flow rates with aluminum and silver gyroids. The low flow rate occurs because increasing ethylene glycol concentration does not enhance heat but increases the mixture’s viscosity. The maximum Reynolds number, in this case, is equal to 290. Based on Table 2, the density, when compared between a 10%vol ethylene glycol mixture and a 30%vol EG mixture, is increased by 2%, the viscosity is 58%, and the conductivity drops by 13%. Figure 5 presents the experimental data measured for a flow rate of 1.96 cm3/s and 15.73 cm3/s in the presence of an aluminum gyroid and a flow rate of 15.73 cm3/s in the presence of the silver gyroids.
Table 4 presents the measured temperature for a flow rate of 15.73 cm3/s for the three mixtures under investigation using an aluminum gyroid structure.
Based on the previous discussion and the experimental data obtained for different concentrations and flow rates, the heat transfer shows slight improvement with increased ethylene glycol concentration. The changes between the three sets of data are mainly from measurement errors. Thus, one may conclude that the temperature’s uniformity is due to the gyroids’ presence. On the other hand, the increase in ethylene glycol mixture did not significantly improve the heat removal. Figure 6 illustrates the variation of the Nusselt number with the Prandtl number for a flow rate equal to 15.73 cm3/s. As predicted and explained by Obot, the experimental results show an increase in the Nusselt number with the Prandtl number. However, this increase is low because the variation of the Prandtl number for all mixtures is minimal.

3. Finite Element Study

The numerical modeling was conducted using COMSOL software, Version 6.0. COMSOL uses the finite element method to solve the Navier–Stokes equations, where the main boundary conditions are that the fluid is considered to have incompressible laminar flow based on the flow rates used and the Newtonian steady-state condition governed by the segregated solver.
Saghir and Kilic [24] studied heat enhancement using a water/aluminum oxide nanoparticles nanofluid mixture system. In this manuscript, we replaced the liquid nanofluid with a mixture of ethylene glycol and water with concentrations of ethylene glycol including, 5%vol, 10%vol, 20%vol, and 30%vol.
The full Navier–Stokes equations combined with the continuity and energy equations were solved numerically. The TPMS is modelled as a solid structure in the flow domain. The model is solved again upon achieving convergence using the flow field results as an initial condition. This approach allowed fast and accurate convergence. The convergence criteria are set when the residue containing variables such as the three velocities, the pressure, and the temperature are below 10−6. In addition, the refined mesh can help solve this problem accurately but at the expense of the processing time.
The formulation used in the current analysis is the three-dimensional Navier–Stokes equation, energy, and continuity equation. In addition, the heat conduction equation is used to investigate the heat in the aluminum solid block. For more details on the differential equation, the reader is invited to consult the paper by Saghir and Kilic [24].

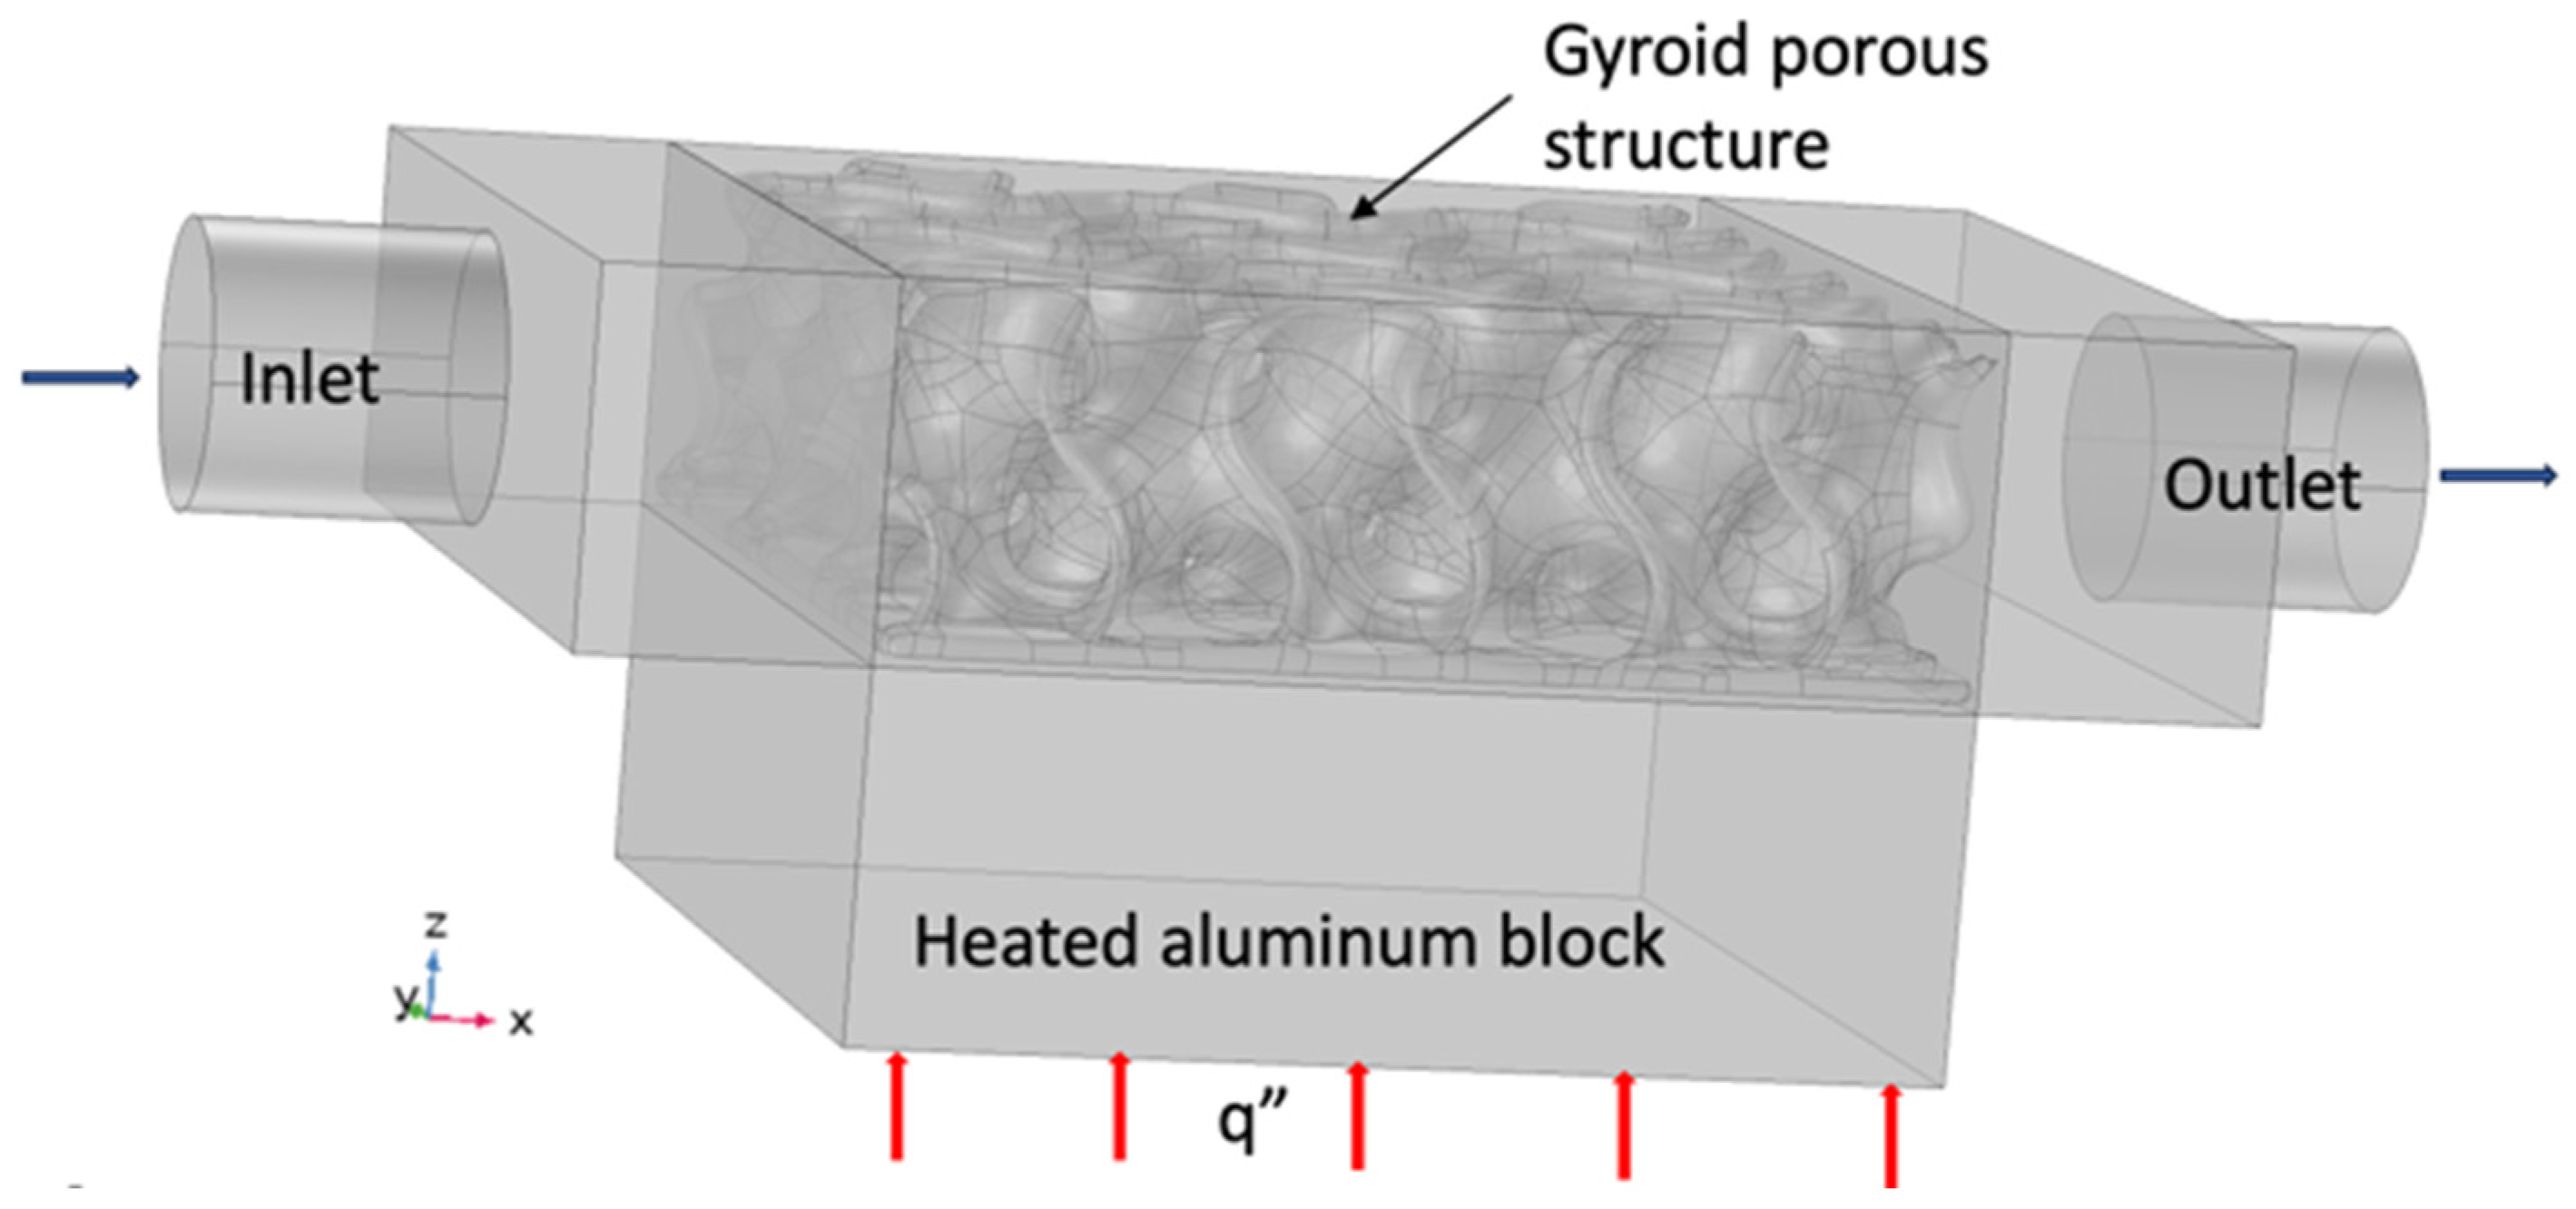
Boundary Conditions of the System

Figure 7 shows the boundary condition used in the model. It is worth mentioning that the heated block has a square base of 37.5 mm and a height of 12.7 mm. Similarly, the block containing the TPMS structure has the same dimensions. The inlet and the outlet cylinder have a diameter of 10 mm. A constant heat flux of 38,000 W/m2 is applied from the bottom side to the test sample, as shown by the red arrows. At the inlet fluid temperature, denoted as Tin, the inlet velocity is uin, and at the outlet temperature is Tout. All the model boundaries except where the heat flux is applied are insulated and assume adiabatic walls. Thus, the boundary condition in equation form is as follows:
(i)
The velocity u = uin in the x direction is applied at the inlet.
(ii)
At the inlet, the temperature of the fluid enters the test section at T = Tin.
(iii)
At the outlet, an open boundary is applied where the stresses are equal to zero.
(iv)
The bottom surface of the aluminum block is heated with a heat flux q″, as shown in red.
(v)
All external surfaces are assumed adiabatic, T S u r f a c e n = 0 , and for the flow, no-slip boundary conditions are applied.
Multiple parameters were evaluated to assess the importance of this structure in heat removal. The first important parameter to evaluate is the heat convection coefficient, calculated as follows:
h = q ( T T i n )
where the ratio of the applied flux is divided by the temperature difference between the calculated one and the inlet temperature. The calculated one is measured 1 mm below the interface in the solid aluminum block. The local Nusselt number is thus defined as:
N u = h D H k f
Pressure drop plays a crucial role in the design of a cooling system. This is represented by the friction factor, which is defined as:
f = 0.5 p D H ρ L u i n 2
It is interesting to combine the thermal and the hydraulic effects by evaluating the performance evaluation criteria defined as:
P E C = l o c a l N u f 1 3
These non-dimensional parameters are assessed during the analysis. A mesh sensitivity analysis has been conducted to ensure the model’s accuracy. A normal mesh level consists of 1,338,201 elements, composed of tetrahedral and boundary elements. The convergence criteria are used when all variables, such as the three temperatures, the pressure, and the temperature results between two consecutive iterations are less than 10−6.
Figure 8 illustrates the flow circulation inside the TPMS structure from the inlet to the outlet. As can be seen, flow penetrates in every void available leading to a cooling of the aluminum block. The structure of the TPMS behaves like a fin to improve the cooling of the block.

4. Comparison Between Experimental Data and Numerical Model

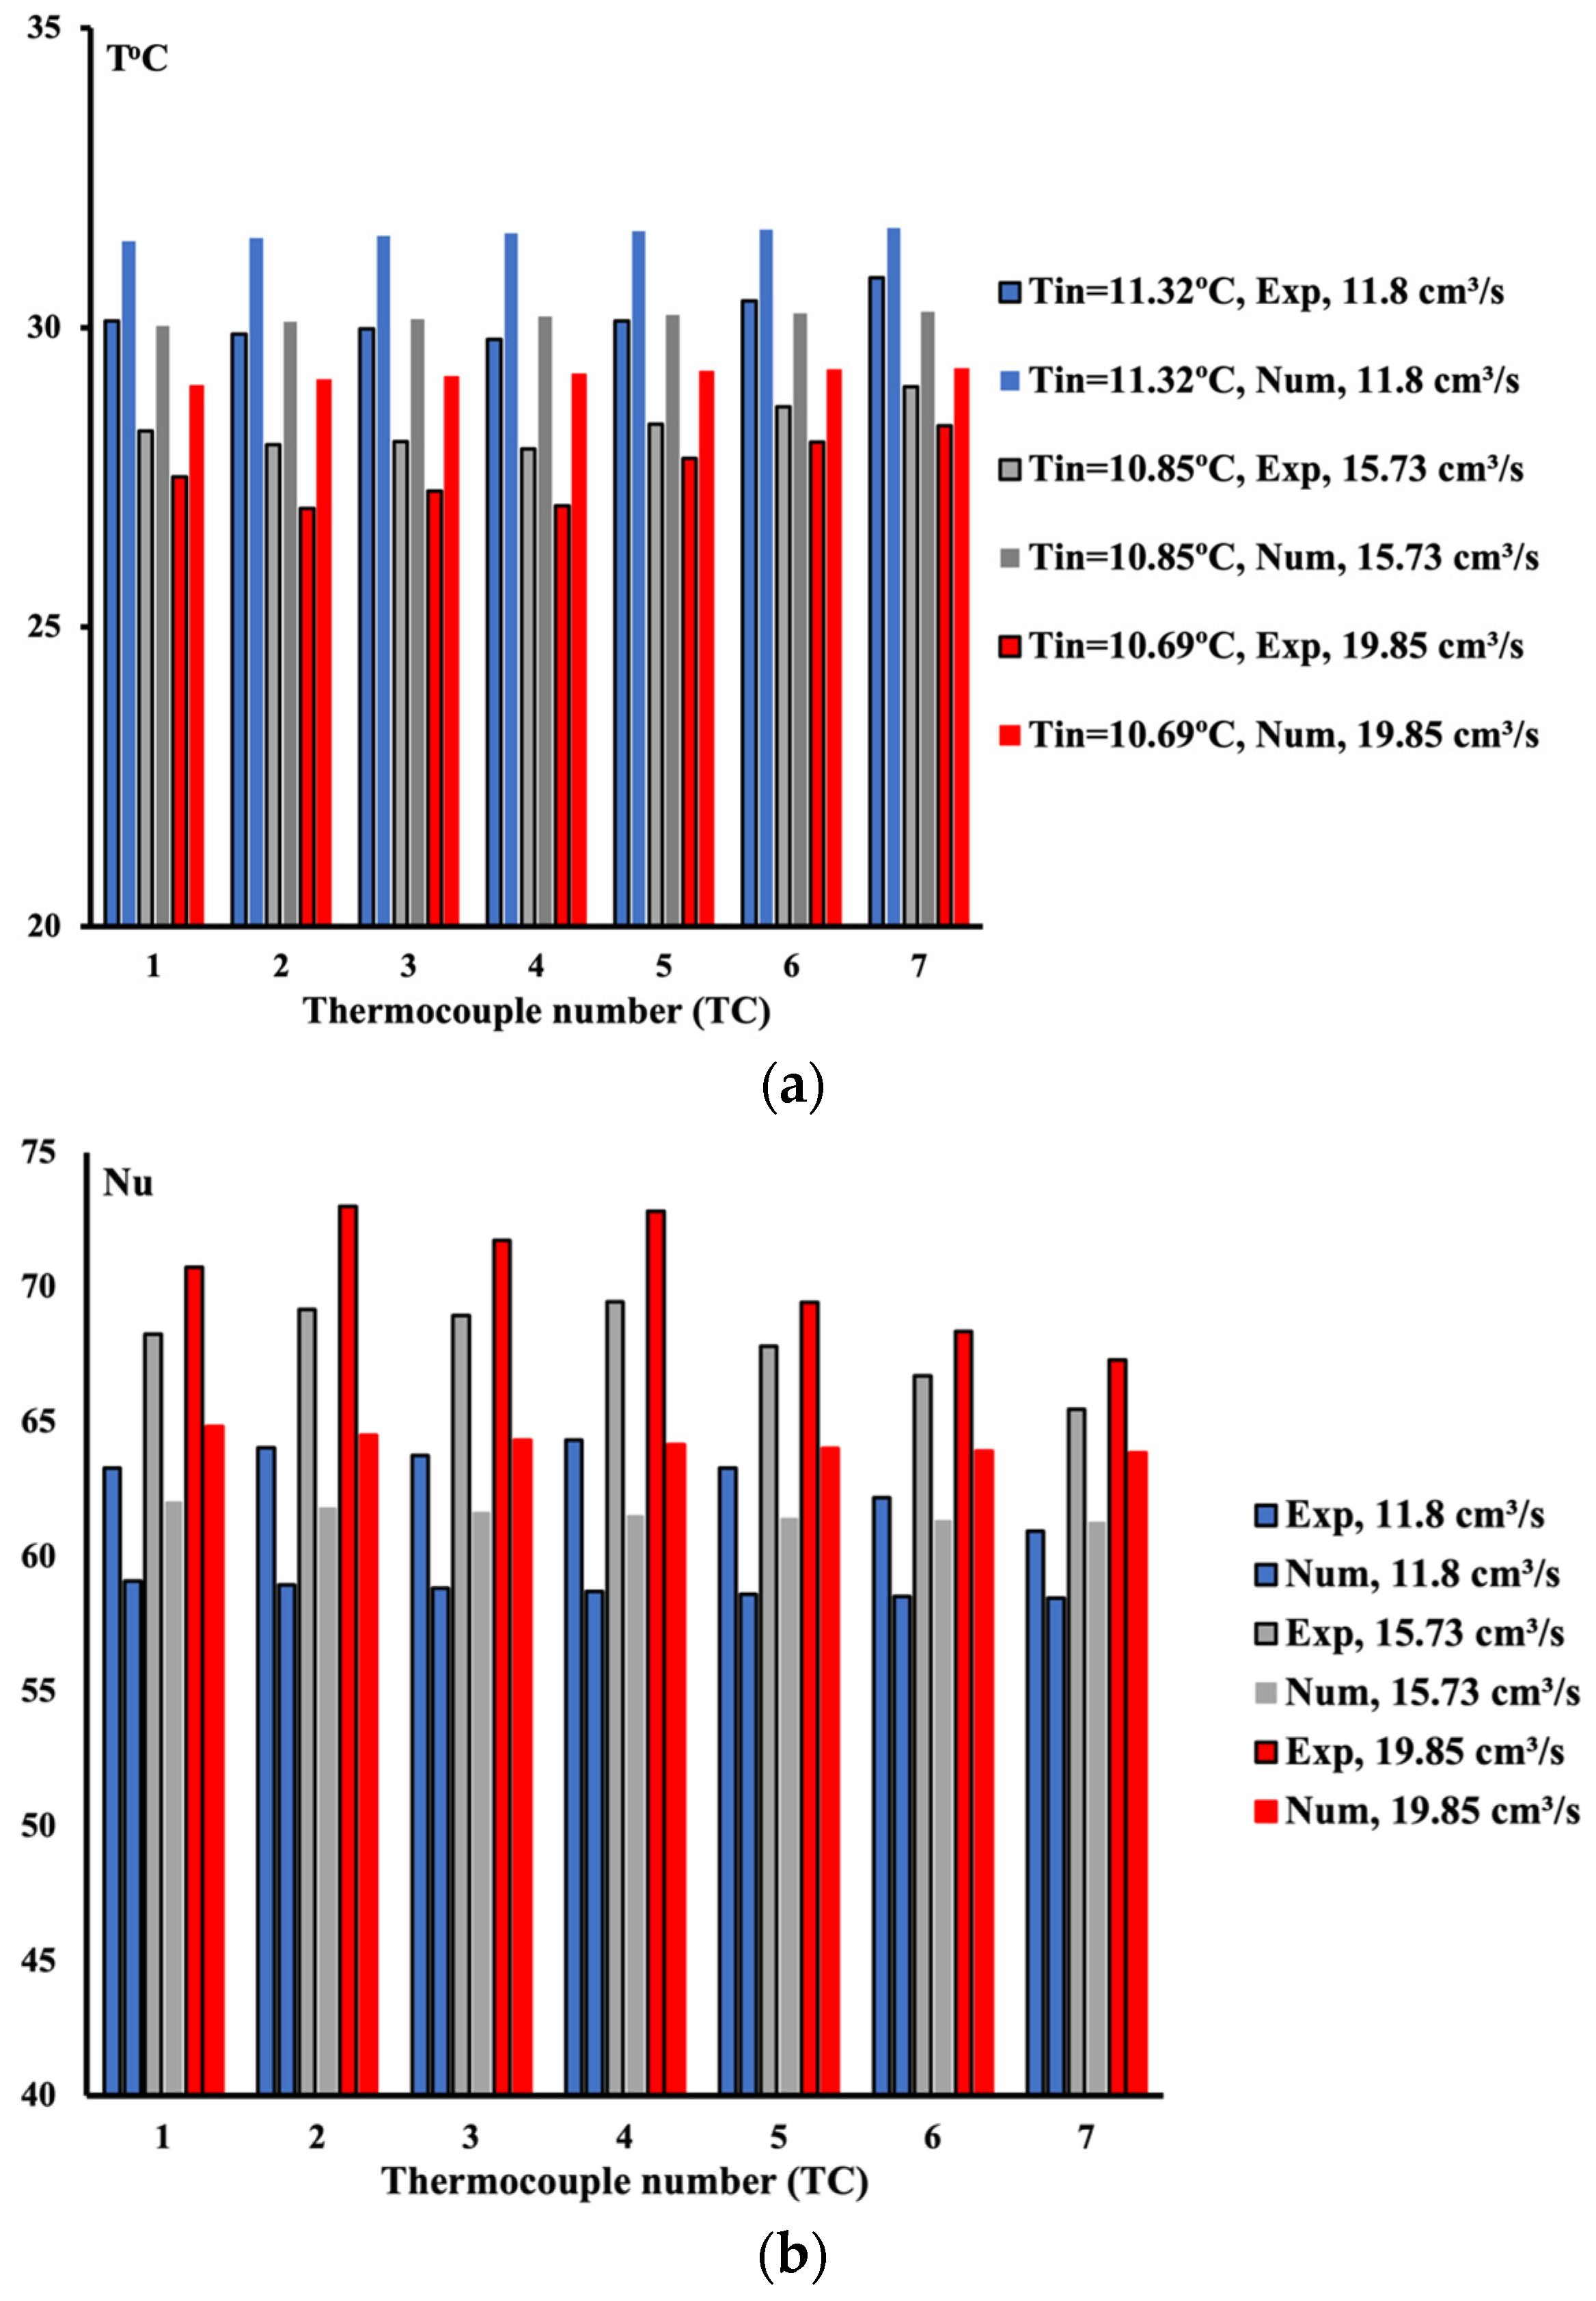
4.1. 10%vol Ethylene Glycol/Water Mixture

Three different mixtures were used to investigate this mixture’s performance in heat removal. These mixtures include 10%vol ethylene glycol/water, 20%vol ethylene glycol/water, and 30%vol ethylene glycol/water. As observed from the physical properties of these mixtures presented in Table 2, as the concentration of ethylene glycol increases, the viscosity increases, respectively. The thermal conductivity reduces in magnitude, accompanied by an increase in the density.
With the 10%vol ethylene glycol/water mixture, Figure 9a presents the temperature variation along the flow at each thermocouple location at different flow rates. In this case, aluminum is used to fabricate this TPMS structure. One may notice a uniform temperature distribution in the presence of the gyroid. Thus, a TPMS structure secures uniform heat distribution and removal. The comparison between experimental data and numerical results indicates a good agreement between the two data sets. As the flow rate increases, the temperature decreases. For all numerical cases in this figure, the temperature is shown to be slightly higher than the experimental results. This observation indicates that heat losses in the experiment are the main reason for this difference. Table 5 presents the measured computed data for the cases presented in Figure 9a to demonstrate the accuracy of the results obtained numerically and experimentally. It is essential to indicate that the maximum difference between the data is around 8%. This shows that the numerical and the experimental data are in good agreement. Furthermore, from Table 2, one can check the uniformity of the temperature distribution at different thermocouple locations along the flow.
Figure 9b shows the Nusselt number distribution for all cases. The local Nusselt number is evaluated using Equations (3) and (4). As shown amongst all instances, the data with a high flow rate exhibit a high Nusselt number.
Under the same conditions, the previous experiment and numerical model are repeated by replacing the aluminum TPMS structure with a silver structure, as shown in Figure 2b. Figure 10a presents the temperature variation at different thermocouple locations. The numerical model is identical to the previous one, but the thermal properties of the aluminum are replaced with those of silver. The comparison between experimental and numerical data indicates a more extensive difference when compared to the aluminum structure. Two main reasons for this can be deduced from this data set. The first is that more significant heat loss may occur while running the experiment; the second is that in the numerical modelling, the silver thermal properties are not similar to those of the current silver metal.
Nevertheless, as shown in Table 6, a variation of around 10% to 13% between the experimental and the numerical model is calculated. However, it is strongly believed that this difference is within the acceptable limit. Uniformity of the temperature distribution is present, and by comparing Table 5 and Table 6, one can find that silver assists better in heat removal due to higher thermal conductivity.
Figure 10b shows the local Nusselt number variation as a function of the thermocouple location. The result reveals that the silver TPMS structure is more suitable than the aluminum structure due to the higher Nusselt number.

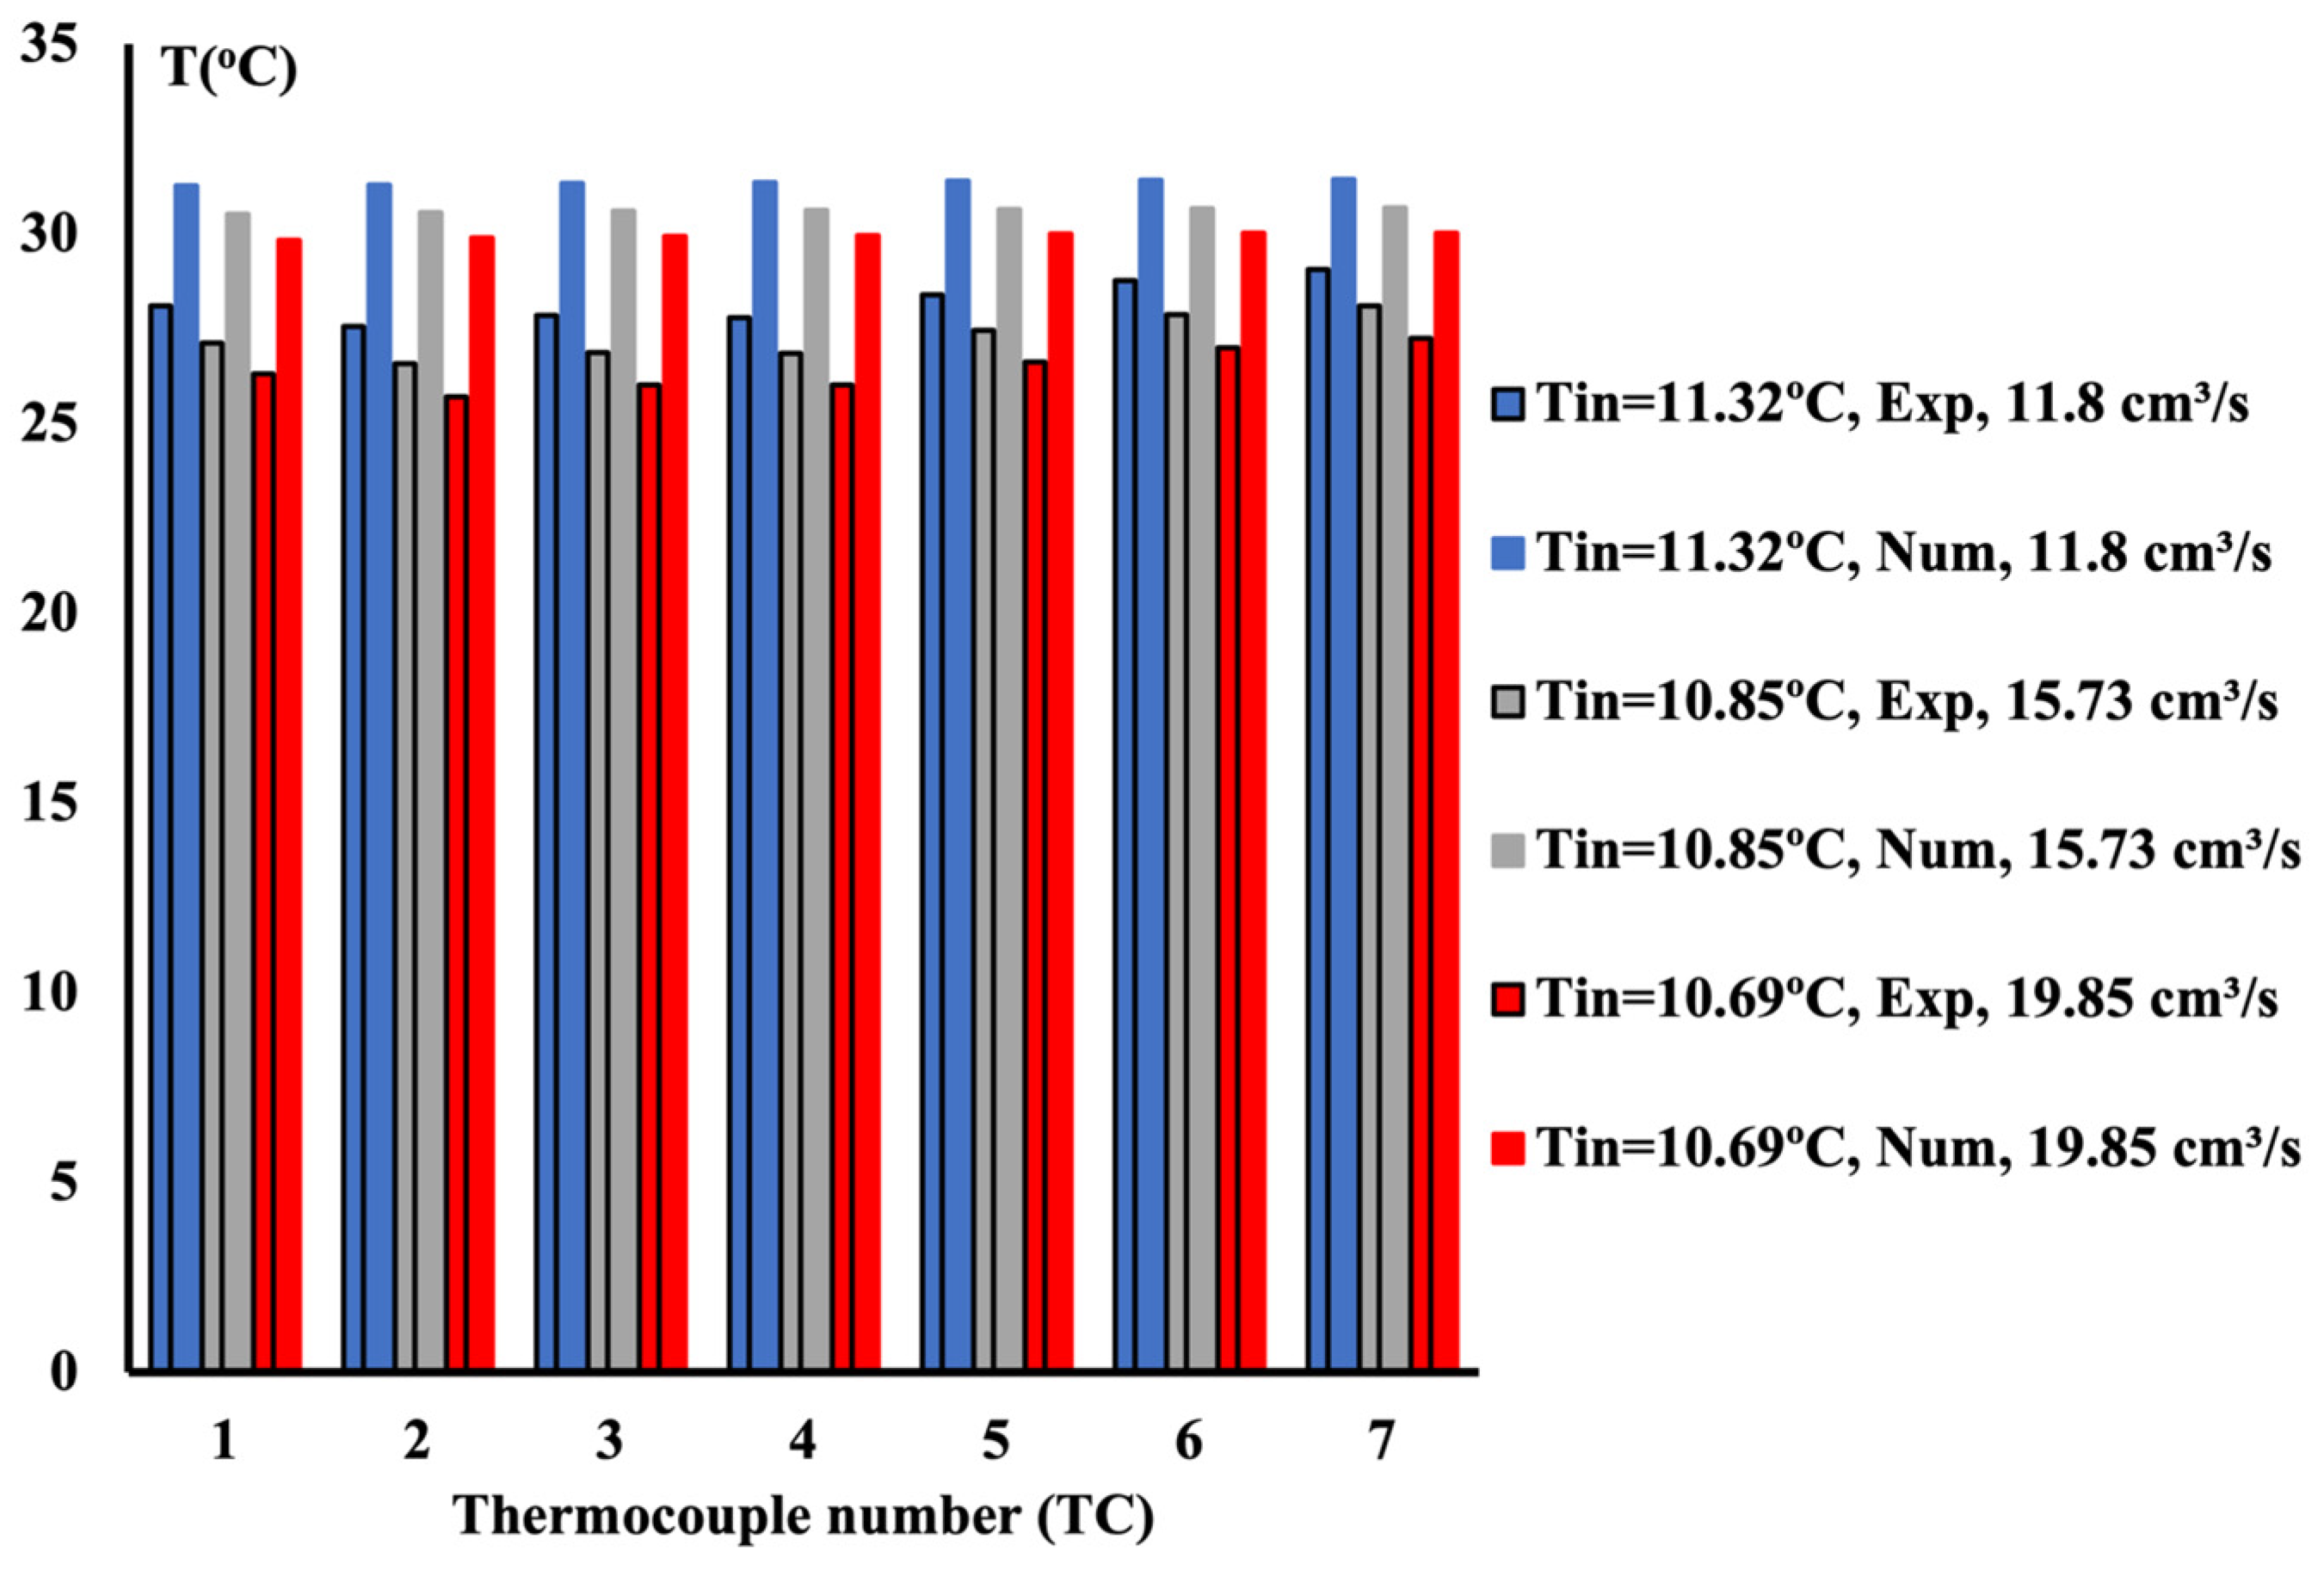
4.2. 20%vol Ethylene Glycol/Water Mixture

The experimental measurements are conducted on the mixture of 20% vol EG/water for different flow rates and inlet conditions for the two types of TPMS material. Using numerical modeling, Figure 11 compares the temperature measured at seven locations with the numerical results using an aluminum TPMS structure. As the concentration of the ethylene glycol increases, the viscosity increases, and the conductivity decreases. Figure 11 shows a good comparison between the experimental and numerical results for different flow rates.
If one compares Figure 11 with Figure 9a, one may notice no change in heat removal as the concentration of ethylene glycol increases.
A comparison between Table 5 and Table 7 clearly shows no improvement in temperature drop as expected. The numerical modeling shows strong agreement with the experimental data, with a slight difference of nearly 12% between the two results. The main reasons for this include the low conductivity of the ethylene glycol compared to water and its higher density. A drop in heat capacity is also observed, as highlighted in the mixture of fluid properties.
The experiment is repeated using silver TPMS under otherwise identical conditions. Figure 12 presents the temperature variation along the flow in the aluminum block. Table 8 presents the numerical data shown in Figure 12. The uniformity of temperature along the flow is independent of the concentration of the ethylene glycol.
A comparison of the data presented in the following section compares data from Table 6 and Table 8, revealing a slight, insignificant variation unrelated to an improvement in heat removal. However, one may notice a change if all the mixtures’ performance evaluation criteria (PEC) are estimated. Since the numerical results showed a good agreement with the experimental data, the PEC is evaluated based on numerical modelling. For the friction coefficient to be estimated, one needs to measure the pressure drop. Since this measurement is not done experimentally but could be estimated numerically, the numerical PEC is displayed in Figure 13 and Figure 14 for all mixtures.
Figure 13 shows the variation of PEC for all cases and all flow rates. As shown, as the flow rate increases, the performance evaluation criteria increase no matter what mixture is used. In addition, as the concentration of ethylene glycol decreases, the performance evaluation increases accordingly. This is due to the change in the friction factor, which decreases when the viscosity decreases. By changing the aluminum TPMS to a silver TPMS, because the heat enhancement is more pronounced than the aluminum case, the performance evaluation criteria, as shown in Figure 14, is more significant in the presence of silver TPMS. Nevertheless, regardless of the material, the best mixture is one where the ethylene glycol concentration is the lowest.

5. Conclusions

Cooling equipment on small surfaces has many applications in industries. Water is usually the liquid used in the cooling process due to its low cost, good thermal conductivity, and viscosity. A porous structure designed using triply periodic minimal surfaces (TPMS) has proven to be a good approach toward better, uniform cooling. Additionally, the availability of 3D printing TPMS structures is becoming an excellent approach, and its applications are diverse. In the present work, the water is replaced by a mixture of ethylene glycol and water. The main reason for this mixture is to withstand a low-temperature environment while remaining in the liquid phase. Many systems operating at low temperatures, up to minus 20 degrees Celsius, require cooling in harsh environments. Three different mixtures have been used experimentally and computed numerically. As the concentration of ethylene glycol increases, the viscosity and the density increase, and a decrease in heat capacity and thermal conductivity is reported. Our results revealed the following:
  • The presence of triply periodic minimal surfaces maintains a uniform cooling mechanism regardless of the fluid mixture used;
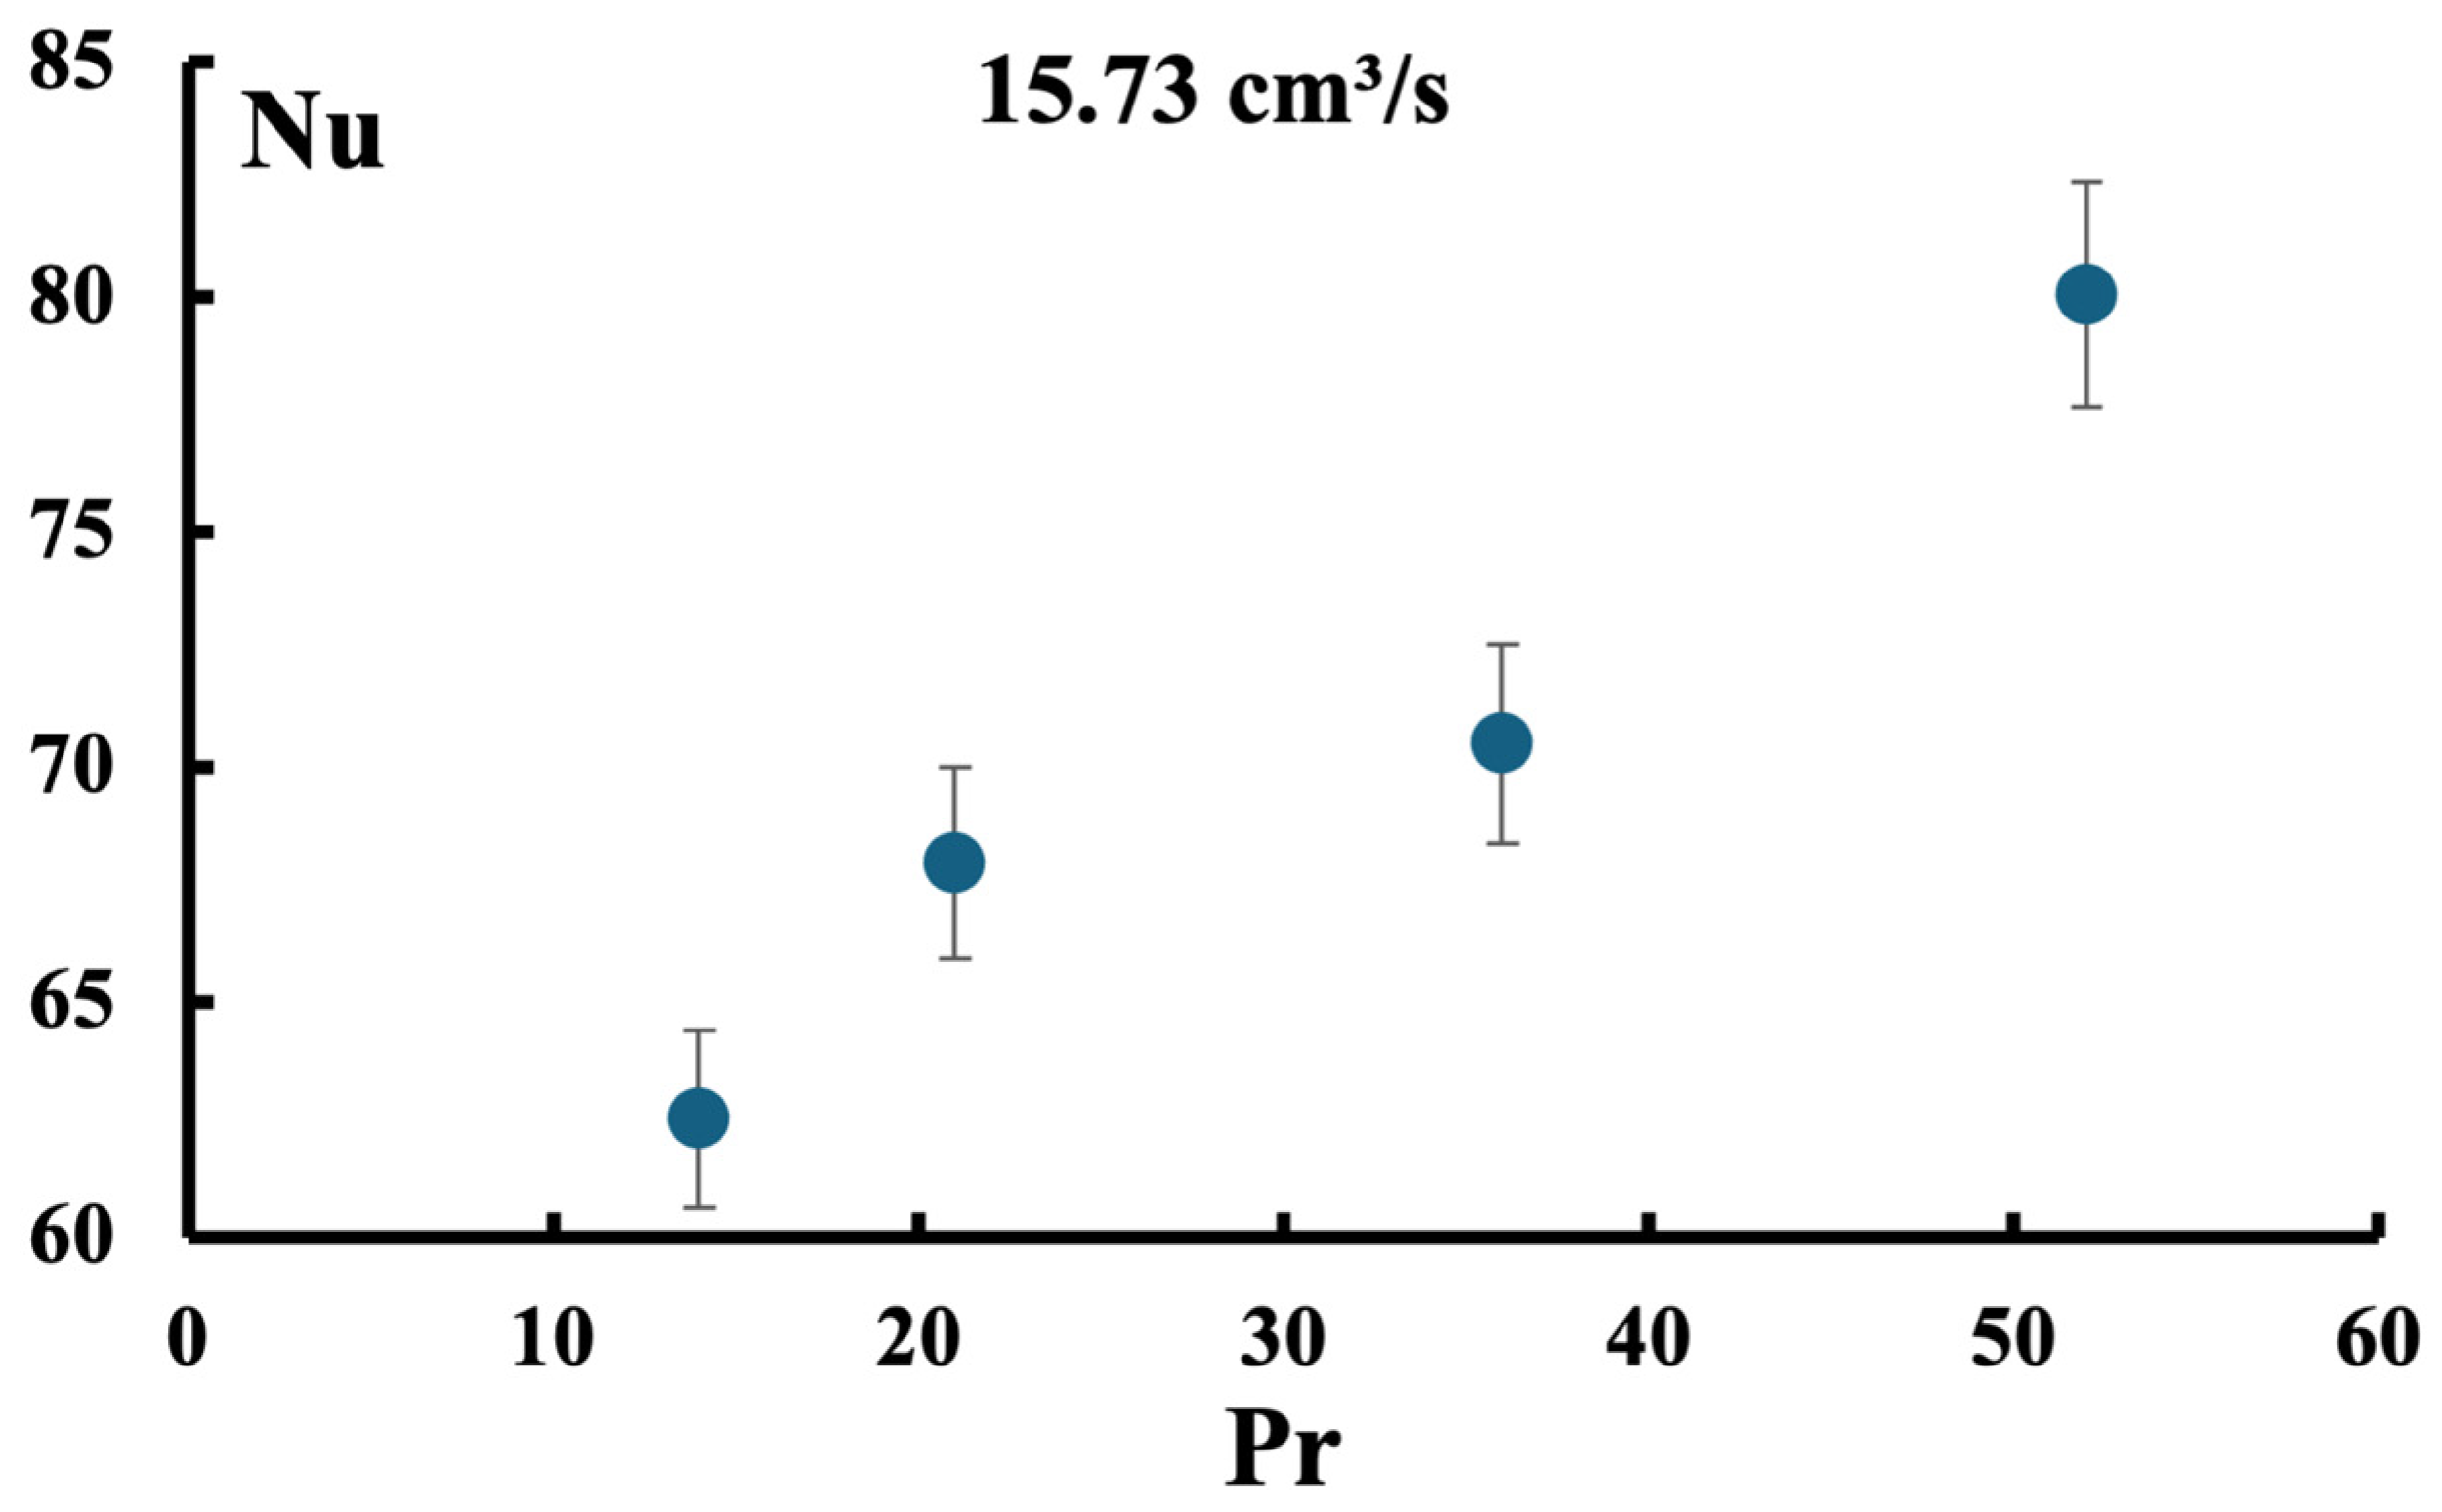
  • The heat enhancement presented by the Nusselt number is nearly identical regardless of the mixture tested experimental and verified numerically;
  • Due to the viscous effect, the higher the ethylene glycol concentration can secure a more significant pressure drop, thus a higher friction coefficient;
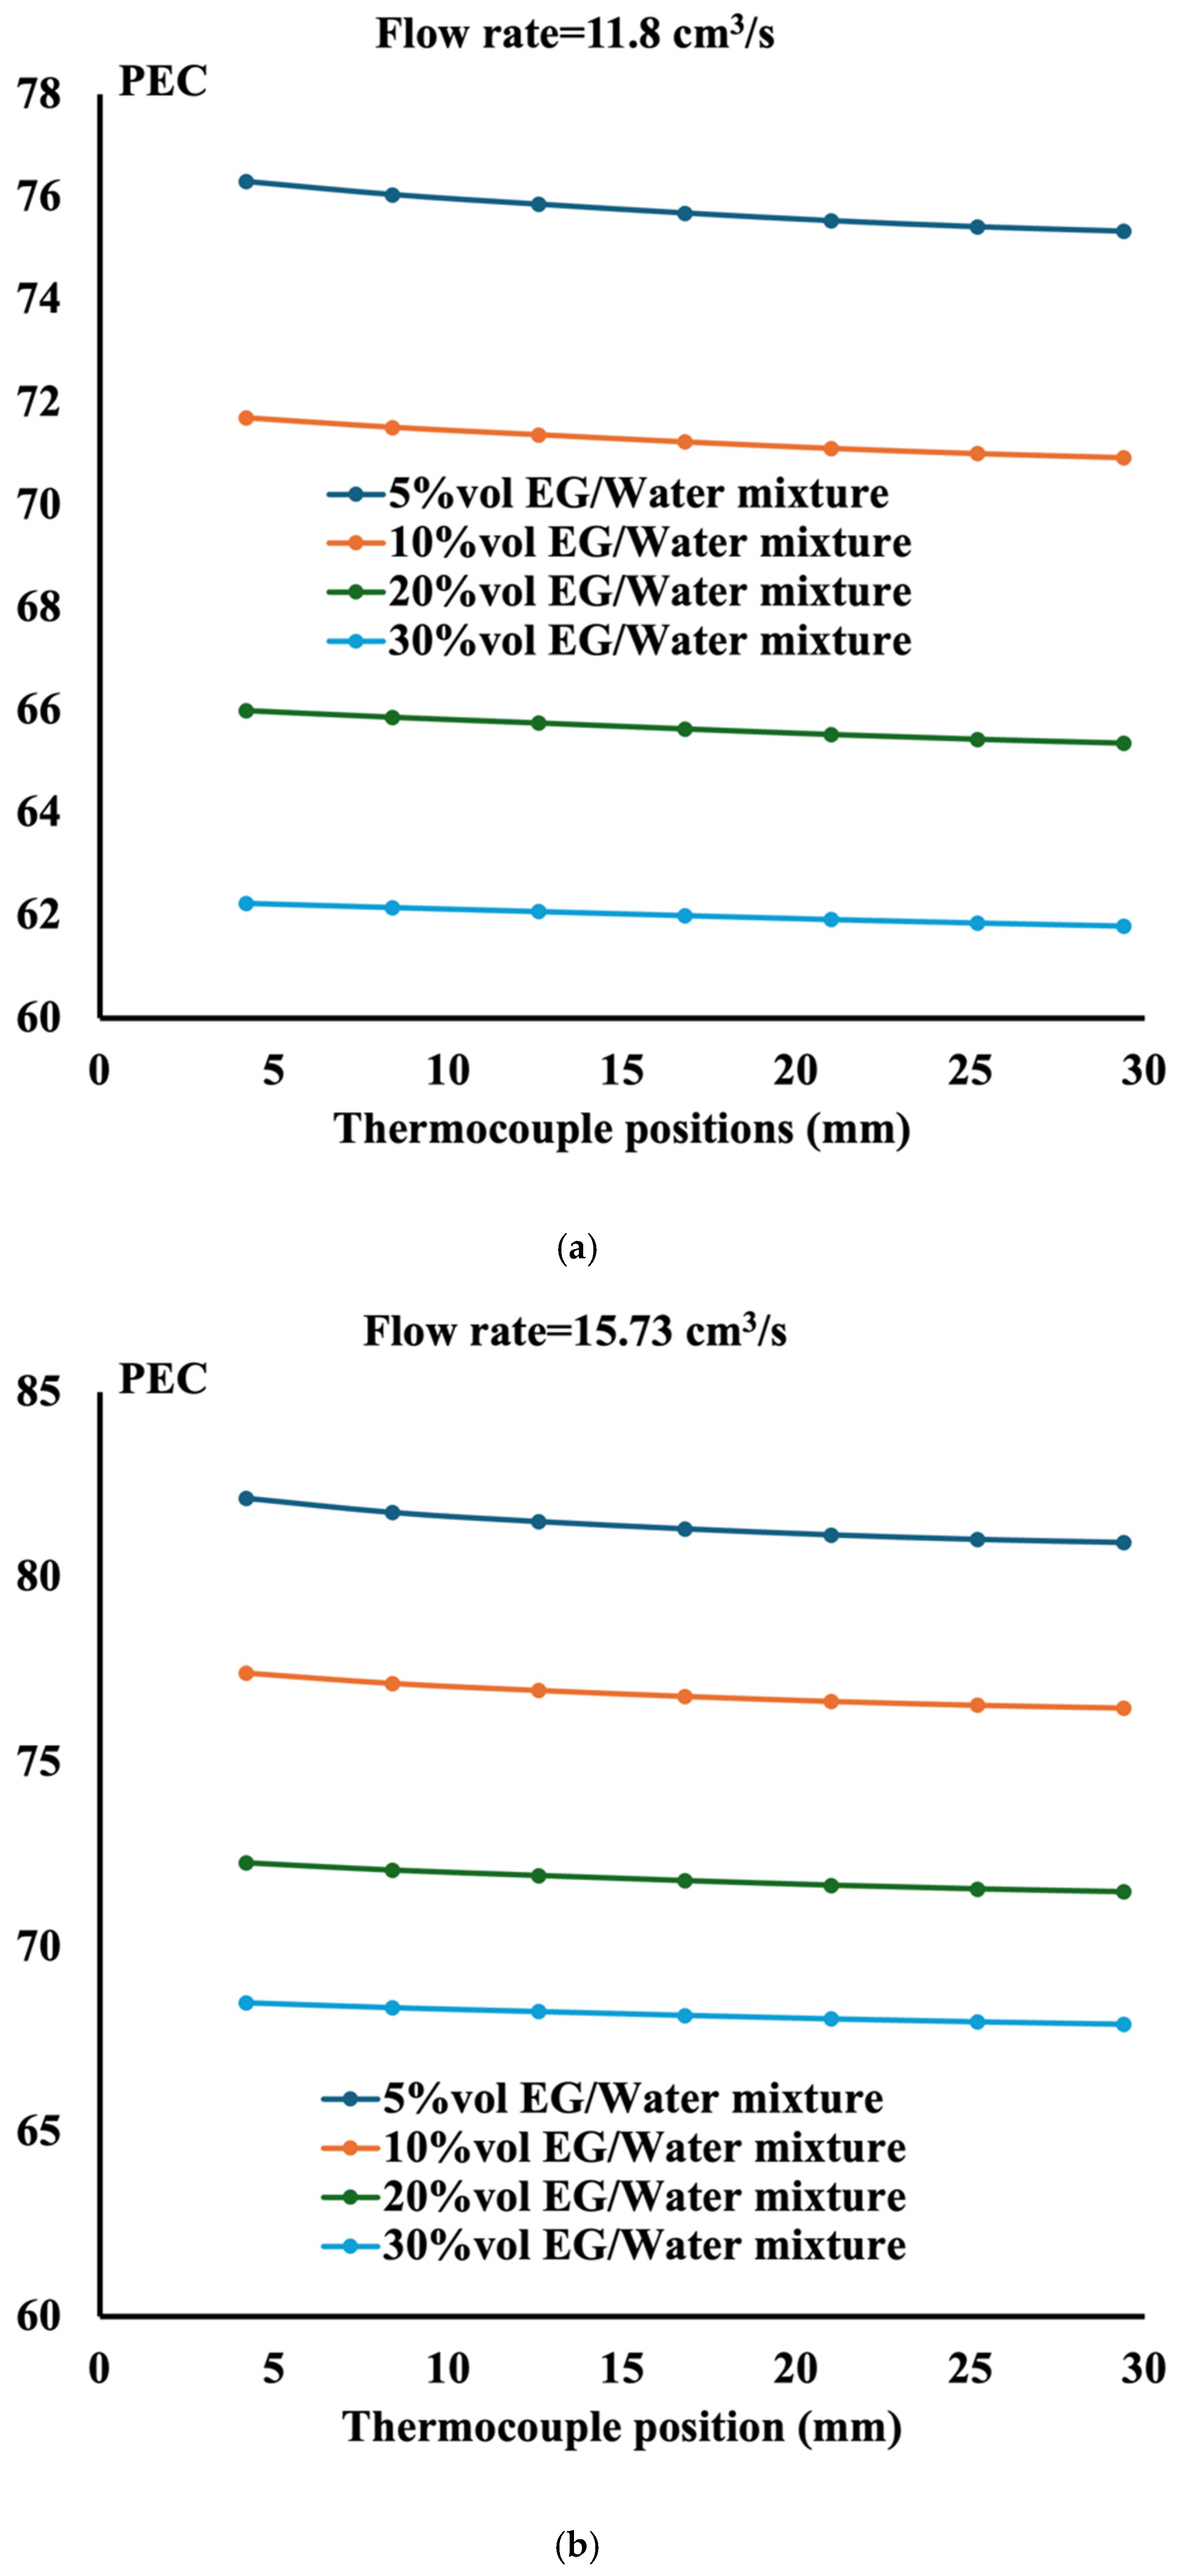
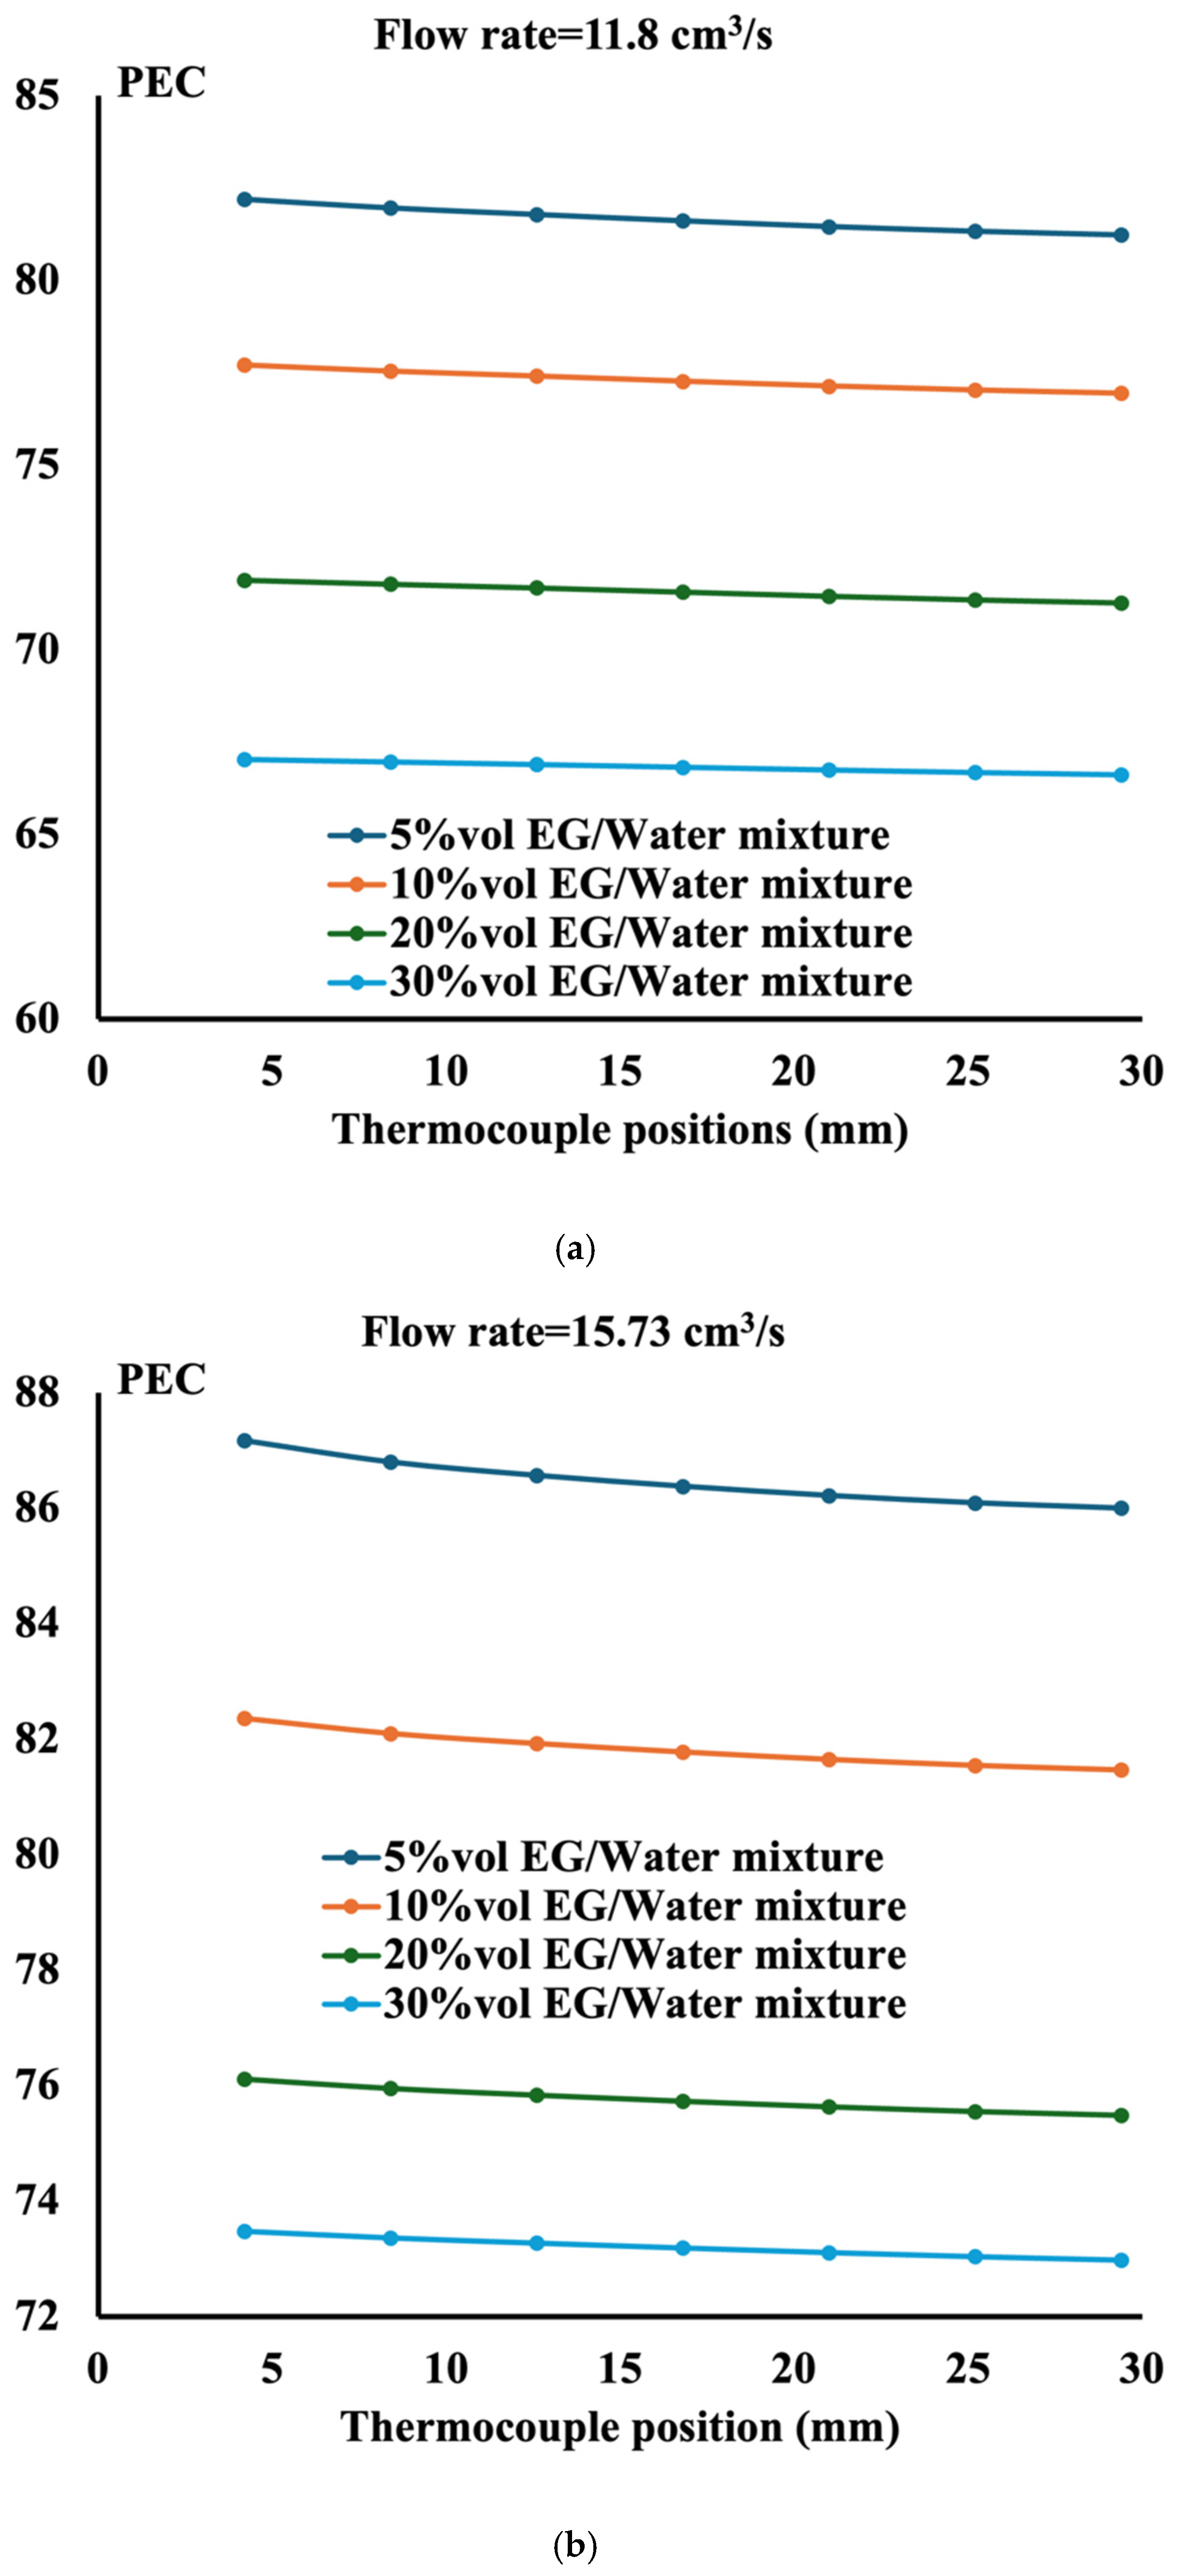
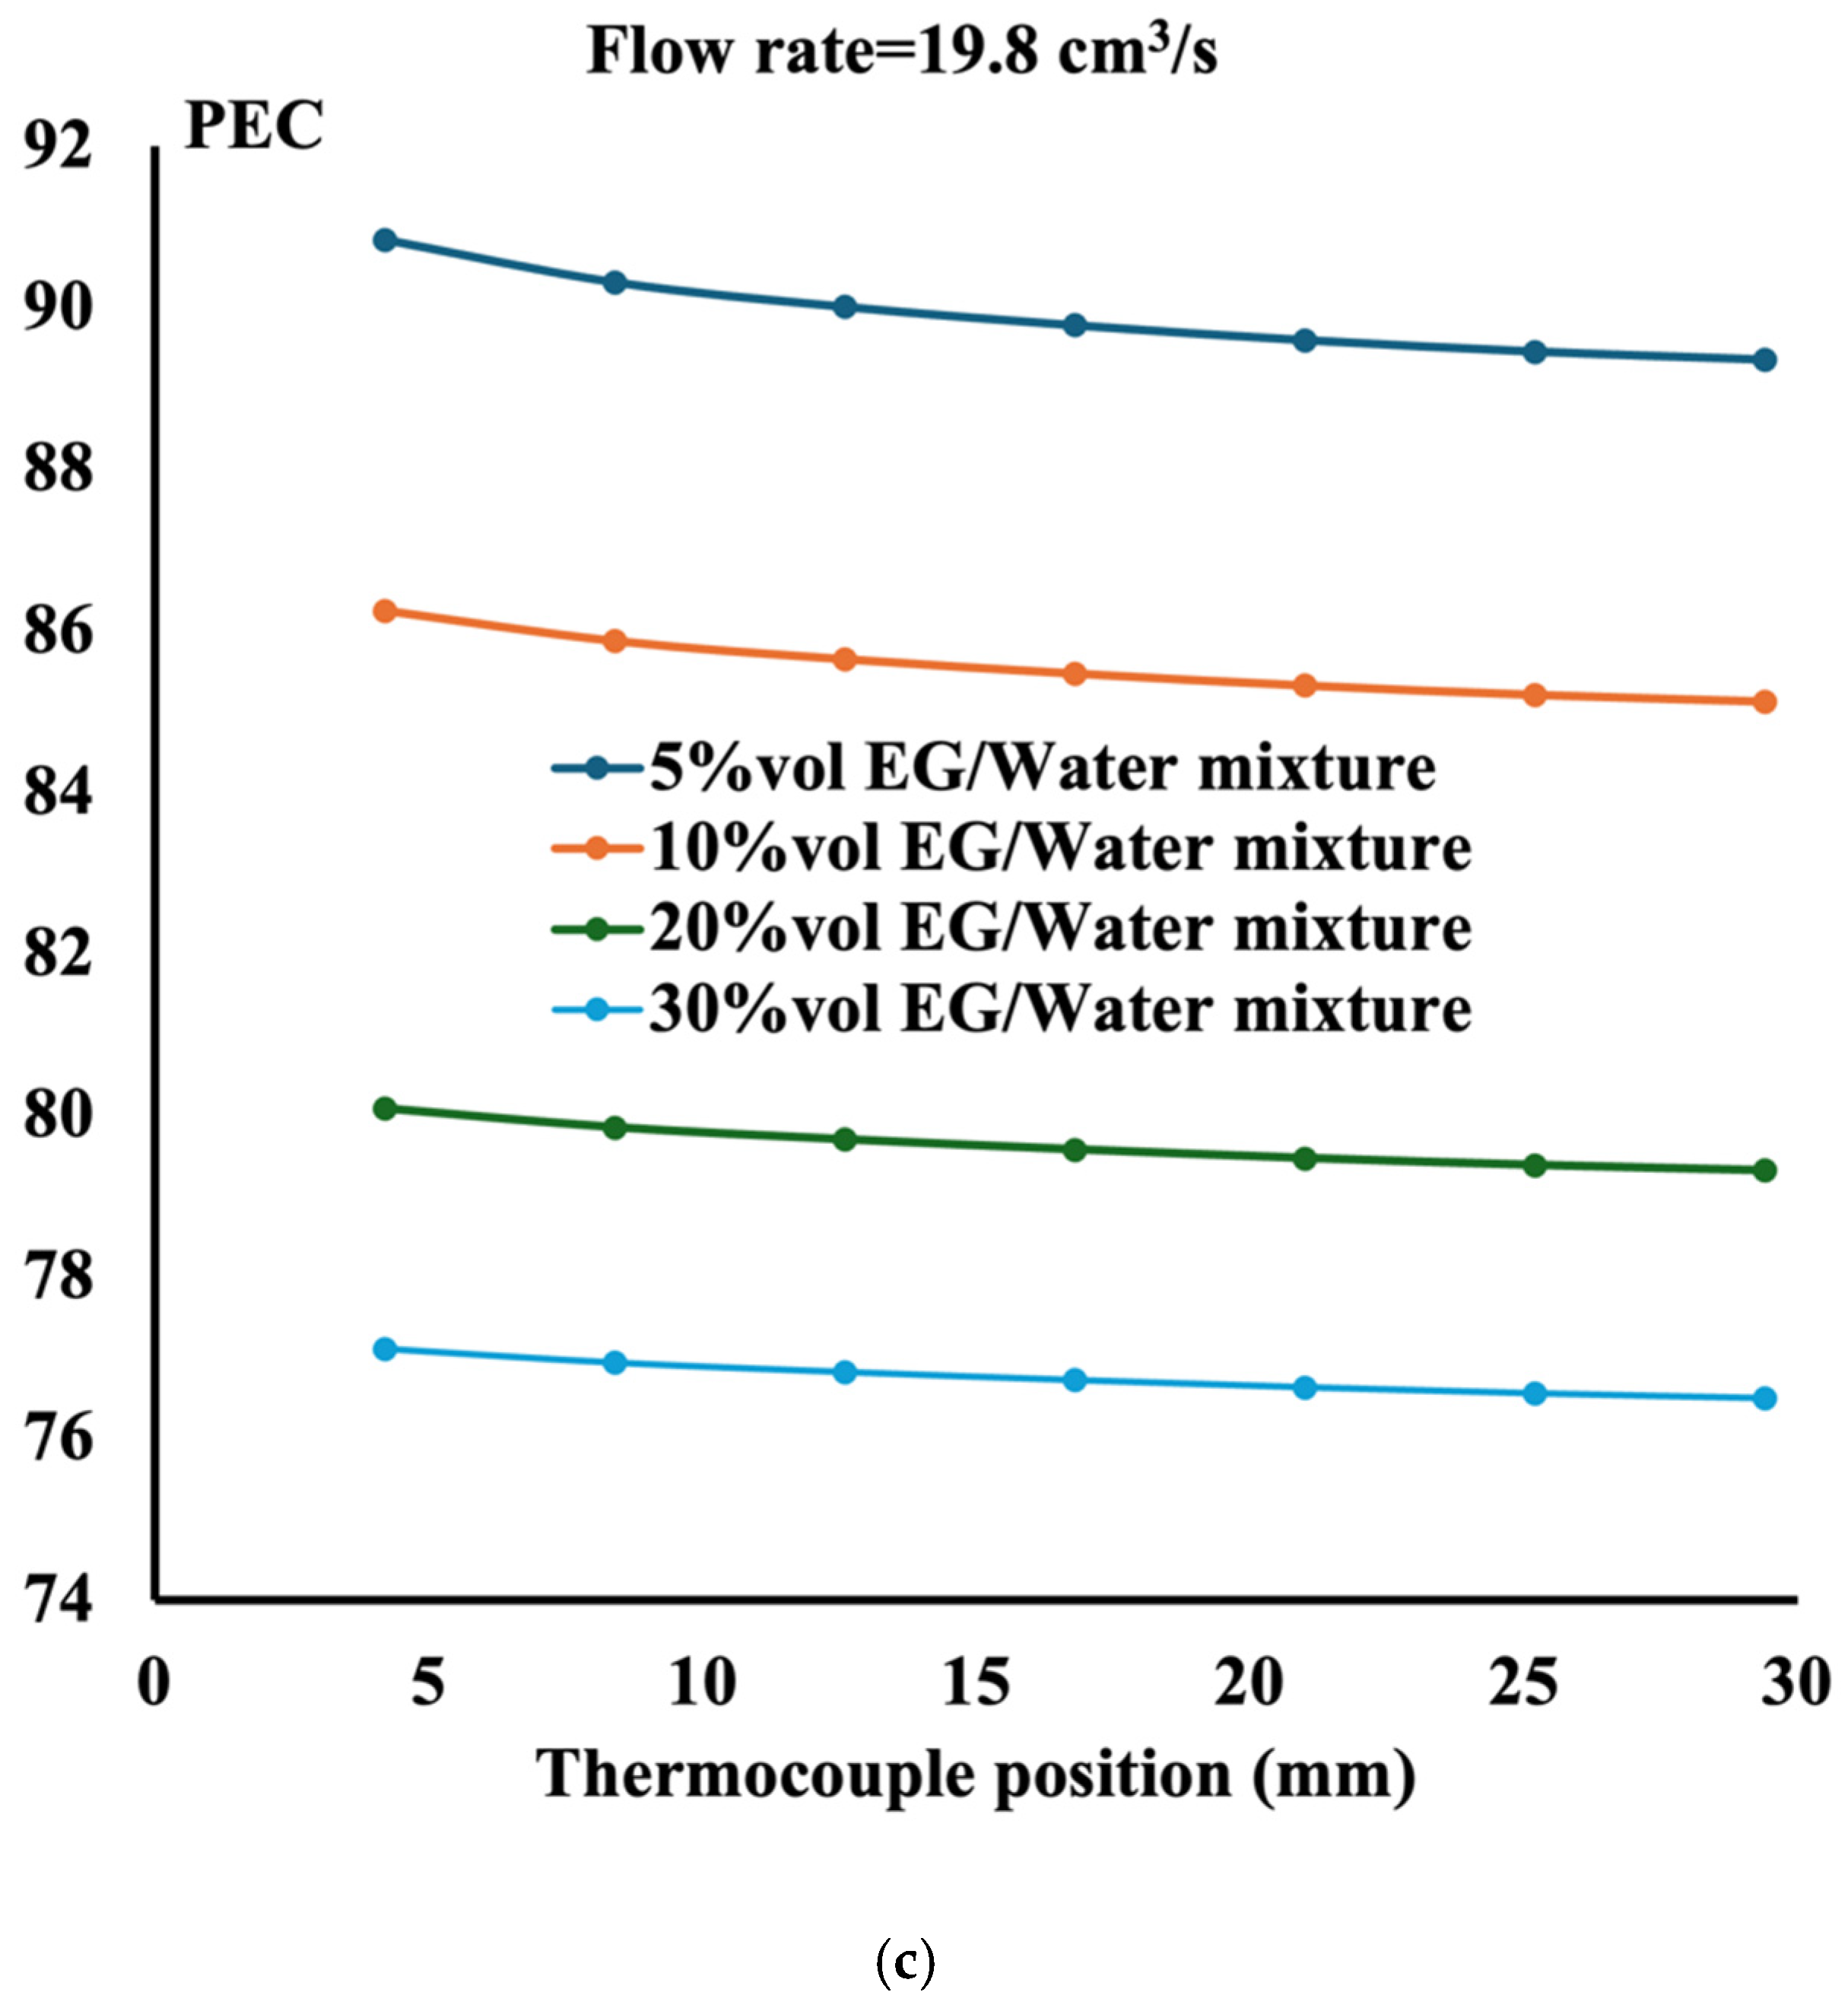
  • The performance evaluation criteria show that the highest magnitude is obtained at the highest flow rate and the lowest ethylene glycol concentration;
  • The performance of the ethylene glycol water mixture is less than that of distilled water. However, if the environment requires liquid to sustain low temperature, then a 5%vol ethylene glycol water mixture is recommended;
  • As the concentration of ethylene glycol increases, for a constant flow rate, the drop in pressure increases, respectively;
  • The performance evaluation criteria reach the maximum value of 90 when the mixture is composed of 5%vol ethylene glycol in water with aluminum TPMS;
  • In the presence of a silver TPMS, the maximum performance evaluation criterion is around 95 with a 5% ethylene glycol/water mixture.

Author Contributions

Conceptualization, M.Z.S. and M.Y.; methodology, M.Y.; software, M.Z.S.; validation, M.Z.S. and M.Y.; formal analysis, M.Z.S. and M.Y.; investigation, M.Z.S. and M.Y.; resources, S.I., O.A.-K. and P.D.O., data curation, M.Z.S.; writing—original draft preparation, M.Z.S.; writing—review and editing, S.I., O.A.-K., P.D.O. and M.Y.; visualization, M.Z.S.; supervision, M.Z.S.; project administration,. M.Z.S.; funding acquisition, M.Z.S. All authors have read and agreed to the published version of the manuscript.

Funding

Natural Research Council of Canada RGPIN-2020-07021, Alliance International Catalyst Grant (ALLRP) ALLRP 592445-23.

Data Availability Statement

The original contributions presented in this study are included in the article. Further inquiries can be directed to the corresponding Prof. Ziad Saghir.

Conflicts of Interest

The authors declare no conflicts of interest.

Nomenclature

p The pressure difference (N/m2) ρ f Fluid density
TTemperature in °K μ f Fluid viscosity
TinInlet temperature (°K)CpFluid specific heat
uinInlet velocity (m/s)kfFluid conductivity
NuLocal Nusselt numberhLocal heat transfer coefficient (W/m2·K)
DInlet cylinder diameter (m)q″Heat flux applied to the bottom of the aluminum block (W/m2·K)
pPressure (N/m2)u, v, wVelocity in x, y and z direction (m/s)
ToutOutlet Temperature (°K)PECPerformance Evaluation Criterion
LTPMS length (m)Re = ρ u i n D μ Reynolds number
TCThermocouple

References

  1. Welsford, C.A.; Delisle, C.S.; Plant, R.D.; Saghir, M.Z. Effects of nanofluid concentration and channeling on the thermal effectiveness of highly porous open-cell foam metals: A numerical and experimental study. J. Therm. Anal. Calorim. 2020, 140, 1507–1517. [Google Scholar] [CrossRef]
  2. Hajialibabaei, M.; Saghir, M.Z. A critical review of the straight and wavy microchannel heat sink and the application in lithium-ion battery thermal management. Int. J. Thermofluids 2022, 14, 100153. [Google Scholar] [CrossRef]
  3. Kerme, E.D.; Hajialibabei, M.; Saghir, M.Z.; El-Ketan, O. Experimental investigation of porous gyroid structure: Effect of cell size and porosity on performance. Therm. Sci. Eng. Prog. 2024, 53, 102728. [Google Scholar] [CrossRef]
  4. Sanitjai, S.; Goldstein, R.J. Heat transfer from a circular cylinder to mixtures of water and ethylene glycol. Int. J. Heat Mass Transf. 2004, 47, 4785–4794. [Google Scholar] [CrossRef]
  5. Gowen, R.A.; Smith, J.W. The effect of the Prandtl number on temperature profiles for heat transfer in turbulent pipe flow. Chem. Eng. Sci. 1967, 22, 1701–1711. [Google Scholar] [CrossRef]
  6. Obot, N.T.; Das, L.; Rabas, T.J. Smooth-and Enhanced-Tube Heat Transfer and Pressure Drop: Part I. Effect of Prandtl Number with Air, Water, and Glycol/Water Mixtures(No. ANL/ET/CP-102885); Argonne National Lab.: Lemont, IL, USA, 2000. [Google Scholar]
  7. Obot, N.T.; Das, L.; Vakili, D.E.; Green, R.A. Effect of Prandtl number on smooth-tube heat transfer and pressure drop. Int. Commun. Heat Mass Transf. 1997, 24, 889–896. [Google Scholar]
  8. Keklikcioglu, O.; Dagdevir, T.; Ozceyhan, V. Second law analysis of a mixture of ethylene glycol/water flow in modified heat exchanger tube by passive heat transfer enhancement technique. J. Therm. Anal. Calorim. 2020, 140, 1307–1320. [Google Scholar] [CrossRef]
  9. Jafari, M.; Farajollahi, A.; Gazori, H. The experimental investigation concerning the heat transfer enhancement via a four-point star swirl generator in the presence of water–ethylene glycol mixtures. J. Therm. Anal. Calorim. 2021, 144, 167–178. [Google Scholar] [CrossRef]
  10. Ma, Z.; Zhou, A.; Zhang, J.; Wang, Y. Experimental investigation on the friction characteristics of water–ethylene glycol mixture flow in internal helical finned horizontal tubes. Exp. Therm. Fluid Sci. 2017, 89, 1–8. [Google Scholar] [CrossRef]
  11. Dehghandokht, M.; Khan, M.G.; Fartaj, A.; Sanaye, S. Flow and heat transfer characteristics of water and ethylene glycol–water in a multi-port serpentine meso-channel heat exchanger. Int. J. Therm. Sci. 2011, 50, 1615–1627. [Google Scholar] [CrossRef]
  12. Jiang, G.; Liu, Y.; Liu, C. Investigation on liquid thermal conductivity of ethylene glycol (EG)/water mixtures: A comparative experimental and molecular dynamics simulation study. J. Mol. Liq. 2023, 384, 122268. [Google Scholar] [CrossRef]
  13. Joy, B.; Philip, J.; Zachariah, R. Investigations on serpentine tube type solar photovoltaic/thermal collector with different heat transfer fluids: Experiment and numerical analysis. Sol. Energy 2016, 140, 12–20. [Google Scholar] [CrossRef]
  14. Go, E.M.; Shin, E.; Cha, J.; Kwak, S.K. Estimation of heat transfer coefficient of water and ethylene glycol mixture in nanopipe via non-equilibrium coarse-grained molecular dynamics. J. Ind. Eng. Chem. 2019, 77, 128–134. [Google Scholar] [CrossRef]
  15. Ahdavi, M.; Sharifpur, M.; Ghodsinezhad, H.; Meyer, J.P. Experimental and numerical study of the thermal and hydrodynamic characteristics of laminar natural convective flow inside a rectangular cavity with water, ethylene glycol–water and air. Exp. Therm. Fluid Sci. 2016, 78, 50–64. [Google Scholar] [CrossRef]
  16. Yang, J.; Jacobi, A.; Liu, W. Heat transfer correlations for single-phase flow in plate heat exchangers based on experimental data. Appl. Therm. Eng. 2017, 113, 1547–1557. [Google Scholar] [CrossRef]
  17. Zhou, N.; Feng, H.; Guo, Y.; Chen, H.; Liu, W.; Peng, H.; Lei, Y.; Deng, S.; Xu, Y. Experimental study on the spray cooling heat transfer performance and dimensionless correlations for ethylene glycol water solution. Appl. Therm. Eng. 2022, 214, 118824. [Google Scholar] [CrossRef]
  18. Gemicioğlu, B.; Demircan, T. Experimental analysis of the effects of using different water-ethylene glycol mixture rates on heat transfer performance in a heat. Eskişehir Osman. Üniversitesi Mühendislik Mimar. Fakültesi Derg. 2021, 29, 145–157. [Google Scholar] [CrossRef]
  19. Thiyana, T.; Junaedi, A.; Rahman, M.A.; Sukarman, S.; Khoirudin, K.; Azizah, R.L. The Heat Transfer Coefficient in a Copper Pipe Flow System Using a 40/60 Volume Ratio Ethylene Glycol/Water (EG/H2O) Blended Fluid. J. Tek. Mesin Mech. Xplore 2023, 4, 37–46. [Google Scholar] [CrossRef]
  20. Mohan, S.V.; Kuriakose, J.; Nidhin, A.R.; Varghese, B.; Fidus, F. Experimental Comparison of Heat Transfer in a Down Flow Louvered Fin Auto Radiator using Water, Water and Ethylene Glycol Mixture & Water, Ethylene Glycol and Sugarcane Juice Mixture as Coolants. Glob. Res. Dev. J. Eng. 2017, 2, 215–223. [Google Scholar]
  21. Peyghambarzadeh, S.M.; Hashemabadi, S.H.; Hoseini, S.M.; Jamnani, M.S. Experimental study of heat transfer enhancement using water/ethylene glycol based nanofluids as a new coolant for car radiators. Int. Commun. Heat Mass Transf. 2011, 38, 1283–1290. [Google Scholar] [CrossRef]
  22. Kanthimathi, T.; Bhramara, P.; Abhiram, G. Experimental investigations on thermal performance of double pipe heat exchanger using EG-water-based sic nanofluid. J. Enhanc. Heat Transf. 2020, 27, 249–266. [Google Scholar] [CrossRef]
  23. Pérez-Tavernier, J.; Vallejo, J.P.; Cabaleiro, D.; Fernández-Seara, J.; Lugo, L. Heat transfer performance of a nano-enhanced propylene glycol: Water mixture. Int. J. Therm. Sci. 2019, 139, 413–423. [Google Scholar] [CrossRef]
  24. Saghir, M.Z.; Kilic, G.A. Experimental Forced Convection Study Using a Triply Periodic Minimal Surface Porous Structure with a Nanofluid: Comparison with Numerical Modeling. Appl. Sci. 2024, 14, 7594. [Google Scholar] [CrossRef]
  25. Hajialibabei, M. Experimental and Numerical Study on Thermal Performance and Optimization of Novel Wavy and Straight Channel Heat Sinks for Better Performance. Ph.D. Thesis, Toronto Metropolitan University, Toronto, ON, Canada, 2024. [Google Scholar]
Figure 1. The experimental setup (a) and the locations of thermocouples (b).
Processes 13 00228 g001
Figure 2. Test section containing TPMS structure: (a) testing section dimensions, (b) detailed description of the test section, (c) AlSi10Mg structure, and (d) silver structure.
Processes 13 00228 g002
Figure 3. Measured temperature for 10%vol EG/water mixture for different flow rates. (a,c) Aluminum structure, (b,d) silver structure.
Processes 13 00228 g003
Figure 4. Measured temperature for 20%EG/water mixture for different flow rates. (a,c) Aluminum structure, (b,d) silver structure.
Processes 13 00228 g004
Figure 5. Measured temperature for 30%vol EG/water mixture for different flow rates. (a,c) Aluminum structure, (b,d) silver structure.
Processes 13 00228 g005
Figure 6. Variation of the average experimental Nusselt number with the Prandtl number.
Processes 13 00228 g006
Figure 7. Boundary conditions used in the model.
Processes 13 00228 g007
Figure 8. Iso-stream line demonstration the flow circulation in the test section.
Processes 13 00228 g008
Figure 9. Comparison of temperature between experimental measurement and numerical results (aluminum TPMS, 10%vol EG/water) (a). Comparison of Nusselt number between experimental measurement and numerical results (Aluminum TPMS, 10%vol EG/water) (b).
Processes 13 00228 g009
Figure 10. Comparison of temperature between experimental measurement and numerical results (silver TPMS, 10%vol EG/water) (a). Comparison of Nusselt numbers between experimental measurement and numerical results (silver TPMS, 10%vol EG/water) (b).
Processes 13 00228 g010
Figure 11. Comparison of temperature with 20%vol EG/water mixture (aluminum TPMS).
Processes 13 00228 g011
Figure 12. Comparison of temperature with 20%vol EG/water mixture (Silver TPMS).
Processes 13 00228 g012
Figure 13. Performance evaluation criteria for all mixtures using aluminum TPMS. (a) Flow rate = 11.8 cm3/s, (b) flow rate = 15.73 cm3/s, (c) flow rate = 19.85 cm3/s.
Processes 13 00228 g013aProcesses 13 00228 g013b
Figure 14. Performance evaluation criteria for all mixtures using silver TPMS. (a) Flow rate =11.8 cm3/s, (b) flow rate = 15.73 cm3/s, (c) flow rate = 19.85 cm3/s.
Processes 13 00228 g014aProcesses 13 00228 g014b
Table 1. Uncertainties of the measurement parameters.
ParametersComponentsUncertainty
TemperatureT-type thermocouple±0.75%
Flow rateDigital flow meters±0.44%
Nu number-±2.44%
Table 2. Liquid mixture physical properties [12].
Liquid MixtureDensity
(kg/m3)
Dynamic Viscosity
Kg/m·s
Heat Capacity
J/kg·C
Thermal Conductivity
W/m·K
Prandtl Number
5%vol EG1004.120.00240920.59514
10%vol EG1010.050.00340020.57721
20%vol EG1021.890.005138220.54036
30%vol EG1033.7350.0071336420.50452
Table 3. Different case studies for different mixtures.
Liquid MixtureFlow Rate (cm3/s)Inlet Velocity (m/s)Reynolds Number
5%vol EG11.80.15744
15.70.2993
19.60.251240
10%vol EG11.80.15498
15.70.2664
19.60.25829
20%vol EG11.80.15301
15.70.2402
19.60.25502
30%vol EG1.960.02536
15.70.2290
Table 4. Measured experimental data for aluminum gyroid with a flow rate of 15.73 cm3/s.
Flow Rate = 15.73 cm3/s, Aluminum Gyroid
TCPosition (mm)10%vol EG/Water10%vol EG/Water20%vol EG/Water20%vol EG/Water30%vol EG/Water30%vol EG/Water
T (°C)(T-Tin) °CT (°C)(T-Tin) °CT (°C)(T-Tin) °C
14.228.2717.4228.7417.8428.0516.88
28.428.0417.1928.2717.3727.3716.20
312.628.0917.2428.6117.7127.8816.71
416.827.9717.1228.5117.6127.8116.64
52128.3917.5429.0218.1228.3817.21
625.228.6717.8229.4418.5428.7917.62
729.429.0118.1629.6918.7929.0317.86
Table 5. Comparison of measured and numerical data for the temperature with 10%EG/water mixture (aluminum TPMS).
Temperature T(°C)
TCFlow Rate = 11.8 cm3/sFlow Rate = 15.73 cm3/sFlow Rate = 19.85 cm3/s
Exp.Num.%DiffExp.Num.%DiffExp.Num.%Diff
130.1131.444.4128.2730.026.2027.5029.035.55
229.8931.495.3528.0430.097.3126.9829.127.94
329.9731.535.2028.0930.147.2727.2629.187.01
429.8031.575.9227.9730.187.9027.0229.228.15
530.1131.614.9828.3930.216.42927.8229.265.19
630.4431.643.9328.6730.245.45728.0829.294.29
730.8331.662.6929.0130.264.2928.3629.313.34
Table 6. Comparison of measured and numerical data for the temperature with 10%EG/water mixture (silver TPMS).
Temperature T(°C)
TCFlow Rate = 11.8 cm3/sFlow Rate = 15.73 cm3/sFlow Rate = 19.85 cm3/s
Exp.Num.%DiffExp.Num.%DiffExp.Num.%Diff
127.3729.708.50926.3028.9610.1025.4028.3211.48
226.9729.7410.2825.8429.0212.2724.9228.3913.92
327.2329.789.3326.0829.0511.3825.1628.4413.02
427.0929.8110.0325.9329.0912.1925.0028.4813.89
527.8429.847.1926.7629.128.7925.8728.5110.17
628.0929.876.3227.0129.147.8726.0928.539.36
728.3929.895.2827.2929.166.8426.3728.558.27
Table 7. Comparison of the measured and numerical data for the temperature with 20%vol EG/water mixture (aluminum TPMS).
Temperature T (°C)
TCFlow Rate = 11.8 cm3/sFlow Rate = 15.73 cm3/sFlow Rate = 19.85 cm3/s
Exp.Num.%DiffExp.Num.%DiffExp.Num.%Diff
130.3533.299.6728.7431.6510.1127.6330.6710.98
229.8833.3411.5628.2731.7012.1527.1030.7313.40
330.2233.3710.4328.6131.7510.9527.4530.7812.14
430.0833.4111.0928.5131.7911.5027.3530.8212.70
530.5433.459.5229.0231.829.6327.9030.8610.59
630.9933.488.0329.4431.858.1928.3130.889.10
731.2433.517.2529.6931.877.3428.5530.908.25
Table 8. Comparison of the measured and numerical data for the temperature with 20%vol EG/water mixture (silver TPMS).
Temperature T (°C)
TCFlow Rate = 11.8 cm3/sFlow Rate = 15.73 cm3/sFlow Rate = 19.85 cm3/s
Exp.Num.%DiffExp.Num.%DiffExp.Num.%Diff
128.1031.2511.2227.1230.5112.4926.2929.8313.45
227.5531.2913.5526.5630.5515.0125.7029.8916.26
327.8531.3112.4526.8730.5813.8326.0229.9215.00
427.7831.3512.8426.8430.6114.0526.0129.9515.16
528.3731.3810.5827.4530.6411.5926.6129.9812.66
628.7731.419.1627.8530.6610.0627.0030.0011.12
729.0431.438.2128.1030.689.1627.2330.0210.21
Disclaimer/Publisher’s Note: The statements, opinions and data contained in all publications are solely those of the individual author(s) and contributor(s) and not of MDPI and/or the editor(s). MDPI and/or the editor(s) disclaim responsibility for any injury to people or property resulting from any ideas, methods, instructions or products referred to in the content.

