Abstract
Three kinds of 1/3 coking coals with different degrees of oxidation were used for this study in Inner Mongolia, China. Using analytical testing methods such as X-ray photoelectron spectroscopy (XPS), nuclear magnetic resonance carbon spectroscopy (13C-NMR) and Fourier transform infrared spectroscopy (FT-IR), combined with computer-aided software such as Chemdraw, Materials Studio (2017), and MestRenova, three coal samples were characterized and analyzed. On this basis, the molecular formulas of three coal samples with different degrees of oxidation were constructed by optimizing the model energies: we used C228H165N3O21S4 for Suhaitu9# coal, C244H171N3O31S2 for Guoyu coal, and C225H177N3O33S2 for Lu9# coal. The results showed that, at the same coal rank, the oxidation degrees of S9, GY, and L9 coal samples were 21.10%, 48.30%, and 53.12%, respectively. As the oxidation degree increased, the proportion of oxygen-containing functional groups and nitrogen oxides in the coal macromolecular structure gradually increased. The bridge circumference ratios were 0.3786, 0.3351, and 0.2228, respectively, showing a gradual decrease. The average methylene chain lengths were 4.9569, 2.6843, and 1.9055, respectively, showing a gradual decrease. This indicates that the condensation degree of the compounds decreases with the increase in the degree of oxidation. These findings reflect the effect of oxidation on the modeling of coal’s macromolecular structure and lay a theoretical foundation for the further study of impact of the degree of oxidation on the physicochemical properties of coal.
1. Introduction
Fossil fuels remain the primary energy source relied upon for global economic and social development. Coal is one of the most important fossil fuels, accounting for a significant portion of electricity generation and industrial energy consumption [1,2,3]. Ensuring the efficient utilization of coal is critical to meeting the growing energy demand and maintaining energy security. However, coal undergoes varying degrees of oxidation during storage and transportation, especially in products such as fine-grained powder coal or coal slurry. Due to their fine particle size or high humidity, they are more likely to combine with oxygen in the air and be oxidized, resulting in a decrease in the calorific value of coal, an increase in moisture content, a decrease in hardness, and more fragile coal particles, thereby affecting the normal production and economic benefits of coal-washing plants [4,5,6,7]. At present, the research on the change in coal properties after oxidation is relatively in-depth, but research on the evolution of macromolecular structure of oxidized coal is still relatively scarce. Therefore, there is an urgent need to carry out a systematic study of the characteristics of the macromolecular structure of oxidized coal after oxidation in order to deepen the knowledge of the change law of the chemical structure of oxidized coal, so as to provide theoretical support and practical guidance for the efficient processing and utilization of oxidized coal [8].
The macromolecules of coal are composed of many structurally similar but not completely identical basic structural units connected by bridge bonds. These can fundamentally reflect the physical and chemical properties of coal, and help to understand the degree of coal metamorphism, adsorption, and wettability, as well as other properties [9,10,11,12,13,14]. For nearly half a century, many scholars at home and abroad have studied the molecular structure of coal through various physical and chemical characterization methods, proposing many classic models of coal molecular structure, such as the Wiser model, the Wender model, and the Shinn model [15,16,17]. With the development of modern testing technologies, such as FT-IR, XPS, 13C-NMR, etc., the physical and chemical characterization methods have become more accurate, promoting the construction of coal molecular models to be more comprehensive. Hatcher et al. [18] constructed a molecular model of highly volatile bituminous coal using data obtained from elemental analysis, 13C-NMR, and mass spectrometry. Meng et al. [19] constructed a molecular model of Zhaozhuang coal using industrial analysis, elemental analysis, XPS, and 13C-NMR testing, and then optimized the chemical structure model of coal molecules using molecular mechanics and molecular dynamics. Guo et al. [20] established the structure of Datong coal through a combination of experiments and simulations, and conducted quantum chemical calculations to optimize the geometric structure of the coal model. Na Li et al. [21] found, through computer-aided molecular design and multi-scale molecular simulation calculations, that aromatic hydrocarbons are the main skeleton of organic compounds. They mainly exist in the form of methyl, methylene, and methionine when combined with some aliphatic carbons. Liu et al. [22] developed a three-dimensional molecular representation of anthracite coal by performing an NMR simulation of the coal structure and comparing the simulated and experimental results to validate the model. Qin et al. [23] conducted in-depth analysis of side chains, aromatic clusters, and oxygen forms through 13C-NMR characterization, and explored the molecular structures of four lower-order coals. Lin et al. [24] found that quantum chemical calculations can be used to evaluate the reactivity of coal and determine the bond length and bond order of the optimal stable geometric configuration of the coal model.
Based on previous research, modern testing characterization methods were used to construct coal macromolecular structure models with different degrees of oxidation, and Materials Studio 2017 software was used to optimize the molecular dynamics of the three coal molecular models. The Materials Studio 2017 software (MS) is a powerful tool for molecular simulation and chemical property calculation. It is integrated with comprehensive material computing tools, including molecular mechanics, molecular dynamics, quantum mechanics, Monte Carlo, mesoscopic dynamics, and other computational methods. The construction of coal’s molecular structure is the first step in this research. This paper explores the influence of the oxidation degree on coal’s molecular structure by accurately characterizing three types of coal molecular structures with different degrees of oxidation, deepening the understanding of the micromechanisms of oxidation and coal, and providing a basis for simulating and exploring the influence of oxidation degree on coal samples in the future.
2. Materials and Methods
2.1. Coal Samples
The experimental coal samples were taken from three primary coal slurries below 0.5 mm. They were obtained by screening at the Luotuoshan Coal Preparation Plant in Inner Mongolia, China. They included the Suhaitu9# coal sample (S9), Guoyu coal sample (GY), and Lu9# coal sample (L9). The coal samples were ground to less than 75 μm and placed in a blast thermostatic drying oven below 75 °C for 1 h, cooled to room temperature, and then, after mixing and shrinking, kept in a sealed bag as test coal samples. Proximate analysis and ultimate analysis were conducted on coal samples, and the atomic ratios of the three types of coal were calculated according to the elemental analysis indicators [25,26]. The specific analysis results are shown in Table 1.

Table 1.
Coal sample proximate analysis and ultimate analysis results.
The ash content of S9, GY, and L9 is 12.38%, 26.12%, and 29.44%, respectively, and the oxygen content gradually increases to 10.76%, 13.81%, and 15.47%, respectively. The increasing ash content and oxygen content indicate that the degree of oxidation of the three types of coal is gradually increasing.
2.2. Main Research Methods
2.2.1. Vitreous Reflectance of Coal Samples
We conducted tests to assess maximum reflectance (Romax) [27]. Qualified coal rock optical sheets were prepared through the steps of fine grinding, precision grinding, polishing, and ultrasonic cleaning. The prepared optical sheets were dried in a 35 °C oven for 4 h and taken out. The random reflectivity of the lens body was measured under an oil-immersed objective lens, and the results are shown in Table 2.
Table 2.
Specular reflectance of the coal samples.
According to Table 2, the Romax values of the three types of coal are not significantly different. They all belong to 1/3 coke coal, and are therefore the same coal type.
2.2.2. X-Ray Photoelectron Spectroscopy (XPS) Tests
The coal sample was subjected to XPS testing using a Thermo Escalab 250XI (Thermo Fisher Scientific, Waltham, MA, USA) X-ray photoelectron spectrometer, and XPS spectra were obtained. Dry samples were compressed and tested in a vacuum environment using an aluminum target X-ray source with a monochromator (1486.6 eV). The beam spot size was 900 μm, and the vacuum degree in the analysis chamber was better than 1 × 10⁻⁷ Pa. First, we performed a wide scan on the three samples to preliminarily determine their surface chemical composition. And then, we subjected C1s to narrow scanning and used Avantage v5.9 software for fitting processing. Charge correction was performed using contaminated carbon, where C1s = 284.8 eV.
2.2.3. Fourier Transform Infrared (FT-IR) Spectroscopy Tests
We used the Icolet 6700 infrared spectrometer to analyze and test the surface functional groups of coal samples. Firstly, we dried the coal sample and KBr reagent to be tested, and then mixed the coal sample and KBr reagent in a mass ratio of 1:150. We ground them into powder, and pressed them into tablets, using a tablet press, for testing. The infrared test had a scanning range of 4000~400 cm−1, a resolution of 4 cm−1, and 32 scans. OMNIC v9.2 software was used for baseline calibration, vertical axis normalization, and peak fitting processing.
2.2.4. Solid-State 13C-NMR Tests
13C-NMR technology can obtain internal structural information about coal without damaging its molecular structure, and is widely used in the study of coal’s molecular structure. Three kinds of coal were analyzed by 13C-NMR using a JNM-ECZ600R nuclear magnetic resonance spectrometer to obtain 13C-NMR structural parameter information about different coal samples. The nuclear magnetic resonance frequency was 150.913 MHz, the pulse width was 0.1 μs, the rotor diameter was 3.2 mm, the rotation speed was 10 kHz, the relaxation time was 2 s, and the sampling frequency was 1500 times.
3. Results and Discussion
3.1. XPS Analysis
The chemical composition of three coal samples was determined through a full-spectrum scan, and the results are shown in Table 3. The content of C gradually decreased and the content of O gradually increased in the three coal samples: S9, GY, and L9. Specifically, the content of O gradually increased in the three coal samples, S9, GY, and L9, reaching 14.78%, 24.71%, and 26.86%, respectively; the content of C gradually decreased, reaching 73.62%, 62.10%, and 59.95%, respectively. This was consistent with the results of proximate analysis and ultimate analysis.
Table 3.
XPS full-spectrum scan results of three coal samples.
In order to determine the binding mode of C, O, N, and S in coal molecules [22] and further characterize the oxidation degree of the three types of coal [28,29], Avantage v5.9 software was used to fit the spectra separately. Figure 1 shows the XPS C1s spectra of three types of coal, where the chemical bonds C-C/C-H/C=C, C-O, C=O, and O=C-O correspond to binding energies of 284.2 eV, 286.3 eV, 288.2 eV, and 289.0 eV, respectively. The relative content of these four chemical bonds can be calculated based on the peak areas. The relative content of C-C/C-H bonds represents the proportion of unoxidized parts in coal, while the relative content of C-O, C=O, and O=C-O bonds represents the proportion of oxidized parts after the interaction between coal and oxygen elements [30]. The degree of coal oxidation can be defined as follows:
where is the degree of oxidation of coal in %; is the carbon content of the oxidized portion in coal in %; and is the carbon content of the unoxidized portion in coal %. Then, the relative oxidation degree of the three coals can be calculated as 21.10%, 48.30% and 53.12%, which is consistent with the XPS wide-scan analysis, and it can be said that S9 has the lowest degree of oxidation, GY has the median degree of oxidation, and L9 coal has the highest degree of oxidation. In addition, it can be seen from Figure 1 that the carbon in the three coal samples is dominated by C-C and C-H, and with the increase in oxidation degree, the C-C and C-H gradually decrease.
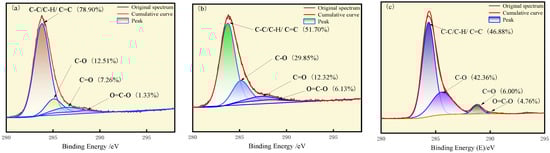
Figure 1.
XPS C1s spectra of (a) S9, (b) GY, and (c) L9.
The results of the peak fitting to the O elemental partition are shown in Figure 2. The oxygen-containing functional groups in the three coals mainly include COO-, C=O and C-O [31], and the binding energies of the chemical bonds COO-, C=O, and C-O are 533.3 eV, 532.0 eV, and 532.5 eV, respectively. The carbonyl group represents the largest proportion in the three coals, with 48.93%, 56.27%, and 56.61%, respectively, and the carboxyl group represents the smallest proportion, with 6.42%, 14.55%, and 13.56%, respectively.
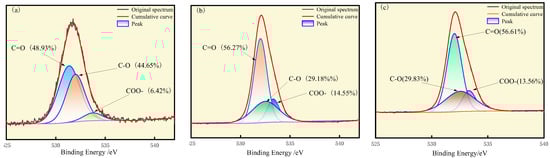
Figure 2.
XPS O1s spectra of (a) S9, (b) GY, and (c) L9.
The results of the peak fitting of N are shown in Figure 3, in which the binding energy of pyrrole nitrogen is 399.4 eV, the binding energy of pyridine nitrogen is 398.5 eV, and the binding energy of nitrogen oxides is in the range of 402.0–403.6 eV. The nitrogen-containing functional groups of the three kinds of coals are mainly pyrrole nitrogen and pyridine nitrogen, and the proportion of pyridine nitrogen is the highest in S9 coal, which accounts for 47.34%; the GY surface is mainly enriched in pyrrole nitrogen, with 67.33%; the L9 surface is mainly enriched in pyridine nitrogen and pyrrole nitrogen with 29.64% and 33.99%, respectively. Both pyridine nitrogen and pyrrole nitrogen have stable aromatic conjugate structures, and the solid can be preserved in large quantities [32]. Pyrrolic nitrogen and pyrrolizidine nitrogen are oxidized to form nitrogen oxides. The percentage of nitrogen oxides in S9 is 10.08%, that in GY is 17.18%, and that in L9 coal is 19.88%. The nitrogen oxides show a gradual increase with the increase in the degree of oxidation.
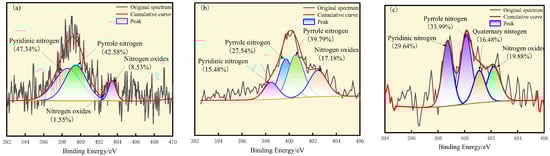
Figure 3.
XPS N1s spectra of (a) S9, (b) GY, and (c) L9.
The results of the peak fitting to the S elements are shown in Figure 4. The corresponding binding energy of thiophene sulfur is 164.1 eV, the corresponding binding energy of sulfoxide is 165.2 eV, the corresponding binding energy of sulfone is 168.8 eV, and the corresponding binding energy of sulfate is 170.3 eV. The sulfur in the molecular structure of the three coals is mainly present in the form of thiophene and sulfone, and the oxidation degree is from low to high. The proportion of thiophene is 45.56%, 40.88%, and 32.43%, respectively, and that of sulfone is 29.31%, 38.19%, and 34.23%, respectively. The relative content of thiophene sulfur on the coal surface decreased, thiophene sulfur oxidized to sulfoxide, and sulfoxide further oxidized to sulfone. The content of sulfate sulfur in coal increased, which was potentially due to the oxidation of part of pyrite on the surface of coal particles into sulfate during the oxidation process [33].
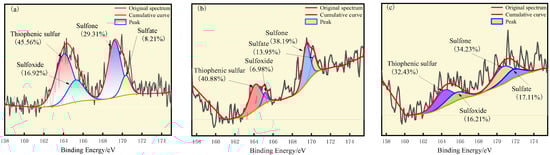
Figure 4.
XPS S2p spectra of (a) S9, (b) GY, and (c) L9.
3.2. 13C-NMR Analysis
Solid-state NMR tests were carried out on the three coals, and the spectra were peak-split using Peakfit v4 software. The spectra were first deconvoluted, and then second-order fitting was carried out to determine the approximate chemical shifts of the spectra, and the results of the fitting for the three coals are shown in Figure 5. In Figure 5, the 13C-NMR spectra of the three kinds of coals are shown to be roughly the same, and the chemical shifts of the spectra are (0–225) × 10−6. These can mainly be divided into three regions: the aliphatic carbon peaks with chemical shifts of (0–60) × 10−6, the aromatic carbon peaks of (100–170) × 10−6, and the carboxyl and carbonyl carbon peaks of (190–220) × 10−6. Among them, the aromatic carbon peaks accounted for a much larger proportion than the aliphatic carbon peaks and carboxyl and carbonyl carbon peaks, which shows that aromatic carbon is the main component of 1/3 coking coal. Further analyses yielded the chemical shift attribution information of the three coals after peak fitting, as shown in Table 4, Table 5 and Table 6.
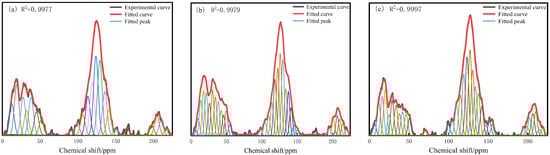
Figure 5.
13C-NMR split spectrum of (a) S9, (b) GY, and (c) L9.
Table 4.
Peak fitting data of 13C-NMR of S9 coal samples.
Table 5.
Peak fitting data of 13C-NMR of GY coal samples.
Table 6.
Peak fitting data of 13C-NMR of L9 coal samples.
Combined with the peak position attribution of the 13C-NMR spectra of the three coals, the macromolecular structural parameters of each coal can be obtained as shown in Table 7.
Table 7.
13C-NMR structural parameters of different coal samples (%).
As can be seen in Table 7, aromatic carbon dominates the molecular structure of all three coals, with relative contents of 55.90%, 51.64% and 56.24%, respectively, and the ratio of bridge carbon to peripheral carbon of the three coals can also be obtained by using 13C-NMR, which is used to characterize the condensation degree of aromatic compounds in the coal molecules [35,36,37]. The ratio of bridge carbon to peripheral carbon (XBP) can be deduced to be as follows:
XBP = faB/(faH + faP + faS)
The XBP of S9 was calculated to be 0.3786, that of GY was 0.3351, and that of L9 coal sample was 0.2228. The XBP gradually decreased with the increase in oxidation, which indicated that the condensation degree of aromatic compounds decreased with the increase in oxidation, and it was speculated that this was due to the fact that the oxidation process would destroy the bridge carbon structure and reduce the number of bridge carbons, which would lead to a decrease in the XBP. The XBP of benzene ring is 0, that of naphthalene is 0.25, and that of phenanthrene and anthracene is 0.4. It can be hypothesized that both the macromolecular structures of S9 and GY are mainly dominated by phenanthrene and anthracene, with less naphthalene, and that the macromolecular structure of L9 coal is dominated by benzene rings and naphthalene, with less phenanthrene and anthracene. The average methylene chain length (Cn) is also an important parameter in the molecular structure of coal [38], which is used to estimate the alkyl chain length, and its calculation formula is shown in (3).
Cn = falH/faS
The Cn values of the three coal samples were 4.9569, 2.6843, and 1.9055, respectively, indicating that the alkyl side chain decreases with increasing oxidation.
3.3. FT-IR Analysis
The IR spectra were used to characterize the structural features and functional group distribution of the coal samples [39], and the peak distribution maps of the IR spectra of the three coal molecules after baseline calibration are shown in Figure 6. From Figure 6, it can be seen that since the three coal samples are the same as 1/3 coking coal, their IR spectral maps are roughly the same, and can be mainly categorized into four types: aromatic hydrocarbon structures at 700–900 cm−1, oxygen-containing functional groups at 1000–1800 cm−1, aliphatic structures at 2800–3000 cm−1, and hydroxyl structures at 3000–3600 cm−1. As can be seen in Figure 6, the corresponding carbonyl group at wave number 1600 cm−1 and oxygenated functional groups, such as hydroxyl groups at 3693 cm−1 and 3618 cm−1, are gradually enhanced with the increase in oxidation degree.
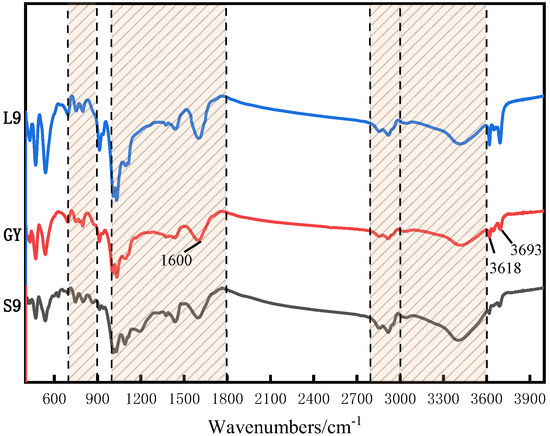
Figure 6.
FT-IR spectrogram of three coal samples.
Separate peaks were fitted to each type of the spectrograms using OriginPro software and the results of the peaks were attributed to the IR spectra [40]. The fitting and attribution results are shown in Figure 7 and Table 8 below.
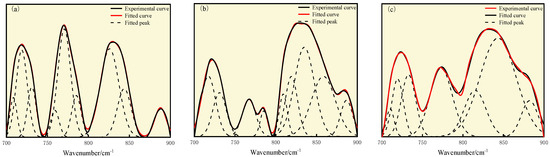
Figure 7.
Curve-fitted FT-IR spectra for the 700–900 cm−1 zone: (a) S9, (b) GY, and (c) L9 coal.
Table 8.
FT-IR analysis table of the aromatic hydrocarbon structure in coal.
As shown in Figure 7 and Table 8, S9 mainly has two peaks, corresponding to 770.61 cm−1 and 825.87 cm−1, indicating that the aromatic structure of S9 is mainly composed of four substituted and three substituted benzene rings, with relative area proportions of 31.80% and 36.51%. The aromatic structures of GY and L9 coal are mainly composed of four substituted benzene rings, with relative area proportions of 57.83% and 54.14%.
According to Figure 8 and Table 9, the range of 1000 cm−1 to 1800 cm−1 is mainly attributed to the deformation vibration of oxygen-containing functional groups, CH3 and CH2, and the stretching vibration of aromatic C=C. The characteristic peaks appearing in the range of 1000 cm−1 to 1050 cm−1 belong to the ash content in the coal, which is due to the lack of ash removal treatment applied to the coal sample. The oxygen-containing functional groups of the three types of coal are mainly phenol, alcohol, ether, and ester C-O vibration, accounting for 40.50%, 33.43%, and 49.54%, respectively.
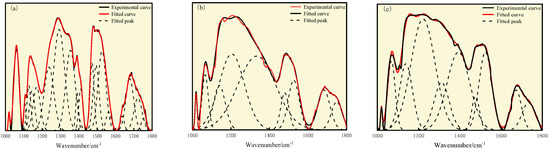
Figure 8.
Curve-fitted FT-IR spectra for the 1000–1800 cm−1 zone: (a) S9, (b) GY, and (c) L9 coal.
Table 9.
FT-IR analysis table of oxygen-containing functional groups in coal.
As shown in Figure 9 and Table 10, the fat structures in S9 and GY are mainly dominated by CH2 asymmetric stretching and contraction vibrations, with the highest relative area ratios of 44.88% and 56.86%, respectively. The fat structure of L9 coal is mainly characterized by CH2 asymmetric stretching vibration and CH3 symmetric stretching vibration, with relative area proportions of 35.78% and 34.95%, respectively. The asymmetric stretching vibration peak intensity of the three types of coal is greater than the symmetric stretching vibration peak intensity. As the degree of oxidation increases, the stretching vibration peak intensity of CH2 shows a decreasing trend, while the stretching vibration peak intensity of CH3 gradually increases.
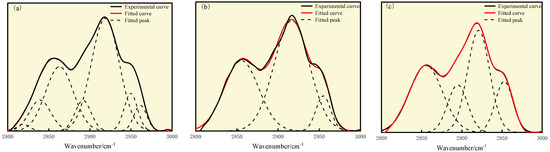
Figure 9.
Curve-fitted FT-IR spectra for the 2800–3000 cm−1 zone: (a) S9, (b) GY, and (c) L9 coal.
Table 10.
FT-IR analysis table of aliphatic structures in coal.
As shown in Figure 10 and Table 11, the three types of coal are mainly composed of self-associated hydroxyl groups, with the highest relative contents of 71.47%, 66.72%, and 39.07%, respectively, showing a gradually decreasing trend with the increase in oxidation degree. This may be due to the increase in oxygen-containing functional groups on the aromatic ring, caused by the oxidation reaction, which leads to the destruction of the aromatic ring in the oxidized coal and a decrease in condensation degree. The spatial arrangement of molecules tends to be more dispersed, and the probability of the formation of self-associated hydroxyl groups decreases. This is consistent with the XBP analysis results of the three types of coal.
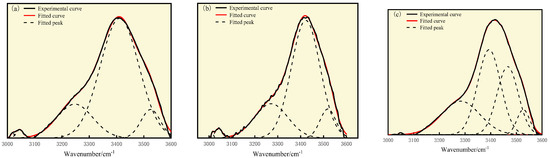
Figure 10.
Curve-fitted FT-IR spectra for the 3000–3600 cm−1 zone: (a) S9, (b) GY, and (c) L9 coal.
Table 11.
FT-IR analysis table of hydroxyl structures in coal.
4. Construction and Optimization of Coal Molecular Structure Models
4.1. Aromatic Structure
The carbon contents of the three coal samples were 79.14%, 78.92%, and 76.26%, respectively, and the R◦ max of the three coal samples was 0.93 ± 0.03. Therefore, it is speculated that the number of aromatic hydrocarbon rings is 2–3 [41]. According to the 13C-NMR spectrum analysis, the XBP around the bridge carbon is 0.3786, 0.3351, and 0.2228, respectively. The optimized combination of the target bridge carbon to carbon ratio of 0.3786 is as follows: 2 naphthalene, 3 anthracene, and 4 phenanthrene. The optimized combination of the target bridge carbon to carbon ratio of 0.3351 is as follows: 1 benzene ring, 2 naphthalene, 3 anthracene, and 4 phenanthrene. The optimized combination of the target bridge carbon to carbon ratio of 0.2228 is as follows: 4 benzene rings, 5 naphthalene rings, 2 anthracene rings, and 2 phenanthrene rings. In addition, there should be nitrogen atoms present in the structure of coal macromolecules, such as pyridine and pyrrole, as well as sulfur atoms present in thiophene sulfur and sulfone. In summary, the aromatic structure types and quantities of the three coal samples are shown in Table 12. In the structural model, S9 has 150 aromatic carbon atoms and a total of 228 carbon atoms. GY has 147 aromatic carbon atoms and a total of 244 carbon atoms. The number of aromatic carbon coal molecules in L9 coal is 153, with a total of 225 carbon atoms.
Table 12.
Types and quantities of aromatic structures in three coal samples.
4.2. Fat Structure
The fatty carbons in coal mainly exist in the form of branched chains or linked aromatic rings, as fatty rings, side chains, or bridging carbon [42]. According to the analysis of infrared spectroscopy data, the fat structure in S9 and GY is mainly composed of methylene groups, while the fat structure in L9 coal is mainly composed of methyl and methylene groups. Methyl is the branched part of the side chains of the aliphatic ring, aliphatic hydrocarbon, and aromatic hydrocarbon, while methyl is the straight chain part of the side chains of the aliphatic ring, aliphatic hydrocarbon, and aromatic hydrocarbon. According to 13C-NMR spectrum analysis, the number of fatty carbon atoms in S9 is 78; the number of fatty carbon atoms in GY is 97; the number of fatty carbon atoms in L9 coal is 72.
4.3. Heteroatom Structure
Based on the atomic ratios of the three types of coal, it can be inferred that the molecular structure of S9 contains 21 oxygen atoms, 165 hydrogen atoms, 3 nitrogen atoms, and 4 sulfur atoms. The molecular structure of GY contains 31 oxygen atoms, 170 hydrogen atoms, 3 nitrogen atoms, and 2 sulfur atoms. Similarly, the molecular structure of L9 coal includes 33 oxygen atoms, 177 hydrogen atoms, 3 nitrogen atoms, and 2 sulfur atoms. Combining XPS and 13C-NMR analyses, oxygen within the molecular structure of coal primarily exists as C=O, C-O, and COO-, with COO- contributing a very small proportion. In the S9 molecular structure, the calculated numbers of C=O, C-O, and COO- are 9, 8, and 1, respectively. For the GY molecular structure, the calculated numbers are 17, 8, and 2, while for L9 they are 18, 9, and 2. Within the molecular structure of coal, nitrogen primarily occurs in the forms of pyridine and pyrrole nitrogen. In the S9 molecular structure, pyridine nitrogen is slightly more abundant, with an estimated 2 pyridine nitrogen and 1 pyrrole nitrogen atoms. In contrast, the GY structure contains 1 pyridine nitrogen and 2 pyrrole nitrogen atoms. In L9 coal, pyrrole nitrogen is marginally more abundant, with 1 pyridine nitrogen and 2 pyrrole nitrogen atoms. In the three molecular structures, sulfur is primarily present as thiophene and sulfone. In the S9 molecular structure, there are 3 thiophene sulfur atoms and 1 sulfone atom. The GY structure contains 1 thiophene sulfur and 1 sulfone atom, while the L9 structure similarly includes 1 thiophene sulfur and 1 sulfone atom.
4.4. Modeling of Coal Molecular Structure
Based on the above information, initial models of three coal molecules were constructed using ChemDraw 23 (Trial Version) software, as shown in Figure 11a–c, and nuclear magnetic prediction simulations were performed using MestRenova (Trial Version) software. Comparing the predicted nuclear magnetic spectra with the experimental nuclear magnetic spectra, optimization adjustments were made. The comparison between the simulated nuclear magnetic spectra of the three coal models and the experimental spectra is shown in Figure 11d. The elemental analysis results of the three coal models and the actual coal samples are shown in Table 13.
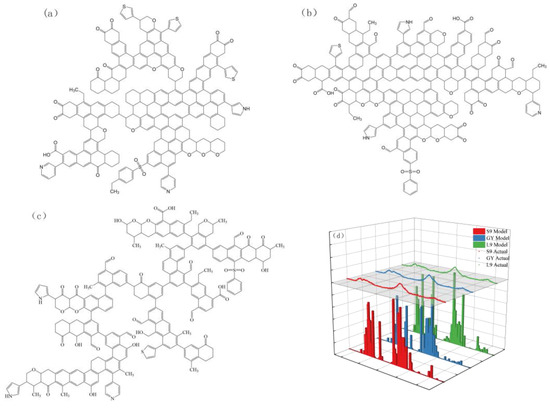
Figure 11.
A planar model of the molecular structure of (a) S9, (b) GY, (c) L9 and (d) 13C-NMR predicted spectra with experimental spectra for three types of coal macromolecule.
Table 13.
A comparison of elemental analysis between actual and model coal samples.
Figure 11d shows that the predicted 13C-NMR spectrum aligns closely with the experimental results. In addition, Table 13 shows the model structures of the three types of coal, and the elemental analysis results are roughly the same as those of the actual coal samples, indicating that the constructed structural models are reasonable and effective. The final molecular formula of S9 coal is C228H165N3O21S4, with a molecular weight of 3411. The final molecular formula of GY coal is C244H171N3O31S2, with a molecular weight of 3705. The final molecular formula of L9 coal is C225H177N3O33S2, with a molecular weight of 3515.
4.5. Optimization of Macromolecular Model for Oxidized Coal
We optimized the macromolecular structure models using Materials Studio 2017 software. Firstly, the imported coal model was subjected to hydrogenation saturation, and the Forcite module was used for geometry optimization tasks. Based on the COMPASS II force field, the smart algorithm was selected as the algorithm, and the convergence criterion was found to be fine. After geometric optimization, the molecular structure underwent partial twisting, at which point the local energy was minimized [43]. We performed multiple annealing treatments on the geometrically optimized model, selected NVT as the ensemble, set the temperature to 300 K and the maximum temperature to 600 K, and performed 15 annealing cycles. The optimized three-dimensional structure model obtained through annealing treatment was the structure with the minimum global energy. The optimized 3D molecular structure model was shown in Figure 12, Figure 13 and Figure 14. The carbon, hydrogen, oxygen, nitrogen, and sulfur atoms are represented by gray, white, red, blue, and yellow beads, respectively.
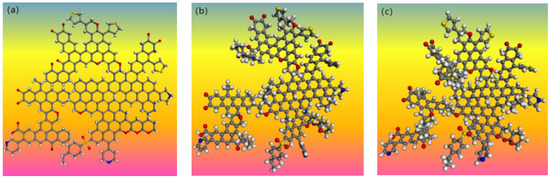
Figure 12.
Three-dimensional model structure of S9 coal macromolecule: (a) plan view; (b) structural optimization treatment diagram; (c) annealing treatment diagram.
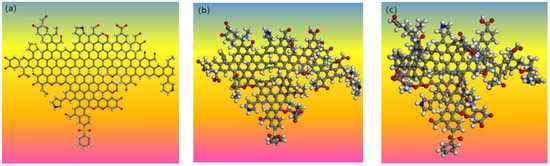
Figure 13.
Three-dimensional model structure of GY coal macromolecule: (a) plan view; (b) structural optimization treatment diagram; (c) annealing treatment diagram.
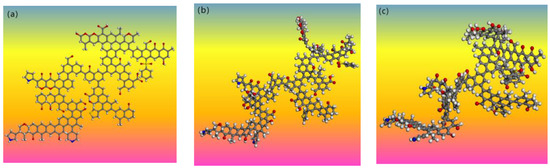
Figure 14.
Three-dimensional model structure of L9 coal macromolecule: (a) plan view; (b) structural optimization treatment diagram; (c) annealing treatment diagram.
After geometric optimization and annealing treatment, the coal molecule configuration underwent significant torsional deformation in spatial structure, and the energy changes before and after model optimization are shown in Table 14. As shown in Table 14, the total energies of S9, GY, and L9 coal molecules before geometric optimization were 6938.79 kcal/mol, 7862.33 kcal/mol, and 6732.53 kcal/mol, respectively. After geometric optimization and multiple annealing treatments, the total energy of S9, GY, and L9 coal molecules decreased to 2951.41 kcal/mol, 3057.82 kcal/mol, and 2470.55 kcal/mol, with a significant decrease in energy. Bond energy played a dominant role in valence electron energy, while van der Waals energy played a dominant role in non-bond energy.
Table 14.
Energy changes before and after optimization of different coal sample models/kJ·mol−1.
4.6. The Influence of Oxidation on the Molecular Structure of Coal
The parameter information of three coal samples with different degrees of oxidation is summarized in Table 15. According to Table 15, there is not much difference in the Romax values of the three coal samples, all of which are 1/3 coke coal. However, due to the influence of oxidation, the degree of oxidation of the three coal samples varies greatly. As the degree of oxidation increases, the XBP gradually decreases. The Cn gradually decreases. The aromatic carbon ratio does not show significant regular changes. The aromatic structure sees a gradual decrease in condensation degree, moving from relatively intact to oxidized and destroyed. The content of oxygen-containing functional groups in the fat structure increases. The chemical forms of sulfur and nitrogen in the heteroatom structure change, forming nitrogen oxides, sulfates, etc.
Table 15.
Comparison of structural parameters of three coal samples.
5. Conclusions
- (1)
- S9, GY, and L9 are all 1/3 coking coal. The coal was comprehensively characterized by elemental analysis, FT-IR, XPS, and 13C-NMR, with oxidation degrees of 21.10%, 48.30%, and 53.12%, respectively. The molecular formula of S9 coal is C228H165N3O21S4, with a molecular weight of 3411. The molecular formula of GY coal is C244H171N3O31S2, with a molecular weight of 3705. The molecular formula of L9 coal is C225H177N3O33S2, with a molecular weight of 3515. Finally, energy optimization was performed on the three coal samples, and the rationality of their structural models was verified through nuclear magnetic resonance prediction and elemental analysis.
- (2)
- The XBP of S9, GY, and L9 coal samples are 0.3786, 0.3351, and 0.2228, respectively. The average methylene chain lengths are 4.9569, 2.6843, and 1.9055, respectively. As the degree of oxidation increases, the XBP gradually decreases and the Cn gradually decreases. This indicates that the condensation degree of aromatic compounds is gradually decreasing, indicating that the oxidation process will destroy the bridging carbon structure, reduce the number of bridging carbons, and make the spatial arrangement of molecules more dispersed.
- (3)
- Oxidation leads to the formation of nitrogen oxides from pyrrole and pyridine nitrogen. The proportion of nitrogen oxides increases with oxidation, accounting for 10.08%, 17.18%, and 19.88%, respectively, in the three coal types. Thiophene sulfur undergoes oxidation to sulfoxide, which is subsequently oxidized to sulfone. As oxidation progresses, the proportion of thiophene compounds gradually decreases.
- (4)
- Although existing technologies still have certain limitations in constructing coal molecular structure models, it has certain guiding significance for further analyzing the impact of oxidation on coal molecular structure patterns and exploring the influence of the oxidation degree on coal samples.
Author Contributions
Conceptualization, D.L. and F.Y.; funding acquisition, D.L. and Z.C.; investigation, Y.H.; methodology, D.L. and F.Y.; visualization, F.Y. and R.L.; writing—original draft, F.Y.; writing—review and editing, F.Y. and Z.C. All authors will be updated at each stage of manuscript processing, including submission, revision, and revision reminder, via emails from our system or the assigned Assistant Editor. All authors have read and agreed to the published version of the manuscript.
Funding
This research was funded by the Natural Science Foundation of China [grant numbers 51904160], the Natural Science Foundation of Inner Mongolia of China [grant number 2023MS05007], the Basic Research Business Foundation of Administrated Universities of Inner Mongolia of China [grant number 2023QNJS100].
Data Availability Statement
Data is contained within the article.
Acknowledgments
The authors would like to sincerely thank various organizations for the financial support.
Conflicts of Interest
The authors declare no conflicts of interest.
References
- Li, Q.; Li, Q.; Han, Y. A numerical investigation on kick control with the displacement kill method during a well test in a deep-water gas reservoir: A case study. Processes 2024, 12, 2090. [Google Scholar] [CrossRef]
- Belousov, A.; Lushpeev, V.; Sokolov, A. Hartmann–Sprenger Energy Separation Effect for the Quasi-Isothermal Pressure Reduction of Natural Gas: Feasibility Analysis and Numerical Simulation. Energies 2024, 17, 2010. [Google Scholar] [CrossRef]
- Bondarenko, A.V.; Islamov, S.R.; Ignatyev, K.V.; Mardashov, D.V. Laboratory studies of polymer compositions for well-kill under increased fracturing. Perm J. Pet. Min. Eng. 2020, 20, 37–48. [Google Scholar] [CrossRef] [PubMed]
- Kelebek, S.; Demir, U.; Sahbazet, O. The effects of dodecylamine, kerosene and pH on batch flotation of Turkey’s Tuncbilek coa. Int. J. Miner. Process. 2008, 88, 65–71. [Google Scholar] [CrossRef]
- Wang, H.; Dlugogorski, B.Z.; Kennedy, E.M. Coal oxidation at low temperatures: Oxygen consumption, oxidation products, reaction mechanism and kinetic modelling. Prog. Energy Combust. Sci. 2003, 29, 487–513. [Google Scholar] [CrossRef]
- Shobhana, D. Enhancement in hydrophobicity of low rank coal by surfactants—A critical overvie. Fuel Process. Technol. 2012, 94, 151–158. [Google Scholar]
- Xia, W.; Xie, G.; Liang, C. Flotation behavior of different size fractions of fresh and oxidized coals. Powder Technol. 2014, 267, 80–85. [Google Scholar] [CrossRef]
- Wang, H.; Dlugogorski, B.Z.; Kennedy, E.M. Analysis of the mechanism of the low-temperature oxidation of coal. Combust. Flame 2003, 134, 107–117. [Google Scholar] [CrossRef]
- Eterigho-Ikelegbe, O.; Yoro, K.O.; Bada, S. Coal as a filler in polymer composites: A review. Resour. Conserv. Recycl. 2021, 174, 105756. [Google Scholar] [CrossRef]
- Zhang, S.; Zhang, X.; Hao, Z. Dissolution behavior and chemical characteristics of low molecular weight compounds from tectonically deformed coal under tetrahydrofuran extraction. Fuel 2019, 257, 116030. [Google Scholar] [CrossRef]
- Kawashima, H.; Takanohashi, T. Modification of model structures of upper freeport coal extracts using 13C-NMR chemical shift calculation. Energy Fuels 2001, 15, 591–598. [Google Scholar] [CrossRef]
- Zhang, X.; Zhang, S.; Li, P. Investigation on solubility of multicomponents from semi-anthracite coal and its effect on coal structure by Fourier transform infrared spectroscopy and X-ray diffraction. Fuel Process. Technol. 2018, 174, 123–131. [Google Scholar] [CrossRef]
- Feng, W.; Li, Z.; Gao, H.; Wang, Q.; Bai, H.; Li, P. Understanding the Molecular Structure of HSW Coal at Atomic Level: A Comprehensive Characterization from Combined Experimental and Computational Study. Green Energy Environ. 2021, 6, 150–159. [Google Scholar] [CrossRef]
- Lian, L.; Qin, Z.; Li, C.; Zhou, J.; Chen, Q.; Yang, X.; Lin, Z. Molecular Model Construction of the Dense Medium Component Scaffold in Coal for Molecular Aggregate Simulation. ACS Omega 2020, 5, 13375–13383. [Google Scholar] [CrossRef] [PubMed]
- Zhang, Z.; Kang, Q.; Wei, S.; Yun, T.; Yan, G.; Yan, K. Large Scale Molecular Model Construction of Xishan Bituminous Coal. Energy Fuels 2017, 31, 1310–1317. [Google Scholar] [CrossRef]
- Zhang, J.; Weng, X.; Han, Y.; Li, W.; Cheng, J.; Gan, Z.; Gu, J. The Effect of Supercritical Water on Coal Pyrolysis and Hydrogen Production: A Combined ReaxFF and DFT Study. Fuel 2013, 108, 682–690. [Google Scholar] [CrossRef]
- Zheng, M.; Li, X.; Liu, J.; Wang, Z.; Gong, X.; Guo, L.; Song, W. Pyrolysis of Liulin coal simulated by GPU-based ReaxFF MD with cheminformatics analysis. Energy Fuels 2014, 28, 522–534. [Google Scholar] [CrossRef]
- Hatcher, P.G. Chemical structural models for coalified wood (vitrinite) in low rank coal. Org. Geochem. 1990, 16, 959–968. [Google Scholar] [CrossRef]
- Meng, J.Q.; Zhong, R.Q.; Li, S.C.; Yin, F.F.; Nie, B.S. Molecular model construction and study of gas adsorption of Zhaozhuang coal. Energy Fuel 2018, 32, 9727–9737. [Google Scholar] [CrossRef]
- Guo, S.; Geng, W.; Yuan, S.; Yi, C.; Dong, Z.; Xu, J. Understanding the Molecular Structure of Datong Coal by Combining Experimental and Computational Study. J. Mol. Struct. 2023, 1279, 135035. [Google Scholar] [CrossRef]
- Li, N.; Zhu, M.; Zhang, J.; He, B.; Li, Z.; Wu, Y.; Wu, J.; Zhang, H.; Bai, H. Features and insights for molecular structure of Chinese Taixi anthracite at atomic scale. J. Mol. Struct. 2024, 1308, 138071. [Google Scholar] [CrossRef]
- Liu, J.; Jiang, Y.; Yao, W.; Jiang, X.; Jiang, X. Molecular Characterization of Henan Anthracite Coal. Energy Fuels 2019, 33, 6215–6225. [Google Scholar] [CrossRef]
- Qin, X.; Yang, T.; Liu, Z. Molecular structure, bond cleavage and their relation of four low rank coals. Fuel Process. Technol. 2022, 236, 107391. [Google Scholar] [CrossRef]
- Lin, H.; Wang, Y.; Gao, S.; Xue, Y.; Yan, C.; Han, S. Chemical Structural Characteristics of High Inertinite Coal. Fuel 2021, 286, 119283. [Google Scholar] [CrossRef]
- GB/T212 2008; Proximate Analysis of Coal. Standards Press of China: Beijing, China, 2008.
- GB/T476 2008; Determination of Carbon and Hydrogen in Coal. Standards Press of China: Beijing, China, 2008.
- GB/T6948-2008; Method of Determining Microscopically the Reflectance of Vitrinite in Coal. Standards Press of China: Beijing, China, 2008.
- Xiang, J.; Zeng, F.; Bin, L.I. Construction of macromolecular structural model of anthracite from Chengzhuang coal mine and its molecular simulation. J. Fuel Chem. Technol. 2013, 41, 391–400. [Google Scholar] [CrossRef]
- Zhang, Y.; Hu, S.; Zhong, Q. A large-scale molecular model of Fenghuangshan anthracite coal. Fuel 2021, 295, 120616. [Google Scholar] [CrossRef]
- Chang, Z.; Chen, X.; Peng, Y. Understanding and improving the flotation of coals with different degrees of surface oxidation. Powder Technol. 2017, 321, 190–196. [Google Scholar] [CrossRef]
- Zhang, Y.; Jing, X.; Jing, K. Study on the pore structure and oxygen-containing functional groups devoting to the hydrophilic force of dewatered lignite. Appl. Surf. Sci. 2015, 324, 90–98. [Google Scholar] [CrossRef]
- Zhao, Q.; Wang, X.; Tan, H. Co-pyrolysis of pyridine and pyrrole as nitrogenous compounds model of coal. Asian J. Chem. 2010, 22, 6998. [Google Scholar]
- Meng, L.; Zhang, X.; Li, N. Study on sulfur transformation during the drying of Lignite and sulfur distribution in pyrolysis. J. Anal. Appl. Pyrolysis 2024, 180, 106535. [Google Scholar] [CrossRef]
- Zhang, S.; Zhang, C.; Zhang, M. Model construction and optimization of coal molecular structure. J. Mol. Struct. 2023, 1290, 135960. [Google Scholar] [CrossRef]
- Vandenbroucke, M.; Largeau, C. Kerogen origin, evolution and structure. Org. Geochem. 2007, 38, 719–833. [Google Scholar] [CrossRef]
- Yan, J.; Lei, Z.; Li, Z. Molecular structure characterization of low-medium rank coals via XRD, solid state 13C-NMR and FTIR spectroscopy. Fuel 2020, 268, 117038. [Google Scholar] [CrossRef]
- Shi, Y.; Zhu, Y.; Chen, S. Structural characterization and molecular model construction of lignite: A case of xianfeng coal. Energies 2024, 17, 1049. [Google Scholar] [CrossRef]
- Fang, X.U.; Hui LI, U.; Qing, W. Comparison of Huolinhe lignite structural features by using 13C-NMR & FTIR techniques. CIESC J. 2017, 68, 4272. [Google Scholar]
- Qian, L.; Tao, C.; Ma, C. Construction of a macromolecular structure model for Zhundong subbituminous coal. J. Mol. Struct. 2022, 1248, 131496. [Google Scholar] [CrossRef]
- Feng, L.; Zhao, G.; Zhao, Y. Construction of the molecular structure model of the Shengli lignite using TG-GC/MS and FT-IR spectrometry data. Fuel 2017, 203, 924–931. [Google Scholar] [CrossRef]
- Li, H.; Wang, Q.; Dai, C. Molecular structure modeling and comparative analysis of macerals inertinite concentrates from Lingwu and Qinghua bituminous coals. J. China Coal Soc. 2022, 47 (Suppl. S1), 171–183. [Google Scholar]
- Fu, Y. Study on structural evolution characteristics of structural coal macromolecular structure based on infrared spectroscopy and nuclear magnetic resonance. Fresenius Environ. Bull. 2020, 29, 9043–9054. [Google Scholar]
- Jia, J.; Wang, D.; Li, B. Study on molecular structure characteristic and optimization of molecular model construction of coal with different metamorphic grade. J. Mol. Struct. 2024, 1295, 136655. [Google Scholar] [CrossRef]


Disclaimer/Publisher’s Note: The statements, opinions and data contained in all publications are solely those of the individual author(s) and contributor(s) and not of MDPI and/or the editor(s). MDPI and/or the editor(s) disclaim responsibility for any injury to people or property resulting from any ideas, methods, instructions or products referred to in the content. |
© 2025 by the authors. Licensee MDPI, Basel, Switzerland. This article is an open access article distributed under the terms and conditions of the Creative Commons Attribution (CC BY) license (https://creativecommons.org/licenses/by/4.0/).