Abstract
This paper explores the innovative application of Geographic Information Systems (GISs) to identify and utilize waste heat sources from railway and highway tunnels for fifth-generation district heating and cooling (5GDHC) systems. Increasing the number of prosumers—entities that produce and consume energy—within 5GDHC networks enhances their efficiency and sustainability. While potential sources of waste heat vary widely, this study focuses on underground car/railway tunnels, which typically have a temperature range of 20 °C to 40 °C. Using GIS software, we comprehensively analyzed tunnel locations and their potential as heat sources in Belgium. This study incorporates data from various sources, including OpenStreetMap and the European Waste Heat Map, and applies a two-dimensional heat transfer model to estimate the heat recovery potential. The results indicate that railway tunnels, especially in the southern regions of Belgium, show significant promise for waste heat recovery, potentially contributing between 0.8 and 2.9 GWh annually. The integration of blockchain technology for peer-to-peer energy exchange within 5GDHC systems is also discussed, highlighting its potential to enhance energy management and billing. This research contributes to the growing body of knowledge on sustainable energy systems and presents a novel approach to leveraging existing district heating and cooling infrastructure.
1. Introduction
The transition to sustainable energy systems is a critical global priority in the face of climate change and the depletion of traditional fossil fuel resources. Among the various innovative approaches being developed, fifth-generation district heating and cooling (5GDHC) systems stand out for efficiently balancing energy production and consumption through a decentralized, prosumer-based model. Prosumers—entities that both produce and consume energy—are central to the functionality and efficiency of these systems, as they enable localized energy exchange and reduce reliance on external energy sources.
One of the key challenges in optimizing 5GDHC systems is identifying and integrating additional waste heat sources, which can significantly enhance system efficiency and sustainability. Waste heat, which is a byproduct of industrial processes, transportation infrastructure, and various urban activities, represents a largely untapped resource that can be harnessed to meet heating and cooling demands. However, the potential sources of waste heat vary widely in terms of their temperature ranges, availability, and geographical distribution, necessitating tailored methods for their identification and utilization.
Potential sources of waste heat differ from source to source. For instance, Meibodi et al. [1] present seven potential types (Table 1).

Table 1.
Sources of waste heat and the temperature ranges at which it is available. Adapted from [1].
The research of Wirtz et al. [2] summarizes 53 existing 5GDHC systems in Germany (Table 2).
Table 2.
Sources of energy for existing 5GDHC systems in Germany. Adapted from [2].
In Millar et al.’s paper [3], the focus is not just on waste heat in 5GDHC systems but also on the concept of prosumers (Table 3).
Table 3.
Summary of the buildings considered prosumers for the 5GDHC system. Adapted from [3].
The European Waste Heat Map [4], where waste heat was categorized into seven types, was probably the first research project to be scouted on the European scale (Table 4).
Table 4.
Types of waste heat considered for energy systems in [4].
Hsu et al. [5] depict a schematic diagram of a district cooling system utilizing waste heat with the help of an absorption chiller and having the following components:
- A hot water pump to circulate hot water;
- An absorption chiller that utilizes waste heat to produce chilled water;
- A heat exchanger to transfer energy between hot and chilled water;
- A cooling tower that cools the chilled water;
- A chilled water tank to store chilled water;
- Primary and secondary chilled water pumps to circulate chilled water;
- A fan coil unit (FCY) installed for the cooling inside a building.
Albert et al. [6] list sources of waste heat in the UK, e.g., dairies. They point out that a significant amount of waste heat can be captured through plate heat exchangers during milk processing to enable energy recovery. Another application is common for the industry’s refrigeration processes, because dairy products are stored at 3 °C. The authors show the locations of dairies in the UK and highlight other potential candidates for waste utilization. They summarize the data regarding the temperatures and durations for brewing and pasteurization processes, energy-saving techniques, and milk refrigeration details.
The Nordic regions benefit most from waste heat recovery as they typically have higher heating demands. For instance, Alisawi et al. [7] study the energy efficiency of buildings in Ireland using the data from three sources: the GeoDirectory database, the EPC dataset, and the Irish retrofit housing scheme dataset. However, all these datasets were unavailable for this present case study.
Zhang et al. [8] suggest a data center as a promising source of waste heat and present the influence of the location on the cost of energy. The amount of heat available also depends on the location of a data center. Those in cooler climates have more economizer hours than those in warmer ones. Moreover, in Nordic countries, engineers may choose to use the economizer hours, although active cooling methods are usually more efficient, especially if the cost of electricity is high.
Geographic Information Systems (GISs) are usually employed to cover all these location-specific aspects and to work with large coordinate-based databases. Various locations worldwide are presented in a GIS, and its application typically depends on access to databases [9]. Kuznik et al. [9] observe this with the problem of topologically unclosed geometries, multiple facets in collinear surfaces, or incorrect building splitting. However, studying a district energy system obviously requires various information about the location, which is often an issue. In this study, the various sources of district-scale data were incorporated, particularly with the help of GIS software. Pandapipes, described in [10], is another tool adaptable for GIS applications and suitable for steady-state fluid network simulations across various generations of district heating networks. It computes decoupled hydraulics and thermal transfer using a node method and the Newton–Raphson solver. A limitation of Pandapipes lies in its embedded component functions within the simulation procedure, restricting the integration of custom components without altering the source code. Additionally, it lacks built-in models for determining heat transfer coefficients, requiring user input [10].
In [11], the GIS software with a simulation add-on was applied to evaluate the evolution of the temperature in time within the network. A Python script was used to incorporate operational data on energy consumption. Jebamalai et al. [12] used commercial Comsof software, presenting the high-level methodologies behind the automated GIS-based tool. In contrast, the methodology in this study is proprietary, novel, robust, and general enough that it results in an easy comparison scenario for different case studies inputting the same dataset and does not lead to using any commercial software to identify promising locations. In [13], GIS software was used to evaluate natural gas consumption by assuming a breakpoint distance of 20 m between the location and the natural gas pipeline. Only topologically correct information on utilities and connected buildings was claimed to be an input.
In geospatial technology, the hybridization of GISs and the Global Positioning System (GPS) has emerged as a valuable tool for detecting and pinpointing underground utilities while aligning the collected data to a unified coordinate system. Li et al. [14] proved a hybrid approach to be particularly effective in surveying shallow utilities buried at depths of less than 1.5 m, boasting horizontal locating errors within ±100 mm and vertical locating errors within ±300 mm. Incorporating technology enhances precision and facilitates quality assurance practices for data users, e.g., engineers and researchers. Despite these advancements, a critical gap persists in meeting the stringent requirements of utility stakeholders, who often demand locating errors of less than 100 mm, especially at greater depths extending to 3 m below the surface level. This underscores the ongoing need for GIS technology advancements to align with utility stakeholders’ exacting standards, especially before contacting buildings’ owners.
In the landscape of energy efficiency assessments for residential buildings, the Flemish Energy Performance Certificate (EPC) is a comprehensive tool encompassing an energy indicator, recommendations for enhancing energy efficiency, and technical details. Taranu et al. [15] focused on the EPC scheme within the residential sector, emphasizing the energy indicator. Notably, the version of the certificate employed in Flanders since 2008 and slated for replacement in January 2019 is at the core of the investigation. As of the time of this research, the new iteration of the certificate remained in a preliminary phase, undergoing trials. Through extensive research, including the findings presented within this paper, insights have emerged regarding alterations between the preliminary test version and the final version launched in January 2019. This elucidates the evolving nature of energy certification frameworks within the residential domain.
In [16], the “winter Energy Performance Index” (EPI) served as similar to the EPC fundamental metric, also expressing the yearly thermal energy demand for heating in kilowatt-hours per square meter per year (kWh/m2⋅year). This parameter is pivotal in evaluating the potential coverage of district heating networks when implemented with GIS software, as evidenced by Cioccolanti et al. [16]. Specifically, calculating specific energy consumption aligns with the directives outlined in the European legislation concerning building energy performance. Notably, this research meticulously considered various parameters specific to the locations that house paper mills. These parameters included the average floor area of residential buildings, sourced from the latest census data provided by the National Statistics and the Heating Degree Days (HDDs), offering insights into each location’s climatic conditions and heating requirements.
Another focus is identifying a promising location for thermal energy storage, which is limited by available surface area and underground spatial structures. One of the most common combinations employed is image vectorization and GIS tools. In [17], with the help of GISs, the potential for thermal energy storage for waste heat was studied. The authors also worked at the helicopter-level view and used GIS software. They first claim that all aquifers are, in principle, good candidates for thermal use but conclude that further information should be consulted to decide on their suitability for energy applications. To compare, Jbaihi et al. [18] reported scenarios for wet and dry cooling in Morocco to evaluate the suitability of hosting district energy systems, PVs, and hybrid power plants. This study concerned the development of a database with the help of an add-in discrete differentiation operator and a GIS to provide a standalone tool [19] for identifying the low-scale sources of waste heat, such as chillers and cooling machines. In [20], the applicability of ArcUHI was verified with the help of a case study of the residential area of Madrid (Spain) affected by an urban heat island effect, but this lies outside the scope of this present research.
GIS software can also be crucial in managing energy storage data, enabling the display of locations, depths, and associated attributes on maps. Overlaying energy data with other spatial information, such as land use and hydrogeology, allows for comprehensive analysis [19]. Despite its value, storage-informed data can be complex due to varying geological conditions, requiring expertise in geology, hydrogeology, and environmental science for interpretation. Boreholes, drilled holes in the ground used for various purposes such as groundwater monitoring, geotechnical investigations, or mineral exploration, represent key data points [21]. They are typically located at specific coordinates, with depth measurements crucially indicating the hole’s extent into the Earth’s subsurface, often recorded in hundred meters [22]. Serving different aims, boreholes can be drilled to access groundwater, study soil and rock properties, conduct environmental monitoring, or conduct mineral exploration [23]. Parameters like water level, soil types, rock types, chemical composition, and temperature changes with depth are commonly measured [24,25]. Data collection during drilling and subsequent monitoring utilizes instruments like piezometers, temperature probes, and sampling tools, with the data often stored in databases or GIS systems for analysis [17]. GIS software can also be used for spatial and land planning. For instance, agricultural areas and residential zones can be identified with the help of satellite images and used as spatial constraints.
Unlike [26], we utilize the benefits of the top–down approach, avoiding non-linear methods. Nevertheless, the result drastically depends on the quality of the GIS data. However, the GIS data are not the only input for the methodology. Possible inputs to study the building energy consumption and match it with the waste heat production are humidity, sea level, air pressure, wind direction, speed, cloudiness, and other weather variables. These inputs (outdoor air and soil temperatures, humidity, wall angle, and specific heat gains) are gathered with the help of similar methods [27]. When making a manual analysis, combined with the help of VAMPIRE software, of a case study object with known energy consumption, Leggiero et al. [27] found good agreement with the measured reference data, hence validating the viability of VAMPIRE’s base of methodology. The difference is that energy consumption was not available; furthermore, the measured surface area and temperature gradient are inputs to assess available waste heat and heat losses according to several scenarios.
The difference is an emphasis on the open-source data, as no hourly historical data of the energy flows within a district energy system are available since they do not exist for the studied areas. In [28], a minimum spanning tree on the GIS map is applied for each identified potentially viable area, avoiding building shapes but connecting all the nodes to achieve the minimum network length. We avoid this phase. Another difference is the vast application of aerial photos. Rakha et al. [29] used Pix4D software to generate a 3D point cloud from the 2D images shot during a UAS flight. They emphasized the applicability of other 3D modeling and CAD software such as Rhino3D. Moreover, this is compatible with a .FBXfile format, which makes it possible for a 3D model to maintain render and texture capabilities. This format is applicable for rendering and 3D printing. Unlike Rakha et al. [29], we apply the Roberts cross edge detection and Sobel edge detection (the Sobel–Feldman operator) methods. These methods provide comprehensive image post-processing. The output includes the indicators of how efficiently the images are used to generate the model and includes image overlap, location, and other GIS-related information. Rakha et al. [29] also generate this output, which eases the image recognition process and may influence future flight patterns.
At the country scale, GIS software operates with large databases (more than 1 billion records) and can be considered a big data system. Such software platforms include Hadoop, Apache Storm, Apache Spark, Greenplum, SAP HANA, etc. Li et al. [30] illustrate the functions and potential software platforms in contemporary big data systems when applied to district energy systems (such as 5GDHC). Big data platforms convert raw data into processed data using the following processing stages:
- Data storage: the raw data are stored, often in distributed storage systems like Hadoop.
- Data processing: Apache Storm and Apache Spark handle real-time and batch processing.
- Data mining: Greenplum Database and SAP HANA are used for data mining and analytics.
The processed data can be used for various purposes:
- Prediction: predictive models can forecast energy production or demand.
- Optimization: algorithms optimize energy grid operations.
- Applications: AI development, as well as testing and updating models.
The raw data imply data from various sources, such as sensors, devices, or other data collection methods.
Applying these platforms would be interesting in modeling a 5GDHC system at the operational stage to unlock its key feature of peer-to-peer energy exchange between the prosumers. However, they should first be identified (a) and located (b): (a), the identification process has been well covered in the literature and supported by the literature review above; however, for (b), GIS-driven methods focusing on railway/highway tunnels have never been applied. This paper aims to develop such a method while scouting railway/highway tunnels as sources of waste heat for 5GDHC, which is considered a novelty and a contribution to the pool of knowledge of the present research.
This paper focuses on the innovative application of GISs for scouting waste heat sources from railway and highway tunnels, a relatively underexplored but promising avenue for 5GDHC systems. Railway and highway tunnels represent a valuable but often overlooked waste heat source with their substantial heat retention and consistent temperature profiles. By leveraging the capabilities of GISs, this study aims to systematically identify and evaluate these tunnels’ potential to contribute to 5GDHC systems.
This research includes a comprehensive review of existing waste heat sources and their integration into 5GDHC systems, focusing on the novel application of GISs to map and analyze the thermal potential of railway and highway tunnels in Belgium. This study employs advanced GIS software and a two-dimensional heat transfer model to estimate the heat recovery potential from these tunnels, providing a detailed assessment of their viability as heat sources.
The relevance of this research is multifaceted. Firstly, it contributes to the broader goal of enhancing the sustainability and efficiency of urban energy systems by identifying new, localized sources of renewable heat. Secondly, it addresses the technical and logistical challenges of integrating diverse heat sources into 5GDHC networks, offering a scalable and replicable methodology for other regions and infrastructure types. Lastly, by incorporating blockchain technology for energy exchange and management, this study underscores the potential for innovative digital solutions to optimize the performance and resilience of 5GDHC systems.
In summary, this research aims to expand the knowledge base and practical toolkit for sustainable urban energy management by exploring the untapped potential of railway and highway tunnels as waste heat sources. This study provides a novel and impactful contribution to renewable energy and district heating and cooling systems by integrating GIS-driven methods and energy modeling aspects.
2. Materials and Methods
The system includes the main heat sources, such as railway tunnels, metro stations, or industrial facilities, and heat exchangers installed to capture thermal energy. The system enables the transportation of the captured heat through the pipelines of the 5GDHC network, ensuring energy distribution to prosumers like residential buildings, commercial establishments, or industries (Figure 1).
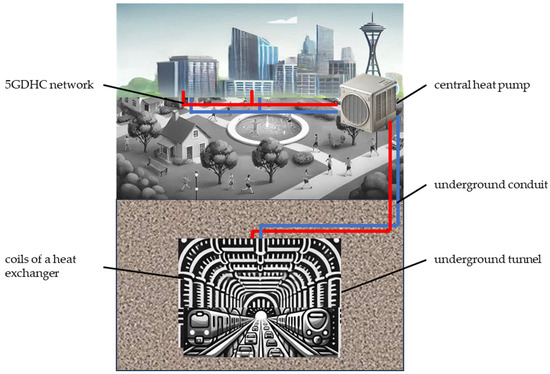
Figure 1.
A general diagram depicting the location of heat exchangers in a 5GDHC system with simplified schematic key components and their placement within the network.
The benefits obtained through energy recovery are multidimensional, encompassing environmental, operational, and financial advantages. From a cost perspective, utilizing waste heat significantly reduces reliance on conventional energy sources, lowering the operational expenses associated with heating and cooling. Furthermore, energy recovery minimizes energy wastage and promotes sustainability, aligning with global initiatives for reducing carbon emissions.
The two-dimensional heat transfer model is based on the following equation [31]:
where αi is the thermal diffusivity of the i-th component [m2/s];
- Ti(r,θ,t) is the transient temperature field of the i-th component [K];
- r is the radial coordinate [m];
- θ is the circumferential coordinate [m];
- t is time [s];
- ki(r,θ,t) is the thermal conductivity of the i-th component [W/mK];
- Qi(r,θ,t) is the heat source term of the i-th component [W].
This equation describes the heat conduction in a cylindrical multilayer medium with heat sources. The left-hand side of the equation represents the temperature change rate with time, while the right-hand side represents the heat transfer due to conduction and heat sources.
The amount of energy transferred between the source of waste heat and the surrounding ground/air Q(t) [W] [31] is as follows:
where Tout(t) is the time-varying outlet temperature of heat transfer medium [°C];
- Tin(t) is the medium inlet temperature [°C];
- ρf is the density of the medium in the pipes [kg/m3];
- Vf is its average velocity [m/s];
- Apipe is the inner cross-section area of the pipes [m2];
- Cpf is the specific heat capacity of the heat medium [J/(kg K)].
The specific (per m2 component) amount of energy transferred is then expressed as q(t) [W/m2] [31]:
where Asurface is the surface area of the heat exchangers [m2].
For some sources of waste heat, the annual distribution of temperatures can be quite accurately simulated using periodic functions. For instance, the equation for the tunnel air temperature profile along the tunnel is as follows [31]:
where Tair(x,t) is the tunnel air temperature at distance x from the portal at time t [°C], Tsurfacemax the maximum surface air temperature over a certain period (e.g., one year) [°C], Tsurfaceavg the average surface air temperature over a certain period (e.g., one year) [°C], x the distance from the location in the tunnel to the nearest tunnel portal [m], Atunnel the area of the tunnel cross-section [m2], t time [s], and n an empirical factor of 0.128 [-].
By employing these models, predicting the quantity of waste heat recoverable in different configurations is possible, providing essential data for estimating cost savings and feasibility. For example, the energy transferred in a heat exchanger setup is expressed as q(t), a critical parameter for calculating cost efficiency in real-world applications. When assessing the temperature profiles in systems such as tunnels, Equation (4) enables the accurate prediction of periodic temperature variations. Such predictive modeling is vital for evaluating the financial viability of waste heat recovery projects.
3. Case Study
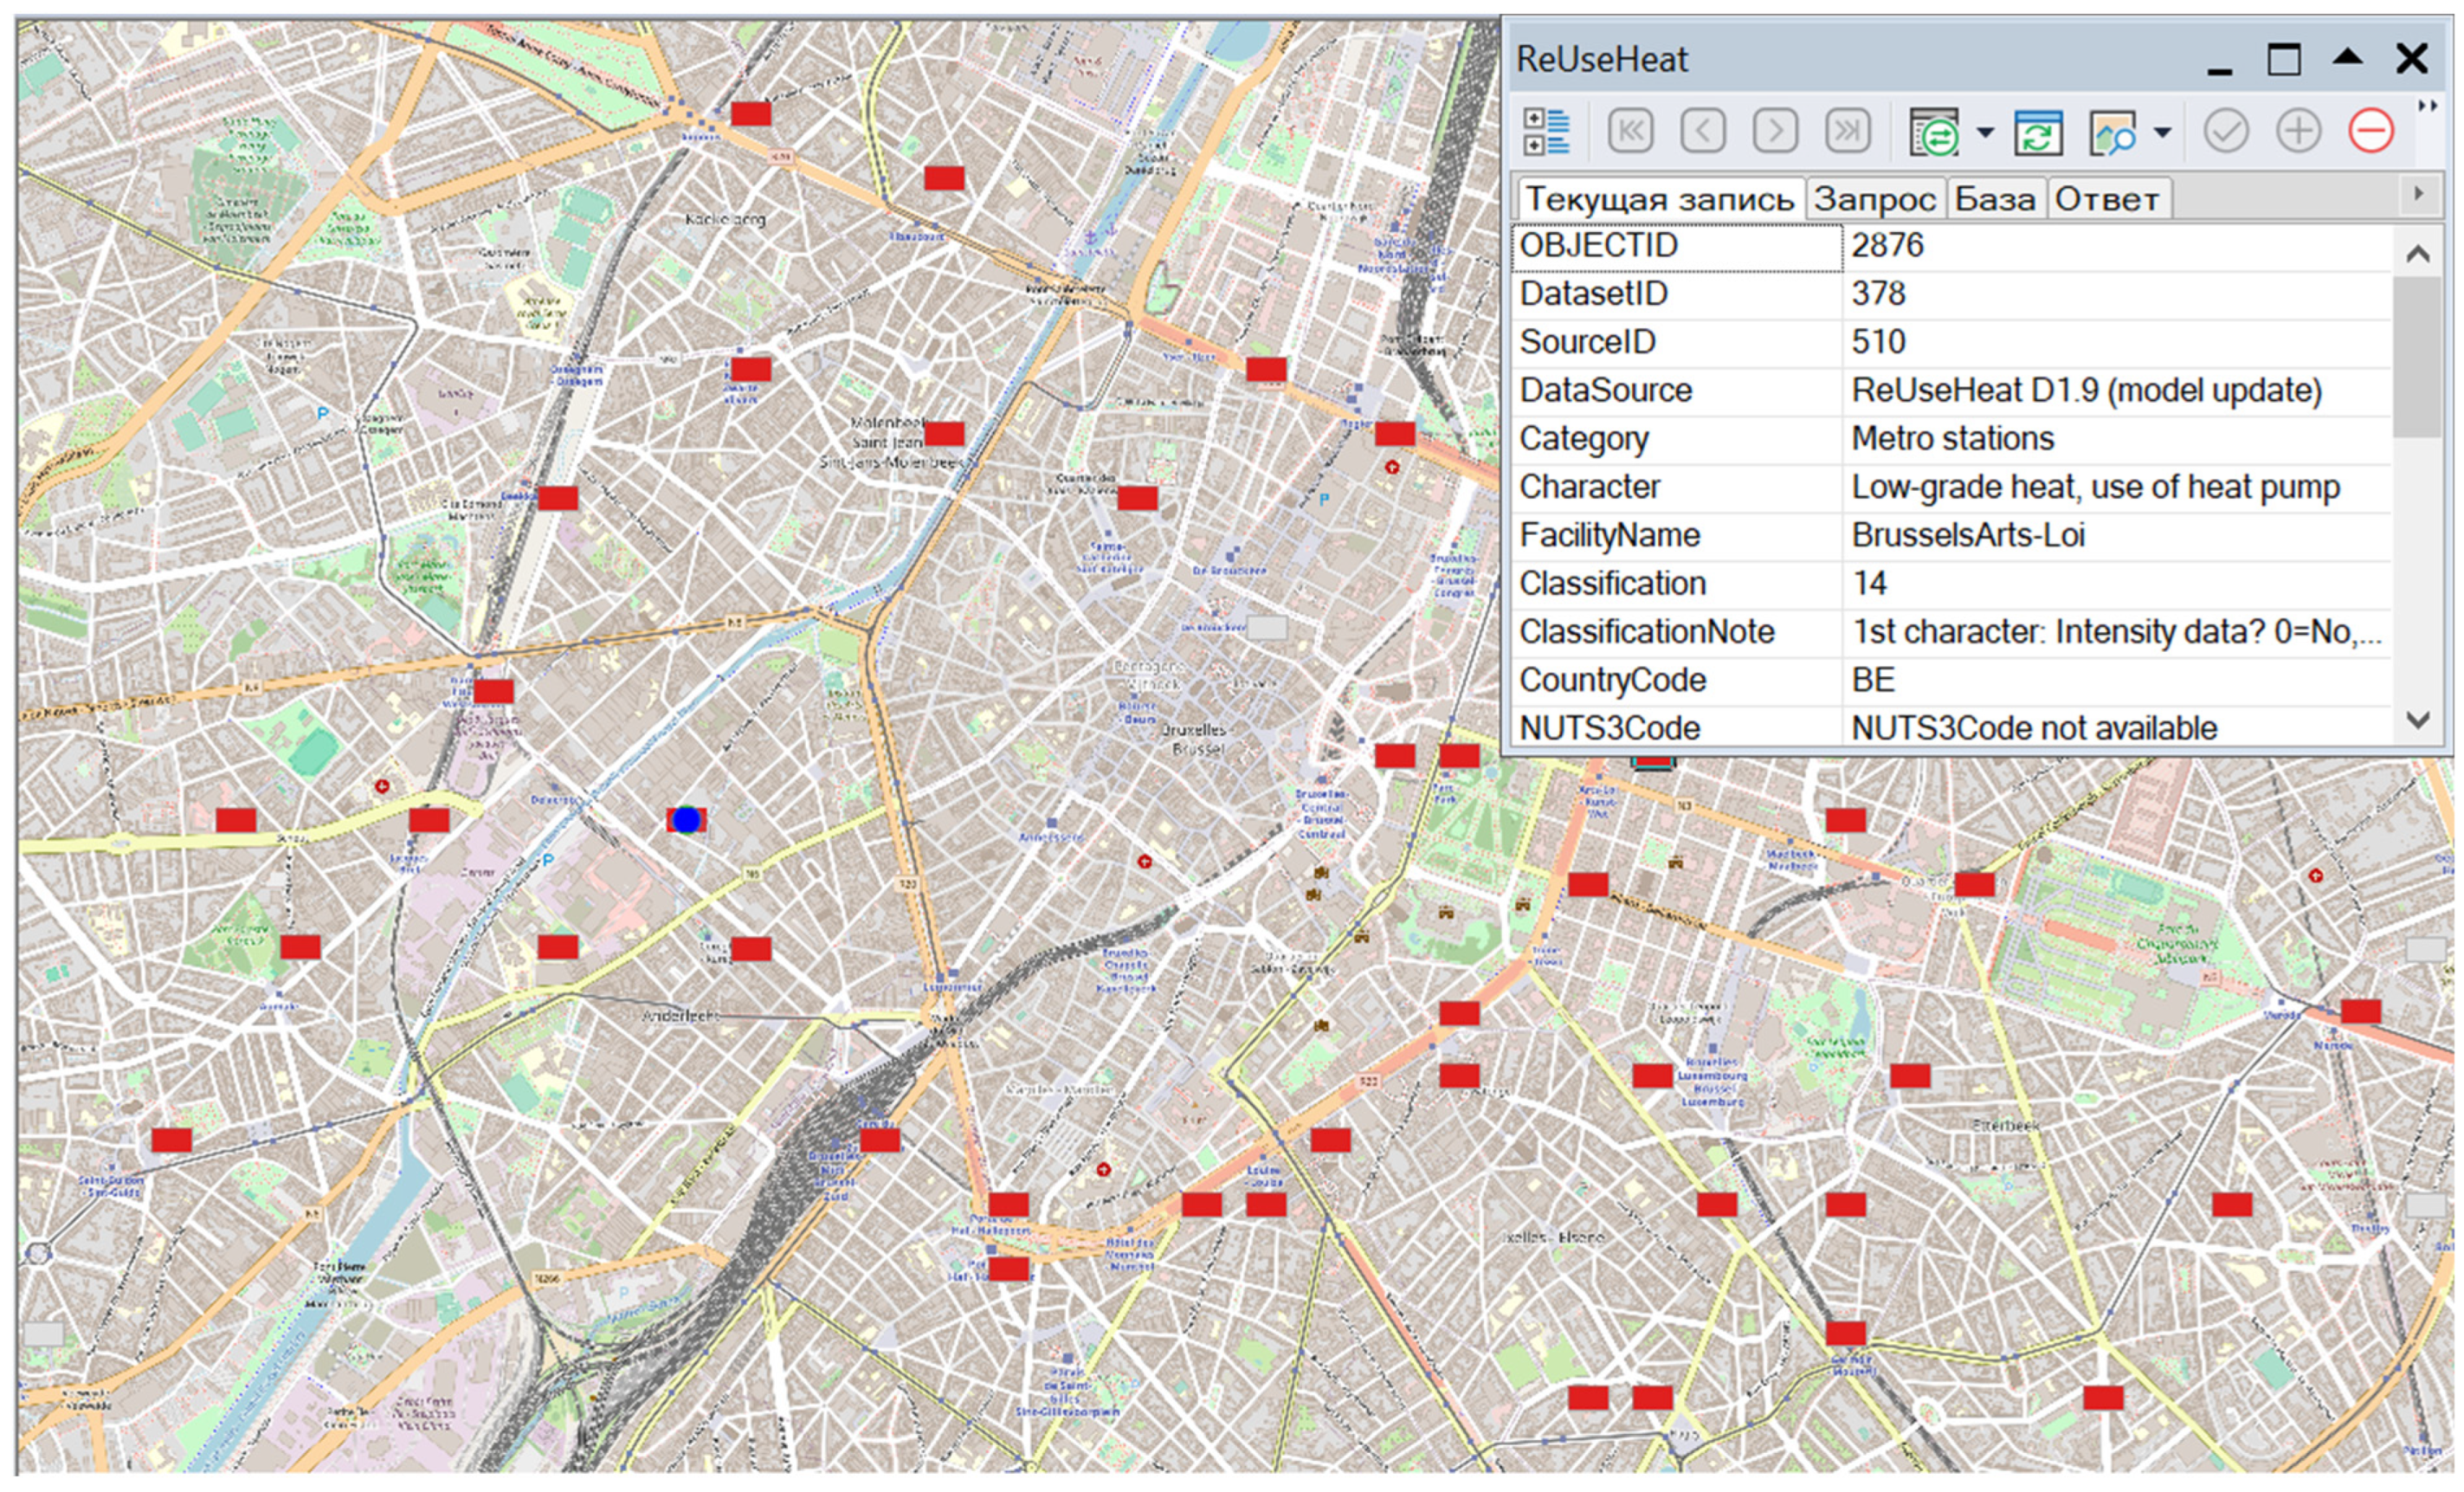
The case study region was Belgium. The databases used were OpenStreetMap [32] and ReUseHeat [4] with the following structure:
- FacilityName: e.g., BrusselsArts-Loi;
- DataSource: always ReUseHeat D1.9 (the model version employed in this present study);
- Category: e.g., metro stations;
- Character: e.g., low-grade heat (assuming the use of heat pumps);
- Classification: e.g., 14 (internal ID);
- CountryCode: always BE (stands for Belgium).
The databases also included reference codes such as ObjectID, DatasetID, SourcelD, and ClassificationNote to distinguish the objects. To look for the data, the OpenStreetMap data were queried. OpenStreetMap is a collaborative project to create a free, editable, and detailed world map. Overpass Turbo, a tool specifically designed for writing Overpass API queries, was used for the querying. The Overpass API allows automatic access to the OpenStreetMap data.
A logical diagram is presented in Figure 2.
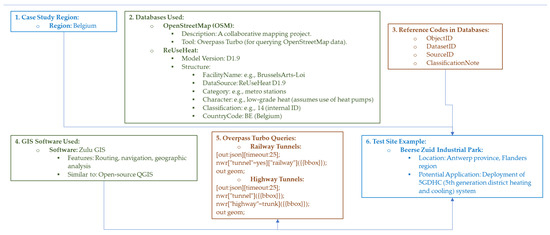
Figure 2.
A flowchart of the research approach.
The GIS software applied was Zulu [33]. This software is similar to the widely employed open-source QGIS and can be used for various purposes, such as routing, navigation, and geographic analysis.
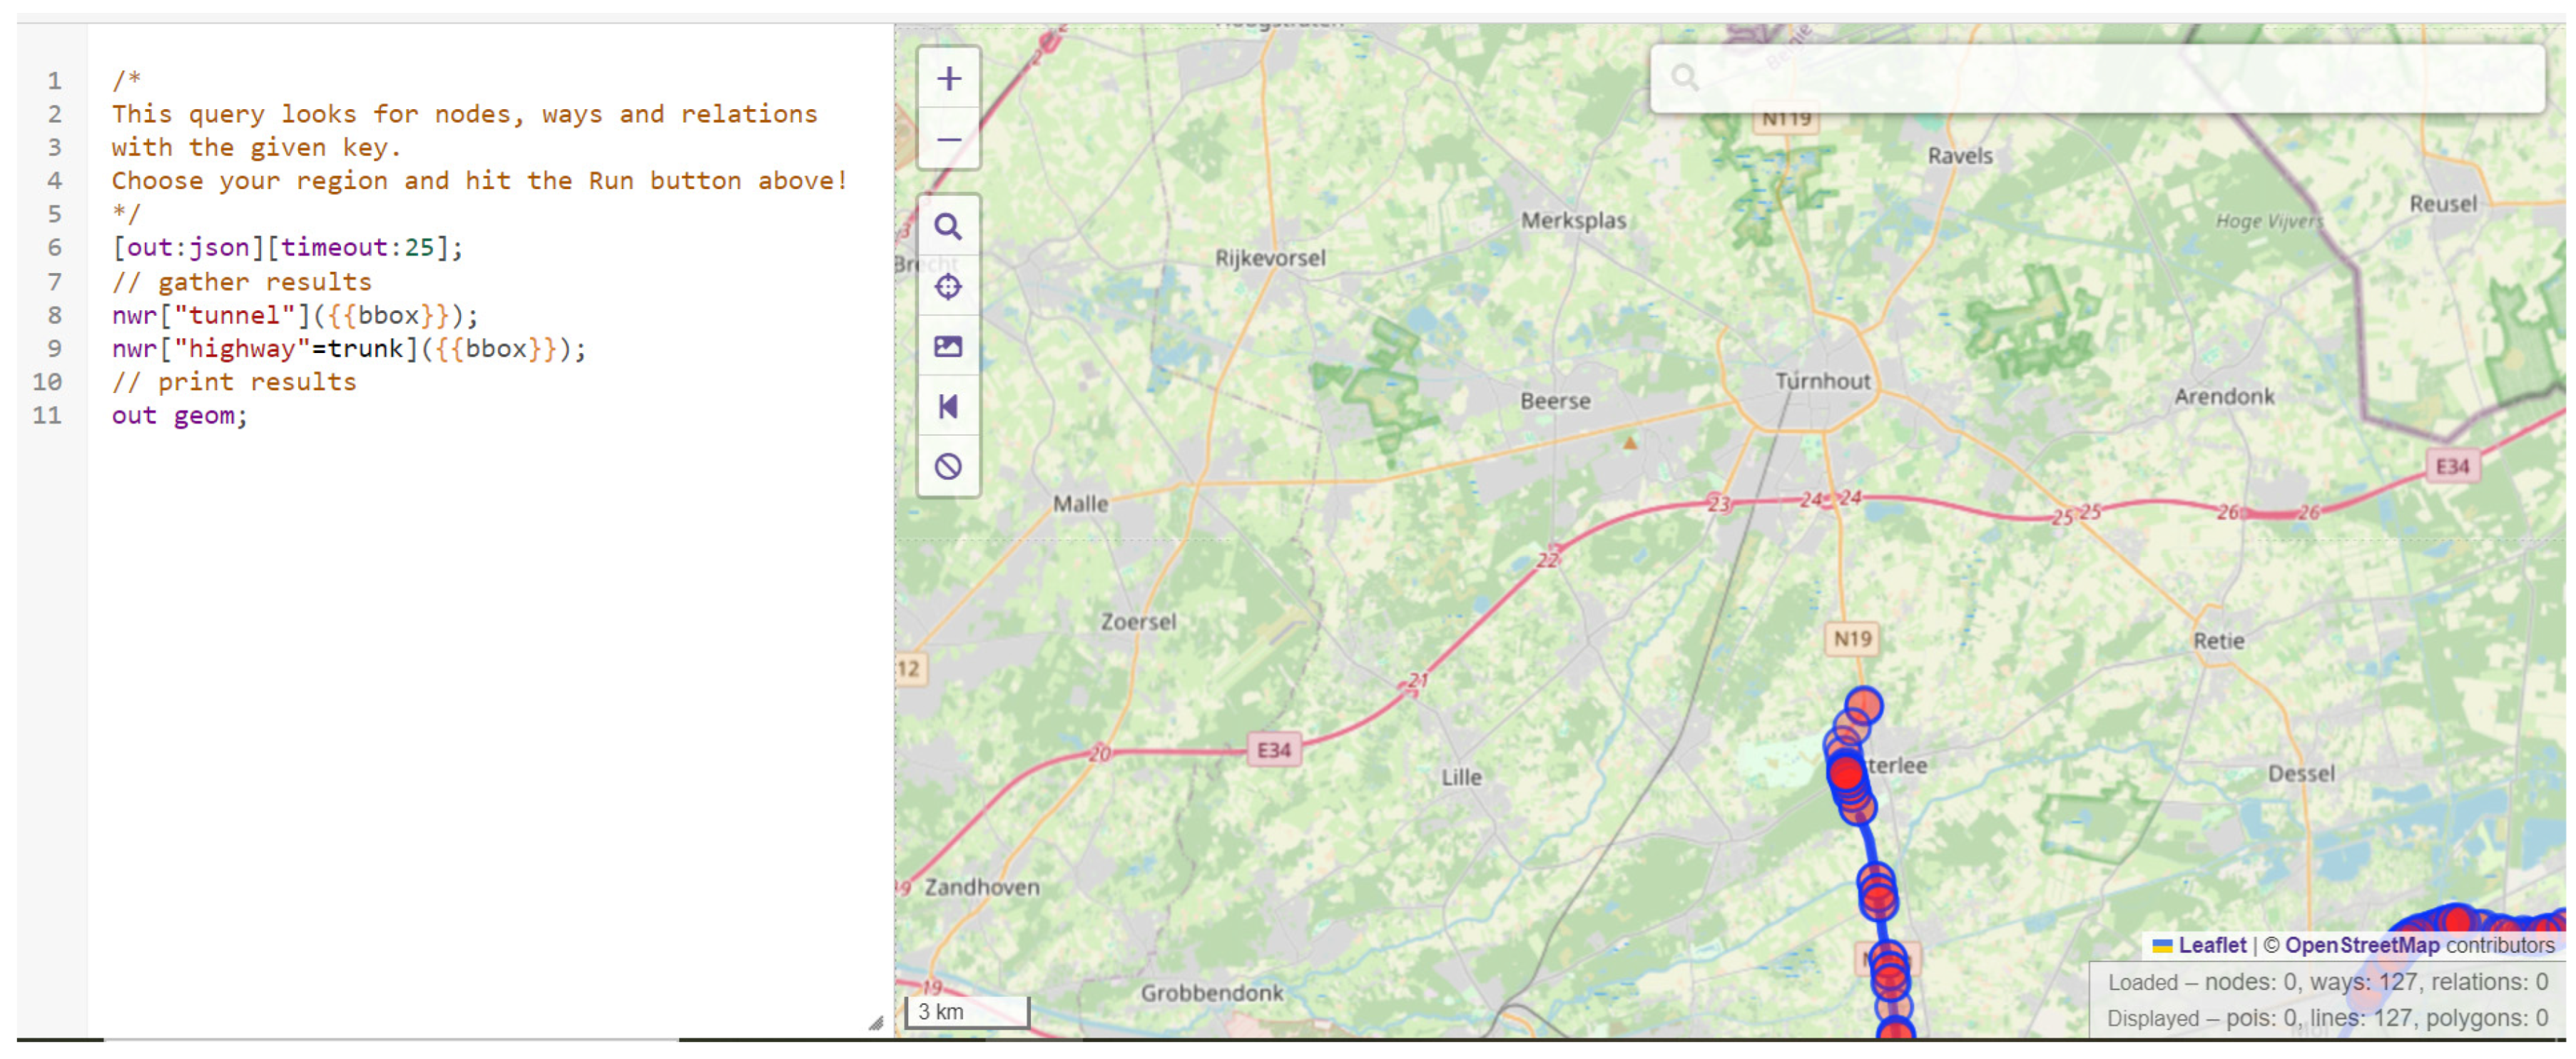
Both highway and railway tunnels were searched using Overpass turbo queries as follows:
For railway tunnels, there was the following:
[out:json][timeout:25];
//gather results
nwr[“tunnel”=yes][“railway”]({{bbox}});
//print results
out geom;
For highway tunnels, there was the following:
[out:json][timeout:25];
//gather results
nwr[“tunnel”]({{bbox}});
nwr[“highway”=trunk]({{bbox}});
//print results
out geom;
This query is an example when searching for nodes, ways, and relations with the key “tunnel” and railway. ‘nwr’ means ‘near way relation’. BeerseZuid Industrial Park (Antwerp province, Flanders region) is an example of a test site where the deployment of the 5GDHC system was considered possible.
4. Results
4.1. Case- and Location-Specific Results
Brussels Capital Region is the only place in Belgium where the utilization of waste heat of subway/metro stations is possible (Figure 3).
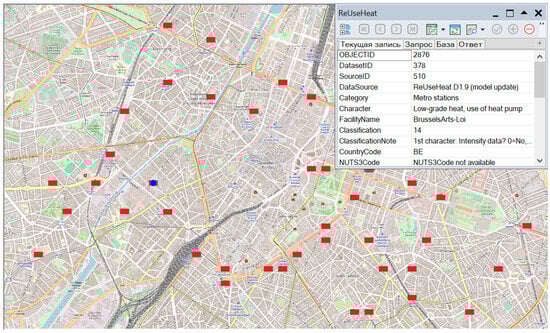
Figure 3.
A screenshot of the GIS software containing information about metro stations. Sources: GIS software [33] and ReUseHeat database [4], with raster OpenStreetMap [32] as a base layer.
BeerseZuid Industrial Park is surrounded by the following settlements: Merksplas, Beerse, Turnhout, Arendonk, Malle, Zoersel, Zandhoven, Grobbendonk, Dessel, and Retie (Figure 4).
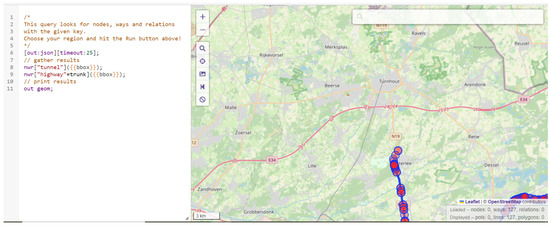
Figure 4.
A snapshot showcasing no road (highway) tunnels next to the BeerseZuid industrial park. Source: Overpass Turbo, a tool used for querying OpenStreetMap data. OpenStreetMap (OSM) is a collaborative project that creates a free and editable world map.
The data types displayed on the map include highways and roads (red and yellow, respectively), as well as tunnels. The map shows points of interest (POIs) represented by blue dots. There are currently 127 potential POIs loaded.
However, there are many more railway tunnels, e.g., in Wallonia (Belgium), next to Liege and the border with Germany (Figure 5).
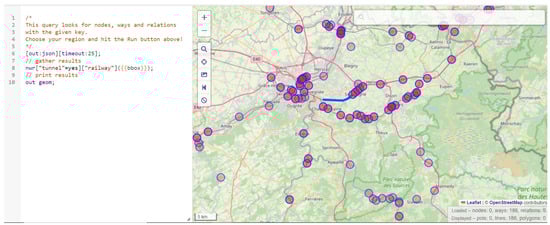
Figure 5.
A screenshot of a map centered around Turnhout (Flanders, Belgium). Source: Overpass Turbo, a tool used for querying OpenStreetMap data. OpenStreetMap is a collaborative project that creates a free and editable world map.
The black lines represent railways. This example suggests that looking for railway tunnels in Belgium’s southern (more hilly) areas is much more promising. To validate these findings, they were compared to the results of a similar analysis presented in [31].
For heat exchangers of 200–300 m, energy recovery is between 0.8 and 2.9 GWh/yr, and it might be feasible to include this energy recovery in some 5GDHC projects (Table 5).
Table 5.
Preliminary estimation of annual heat recovery in railway/highway tunnels. Adapted from [31].
Table 5 provides the preliminary estimates of the annual heat recovery potential, showcasing the variability of heat transfer rates depending on site-specific factors such as geology and infrastructure design. The heat transfer rate has a wide range, from 5 to 74 W/m2. This suggests that the heat transfer rate can vary significantly depending on factors such as the depth of the tunnel, the ground conditions, and the presence of groundwater. The annual heat transfer also has a wide range, from 2 to 2858 MWh/yr. This suggests that the amount of heat transfer can vary significantly depending on the length of the tunnel, the heat transfer rate, and the duration of the heating or cooling season. The average heat transfer rate and annual heat transfer can be used to estimate the heat load on a tunnel project for preliminary design purposes. However, when assessing the potential of heat recovery in a tunnel, it is crucial to consider site-specific factors such as geology, groundwater conditions, and depth.
In Belgium, regions like Wallonia and the Brussels Capital Region present opportunities to leverage the waste heat from transportation tunnels and metro stations. This approach can offset substantial energy costs by integrating the waste heat into 5GDHC systems, reducing dependence on conventional heating methods. The economic benefits of such systems can be fully quantified by considering factors like the cost of energy saved, installation expenses, and maintenance. These systems offer direct cost reductions and provide long-term savings through enhanced energy efficiency and lower carbon emissions.
The case studies also highlight comparisons with other sources, such as industrial processes and data centers. While these sources offer alternative benefits, they often come with limitations like lower operational hours or the need for higher temperature waste heat. Despite these challenges, the financial viability of using the waste heat from tunnels, with its consistent availability and low operational costs, makes it a compelling option for 5GDHC networks.
By focusing on these benefits, this study demonstrates that waste heat recovery from tunnels is cost-effective for achieving energy efficiency and sustainability goals. Future work should explore detailed cost–benefit analyses and policy incentives to promote the adoption of waste heat recovery systems in urban infrastructure further.
The proposed solution of utilizing the waste heat from railway and highway tunnels for 5GDHC systems presents significant energy efficiency and sustainability opportunities. However, a thorough critical analysis is necessary to comprehensively understand its economic and practical implications.
4.2. Costs of Implementing Waste Heat Recovery
The costs associated with implementing waste heat recovery systems include the initial capital expenditure for the system installation, operational expenses, and maintenance. Installing heat exchangers within tunnels requires precision engineering, particularly in retrofitting existing infrastructure. The costs are influenced by the tunnel’s depth, geological conditions, and the design complexity of integrating the heat recovery system. For example, the deeper and more structurally complex a tunnel, the higher the system deployment costs due to increased material, labor, and engineering requirements.
The operational expenses include the energy required to pump the heat transfer medium through the heat exchangers and the electricity consumed by the supplementary systems like the heat pumps. The maintenance costs, while generally lower for well-designed systems, could escalate if unforeseen issues arise, such as corrosion in pipes or the fouling of heat exchangers due to particulate accumulation. These costs could offset the immediate savings from energy recovery, especially during the early operational years of the system.
4.3. Benefits of Waste Heat Recovery
The benefits of implementing waste heat recovery systems are substantial and extend across environmental, operational, and financial dimensions. From a financial standpoint, the direct reduction in heating and cooling costs is the most prominent advantage. For instance, a heat recovery rate between 0.8 and 2.9 GWh/year corresponds to substantial monetary savings, particularly in regions with high energy costs. Over the system’s lifecycle, these savings can outweigh the initial investment, making the project economically viable. Integrating such systems into existing urban energy networks can reduce dependence on fossil fuels, leading to lower exposure to volatile energy prices and enhanced energy security.
The environmental benefits are equally compelling. By capturing and reusing the waste heat, the system reduces the carbon emissions associated with traditional heating and cooling methods. In urban areas like Brussels, where energy demand is high, implementing such systems could significantly reduce the city’s carbon footprint.
4.4. Comparative Analysis
Tunnel-based heat recovery systems provide more consistent and reliable energy yields than alternative waste heat sources such as data centers or industrial processes. Data centers, for instance, operate for limited hours in cooler climates and typically provide low-temperature waste heat, which might necessitate additional processing for integration into 5GDHC systems. While potentially providing higher temperature heat, industrial sources often face logistical challenges related to integrating their outputs into urban energy grids. In contrast, tunnels are geographically stable and often situated near high-demand urban zones, minimizing energy transport losses and enhancing cost efficiency.
4.5. Limitations and Challenges
Despite its benefits, the proposed solution has inherent limitations. The variability of heat transfer rates, ranging from 5 to 74 W/m2, illustrates the dependency of heat recovery potential on site-specific factors such as the tunnel depth, surrounding geology, and groundwater presence. These variations necessitate detailed feasibility studies for each potential site, which can add to the overall project costs.
Another challenge lies in the long payback periods associated with such infrastructure projects. While the system might be economically viable in the long term, the initial investment may deter stakeholders from having access to subsidies or favorable financing options. Furthermore, integrating these systems into existing 5GDHC networks requires significant coordination, including regulatory approvals, design modifications, and synchronization with current energy policies.
4.6. Recommendations for Maximizing Cost–Benefit Outcomes
To address these challenges, policymakers and stakeholders should consider implementing supportive measures such as subsidies, tax incentives, or public–private partnerships to offset initial costs. Advanced simulation tools and GIS-driven methods can enhance the accuracy of site assessments, ensuring that only the most viable locations are targeted for development. Additionally, integrating innovative technologies like blockchain for peer-to-peer energy trading can improve the economic feasibility of these systems by enabling more transparent and efficient energy exchange mechanisms.
By carefully evaluating the costs and benefits, the proposed solution emerges as a promising but complex pathway toward more sustainable urban energy systems. While challenges remain, they can be mitigated through targeted investments, policy support, and technological advancements, paving the way for the broader adoption of waste heat recovery in urban environments.
5. Discussion
5.1. Comparison to Existing Numerical Results
Zhang et al. [8] show European data centers as potential waste heat sources. The downside of using them in these climate conditions is the lack of operational hours and the availability of waste heat at low temperatures only. For instance, in spaces where the dry bulb temperature is 35 °C and the dew point temperature is 21 °C, the waste heat is only available for circa. 5000 h. Economizer hours (up to 3200 h a year) refer to the hours a building can use outside air for cooling.
Unlike all the abovementioned applications with heat exchangers and renewable electricity-driven heat pumps, a system with an absorption chiller is described in [5]. Its key features are as follows:
- Waste heat recovery: The hot water exits the waste heat recovery unit at a high temperature of 98 °C. This unit captures the waste heat from high-temperature industrial processes.
- Absorption chiller inlet temperature: hot water enters the absorption chiller at 88 °C, and the chiller uses this heat to produce chilled water.
- Absorption chiller outlet temperature: after absorption, the chilled water leaves the chiller at 37 °C.
- Cooling tower exit temperature: the cooling tower cools the chilled water to 30 °C before circling back into the system.
Its problem is reliance on high-temperature waste heat, which was outside the scope of the present research.
Albert et al. [6] discuss other waste heat sources and provide a visual reference for dairy locations in the UK. Dairies in the UK manufacture 14,713 million liters of milk. Typical pasteurization methods and operational temperatures support the availability of waste heat in this industry. For example, high-temperature short-time pasteurization lasts 15 s at 71 °C, while low-temperature long-time pasteurization only needs 63 °C for 30 min. Dairy products are stored at 3 °C, so this industry needs cooling.
Albert et al. [6] also cover brewing processes, a widespread industry in Belgium. Although the fermentation temperature is much lower, the duration of the process is higher as fermentation occurs at 6–25 °C for 5–6 days. Post-fermentation processing needs cooling, which makes a brewery a proper prosumer of a 5GDHC system. Usually, the beer is aged between −1 and 10 °C for a week, after which pasteurization is necessary. Unlike low-temperature long-time pasteurization for milk, flash sterilization is more popular for various reasons, but it occurs at higher temperatures—at 75 °C for 30 s. Energy efficiency measures such as heat recovery from the heat exchanger for wort pre-heating, spent grain discard at the end of the brewing process, and using UV pasteurization for further energy reduction are already intensively implemented. Although these heat recovery methods could save up to 25% of brewing energy, converting beer production into a prosumer can further decrease the industry’s carbon footprint.
As mentioned in the Introduction Section, similar research was also performed in Ireland. However, the employed methods and databases were different:
- The GeoDirectory database contains geographical information about the entire building stock of Ireland.
- The EPC dataset of the Irish residential stock represents the measured building stock. It comprises more than 200 building features that include building fabric, heating systems, estimated end-use CO2 emissions, and estimated delivered and estimated primary energy consumption.
The Irish retrofit housing scheme dataset contains quantitative data for residential buildings that have completed energy upgrades through one of the innovation programs. Unfortunately, such data are unavailable for Belgium, so balancing the production and consumption sides is challenging.
Nevertheless, the heat production of multiple prosumers/sources of waste heat within one 5GDHC system has to be properly balanced and billed. The concept of a blockchain platform enables such a peer-to-peer energy exchange in a fully automatic mode. According to Li et al. [30], most existing platforms use an auction model (WePower, Brooklyn Microgrid, and POWR Ledger). However, SolarCoin and NRG Coin have unique methods where the cryptocurrency value is directly tied to a specific amount of energy (MWh and kWh, respectively). Each platform uses different tokens or coins tailored to their specific case use. SolarCoin and NRG Coin directly link their value to the energy produced or consumed, providing a tangible link to the energy sector.
These platforms are spread across various regions, including Europe, the USA, Australia, and some Asian countries. By now, POWR Ledger has the broadest geographical presence among the listed platforms. This research illustrates the diversity in how blockchain technology is applied in the energy sector, with different platforms adopting various business models, transaction methods, and cryptocurrencies tailored to their specific needs and regional presence. Integrating blockchain with energy highlights innovative ways to efficiently track and trade the energy production driven by waste heat.
5.2. Data Accuracy and Completeness
This study addresses the variations in tunnel geometry, ground conditions, and traffic patterns with moderate thoroughness. Tunnel geometry factors such as cross-sectional area, length, and depth are considered in heat transfer modeling, particularly through parameters like tunnel air temperature profiles and heat transfer rates. These geometric elements are explicitly included in equations and calculations, allowing for site-specific estimations of heat recovery potential. However, the variability in tunnel geometry across different sites suggests that more detailed measurements could improve the accuracy of the predictions.
Ground conditions, such as soil type and thermal conductivity, are also integrated into the model via thermal diffusivity and conductivity parameters. While these factors are recognized as influential in determining heat transfer rates, this study does not delve deeply into local geological variations or groundwater dynamics. These site-specific factors are acknowledged qualitatively but lack detailed quantitative integration, which could impact the precision of heat recovery estimations.
Traffic patterns are less comprehensively addressed. Although vehicle density and speed indirectly affect the heat profile within tunnels, these variables were not explicitly modeled. Instead, the focus remained on heat sources and tunnel air temperature, leaving room for improvement in linking traffic patterns to thermal dynamics. Including traffic-related heat inputs in future studies could enhance the understanding of how traffic variability influences waste heat recovery potential.
Potential data gaps and limitations could significantly affect the accuracy of the heat recovery estimates. One major limitation is the reliance on generalized assumptions for tunnel geometry and ground conditions. Any variations in cross-sectional area and depth, as well as the surrounding soil properties, are not always captured with high precision, which could lead to inaccuracies in heat transfer modeling. For instance, the analysis may not fully integrate specific geological features such as groundwater or highly variable soil thermal conductivity.
Another limitation lies in the treatment of traffic patterns. While traffic-generated heat is acknowledged, this study does not model the dynamic and time-dependent nature of vehicle density and speed within tunnels. This omission could lead to under- or overestimating heat availability, especially in urban areas with fluctuating traffic volumes.
This study also uses periodic functions to simulate temperature distributions and assumes consistent operating conditions. These simplifications may not fully capture the impact of seasonal changes or unexpected disruptions. Additionally, the use of data from platforms such as OpenStreetMap, while extensive, may miss smaller or less documented tunnels, potentially excluding significant sources of waste heat.
Finally, the absence of localized empirical data for validation represents a critical gap. Without detailed measurements from specific sites, the modeled estimates may lack the granularity needed to ensure accuracy, particularly in unique environments with atypical thermal or geological characteristics. Addressing these gaps would require more comprehensive site-specific data collection and a refinement of the modeling framework to accommodate greater variability.
5.3. Model Validation and Sensitivity Analysis
The validation of the two-dimensional heat transfer model is supported by the studies referenced in the provided text, specifically [31], which compares the model’s predictions against experimental and analytical data in the context of cylindrical multilayer media with heat sources. This study examines applications like heat recovery in railway and highway tunnels, showing consistency in the model’s output with the field data on heat transfer rates and annual heat recovery potential.
Additionally, this study cites various heat recovery projects, such as those in tunnels (e.g., Crossrail London, Metro Torino, and the Mules Access Tunnel), with the data on heat transfer rates ranging from 5 to 74 W/m2, as well as annual heat recovery estimates. These examples align the model’s predictions with observed performance metrics.
However, the text does not elaborate on detailed experimental setups or a wide range of independent validations beyond [31]. Therefore, while the evidence supports the model’s accuracy, further validation in broader applications and a comparison with more real-world datasets would strengthen its credibility.
Tunnel geometry significantly impacts this study’s results, contributing an estimated 40 to 50% of the variability. Factors such as cross-sectional area, length, and depth directly influence the heat transfer rates and the potential for energy recovery. Larger cross-sectional areas provide more surface for heat exchange, while deeper tunnels experience less fluctuation due to the ambient air temperatures, creating more stable thermal conditions. A 10% variation in tunnel length or cross-sectional area could lead to a similar percentage change in the estimates of annual heat recovery. This makes tunnel geometry a critical parameter for accurate modeling and analysis.
Ground conditions, including soil type and thermal conductivity, are estimated to contribute about 20 to 30% of the variability in results. These factors affect how heat is transferred into the surrounding environment. For instance, soils with higher thermal conductivity allow for more efficient heat dissipation, while groundwater presence can enhance or disrupt thermal stability. A variation in thermal conductivity of 10 to 15% could influence heat recovery rates by a similar margin. These conditions are important but less immediately controllable than geometry.
Traffic patterns are estimated to have a lower impact, contributing roughly 10 to 20% of the variation in results. Traffic density and speed generate heat within tunnels, influencing the thermal environment and the available waste heat. The variations in traffic density of 10% could change the heat recovery potential by a similar proportion. While this factor is less dominant than geometry or ground conditions, it still shapes the thermal profile of tunnels, particularly in heavily trafficked urban areas.
Overall, tunnel geometry and ground conditions are the most influential factors in this study, with traffic patterns having a secondary but still meaningful impact. The precise interplay of these factors underscores the importance of incorporating detailed, site-specific data into the models to ensure accurate and reliable results.
5.4. Economic Feasibility Assessment
Compared to other options like geothermal energy or solar thermal, the economic viability of heat recovery from railway and highway tunnels can be better understood through specific numbers and data. In the case of tunnel heat recovery, this study found that the energy recovery potential varied greatly based on the tunnel characteristics. For example, in tunnels with a heat transfer rate of 5–30 W/m2, the annual heat recovery ranged from 32 to 841 MWh/year for a tunnel like Crossrail in London, UK. Larger tunnels with higher heat transfer rates, like those in the Mules Access Tunnel of the Brenner Base Tunnel in Italy, showed much higher annual energy recovery, reaching up to 2858 MWh/year. This variability in heat recovery is primarily due to differences in tunnel length and depth and the surrounding geological conditions.
In comparison, geothermal energy systems generally offer a consistent heat source but involve significant upfront costs. For example, geothermal heat pump systems can cost around EUR 1000 to EUR 3000 per installed kW of capacity, depending on the region and depth of the geothermal wells. A typical geothermal system might generate between 4000 and 6000 kWh of thermal energy per year for every installed kW, with payback periods ranging from 5 to 10 years, depending on the system’s efficiency and local energy costs.
Solar thermal systems are another option, though their energy production can be more variable. In a region like Belgium, solar thermal systems can produce around 400–700 kWh/m2 of thermal energy annually, depending on the location and system type. The capital costs for solar thermal installations are typically between EUR 500 and EUR 1500 per installed kW of thermal capacity, with payback periods of 10 to 15 years. Solar thermal systems also face limitations in colder or cloudier climates, which can reduce their effectiveness.
When comparing these numbers, the heat recovery from tunnels could be economically competitive in areas with extensive tunnel networks, because it requires less initial investment than geothermal systems and offers a renewable heat source that can be integrated into the existing infrastructure. For instance, the estimated recovery of 841 MWh/year from a tunnel like Crossrail could provide significant energy savings in urban heating networks. However, the recovery potential might be less substantial for tunnels with lower heat transfer rates or shorter lengths, making the economic viability less attractive compared to more stable sources like geothermal energy.
Thus, while tunnel heat recovery could be a cost-effective option in certain urban areas, it generally requires a detailed analysis of local conditions. Geothermal and solar thermal systems may be more reliable and predictable in their energy output, but they come with higher initial investment costs and depend on specific geographic factors. Therefore, the economic comparison hinges on the specifics of each project, including installation costs, energy production potential, and long-term operational savings.
5.5. Environmental and Social Impacts
The proposed 5GDHC system could potentially have significant environmental and social impacts, some of which can be quantified. In particular, noise, vibration, visual impacts, and disruptions to local communities can be evaluated using data and figures related to the scale of the system and its construction processes.
5.5.1. Noise and Vibration
Regarding noise and vibration, heat pumps, compressors, and other mechanical equipment can generate sound levels that vary depending on the equipment type, size, and operation. For example, the sound level of a typical heat pump used in district heating systems can range between 50 and 70 decibels (dB) at a distance of 1 m. This is comparable to the noise level of a conversation (60 dB) or a busy office (70 dB). In areas close to residential or commercial zones, noise levels exceeding 65 dB at night or 70 dB during the day can cause disturbances, leading to complaints or regulatory issues. Vibration levels are typically measured in acceleration (m/s2) and can vary depending on the equipment used. For example, the vibration from a large pump system might be in the range of 0.1 to 1.0 m/s2, which could be perceptible to nearby residents or buildings. While these values are not universally disruptive, the proximity of the installation to populated areas can determine the severity of these impacts.
5.5.2. Visual Impacts
Regarding visual impacts, the 5GDHC system may involve the construction of large underground and above-ground infrastructure, such as heat exchangers, pipes, and storage tanks. The underground pipeline network, essential for the system, could stretch several kilometers in urban areas, creating potential excavation sites and temporary construction barriers. For instance, a 5 km stretch of underground piping can involve approximately 100,000 m2 of excavation work, potentially disrupting the visual landscape of the area for several months or years during the installation. Overhead infrastructure, such as cooling towers or visible heat exchange units, can alter the skyline, particularly in city environments where new structures may clash with existing urban designs. The visual impact could be particularly noticeable in heritage or tourist districts, where such alterations could lead to a 10–30% reduction in aesthetic value based on visual impact assessments.
5.5.3. Disruptions to Local Communities
When considering disruptions to local communities, the extent of construction work and its impact on transportation should be evaluated. If a system requires the excavation of roads for pipeline installation, this could affect traffic flow, particularly in busy areas. For instance, closing off a major road for 6 months to install a new district heating pipeline could disrupt traffic patterns for thousands of commuters daily. A 5 km installation stretch could involve the closure of key roads, affecting 10,000–20,000 vehicles per day, depending on the area. Additionally, the economic impact on businesses near the construction site could result in a 5–15% decrease in their monthly revenue due to reduced foot traffic or access.
Finally, energy savings and environmental benefits are quantifiable. For example, a district heating network that utilizes waste heat recovery from tunnels could save an estimated 500–3000 MWh per year, depending on the heat transfer rate and tunnel length. Based on the data from similar projects, energy recovery rates range from 5 to 74 W/m2, which translates to an annual heat recovery range of 2 to 2858 MWh/year. Depending on the heat source’s efficiency, this could reduce CO2 emissions by approximately 150–3000 tons annually. Such reductions align with the goals of decreasing carbon footprints and promoting more sustainable urban energy solutions.
5.5.4. Groundwater Contamination and Ground Subsidence
Heat extraction from underground sources, such as tunnels or deep ground layers, can pose several potential environmental risks, particularly concerning groundwater contamination and subsidence. These risks primarily arise from the interaction between the heat extraction system and the surrounding geological and hydrological environments.
Groundwater contamination can occur if the heat extraction process disturbs local groundwater flow patterns. In systems where the heat is extracted from deep groundwater, the temperature increase in the surrounding rock or soil can alter the chemical composition of the groundwater. This thermal effect may mobilize the contaminants already present in the subsurface or, in some cases, lead to the leaching of previously stable minerals. For instance, when using a geothermal heat extraction system, temperature increases in the aquifer could cause the dissolution of the metals, such as arsenic, lead, or mercury, contaminating the water supply. The heat extraction rate, the source depth, and the local geology are critical factors in determining the likelihood and extent of such contamination. Generally, the potential for mobilizing toxic elements increases if temperatures rise significantly (above 40–50 °C). The magnitude of the thermal plume and its migration also depends on local groundwater velocities and the porosity of the subsurface layers.
Ground subsidence is another environmental concern associated with heat extraction, especially when large amounts of heat are removed from deep underground sources. The extraction of heat can lead to a decrease in the pressure and the density of the surrounding rock or soil, which, over time, can cause the ground to sink or shift. This is particularly true in areas where the geothermal or heat extraction process is sustained over long periods. For example, in the case of deep geothermal systems, removing heat can result in a drop in pore pressure within the rock formations, leading to compaction and ground subsidence. The extent of subsidence depends on several factors, including the depth and volume of the heat extracted, the thermal conductivity of the surrounding rock, and the elasticity of the geological formations. In some regions, such as parts of the Netherlands, excessive groundwater extraction for heating purposes has already been linked to subsidence rates of up to 1–3 cm per year.
Heat recovery systems may exacerbate these issues in tunnels, such as those in urban rail or highway networks, if not carefully managed. For instance, the heat extracted from the tunnel air or surrounding rock may affect the surrounding ground, especially if the cooling or heating process induces pressure changes. These changes could lead to minor shifts in the tunnel structure or surrounding infrastructure. The heat recovery system must account for these risks by ensuring that the heat extraction rate does not cause undue stress on the surrounding geological formations. A study of the heat recovery potential in tunnels, such as those found in the case study regions of Belgium, suggests that heat extraction rates can range from 5 W/m2 to 74 W/m2, depending on factors like tunnel depth and geological conditions. Excessive heat extraction over extended periods could contribute to local ground movement, although the magnitude of subsidence would depend on the specific characteristics of the area.
These environmental risks underscore the importance of careful planning, monitoring, and regulation when implementing heat extraction technologies. Methods to mitigate these risks include implementing controlled extraction rates, monitoring groundwater quality, and ensuring that extraction does not exceed the natural replenishment rate of the affected ground or aquifer. Detailed site-specific studies are essential to assess the potential for groundwater contamination and ground subsidence and to establish appropriate risk management strategies.
6. Conclusions
This study explored the potential of railway and highway tunnels as waste heat sources for 5GDHC systems using GIS-driven methods. Identifying and utilizing waste heat from these infrastructures can significantly enhance the sustainability and efficiency of 5GDHC networks by integrating additional prosumers into the system. The key findings can be summarized into six categories, as follows:
- The investigation highlighted various potential sources, including data centers, electrical substations, sewage systems, supermarkets, and underground car/railway tunnels. Each source has a specific temperature range and potential application within a 5GDHC system.
- The GIS software effectively handles the large datasets and complex spatial analyses necessary for identifying and evaluating potential heat sources. This integration facilitates the precise location and assessment of the railway and highway tunnels suitable for waste heat recovery.
- The research focused on Belgium, where GIS queries identified potential waste heat sources in railway tunnels, particularly in the southern, hilly regions like Wallonia. The Brussels Capital Region was notable for its potential to utilize the waste heat from subway/metro stations.
- Our preliminary estimations indicated significant potential for heat recovery from tunnels, with energy recovery rates varying widely depending on each tunnel’s specific characteristics. For example, the heat transfer rates ranged from 5 to 74 W/m2, and the annual heat recovery potential varied from 2 to 2858 MWh/year.
- This study compared the feasibility of using the waste heat from tunnels to other sources like data centers and industrial processes. It highlighted the advantages and limitations of each, such as the lower operational hours of data centers in cooler climates and the high-temperature requirements for absorption chillers in industrial settings.
- This paper underscored the potential of blockchain technology to facilitate peer-to-peer energy exchange within 5GDHC systems. Blockchain platforms can offer innovative solutions for balancing production and consumption and ensuring transparent and efficient energy transactions.
These findings suggest that railway and highway tunnels are viable and underexplored waste heat sources for 5GDHC systems. GIS-driven methods provide a robust framework for identifying and evaluating these sources, contributing to developing more efficient and sustainable heating and cooling networks. Future research may focus on the following:
- Conducting detailed case studies in various regions to validate and refine the heat recovery potential estimates.
- Using more diverse and comprehensive datasets, including building energy performance data, to enhance the accuracy of waste heat assessments.
- Exploring advanced heat recovery and storage technologies and innovative business models for integrating waste heat into 5GDHC systems.
- Assessing the economic feasibility and policy implications of the large-scale implementation of waste heat recovery from tunnels and other infrastructure.
By addressing these areas, future research can further unlock the potential of waste heat recovery and contribute to the broader adoption of 5GDHC systems, thereby promoting energy efficiency and sustainability in urban environments. In conclusion, while the 5GDHC system offers notable environmental benefits, it also introduces challenges, some of which can be measured. Noise levels, vibration impacts, visual disruption, and community disturbances must be mitigated through careful planning. Quantifying these impacts—whether in decibels for noise, square meters for visual disruption, or tons of CO2 for environmental benefits—helps better understand and manage the potential consequences of implementing this technology.
Funding
This project received funding from VLAIO in Belgium: the ICON project OPTIMESH (VLAFLX7, https://researchportal.vub.be/en/projects/icon-project-optimesh (accessed on 1 January 2025); FLUX50 ICON Project Collaboration Agreement—HBC.2021.0395).
Data Availability Statement
The data presented in this study are available on request from the corresponding author. The data are not publicly available due to confidentiality reasons.
Conflicts of Interest
The authors declare no conflicts of interest.
References
- Meibodi, S.S.; Loveridge, F. The future role of energy geostructures in fifth generation district heating and cooling networks. Energy 2022, 240, 122481. [Google Scholar] [CrossRef]
- Wirtz, M.; Heleno, M.; Moreira, A.; Schreiber, T.; Müller, D. 5th generation district heating and cooling network planning: A Dantzig–Wolfe decomposition approach. Energy Convers. Manag. 2023, 276, 116593. [Google Scholar] [CrossRef]
- Millar, M.A.; Yu, Z.; Burnside, N.; Jones, G.; Elrick, B. Identification of key performance indicators and complimentary load profiles for 5th generation district energy networks. Appl. Energy 2021, 291, 116672. [Google Scholar] [CrossRef]
- Moreno, D.; Nielsen, S.; Persson, U. The European Waste Heat Map. 2022. Available online: http://urn.kb.se/resolve?urn=urn:nbn:se:hh:diva-48180 (accessed on 1 January 2025).
- Hsu, C.Y.; Lin, T.Y.; Liang, J.; De Lai, C.H.; Chen, S.L. Optimization analysis of waste heat recovery district cooling system on a remote island: Case study Green Island. Energy Convers. Manag. 2019, 183, 660–670. [Google Scholar] [CrossRef]
- Albert, M.D.A.; Bennett, K.O.; Adams, C.A.; Gluyas, J.G. Waste heat mapping: A UK study. Renew. Sustain. Energy Rev. 2022, 160, 112230. [Google Scholar] [CrossRef]
- Alisawi, H.A.O. Renewable energy of wastewater heat recovery. Water Sci. Technol. 2023, 87, 2852–2871. [Google Scholar] [CrossRef]
- Zhang, Y.; Shan, K.; Li, X.; Li, H.; Wang, S. Research and Technologies for next-generation high-temperature data centers—State-of-the-arts and future perspectives. Renew. Sustain. Energy Rev. 2023, 171, 112991. [Google Scholar] [CrossRef]
- Kuznik, F.; Frayssinet, L.; Roux, J.J.; Merlier, L. Calculation of heating and cooling energy loads at the district scale: Development of MoDEM, a modular and technologically explicit platform. Sustain. Cities Soc. 2022, 83, 103901. [Google Scholar] [CrossRef]
- Boghetti, R.; Kämpf, J.H. Verification of an open-source Python library for the simulation of district heating networks with complex topologies. Energy 2024, 290, 130169. [Google Scholar] [CrossRef]
- Chicherin, S.; Starikov, A.; Zhuikov, A. Justifying network reconstruction when switching to low temperature district heating. Energy 2022, 248, 123618. [Google Scholar] [CrossRef]
- Jebamalai, J.M.; Marlein, K.; Laverge, J. Influence of centralized and distributed thermal energy storage on district heating network design. Energy 2020, 202, 117689. [Google Scholar] [CrossRef]
- Björnebo, L.; Spatari, S.; Gurian, P.L. A greenhouse gas abatement framework for investment in district heating. Appl. Energy 2018, 211, 1095–1105. [Google Scholar] [CrossRef]
- Li, S.; Cai, H.; Kamat, V.R. Uncertainty-aware geospatial system for mapping and visualizing underground utilities. Autom. Constr. 2015, 53, 105–119. [Google Scholar] [CrossRef]
- Taranu, V.; Verbeeck, G.; Nuyts, E. Upgrading the energy label for dwellings in Flanders: An example of a behaviourally informed policy tool. Build. Res. Inf. 2020, 48, 18–33. [Google Scholar] [CrossRef]
- Cioccolanti, L.; Renzi, M.; Comodi, G.; Rossi, M. District heating potential in the case of low-grade waste heat recovery from energy intensive industries. Appl. Therm. Eng. 2021, 191, 116851. [Google Scholar] [CrossRef]
- Ramos-Escudero, A.; Bloemendal, M. Assessment of potential for Aquifer Thermal Energy Storage Systems for Spain. Sustain. Cities Soc. 2022, 81, 103849. [Google Scholar] [CrossRef]
- Jbaihi, O.; Ouchani, F.Z.; Merrouni, A.A.; Cherkaoui, M.; Ghennioui, A.; Maaroufi, M. An AHP-GIS based site suitability analysis for integrating large-scale hybrid CSP+PV plants in Morocco: An approach to address the intermittency of solar energy. J. Clean. Prod. 2022, 369, 133250. [Google Scholar] [CrossRef]
- Tinti, F.; Boldini, D.; Ferrari, M.; Lanconelli, M.; Kasmaee, S.; Bruno, R.; Egger, H.; Voza, A.; Zurlo, R. Exploitation of geothermal energy using tunnel lining technology in a mountain environment. A feasibility study for the Brenner Base tunnel—BBT. Tunn. Undergr. Space Technol. 2017, 70, 182–203. [Google Scholar] [CrossRef]
- Jato-Espino, D.; Manchado, C.; Roldán-Valcarce, A.; Moscardó, V. ArcUHI: A GIS add-in for automated modelling of the Urban Heat Island effect through machine learning. Urban Clim. 2022, 44, 101203. [Google Scholar] [CrossRef]
- Gerard, P.; Vincent, M.; François, B. A methodology for lithology-based thermal conductivities at a regional scale for shallow geothermal energy—Application to the Brussels-Capital Region. Geothermics 2021, 95, 102117. [Google Scholar] [CrossRef]
- Brown, C.S.; Kolo, I.; Falcone, G.; Banks, D. Repurposing a deep geothermal exploration well for borehole thermal energy storage: Implications from statistical modelling and sensitivity analysis. Appl. Therm. Eng. 2023, 220, 119701. [Google Scholar] [CrossRef]
- Huang, Y.; Zhang, Y.; Xie, Y.; Zhang, Y.; Gao, X.; Ma, J. Field test and numerical investigation on deep coaxial borehole heat exchanger based on distributed optical fiber temperature sensor. Energy 2020, 210, 118643. [Google Scholar] [CrossRef]
- Sadeghi, H.; Jalali, R.; Singh, R.M. A review of borehole thermal energy storage and its integration into district heating systems. Renew. Sustain. Energy Rev. 2024, 192, 114236. [Google Scholar] [CrossRef]
- Guo, F.; Yang, X. Long-term performance simulation and sensitivity analysis of a large-scale seasonal borehole thermal energy storage system for industrial waste heat and solar energy. Energy Build. 2021, 236, 110768. [Google Scholar] [CrossRef]
- Salenbien, R.; Wack, Y.; Baelmans, M.; Blommaert, M. Geographically informed automated non-linear topology optimization of district heating networks. Energy 2023, 283, 128898. [Google Scholar] [CrossRef]
- Leggiero, M.; Andrew, B.; Elliott, R.; Indergaard, J.; Sharma, J.B.; Vogel, T. Radiative heat loss estimation of building envelopes based on 3D thermographic models utilizing small unmanned aerial systems (sUAS). Energy Build. 2021, 244, 110957. [Google Scholar] [CrossRef]
- Eggimann, S.; Vivian, J.; Chen, R.; Orehounig, K.; Patt, A.; Fiorentini, M. The potential of lake-source district heating and cooling for European buildings. Energy Convers. Manag. 2023, 283, 116914. [Google Scholar] [CrossRef]
- Rakha, T.; Gorodetsky, A. Review of Unmanned Aerial System (UAS) applications in the built environment: Towards automated building inspection procedures using drones. Autom. Constr. 2018, 93, 252–264. [Google Scholar] [CrossRef]
- Li, J.; Herdem, M.S.; Nathwani, J.; Wen, J.Z. Methods and applications for Artificial Intelligence, Big Data, Internet of Things, and Blockchain in smart energy management. Energy AI 2023, 11, 100208. [Google Scholar] [CrossRef]
- Dai, X.; Bidarmaghz, A.; Narsilio, G.A. Energy tunnels: A review of the state of the art and knowledge gaps to harness renewable energy from underground infrastructure. Tunn. Undergr. Space Technol. 2023, 142, 105431. [Google Scholar] [CrossRef]
- OpenStreetMap. Available online: https://www.openstreetmap.org/ (accessed on 1 January 2025).
- ZuluThermo. Available online: https://www.politerm.com/products/thermo/zuluthermo/ (accessed on 1 January 2025).


Disclaimer/Publisher’s Note: The statements, opinions and data contained in all publications are solely those of the individual author(s) and contributor(s) and not of MDPI and/or the editor(s). MDPI and/or the editor(s) disclaim responsibility for any injury to people or property resulting from any ideas, methods, instructions or products referred to in the content. |
© 2025 by the author. Licensee MDPI, Basel, Switzerland. This article is an open access article distributed under the terms and conditions of the Creative Commons Attribution (CC BY) license (https://creativecommons.org/licenses/by/4.0/).