Article

Fault Arc Detection Method Based on Improved ShuffleNet V2 Network

1
College of Electrical Engineering and New Energy, China Three Gorges University, Yichang 443002, China
2
State Grid Hubei Electric Power Co., Ltd. Yichang Supply Company, Yichang 443002, China
*
Author to whom correspondence should be addressed.
Processes 2025, 13(1), 135; https://doi.org/10.3390/pr13010135
Submission received: 1 December 2024 / Revised: 23 December 2024 / Accepted: 24 December 2024 / Published: 6 January 2025
(This article belongs to the Section Automation Control Systems)

Abstract

:
Fault arcs exhibit randomness, with current waveforms closely mirroring those of standard nonlinear load operations, posing challenges for traditional series fault arc detection methods. This study presents an improved detection approach using a lightweight convolutional neural network model, ShuffleNet V2. Current data from household loads were collected and preprocessed to establish a comprehensive database, leveraging one-dimensional convolution and channel attention mechanisms for precise analysis. Experimental results demonstrate a high fault arc detection accuracy of 97.8%, supporting real-time detection on the Jetson Nano embedded platform, with an efficient detection cycle time of 15.65 ms per sample. The proposed approach outperforms existing methods in both accuracy and speed, providing a robust foundation for developing advanced fault arc circuit breakers.

1. Introduction

In low-voltage power distribution systems, fault arcs pose a frequent and significant hazard. Factors like aging electrical wiring, insulation degradation, air breakdown, and ground faults can trigger fault arcs, disrupting system operations and increasing fire risks, leading to substantial personal injury and property damage each year [1]. To ensure electrical safety, the United States issued the UL1699 arc fault detection standard [2,3]. Series fault arcs, especially those caused by wire breakage, insulation aging, or loose connections, are particularly concerning due to their high combustion temperatures, rapid onset, indistinct current characteristics, and difficulty of detection [4,5]. While parallel fault arcs result in a rapid current surge that traditional protective devices can quickly identify, series fault arcs are challenging for conventional devices like circuit breakers to detect, as they produce only a slight decrease in current that often remains within the normal operating range. Since the current associated with a series fault arc is similar in magnitude to the normal operating current in low-voltage systems, traditional protective devices are typically unable to detect and interrupt these arcs effectively [6]. Therefore, developing a safe and reliable method for detecting series fault arcs is crucial. Extensive research has been conducted on series fault arc detection, highlighting its complexity and importance.
When a fault arc occurs, the periodic current waveform is distorted at the peak [7], and random high-frequency components are generated at the same time. Domestic and foreign experts and scholars have conducted certain research on the detection of series fault arcs and have achieved certain results. Literature [8] proposed a similar approach using multi-agent deep reinforcement learning (MADRL) for optimizing the operation of residential microgrid clusters, which could be adapted to the optimization of arc fault detection due to its scalability and decentralized structure. There are currently three main methods for detecting series fault arcs: methods based on the physical phenomena of the arc, the arc mathematical model [9], and the current voltage waveform [10,11,12,13]. The arc mathematical model, physical phenomena, and voltage waveform detection methods all have limitations due to the difficulty of data analysis and extraction, so the main detection method is still the analysis of the waveform characteristics of the fault arc current. Literature [14,15,16] analyzes the time domain of the fault arc waveform, uses the extracted features to set the discrimination threshold to determine whether a fault arc has occurred, but it cannot detect complex multi-load waveforms, and the feature threshold is difficult to determine. Lightweight deep convolutional neural networks (LDCNNs) play a vital role in mobile intelligence [17], as they balance the trade-off between computational efficiency and accuracy, making them essential for practical applications in terminal and mobile devices. Literature [18] analyzes the different characteristics of the high-frequency components of the arc current in the time and frequency domains under typical loads; this method uses branch voltage-coupled signal (BVCS) as a detection signal. Support vector machine (SVM) has good robustness and has the capability to quickly learn and classify small samples. Arc fault detection is achieved by inputting spectral characteristics or other characteristics to the SVM [19,20]. However, SVM performs poorly in multi-classification problems and is difficult to apply in the scenario with large numbers of samples. Therefore, literature [21,22] proposed a method of searching between different media forms through RNN (cross-media mapping). Wenchu Li proposes a fault diagnosis and line selection method of series arc in a multi-load system based on recurrent neural network (RNN) [23]. Literature [24] proposes to use the network (CNN) to realize the fault detection of a single load arc with higher accuracy.
This paper proposes a series fault arc detection method using an improved lightweight network, ShuffleNet V2. The established arc fault detection model directly takes the one-dimensional main current as the detection object, which improves the real-time performance of the detection model while avoiding the impact of manual extraction of arc features on the accuracy of the detection model. The method utilizes the neural network’s ability to autonomously analyze data features to process complex arc current data and introduces an attention mechanism to improve data inspection accuracy. A total of 10,00 groups of arc data under normal and fault arc conditions for five different typical loads were measured to construct the training set, and 100 groups of unknown data were used as the test set for multiple detections, achieving a comprehensive detection recognition accuracy of 97.8% in the test results, realizing the detection and identification of series fault arcs.

2. Construction of Fault Arc Current Database

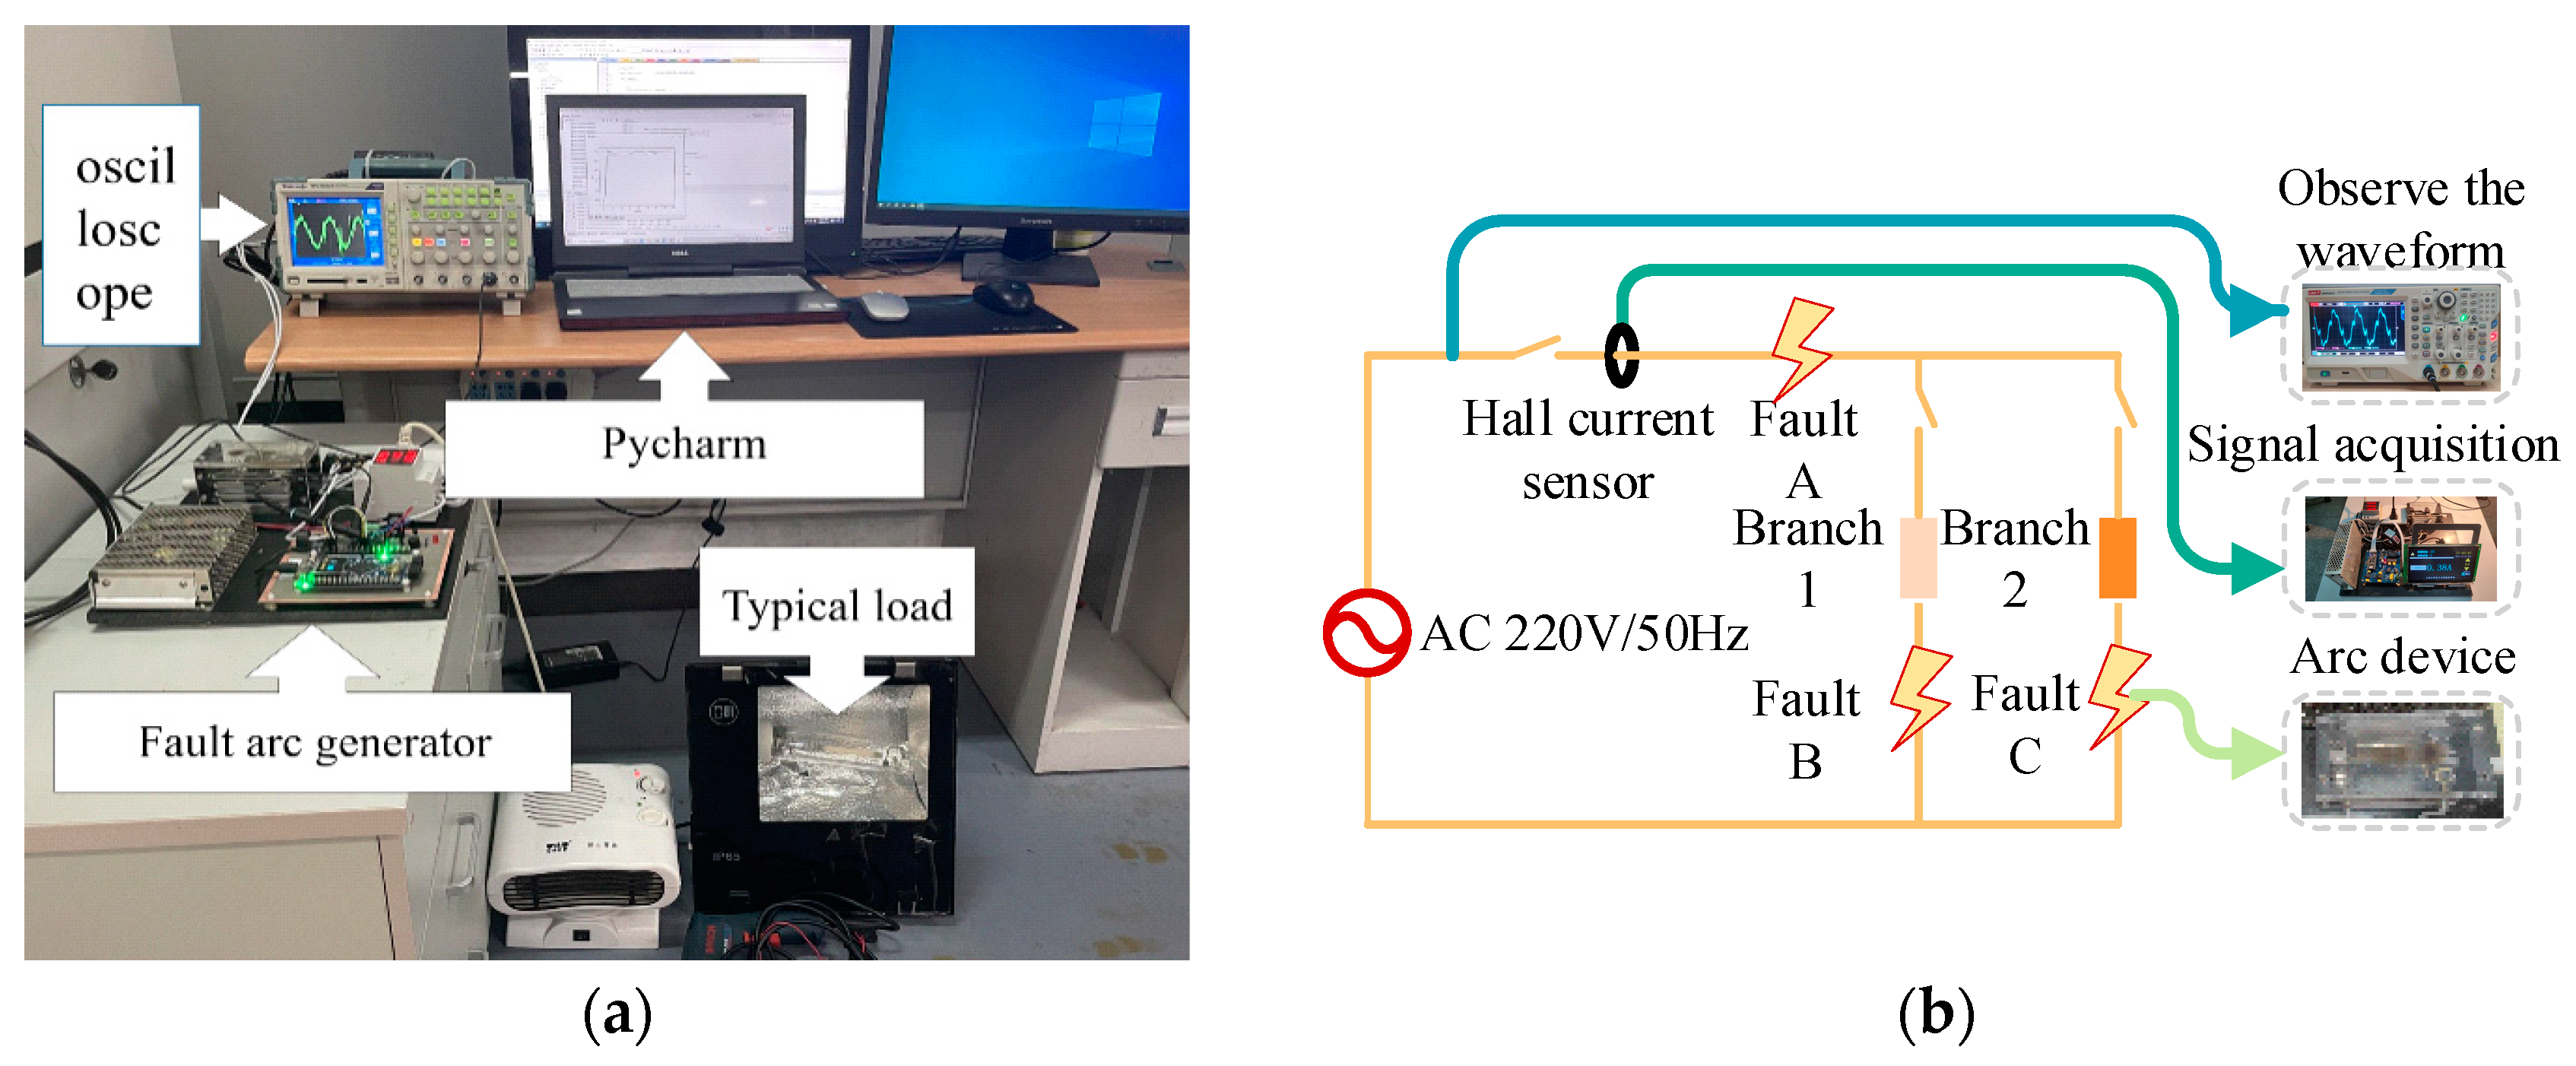
2.1. Design of Experimental Platform

The series-type fault arc test platform was constructed in compliance with the national standard GB/31143-2014 [25], “General Requirements for Arc Fault Detection Devices (AFDD)”. This platform is specifically designed to generate a substantial volume of labeled normal and fault current samples, essential for training the ShuffleNet V2 convolutional neural network. It comprises a 220 V/50 Hz AC power supply, a controllable rotary contact arc generator, household electrical loads, current transformers, current processing circuits, a TEK oscilloscope, and a computer for offline data processing. The configuration of the experimental platform is illustrated in Figure 1.
The platform captures normal current and fault arc current signals under different load conditions in the experimental circuit. All data are collected at a sampling rate of 25 kHz by the oscilloscope, with a resolution of 12 bits, ensuring high fidelity in capturing current waveform details. Similarly, the embedded device used for real-time implementation also operates at a sampling rate of 25 kHz with a 12-bit ADC, ensuring consistency between experimental data collection and real-time applications. This paper extracts 2000 current amplitude points within four continuous cycles for data sampling. The current waveform displayed on the oscilloscope is saved as a CSV file recognizable by software, using a compact flash (Manufacturer: Tektronix, Inc., Beaverton, OR, USA) memory card specific to the laboratory oscilloscope for storing current data. The main application scenario for AC arc fault detection is in residential settings; hence, the loads used in the experiment are all common household loads. The types and powers of the typical loads used are shown in Table 1.

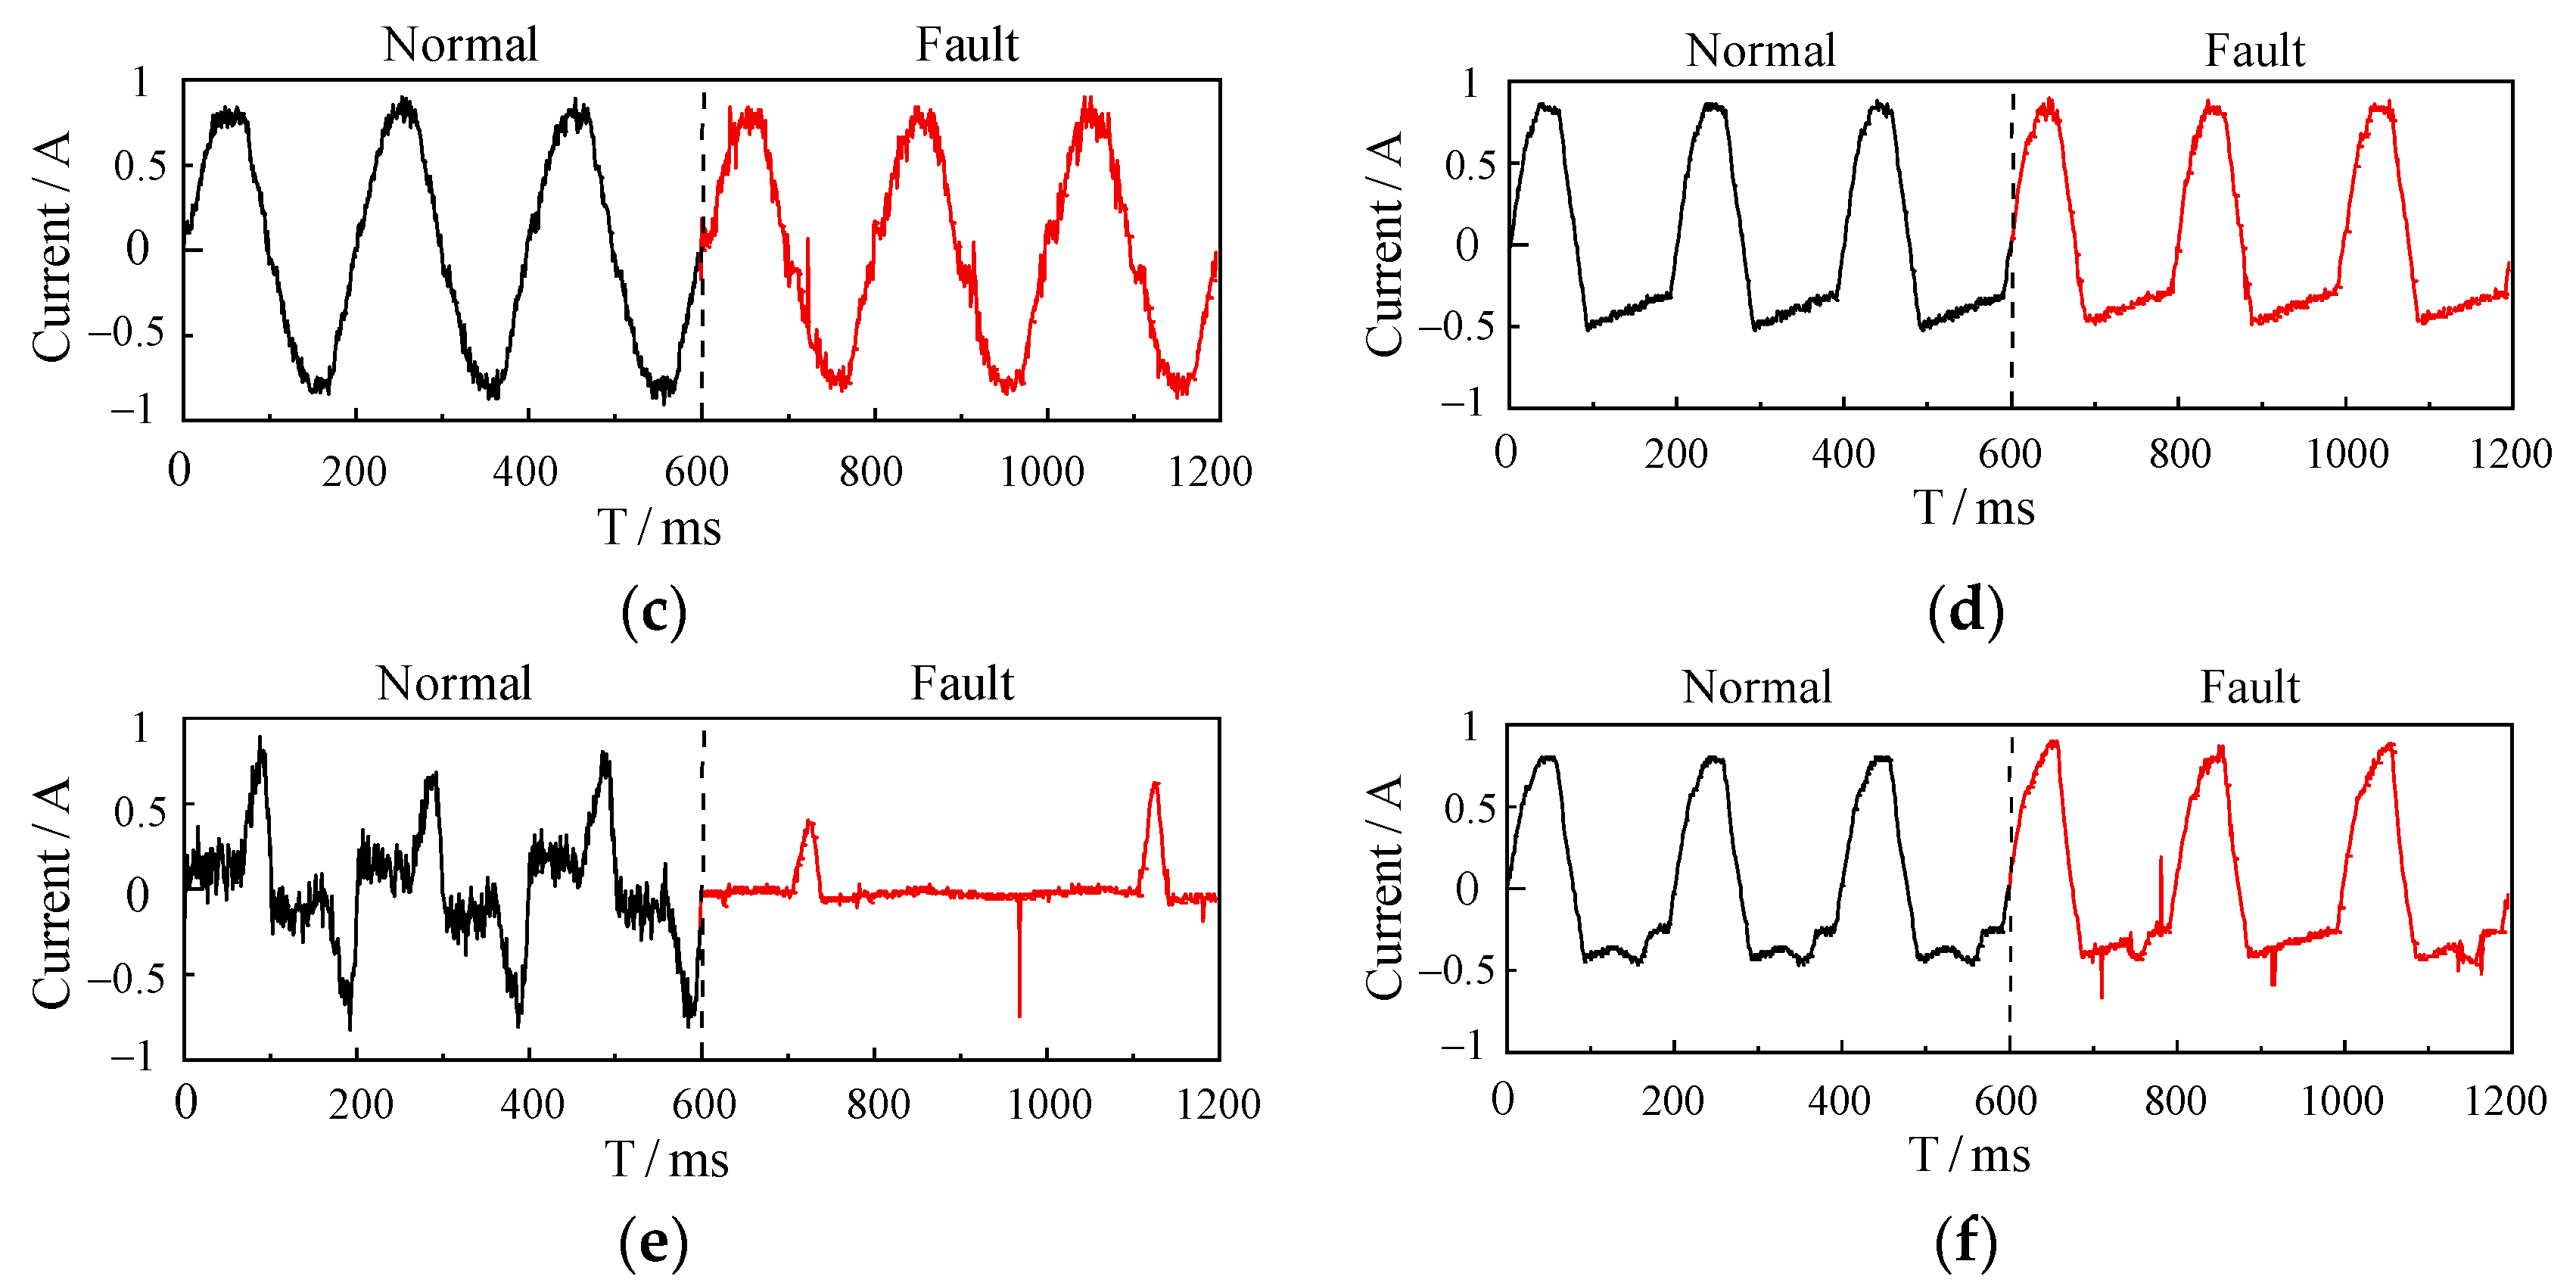
2.2. Data Collection and Preprocessing

Through the experimental platform, a training set database was established for input into the neural network for training, which includes 1000 sets of normal current and fault arc current data for five typical loads, totaling 10,000 sets. Subsequently, new normal and fault state data were collected for each load to test the classification recognition effect of the trained neural network model on new data.
The database comprises 10,000 labeled data samples under both normal and fault arc conditions for five typical loads, capturing diverse operational scenarios. The ShuffleNet V2-ECA network was chosen for its lightweight design and capability to efficiently handle moderate-sized datasets while maintaining high accuracy and computational efficiency on edge devices like the Jetson Nano.
To train the convolutional neural network effectively with the collected current samples, it is crucial to ensure that the sample data format is consistent. Furthermore, to avoid overfitting, the database must be sufficiently large, with appropriate training strategies and parameter selection. Uniform data length and format are essential for neural network processing. Therefore, the raw current data stored by the oscilloscope must undergo preprocessing, including segmentation and filtering, via computer software to exclude irrelevant data. Based on arc fault protection standards GB/31143-2014 [25], a sliding window approach is applied for data segmentation and filtering, using a step size of 0.02 s. Each sample consists of four consecutive cycles of power frequency (0.02 s × 4), providing a standard sample size for both normal and fault arc current data.
In order to eliminate the impact of differences in units and scales between information, and to improve the convergence speed and diagnostic accuracy of the model, data are preprocessed by normalization, mapping the data size to between 0 and 1. The transformation formula is as follows:
z k = v k v min v max v min
where v k represents the sample data to be normalized, v min and v max are the minimum and maximum values in the sample data, respectively, and z k is the result after normalization.
After preprocessing through segmentation and filtering, the original current signal characteristics under actual working conditions are preserved to the greatest extent. Figure 2 illustrates the distinct differences between the current waveform during normal load operation and when a fault arc is present. In examining the current waveforms, we observe that in normal operation, the waveform maintains a complete sinusoidal shape, with minimal low-frequency noise resulting from typical load operation. During a fault arc event, notable abnormalities appear in the current waveform. For example, the electric iron’s current shows a flattened region near the zero crossing (a “zero rest” phenomenon) along with small high-frequency harmonic “spikes”. In contrast, the electric drill’s current waveform features numerous random high-frequency harmonics within this flat shoulder area, leading to significant waveform distortion and increased low-frequency noise. The electric drill, as an inductive load, exhibits certain similarities between fault and normal states, which increases the detection difficulty for such inductive loads.

3. Detection Model Establishment

ShuffleNet V2 is a lightweight deep learning network, an enhanced version of ShuffleNet V1 developed by Megvii (Beijing, China). The network’s primary objective is to achieve high accuracy while minimizing computational complexity and parameter count, enabling efficient real-time inference on mobile devices and embedded systems. Compared to its predecessor, ShuffleNet V2 more comprehensively examines factors influencing model speed, proposing four foundational principles for constructing high-performance networks and addressing the limitations of the original model according to these guidelines. Additionally, ShuffleNet V2 introduces a novel basic network unit, as depicted in Figure 3.
As illustrated in Figure 3a, Unit1 combines the convolution output with that of the left branch, followed by a channel shuffle operation to facilitate inter-channel information exchange. This improvement aims primarily to reduce the use of 1 × 1 convolutions and pointwise addition operations. While these operations contribute fewer FLOPs (floating point operations per second), they incur a higher memory access cost (MAC). Minimizing these operations can improve the network’s actual computational speed.
When downsampling and channel doubling are needed, Unit2, shown in Figure 3b, is employed. Unlike Unit1, this unit does not initially split channels; instead, it directly feeds features into two branches, each performing depthwise convolution. Upon merging, the number of channels doubles, increasing the network width without significantly raising FLOPs. Finally, a channel shuffle operation is performed similarly.

4. Improved ShuffleNet V2 Network

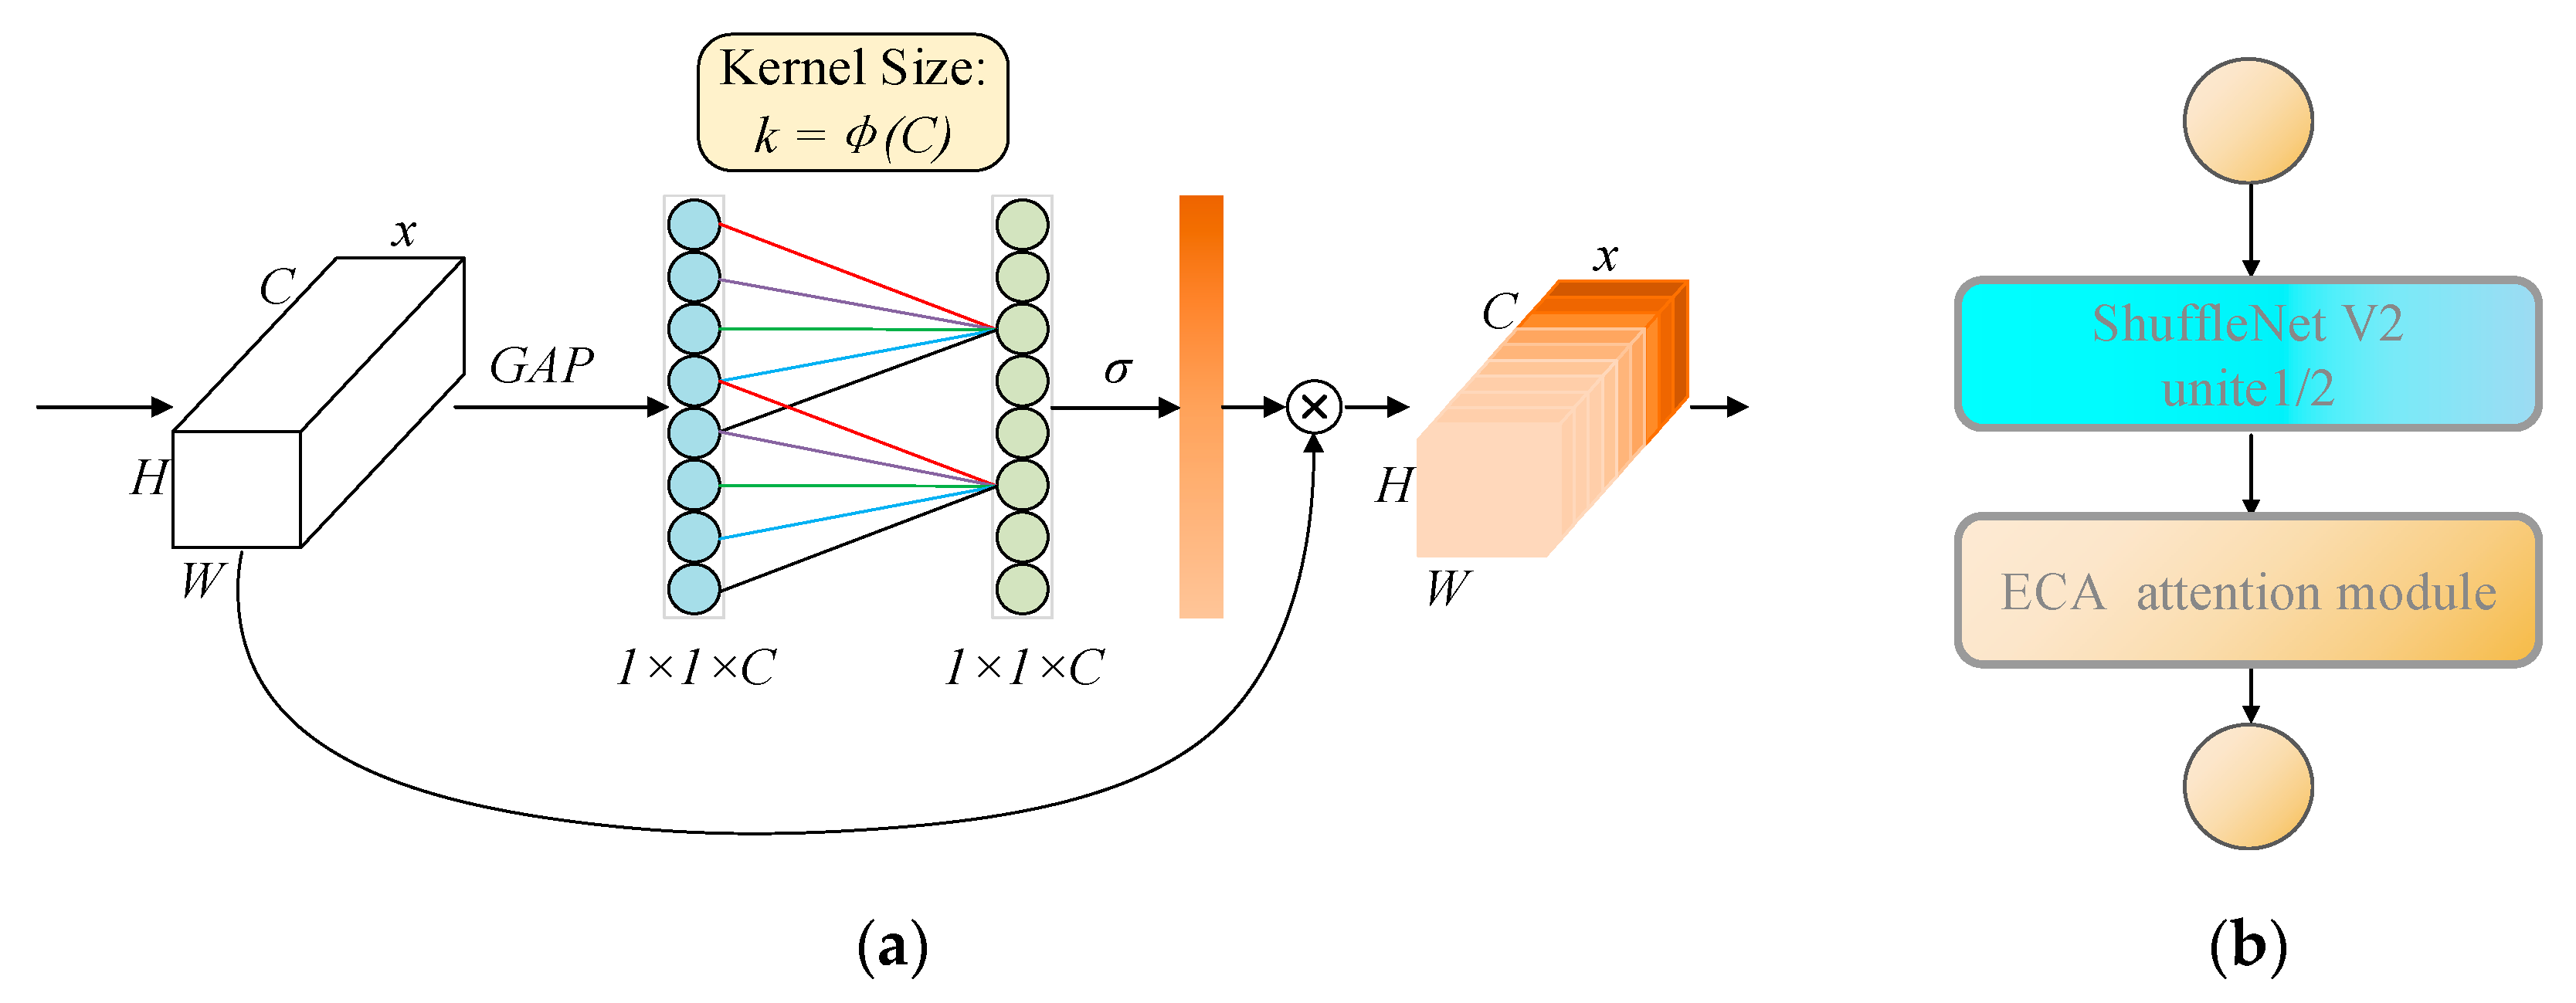
4.1. Network Structure Improvement

ShuffleNet V2 was chosen for this study due to its lightweight design, computational efficiency, and suitability for edge-device deployment, such as the Jetson Nano. Its architecture minimizes memory access cost and computational complexity while maintaining high accuracy. In addition, ShuffleNet V2’s efficient channel shuffle operation and depthwise convolution make it well suited for processing 1D time-series data, as required in this study. The model’s performance in terms of accuracy and computational efficiency makes it a strong choice compared to other lightweight neural networks.
This study enhances the ShuffleNet V2 network by optimizing the basic network structure, adjusting the convolutional kernel size, and introducing the ECA (efficient channel attention) mechanism, making it more compatible with the one-dimensional time series data used in this research. Since the current data are a 1D signal that cannot be directly input into the original ShuffleNet V2, modifications were made to adapt the network structure for 1D processing. In the original ShuffleNet V2, the convolutional kernel performed both horizontal and vertical convolutions; here, it has been modified to perform unidirectional convolution, making it suitable for 1D data.
Designed primarily for 2D images, the original ShuffleNet V2 uses a 3 × 3 depthwise convolutional kernel in Units 1 and 2. After converting to one-dimensional convolution, the kernel size becomes 3, which may be insufficient for 1D data in this study. Different kernel sizes capture features at varied scales, and increasing the kernel size can potentially enhance feature learning. Consequently, the kernel sizes in ShuffleNet V2 Units 1 and 2 were adjusted to 3, 5, 7, 9, and 11 for comparison. Testing revealed that accuracy was highest with a kernel size of 9 and began to decline with a kernel size of 11. The impact on training and testing time was minimal, so a kernel size of 9 was selected. Additionally, an efficient channel attention (ECA) module was integrated into depthwise convolution, as illustrated in Figure 4a. Let the output of a convolutional block be denoted as F R C × H × W , where C, H, and W represent the number of channels (total number of features), the height, and the width of the feature map, respectively. The ECA attention mechanism utilizes global average pooling (GAP) to capture the global information of each channel. The process of the GAP operation can be represented as:
GAP ( F ) = 1 H × W i = 1 H j = 1 W F c i j
In this context, F c i j represents the (i, j) th element of channel c in the input feature map F. After GAP operation, a C-dimensional vector is obtained, which reflects the average characteristics of each channel.
The data processing object in this paper is time series signal F R C × L , where C and L are the number of channels (the total number of features) and the length of features, respectively. Therefore, GAP needs to be adapted for one-dimensional operation. The modified GAP can be expressed as:
GAP ( F ) = 1 L i = 1 L F c i
where   F c i represents the I-th element of channel c in the input feature map F.
After the GAP operation, the ECA attention mechanism uses a one-dimensional convolutional layer to capture the local interaction relationships between channels, eliminating the need for a fully connected layer and avoiding dimensionality reduction operations similar to those in SENet. The size of the local interaction range between channels, that is, the size of the one-dimensional convolution kernel k, is automatically determined based on the number of channels. The implementation process can be expressed as:
k = log 2 c γ + b γ o d d
where k represents the size of one-dimensional convolution kernel; c indicates the number of channels. Gamma and b are empirical constants, set here to 2 and 1, respectively. The larger the number of channels, the larger the corresponding local interaction range k; the smaller the number of channels, the smaller the corresponding local interaction range k; this eliminates the need to manually set the convolution kernel size. A one-dimensional convolution using convolution kernel k is defined as conv1d(). Using the sigmoid activation function (σ for short), the result of the conv1d() convolution operation is nonlinearly transformed to generate the attention weights on each channel. Its implementation process can be expressed as:
W = σ ( c o n v 1 d ( G A P ( F ) ) )
In order to complete the formation of the final channel attention, it is necessary to multiply the obtained attention weight W of each channel with the original input feature map F of the ECA module to realize the attention division of input feature learning on each channel and enhance the feature representation performance. Its implementation process can be expressed as:
O o u t = W F                         R C × L
where denotes point-wise multiplication between W and F.
This module assigns a weight reflecting the model’s current attention to each local cross-channel interaction, prioritizing task-relevant channel information and enhancing model performance. The improved module is depicted in Figure 4b, and the resulting algorithm is designated as ShuffleNet V2-ECA.

4.2. Softmax Loss Function

Since the model is designed for classification, the fault and normal state labels for each dataset are mutually exclusive. Consequently, the softmax activation function is selected as the classifier. By applying softmax to the output features from the fully connected layer, the model can express predicted probabilities. The classification result is determined by the category with the highest predicted probability. To quantify the discrepancy between true and predicted values, the cross-entropy loss function is employed. A smaller loss function value indicates a closer alignment between prediction and actual values, thereby increasing model accuracy. The softmax function is represented as follows:
s o f t m a x x i = y i = exp x i j = 1 M exp x j
where xi is the I-th element in the feature matrix output by the last fully connected layer, xj is the J-th element, M is the number of categories, and yi is the predicted value of xi.
C = 1 n i = 1 N y i In y i + 1 y i In 1 y i
where y i is the expected output, y i is the actual predicted output, and N is the total number of samples.

5. Experimental Results and Analysis

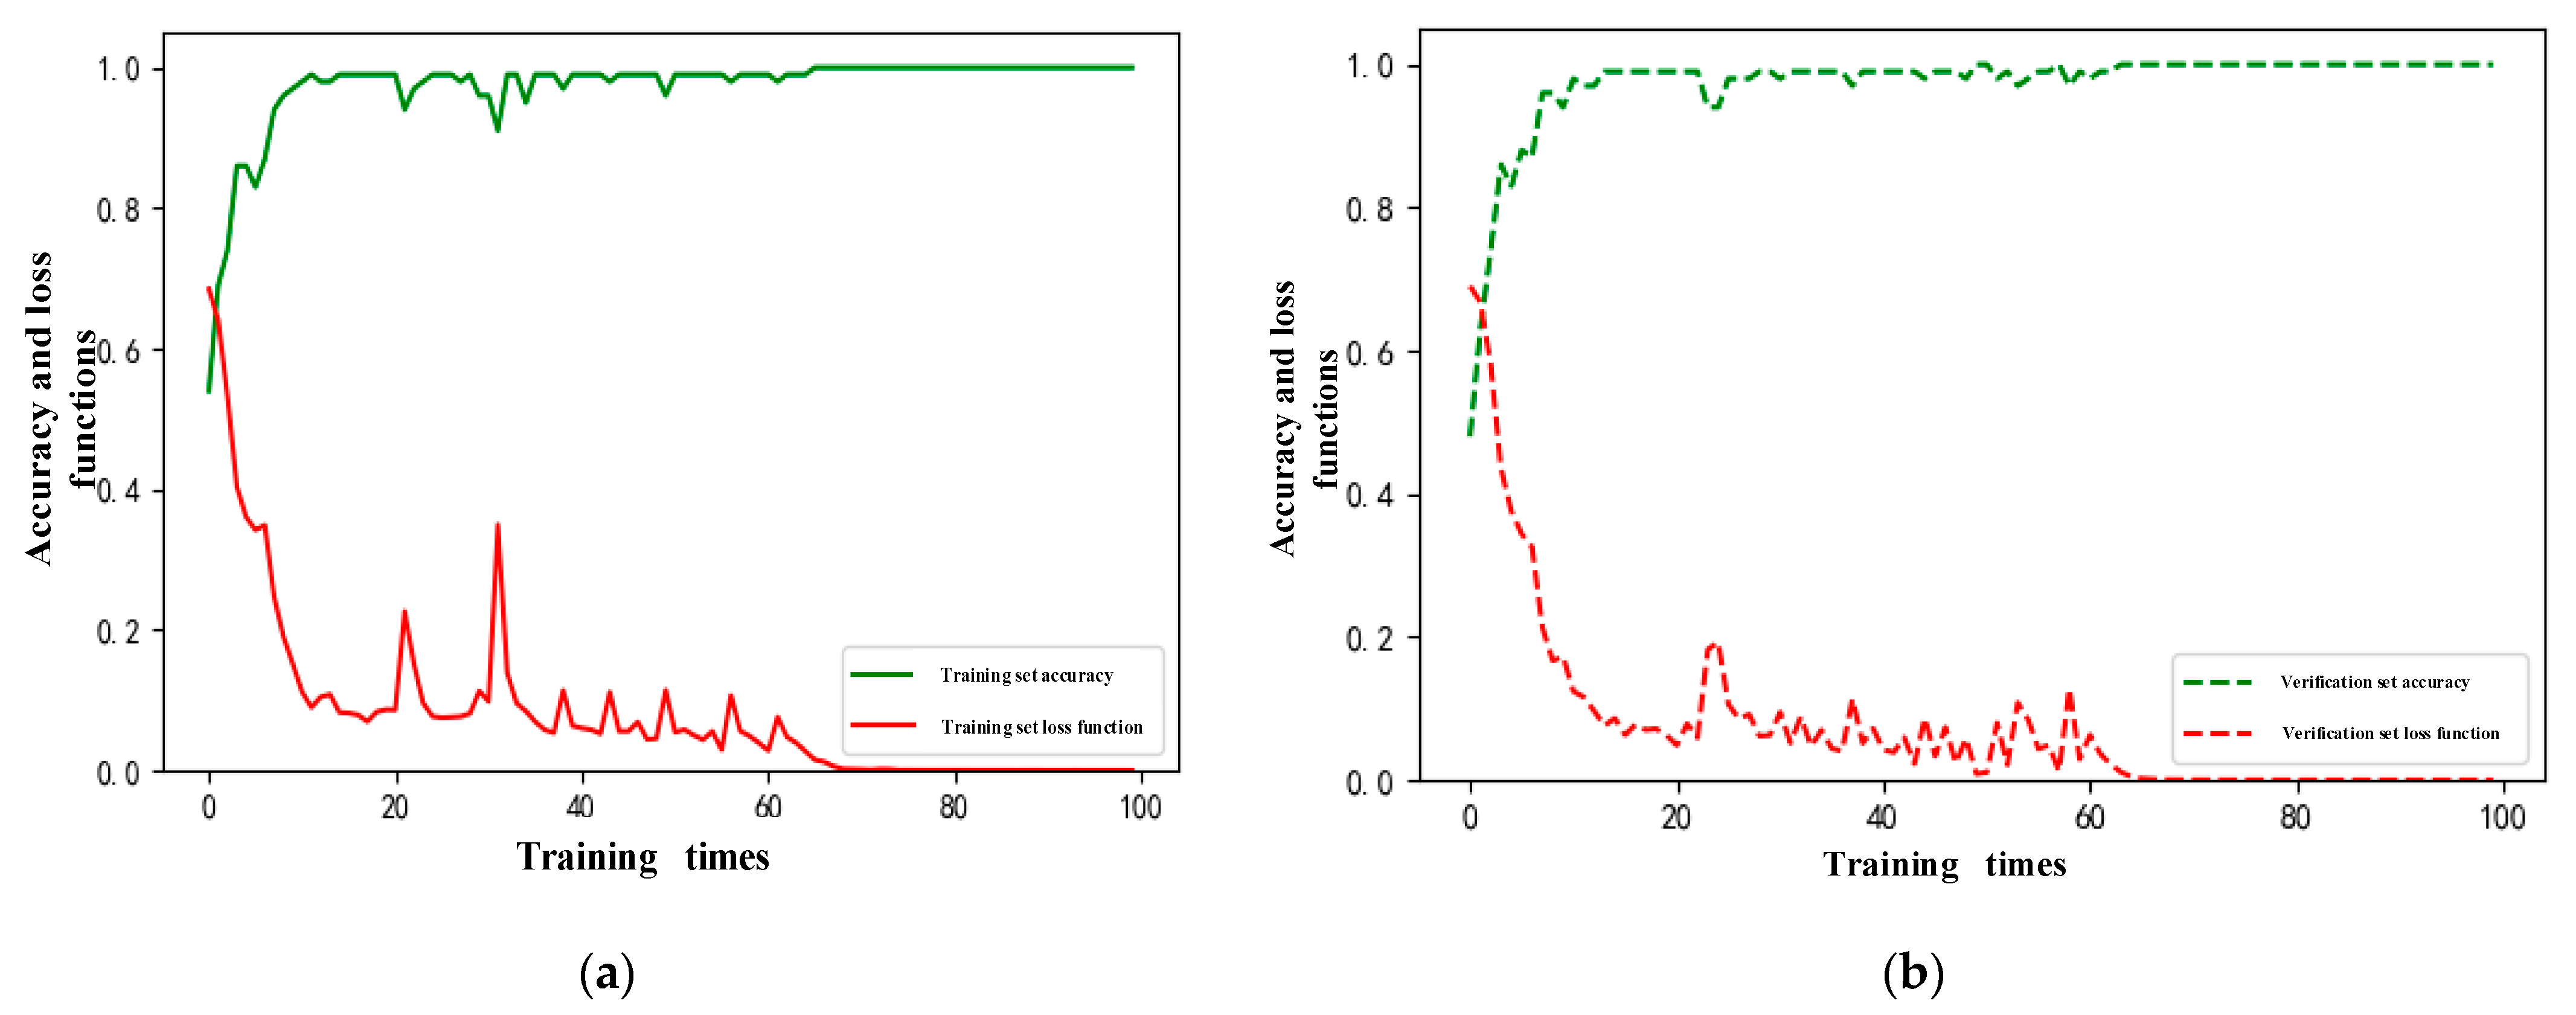
5.1. Verification of Series Fault Arc Detection Model

To validate the arc detection performance of the proposed ShuffleNet V2-ECA, a test model was developed using Python within the Pycharm IDE (2024.3.1.1-Windows). The computer configuration for running Pycharm includes an Intel Core i7-7700HQ CPU at 2.80 GHz, 128 GB of memory, and an NVIDIA GeForce GTX 1050Ti GPU (Manufacturer: NVIDIA, Corporation, Santa Clara, CA, USA). The algorithm and experimental workflow encompass three main stages: batch data collection and processing, data training and testing, and model performance visualization. TensorFlow (https://www.tensorflow.org/) serves as the back end, with Keras (https://keras.io/) as the front end for designing, debugging, evaluating, and visualizing the deep learning model. Once trained with TensorFlow, the ShuffleNet V2-ECA network can effectively classify and identify unknown normal and fault data.
Five types of loads, under both normal and fault arc conditions, were selected, resulting in a total of 10,000 datasets. After preprocessing, the data were combined into a single .CSV file, with fault data labeled as 1 and normal data as 0. To enhance training effectiveness, the datasets were randomized. These data were then imported into the optimized ShuffleNet V2-ECA model. The training was conducted with a 4:1 ratio for the training set to validation set, using a default learning rate of 0.0001. The training performance on the training set is shown in Figure 5a. Figure 5a shows the trend of accuracy and loss during the model training phase. In the early stages, the loss decreased rapidly while accuracy improved steadily. From the 10th iteration onward, the rate of change slowed, but the loss continued to decline, and accuracy exhibited a steady upward trend with minor fluctuations. By the 67th iteration, the model achieved convergence with an accuracy of 0.99 and a loss value below 0.001, indicating successful optimization.
Figure 5b shows the trend of accuracy and loss during the validation phase. Using a validation set of 2000 samples, the accuracy and loss curves exhibit minimal fluctuations after the 26th iteration, suggesting that the model’s hyperparameters were well optimized, with stable performance on the validation set.

5.2. Model Detection Result Analysis

The validation set results indicate that the model’s hyperparameters have been adjusted to an optimal range, eliminating the need for further fine-tuning. However, to ensure robust model performance, it is essential to assess its generalization ability, specifically its classification accuracy on new, unseen samples.
For evaluating classification performance, a binary classification approach is applied. In binary classification, there are four possible outcomes: predictions can be either true positive (TP), false positive (FP), true negative (TN), or false negative (FN), based on whether the instances belong to the positive (1) or negative (0) class. The accuracy rate, defined as the ratio of TP and TN to the total sample count, is typically represented by a confusion matrix.
To evaluate the generalization capability of the trained model, new datasets were collected, consisting of 10 samples each under normal and fault conditions across five load types, totaling 100 samples (50 normal and 50 fault). These samples were classified using the trained model, and the classification results for a single test, shown in Figure 6, indicate that all fault signals were correctly identified, while one normal signal was misclassified as a fault arc. To ensure the reliability of the results, the test was repeated five times, and the average accuracy was calculated to be 97.8%, as summarized in Table 2.
In addition to evaluating overall accuracy, the identification performance was assessed for three specific load types: resistive, inductive, and capacitive. The heater, electric drill, and computer were selected to represent these load types, respectively, with 100 datasets measured for each. In Table 3, the electric drill demonstrated the lowest recognition rate of 89.6%, likely due to its current waveform exhibiting random high-frequency components, even under normal operating conditions. These components closely resemble the characteristics of fault arcs, complicating the identification process and reducing detection accuracy.
To further validate the performance of ShuffleNet V2, its accuracy and computational efficiency were compared against other lightweight neural networks, including AlexNet, PB neural network + WT, and SRFCNN. Table 4 highlights the superior accuracy of ShuffleNet V2, achieving an accuracy of 97.8%, the highest among the tested models. Additionally, ShuffleNet V2 demonstrated the fastest inference time, requiring only 16.96 ms per sample, making it highly suitable for real-time applications.
These results in Table 5 confirm that ShuffleNet V2 provides the best trade-off between accuracy and computational efficiency. Its performance makes it particularly advantageous for deployment on embedded devices such as the Jetson Nano, where low latency and high efficiency are essential for real-time fault arc detection.

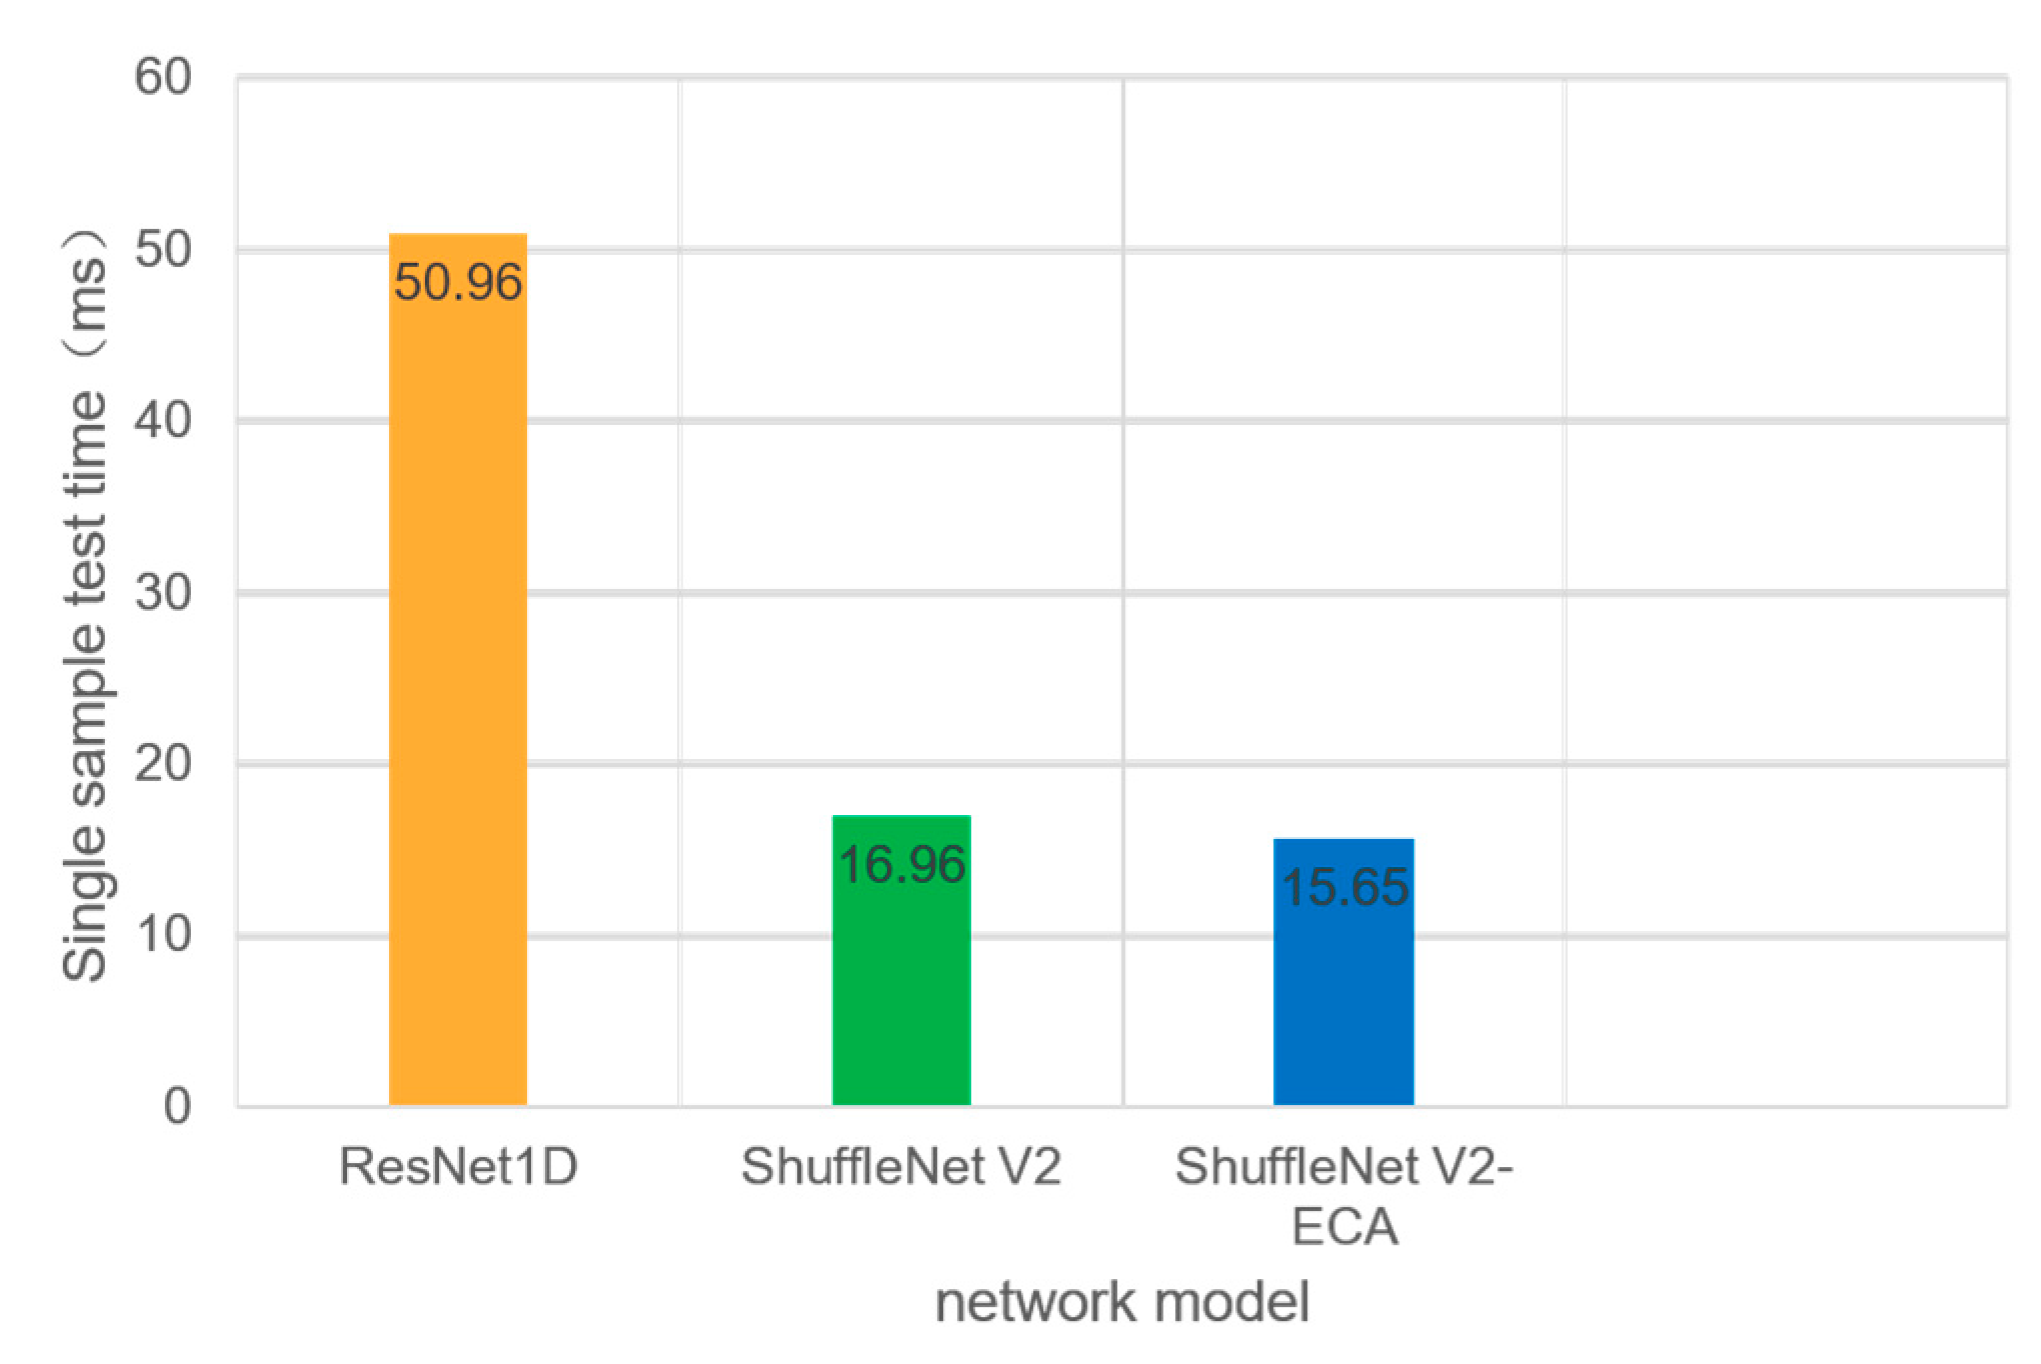
5.3. Performance Test of Embedded Equipment

Real-time performance is a critical metric for fault arc detection methods. For a given accuracy level, shorter detection times reduce the impact of fault arcs on circuits and equipment. According to International Electrotechnical Commission (IEC) and Underwriters Laboratories (UL) standards UL 1699-1998 [2], IEC 62606-2013 [26], arc faults should be cleared within 0.12 to 1 s, with shorter detection times being preferable. However, since practical arc fault detection device performance is constrained by budget and device size, testing times on a PC are not representative of actual performance. Therefore, the model must be deployed on edge devices with lower computational power but equipped with onboard AI and data analysis capabilities to evaluate practical feasibility. This study utilizes the Jetson Nano as the edge device for performance testing.
The Jetson Nano, an embedded low-power computing platform developed by NVIDIA, is optimized for AI and machine learning tasks with GPU-accelerated capabilities that enable real-time inference on edge devices. It is widely used in edge computing applications, such as smart cameras, autonomous driving, robotics, smart security, and drones. Equipped with NVIDIA’s Maxwell (NVIDIA, Santa Clara, CA, USA) architecture GPU with 128 CUDA cores, the Jetson Nano provides 472 GFLOPs of floating-point performance. Additionally, it features a quad-core ARM Cortex-A57 (ARM Holdings, Cambridge, UK) processor at 1.43 GHz and 4 GB of LPDDR4 memory, making it capable of handling complex AI tasks with low power consumption.
For this study, modified versions of ResNet1D and ShuffleNet V2 were deployed on the Jetson Nano. Given that the detection model processes only one segment of current data at a time in practical scenarios, the batch size was set to 1, aligning with real-world conditions despite increased testing time. The model loads optimal parameters trained on the PC and performs detection exclusively. The resulting single-sample detection times are illustrated in the following figure.
As shown in Figure 7, on an embedded platform with low computational power, the performance gap between networks becomes more pronounced. The training test time for ShuffleNet V2 on a PC is approximately 61.75% of that for ResNet1D, and the test time per sample for ShuffleNet V2 on the Jetson Nano is only 30.7% of that for ResNet1D. This suggests that the speed advantage of a lightweight network structure is even greater on low-power, lower-performance platforms. The single-sample test time for ShuffleNet V2-ECA is only 15.65 ms, which is significantly below one power frequency cycle of 20 ms. Consequently, the proposed ShuffleNet V2-ECA arc fault detection model demonstrates strong potential for the development of fault arc breakers that comply with international standards GB/31143-2014 [25], IEC 62606-2013 [26].

6. Conclusions

In this study, an advanced experimental platform was developed to simulate series fault arcs and collect time-series current signals under various load conditions, creating a robust and comprehensive fault arc database. Using the improved ShuffleNet V2-ECA network model, the proposed method achieved a high fault arc detection accuracy of 97.8% on the validation set, outperforming existing algorithms such as AlexNet (85.25%), TDV-CNN (97.7%), and GLGCO-SVM (94.7%). The model’s real-time performance was evaluated on the Jetson Nano embedded platform, demonstrating a rapid detection cycle of 15.65 ms per sample, which is well below the power frequency cycle of 20 ms, meeting the international standards GB/31143-2014 [25], IEC 62606-2013 [26] for arc fault detection.
Compared to other deep learning-based methods, this approach offers improved computational efficiency and scalability, requiring fewer computational resources while maintaining high accuracy. Additionally, the integration of the efficient channel attention (ECA) mechanism enhanced the model’s ability to prioritize task-relevant features, resulting in superior classification performance across a variety of load types. Among tested load types, the model achieved the lowest accuracy of 89.6% for inductive loads (electric drills), highlighting the potential challenge of random high-frequency harmonics in fault arc signals.
Future work will focus on expanding the fault arc database, further optimizing the model’s structure, and validating the proposed method on additional embedded platforms for real-world applications in residential electrical systems.

Author Contributions

Methodology, Y.L.; Investigation, L.F. and K.X.; Resources, Y.H.; Writing—original draft, Y.L.; Writing—review & editing, Y.L.; Project administration, H.M. All authors have read and agreed to the published version of the manuscript.

Funding

This research received no external funding.

Data Availability Statement

No new data were created or analyzed in this study.

Conflicts of Interest

Authors Liping Fan and Kun Xiang were employed by the State Grid Hubei Electric Power Co., Ltd. Yichang Supply Company. The remaining authors declare that the research was conducted in the absence of any commercial or financial relationships that could be construed as a potential conflict of interest.

References

  1. Qu, N.; Wang, J.; Liu, J. An Arc Fault Detection Method Based on Current Amplitude Spectrum and Sparse Representation. IEEE Trans. Instrum. Meas. 2019, 68, 3785–3792. [Google Scholar] [CrossRef]
  2. UL 1699-1999; Standard for Safety for Arc Fault Circuit Interrupters. Underwriters Laboratories: Northbrook, IL, USA, 1999.
  3. Alsumaidaee, Y.A.M.; Yaw, C.T.; Koh, S.P. Detecting arcing faults in switchgear by using deep learning techniques. Appl. Sci. 2023, 13, 4617. [Google Scholar] [CrossRef]
  4. Seeley, D.; Sumner, M.; Thomas, D.W.P.; Greedy, S. DC Series Arc Fault Detection Using Fractal Theory. In Proceedings of the 2023 IEEE International Conference on Electrical Systems for Aircraft, Railway, Ship Propulsion and Road Vehicles & International Transportation Electrification Conference (ESARS-ITEC), Venice, Italy, 29–31 March 2023; pp. 1–6. [Google Scholar] [CrossRef]
  5. Riba, J.R.; Moreno-Eguilaz, M. Arc fault protections for aeronautic applications: A review identifying the effects, detection methods, current progress, limitations, future challenges, and research directions. IEEE Access 2022, 10, 56789–56802. [Google Scholar] [CrossRef]
  6. Ananthan, S.N.; Bastos, A.F.; Santoso, S.; Feng, X.; Penney, C.; Gattozzi, A.; Hebner, R. Signatures of Series Arc Faults to Aid Arc Detection in Low-Voltage DC Systems. In Proceedings of the 2020 IEEE Power & Energy Society General Meeting (PESGM), Montreal, QC, Canada, 2–6 August 2020; pp. 1–5. [Google Scholar] [CrossRef]
  7. Liu, Y.; Guo, F.; Ren, Z.; Wang, P.; Nguyen, T.N.; Zheng, J.; Zhang, X. Feature Analysis in Time-Domain and Fault Diagnosis of Series Arc Fault. In Proceedings of the 2017 IEEE Holm Conference on Electrical Contacts, Denver, CO, USA, 10–13 September 2017; pp. 306–311. [Google Scholar] [CrossRef]
  8. Wang, C.; Wang, M.; Wang, A.; Zhang, X.; Zhang, J.; Ma, H.; Yang, N.; Zhao, Z.; Lai, C.S.; Lai, L.L. Multiagent deep reinforcement learning-based cooperative optimal operation with strong scalability for residential microgrid clusters. Energy 2024, 314, 134165. [Google Scholar] [CrossRef]
  9. Rau, S.-H.; Lee, W.-J. DC Arc Model Based on 3-D DC Arc Simulation. IEEE Trans. Ind. Appl. 2016, 52, 5255–5261. [Google Scholar] [CrossRef]
  10. Kim, J.C.; Neacşu, D.O.; Ball, R.; Lehman, B. Clearing Series AC Arc Faults and Avoiding False Alarms Using Only Voltage Waveforms. IEEE Trans. Power Deliv. 2020, 35, 946–956. [Google Scholar] [CrossRef]
  11. Yu, Q.; Zhang, Y.; Lu, W. Multi-Branch Series Arc Fault Detection Based on MEEMD and GRU Network. In Proceedings of the 2022 4th International Symposium on Smart and Healthy Cities (ISHC), Shanghai, China, 16–17 December 2022; pp. 78–84. [Google Scholar] [CrossRef]
  12. Duan, P.; Xu, L.; Ding, X.; Ning, C.; Duan, C. An Arc Fault Diagnostic Method for Low Voltage Lines Using the Difference of Wavelet Coefficients. In Proceedings of the 2014 9th IEEE Conference on Industrial Electronics and Applications (ICIEA), Hangzhou, China, 9–11 June 2014; pp. 401–405. [Google Scholar] [CrossRef]
  13. Chen, H.; Liu, X.; Shi, H.; Chen, M.; Zheng, J. DC Series Arc Fault Diagnosis and Feature Extraction. In Proceedings of the 2023 IEEE International Conference on Applied Superconductivity and Electromagnetic Devices (ASEMD), Tianjin, China, 27–29 October 2023; pp. 1–2. [Google Scholar] [CrossRef]
  14. Cheng, H.; Chen, X.; Xiao, W.; Wang, C. Short-Time Fourier Transform Based Analysis to Characterize Series Arc Fault. In Proceedings of the 2009 2nd International Conference on Power Electronics and Intelligent Transportation System (PEITS), Shenzhen, China, 19–20 December 2009; pp. 185–188. [Google Scholar] [CrossRef]
  15. Artale, G.; Cataliotti, A.; Cosentino, V.; Di Cara, D.; Di Stefano, A.; Ditta, V.; Panzavecchia, N.; Tinè, G.; Zinno, A. Measurement of Time Domain Parameters for Series Arc Fault Detection: Sensitivity Analysis in the Presence of Noise. In Proceedings of the 2024 IEEE 22nd Mediterranean Electrotechnical Conference (MELECON), Porto, Portugal, 25–27 June 2024; pp. 668–673. [Google Scholar] [CrossRef]
  16. Liu, S.; Dong, L.; Liao, X.; Cao, X.; Wang, X.; Wang, B. Application of the Variational Mode Decomposition-Based Time and Time–Frequency Domain Analysis on Series DC Arc Fault Detection of Photovoltaic Arrays. IEEE Access 2019, 7, 126177–126190. [Google Scholar] [CrossRef]
  17. Chen, F.; Li, S.; Han, J.; Ren, F.; Yang, Z. Review of Lightweight Deep Convolutional Neural Networks. Arch. Comput. Methods Eng. 2024, 31, 1915–1937. [Google Scholar] [CrossRef]
  18. He, Z.; Xu, Z.; Zhao, H.; Li, W.; Zhen, Y.; Ning, W. Detecting Series Arc Faults Using High-Frequency Components of Branch Voltage Coupling Signal. IEEE Trans. Instrum. Meas. 2024, 73, 3528413. [Google Scholar] [CrossRef]
  19. Han, C.X.; Wang, Z.Y.; Tang, A.X.; Guo, F.Y. Recognition Method of AC Series Arc Fault Characteristics Under Complicated Harmonic Conditions. IEEE Trans. Instrum. Meas. 2021, 70, 3509709. [Google Scholar] [CrossRef]
  20. Jiang, J.; Wen, Z.; Zhao, M.; Bie, Y.; Li, C.; Tan, M.; Zhang, C. Series Arc Detection and Complex Load Recognition Based on Principal Component Analysis and Support Vector Machine. IEEE Access 2019, 7, 47221–47229. [Google Scholar] [CrossRef]
  21. Nishimura, R.; Higaki, M.; Kitaoka, N. Mapping Acoustic Vector Space and Document Vector Space by RNN-LSTM. In Proceedings of the IEEE 7th Global Conference on Consumer Electronics (GCCE), Nagoya, Japan, 13 December 2018; pp. 329–330. [Google Scholar] [CrossRef]
  22. Wang, Y.; Hou, L.; Paul, K.C.; Ban, Y. ArcNet: Series AC arc fault detection based on raw current and convolutional neural network. IEEE Trans. Power Electron. 2021, 37, 12410–12422. [Google Scholar] [CrossRef]
  23. Li, W.; Liu, Y.; Li, Y.; Guo, F. Series Arc Fault Diagnosis and Line Selection Method Based on Recurrent Neural Network. IEEE Access 2020, 8, 177815–177822. [Google Scholar] [CrossRef]
  24. Yang, K.; Chu, R.; Zhang, R.; Xiao, J.; Tu, R. A Novel Methodology for Series Arc Fault Detection by Temporal Domain Visualization and Convolutional Neural Network. Sensors 2020, 20, 162. [Google Scholar] [CrossRef] [PubMed]
  25. GB/31143-2014; General Requirements for Arc Fault Detection Devices. National Standards of People’s Republic of China: Beijing, China, 2014.
  26. IEC 62606-2013; General Requirements for Arc Fault Detection Devices. International Electrotechnical Commission: Geneva, Switzerland, 2013.
Figure 1. (a) Experiment platform. (b) Schematic of the experimental platform.
Processes 13 00135 g001
Figure 2. (a) Normal and faulty current waveforms of an electric iron; (b) normal and faulty current waveforms of an air conditioner; (c) normal and faulty current waveforms of an induction cooker; (d) normal and faulty current waveforms of a capacitor start motor; (e) normal and faulty current waveforms of fluorescent lamps; (f) normal and faulty current waveforms of a hand drill.
Processes 13 00135 g002aProcesses 13 00135 g002b
Figure 3. (a) Unit1 structure with channel shuffle for computational efficiency; (b) Unit2 structure for downsampling and channel doubling.
Processes 13 00135 g003
Figure 4. (a) Structure diagram of ECA’s attention mechanism; (b) units after increasing attention mechanism.
Processes 13 00135 g004
Figure 5. (a) Training accuracy and loss trends during model training; (b) validation accuracy and loss trends during model evaluation.
Processes 13 00135 g005
Figure 6. Confusion matrix of classification result.
Processes 13 00135 g006
Figure 7. Single-sample test time of each network on Jetson Nano.
Processes 13 00135 g007
Table 1. Loads used in experiments.
Device NameRated Power
Vacuum cleaner1200 W
Capacitor start motor2200 W
Induction cooker2000 W
Electric iron1100 W
Electronic variable speed hand drill800 W
Fluorescent lamp with electronic ballast36 W
Variable frequency air conditioner2500 W
Infrared disinfection cabinet700 W
Table 2. Accuracy of test.
BatchAccuracyRate
199%
297%
398%
498%
597%
Average value97.8%
Table 3. Accuracy for different load types.
Load TypeCategoryAccuracy (%)
Resistive load099.27%
198.98%
Inductive load291.20%
389.60%
Capacitive load497.67%
598.50%
Table 4. Accuracy comparison for different algorithms.
BatchAlgorithmAccuracy (%)
1AlexNet85.25%
2PB neural network + WT95.58%
3Improved AlexNet97.5%
4TDV-CNN97.7%
5SRFCNN97.67%
6GLGCO-SVM94.7%
7ShuffleNet V2-ECA97.8%
Table 5. Single-sample inference time and accuracy comparison on Jetson Nano.
AlgorithmTime per Sample (ms)
ShuffleNet V216.96
AlexNet35.12
PB neural network + WT28.47
SRFCNN30.85
Disclaimer/Publisher’s Note: The statements, opinions and data contained in all publications are solely those of the individual author(s) and contributor(s) and not of MDPI and/or the editor(s). MDPI and/or the editor(s) disclaim responsibility for any injury to people or property resulting from any ideas, methods, instructions or products referred to in the content.

