1. Introduction
The petroleum and petrochemical industry is a strategic pillar industry within the national economy. Petroleum and petrochemical facilities are often characterized by high temperatures, high pressures, flammability, and explosiveness. Once a sudden event such as a fire occurs, it may cause a series of secondary and derivative accidents, which can have catastrophic consequences and seriously threaten people’s lives and property, as well as national energy security. At present, the inspection and initial firefighting measures implemented to address fire risks on petroleum and petrochemical production sites rely on manual labor, and firefighting often relies on fixed firefighting facilities, resulting in delayed accident detection and difficulties in implementing fire prevention measures, which may lead to an increase in accidents. The use of robots to assist or replace personnel in high-risk environments to perform inspection operations and fire prevention measures effectively improves the safety management level of petroleum and petrochemical operations, allowing them to be executed in a streamlined, intelligent, and unmanned manner.
In response to the above issues, researchers at home and abroad have developed intelligent inspection robots for oil and gas leakage fires. The relevant technology has reached maturity and has been deployed and applied on petroleum and petrochemical sites; examples are Shell’s “Sensabot” robot and Anson Intelligence’s ACR inspection robot. However, through an analysis of the current status and implementation of oil and gas leakage fire inspection robots, the following problems can be determined. (1) After identifying the risks of accidents such as oil and gas leakage fires, the inspection robots need to notify the operators through alarm or command transmission, and then the operators implement early response measures. It is difficult to implement fire-extinguishing and emergency responses in a timely manner, and missing the ideal time window for fire extinguishing may lead to the occurrence of accidents. Currently, there are no relevant technical reports on robots that integrate inspection and fire-extinguishing functions. (2) In fire-extinguishing robots using a dry powder (including an ultra-fine dry powder) as the extinguishing medium, the spraying pressure cannot be controlled, making it difficult to achieve targeted treatment for large, medium, and small fires. It is difficult to implement efficient fire extinguishing with reasonable equipment for fires of different sizes, resulting in unnecessary resource waste.
Based on the above issues, an intelligent inspection and fire-extinguishing robot integrating inspection and dry powder fire-extinguishing functions has been developed.
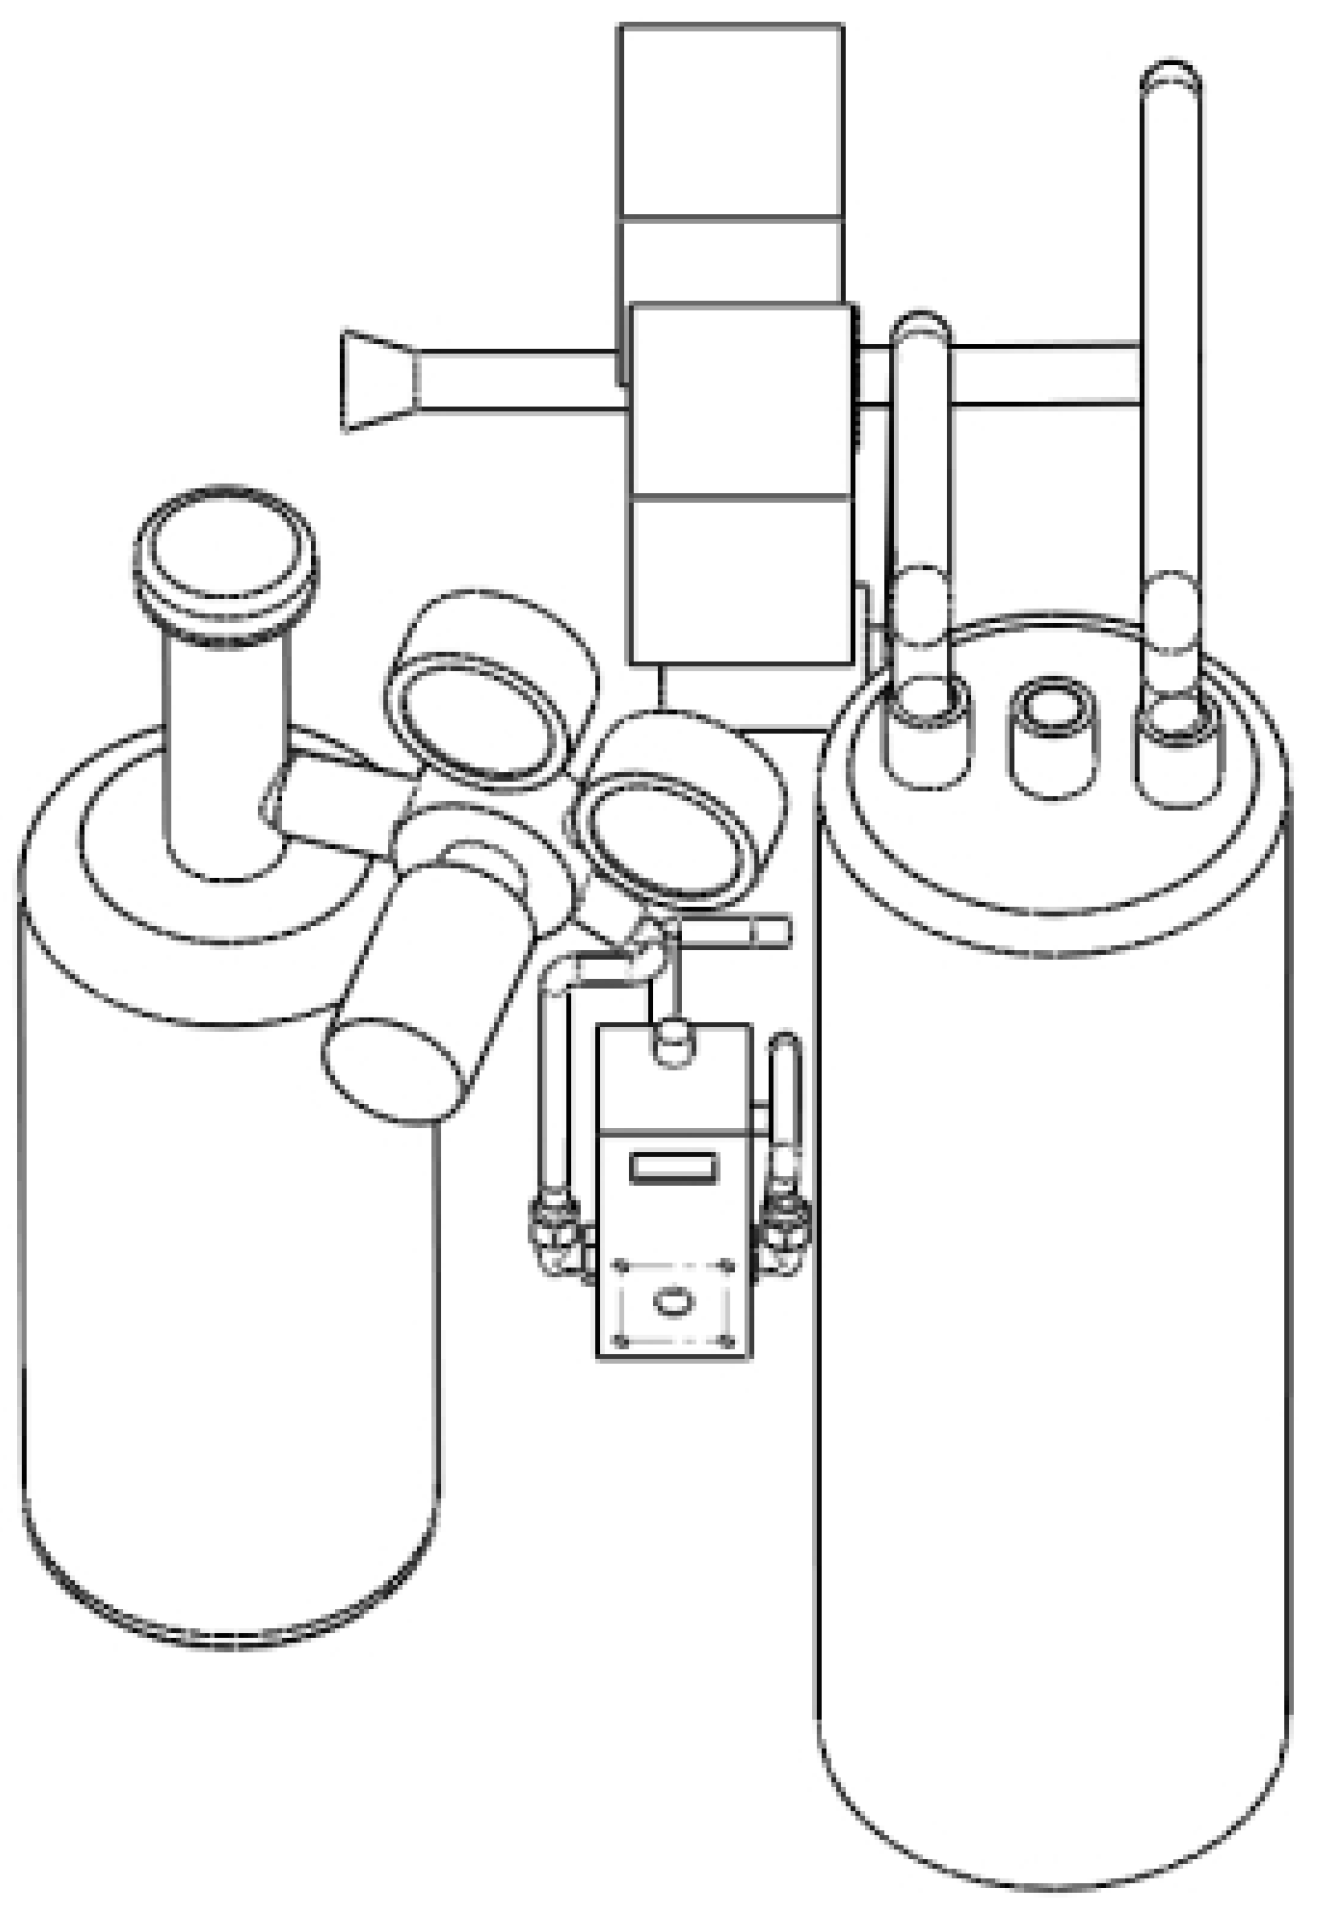
The robot consists of five modules, namely the main control module, power module, detection module, fire-extinguishing module, and wireless charging module, as well as a visual detection system and sensor detection system included in the detection module. It also contains four subsystems, including an automatic release system for the fire-extinguishing agent and a fire-extinguishing execution system included in the fire-extinguishing module. It has multiple excellent features such as intelligent autonomous inspection and control over the spray pressure of the dry powder fire-extinguishing agent (referred to as “pressure-controlled fire extinguishing”). During the autonomous inspection process, it can monitor the environment in real time through high-definition and infrared cameras, as well as sensors to detect toxic, harmful, and combustible gases and perform flame monitoring. If the system detects an abnormal temperature, fireworks, a combustible gas, etc., it can be reported to the backend operator in a timely manner. The backend operator can address the fire situation according to the size of the fire. They can choose different fire-extinguishing levels, including large, medium, and small, to implement fire-extinguishing measures through dry powder spraying. A schematic diagram of the dry powder pressure control fire-extinguishing module is shown in
Figure 1. It includes a nitrogen tank, a dry powder tank, and a pressure control drive valve group. The implementation method can be summarized as follows: the high-pressure nitrogen released by the nitrogen tank is reduced to the set pressure value through the relevant valve group, and the reduced nitrogen is regulated by the electromagnetic proportional valve to achieve a constant-pressure nitrogen input to the dry powder tank. When the pressure of the dry powder tank reaches the set value, the electric control ball valve at its outlet opens, driving the dry powder toward the nozzle for dry powder injection.
Figure 2. Pressure control and fire suppression module system control diagram. The volume of the nitrogen tank is 3 L, and the initial pressure is 15 MPa; the volume of the dry powder tank is 8 L, and the inner diameter is 160 mm; the inner diameter of the valve is 10 mm.
Table 1 shows the robot motion parameters.
For the intelligent inspection and fire-extinguishing robot with a controlled-pressure dry powder fire-extinguishing system and for related nitrogen-driven dry powder injection fire-extinguishing devices, the injection pressure, injection pipe diameter, nozzle shape, and loading ratio all have an impact on the dry powder injection effect of the system. These are important parameters in the design and development of fire-extinguishing modules and are determined through robot injection pressure gear setting, pipe diameter selection, and nozzle design. However, the mechanism of the gas–solid two-phase interaction and the flow characteristics of nitrogen-driven dry powder particle injection, as well as the influence of the related parameters on the injection effect, are not yet clear. This is not conducive to the optimization and design of dry powder controlled-pressure injection fire extinguishing. Researchers have conducted relevant research on the mechanisms of powder particle spraying and the influence of the related parameters. Theodore Gabor et al. [
1] studied the gas powder flow dynamics under different nozzle profiles and found that rectangular nozzles were not as effective in accelerating powder injection as circular nozzles. Woo Chang Sung et al. [
2] analyzed the effect of the particle size distribution on the fluid dynamics of dilute-phase pneumatic conveying systems. The results showed that although the width in the particle size distribution became larger and the standard deviation increased, the pressure drop and jump velocity per unit length decreased with the increase in the fine powder fraction in the particle size distribution. Guanlong Ren et al. [
3] used the Euler–Euler model to numerically simulate the effect of different intake positions on powder fluidization, and they found that moving the intake position backward could improve the stability of the powder output. Dmitry Portnikov et al. [
4] proposed a simple method to predict particle wear during pneumatic conveying. The experimental results and parameter studies showed that the larger the bending radius ratio, the less damage to the conveyed material. Cao et al. [
5] carried out an analytical study on the kinematic characteristics of the external flow field of a particle jet. The results showed that the jet width and boundary layer thickness had a certain effect on the velocity of the particles. With an increase in the distance from the nozzle exit position, the particle velocity showed an increase and then tended to stabilize, while the particle velocity distribution at the nozzle was not uniform and the difference was relatively large. Meyera et al. [
6] investigated the relationship between the particle velocity and the particle loading ratio during the injection process and showed that the particle velocity decreased as the loading ratio increased, and the material and shape of the particles also had an effect on the particle velocity. Kovalev et al. [
7] examined how different nozzles affected the kinematic properties of particles based on discrete particle trajectories, heat transfer models, and boundary conditions for the motion of partially slipping particles; to this aim, they used the third-order WENO finite-difference model proposed by Liu et al. [
8] and mesh refinement in the region of irregularities and strong gradients. Bhattacharya et al. [
9] compared the orders of magnitude of different forces on the particles in scaled micro-nozzles. The results of the study showed that the resistance was significantly greater than the other forces. Soliman et al. [
10,
11] investigated the effect of the particle size and pressure on the particle velocity in a jet using the finite volume method and second-order windward model, focusing on a two-phase flow in a vaccine-injected supersonic nozzle. Gilbert [
12] derived the equations of motion for particles by implementing a linear relationship between the drag and velocity difference. The results showed that the particles had a small diameter and showed hysteresis effects in the reaction zone. Varaksin et al. [
13] performed multiphase flow simulations with differently sized particles (polydisperse particles) and concluded that differently sized particles produce different velocities, affect the gas flow differently, and tend to collide with each other at lower concentrations. Yue et al. [
14] used the CFD–DEM method to study the effect of the particle density on nozzle deflection under three conditions of constant fluidization velocity, amplified fluidization velocity, and particle density. Zhong et al. [
15] used a CFD simulation to evaluate the impact of the fluid flow rate, particle size, sand volume ratio, and valve opening on the erosion and wear performance of a sleeve-type drain valve. Zhao et al. [
16] simulated the influence of the injection pressure on the fire-extinguishing efficiency of fire-extinguishing agents. The results showed that the fire-extinguishing time decreased with the increase in the injection pressure. Xiao et al. [
17] described the movement trajectories of ceramic slurry granules based on the CFD–DPM model and built a two-dimensional and three-dimensional axisymmetric mathematical model of the spray-drying process. Yang et al. [
18] investigated the effect of a Laval nozzle structure on the flow characteristics of a supersonic gas–solid two-phase flow, and they concluded that various linear types of Laval nozzles exhibit excellent axial momentum for particle cores. Wu et al. [
19] modeled CaO powders using the DPM method, investigated the effect of the carrier gas on mixing injection, and explored the gas–particle interaction. Fan et al. [
20] developed a nozzle simulation model for the discrete particle method (DPM) to predict the air–powder flow under different diameters and divergence angles. Rahimi et al. [
21,
22] developed a mathematical model for the study of sulfur dioxide and carbon dioxide removal processes in a powder particle jet bed under non-isothermal operating conditions. They used a one-dimensional flow tube model and made many assumptions about the model. Li et al. [
23] developed a numerical model to simulate a supersonic mixing jet in response to particle-induced shocks. They found that the powder significantly affected the oxygen jet by reducing the pressure wave sequence and showed that greater powder mass flow rates resulted in lower particle velocities. Chu et al. [
24] numerically analyzed the effect of the solid loading rate on the gas–solid flow patterns and interaction forces (i.e., particle–gas, particle–particle, and particle–wall) in a cyclone separator by means of the CFD–DEM method. Lain et al. [
25] numerically investigated the aerodynamic transport of spherical particles in a horizontal channel with a long rectangular cross-section. The calculations were carried out using the Eulerian–Lagrangian method with a gas-phase Reynolds stress turbulence model, taking into account the bi-directional coupling. The hydrodynamics and heat transfer of the gas–solid flow in a vertical pipe were numerically investigated by EI-Behery et al. [
26]. The Euler–Lagrange model was used to simulate the gas–solid flow. Kabeel et al. [
27] carried out an experimental and numerical computational study of solid particle injection into a turbulent crossflow under different operating conditions using the CFD–DEM method. The results showed that the inertia of the particles and the impact between the particles had a significant effect on the flow. a numerical simulation of a semi-dry desulfurization injection bed was performed by Wang et al. using the discrete element method (DEM) [
28]. A numerical study of the effect of supersonic gas–solid jets on bypass spray dry powder extinguishing devices was performed by Zhang et al. [
29].
In summary, the mechanism and flow characteristics of the gas–solid two-phase injection of nitrogen-driven dry powder particles, as well as the influence mechanisms of the driving pressure, dry powder pipe diameter, nozzle configuration, and loading ratio on dry powder injection, are not yet clear. Based on the above, this study establishes a computational fluid dynamics model for nitrogen-driven dry powder particle injection in a gas–solid two-phase flow. It explores the micro-effects of different driving pressures, pipe diameters, and nozzle configurations on dry powder injection. On this basis, a dry powder spraying experimental model is established to investigate the macroscopic spraying effect of dry powder fire extinguishing, which cannot be explored through the micro-mechanism of a gas–solid two-phase interaction. The dry powder spraying effect is investigated under different driving pressures, pipe diameters, nozzle configurations, and loading ratios. The simulation results are verified through experiments. Based on the single-factor experimental results, orthogonal experiments are designed to obtain the optimal parameter combination to achieve the best spraying effect. The research results can provide a theoretical and technical reference for the design and development of robotic controlled-pressure dry powder fire-extinguishing systems and related nitrogen-driven dry powder spraying fire-extinguishing devices.
3. Experimental Study on the Macroscopic Effect of Dry Powder Spraying
Through the numerical simulation of the gas–solid two-phase flow in dry powder injection, the microscopic mechanism of the gas–solid two-phase flow was explored. However, the macroscopic effects of different technical parameters on nitrogen-driven dry powder injection, including the effective farthest distance, effective fire-extinguishing area, and average dry powder intensity, are still unclear, and experimental research is needed to determine their effectiveness.
3.1. Material and Methods
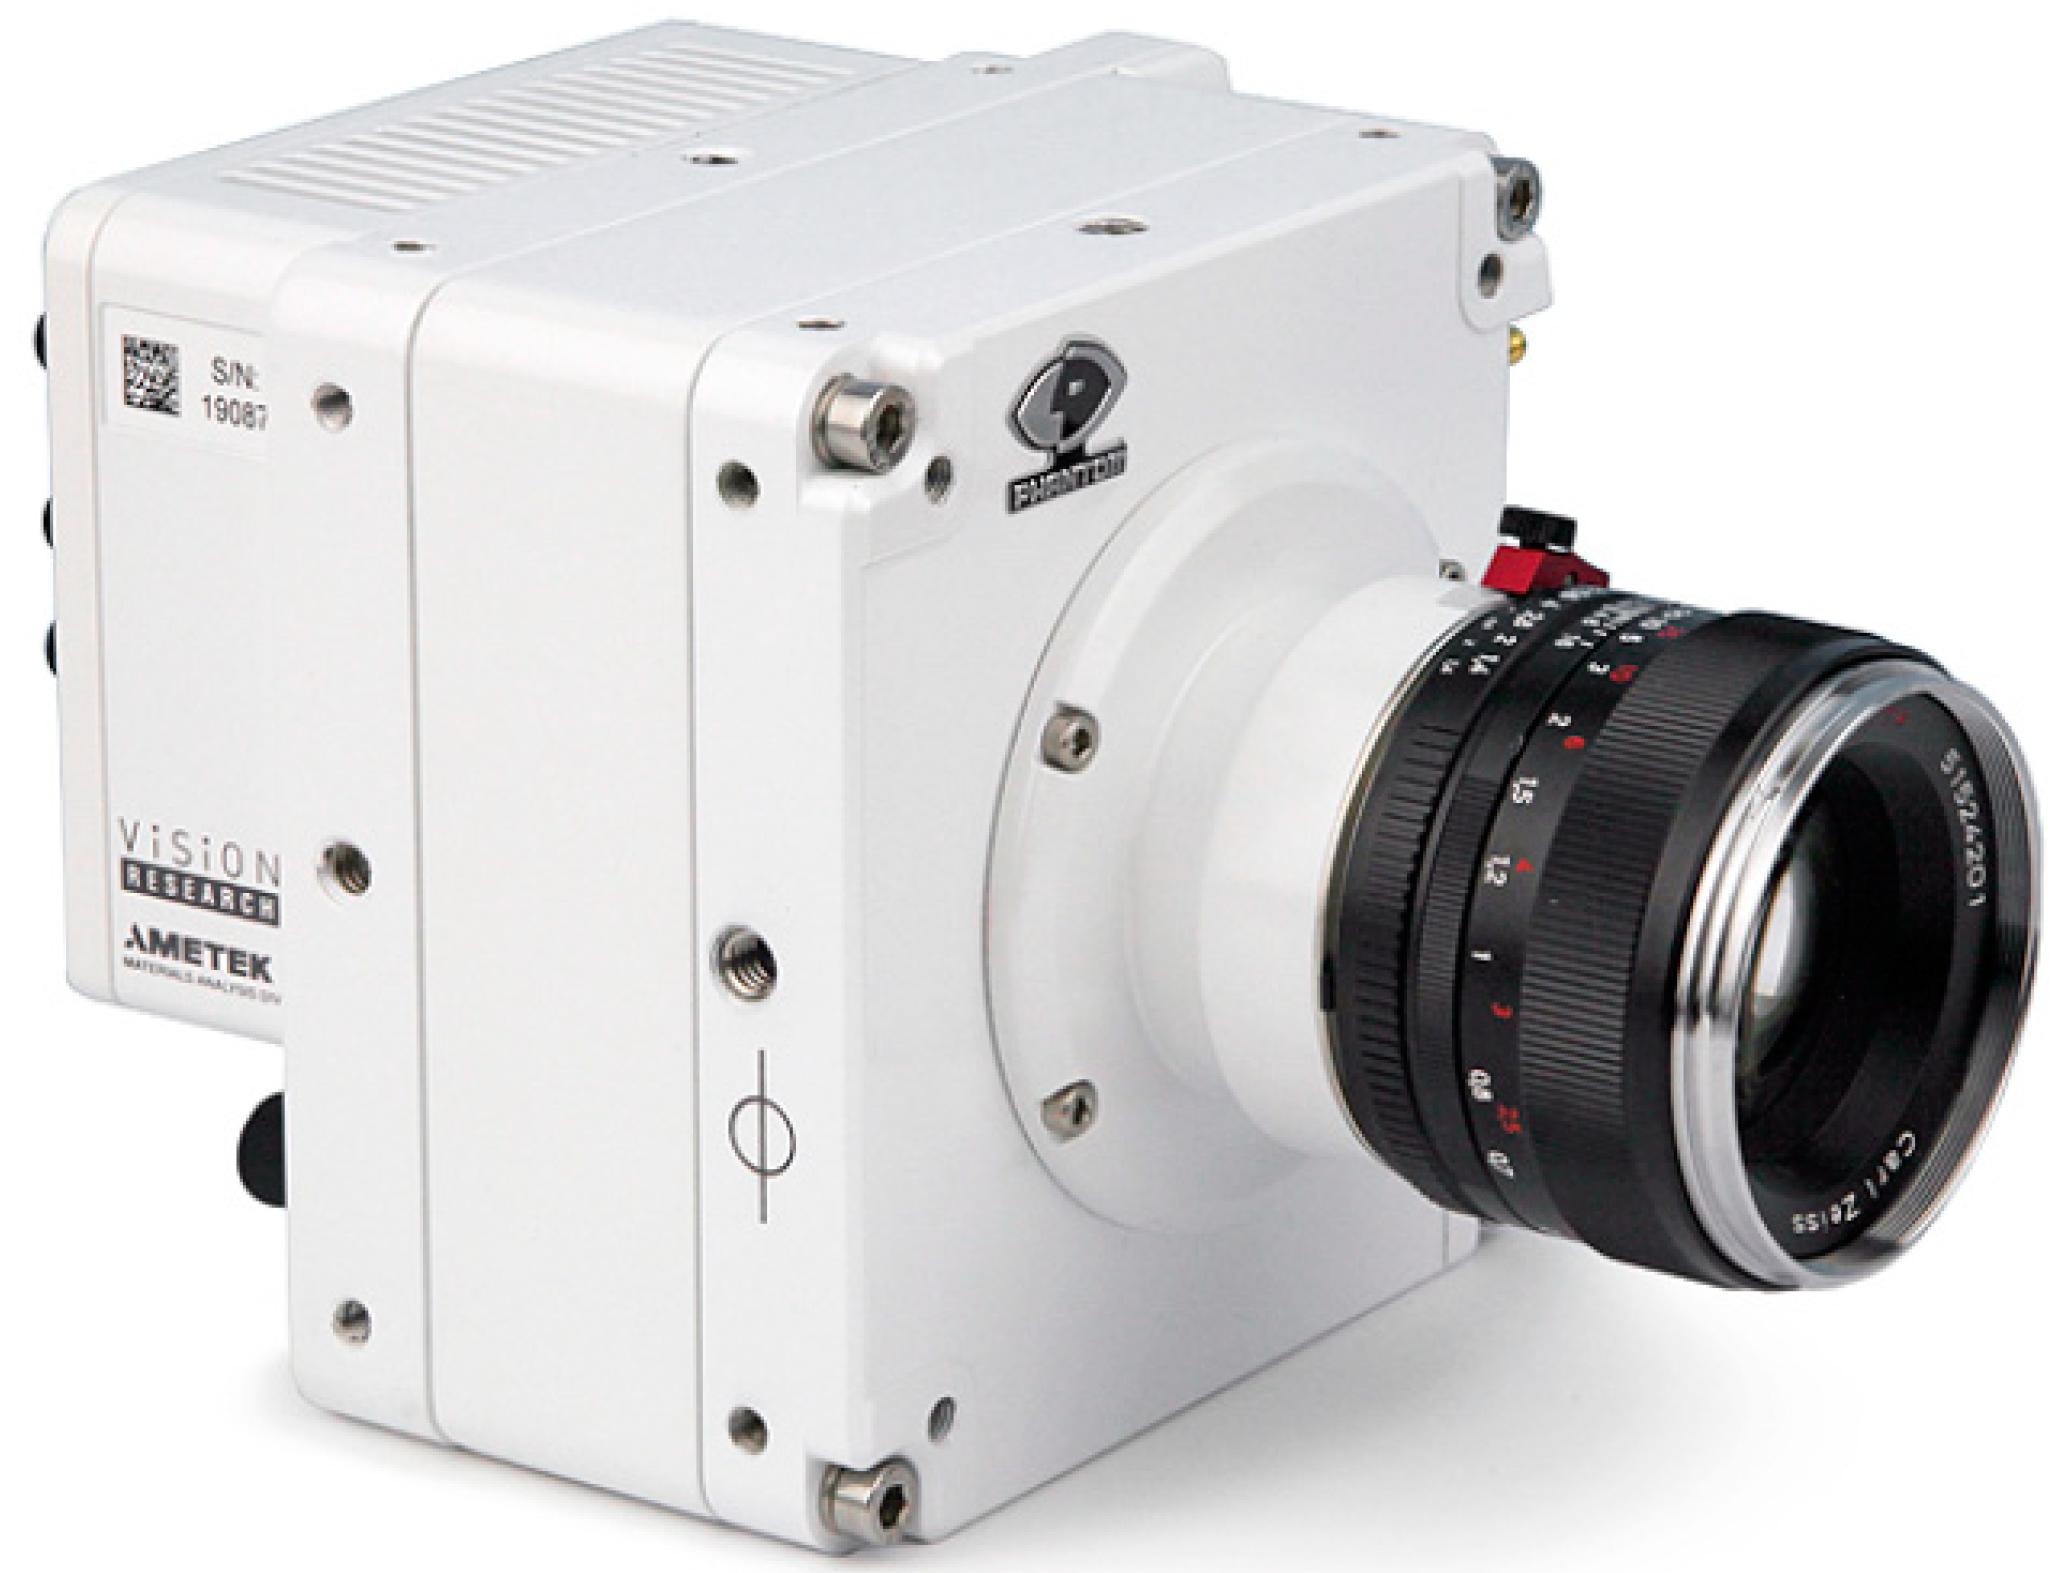
The apparatus used in this experiment mainly includes a dry powder collection box (L × W × H: 17 cm × 11 cm × 4 cm), funnel, high-speed camera (
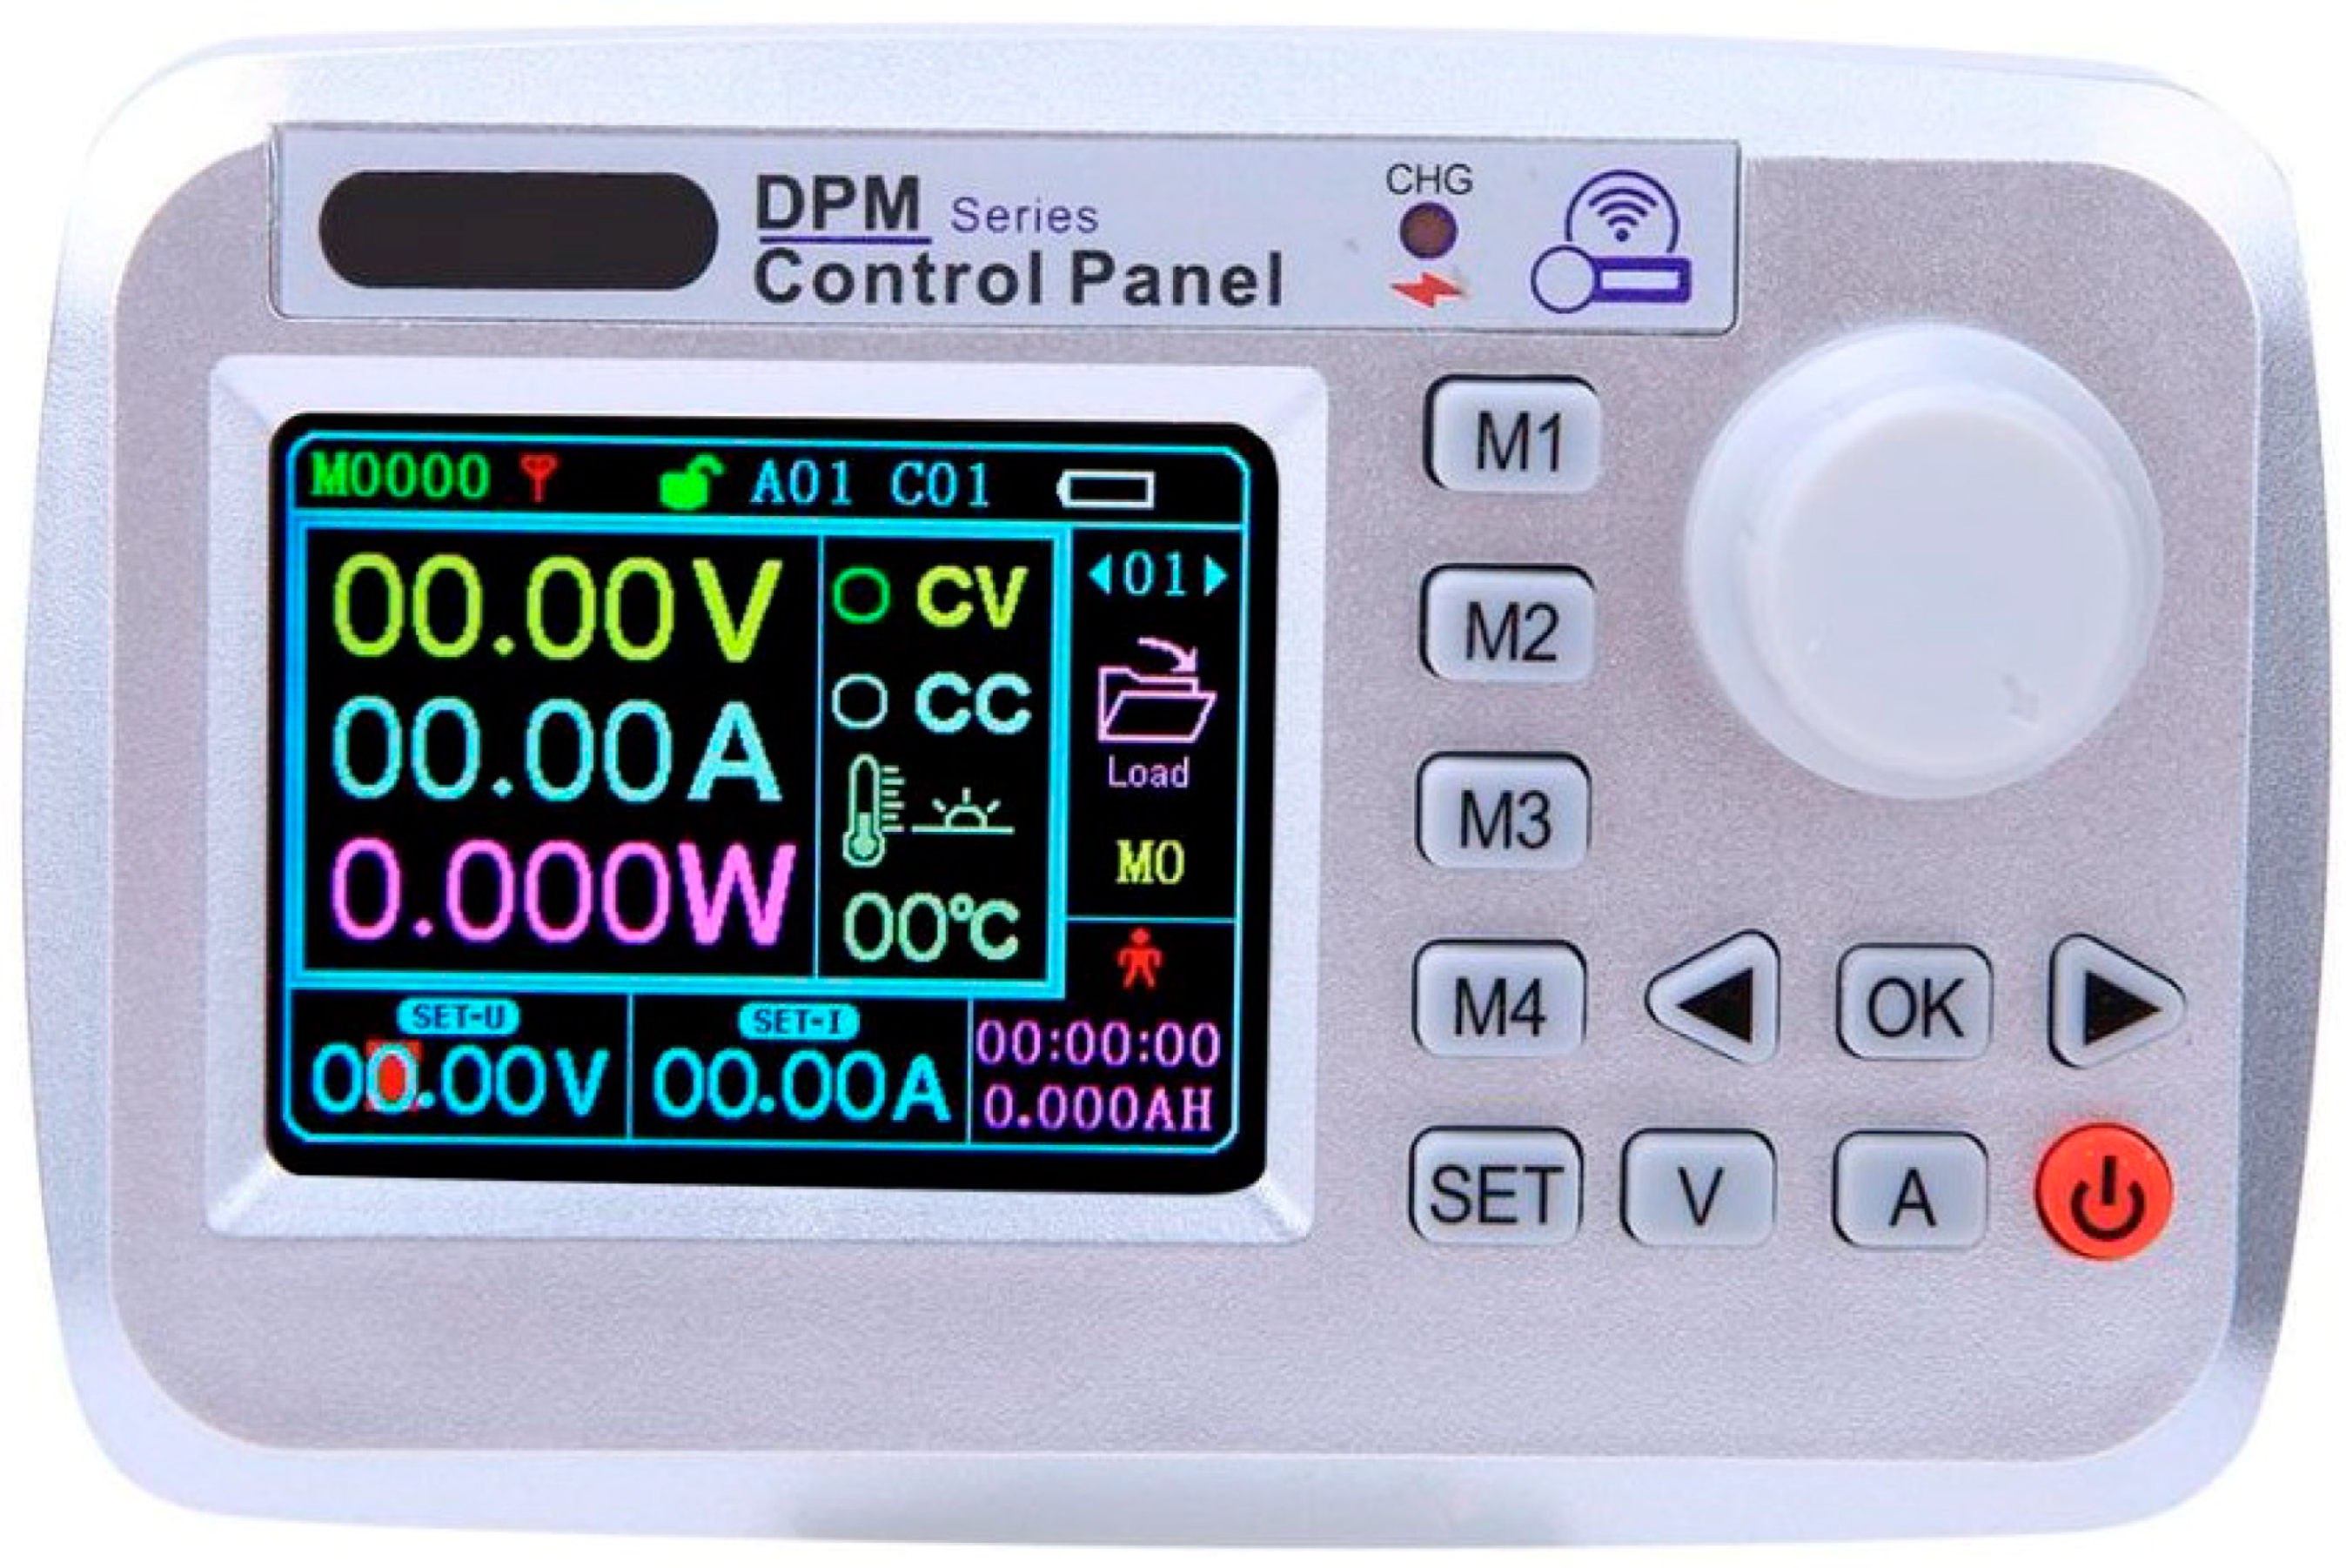
Figure 14), tape measure, and regulated DC power supply (
Figure 15). The high-speed camera is used to record the dry powder spray, the tape measure is used to measure the distance, and the regulated DC power supply is used to provide power. The extinguishing agent used in the dry powder spraying experiments in this paper is ABC dry powder extinguishing agent, which comes from the extinguishing agent produced by Zhong’an Fire Protection, with a particle size of 50 μm and a bulk density of 0.5 g/mL.
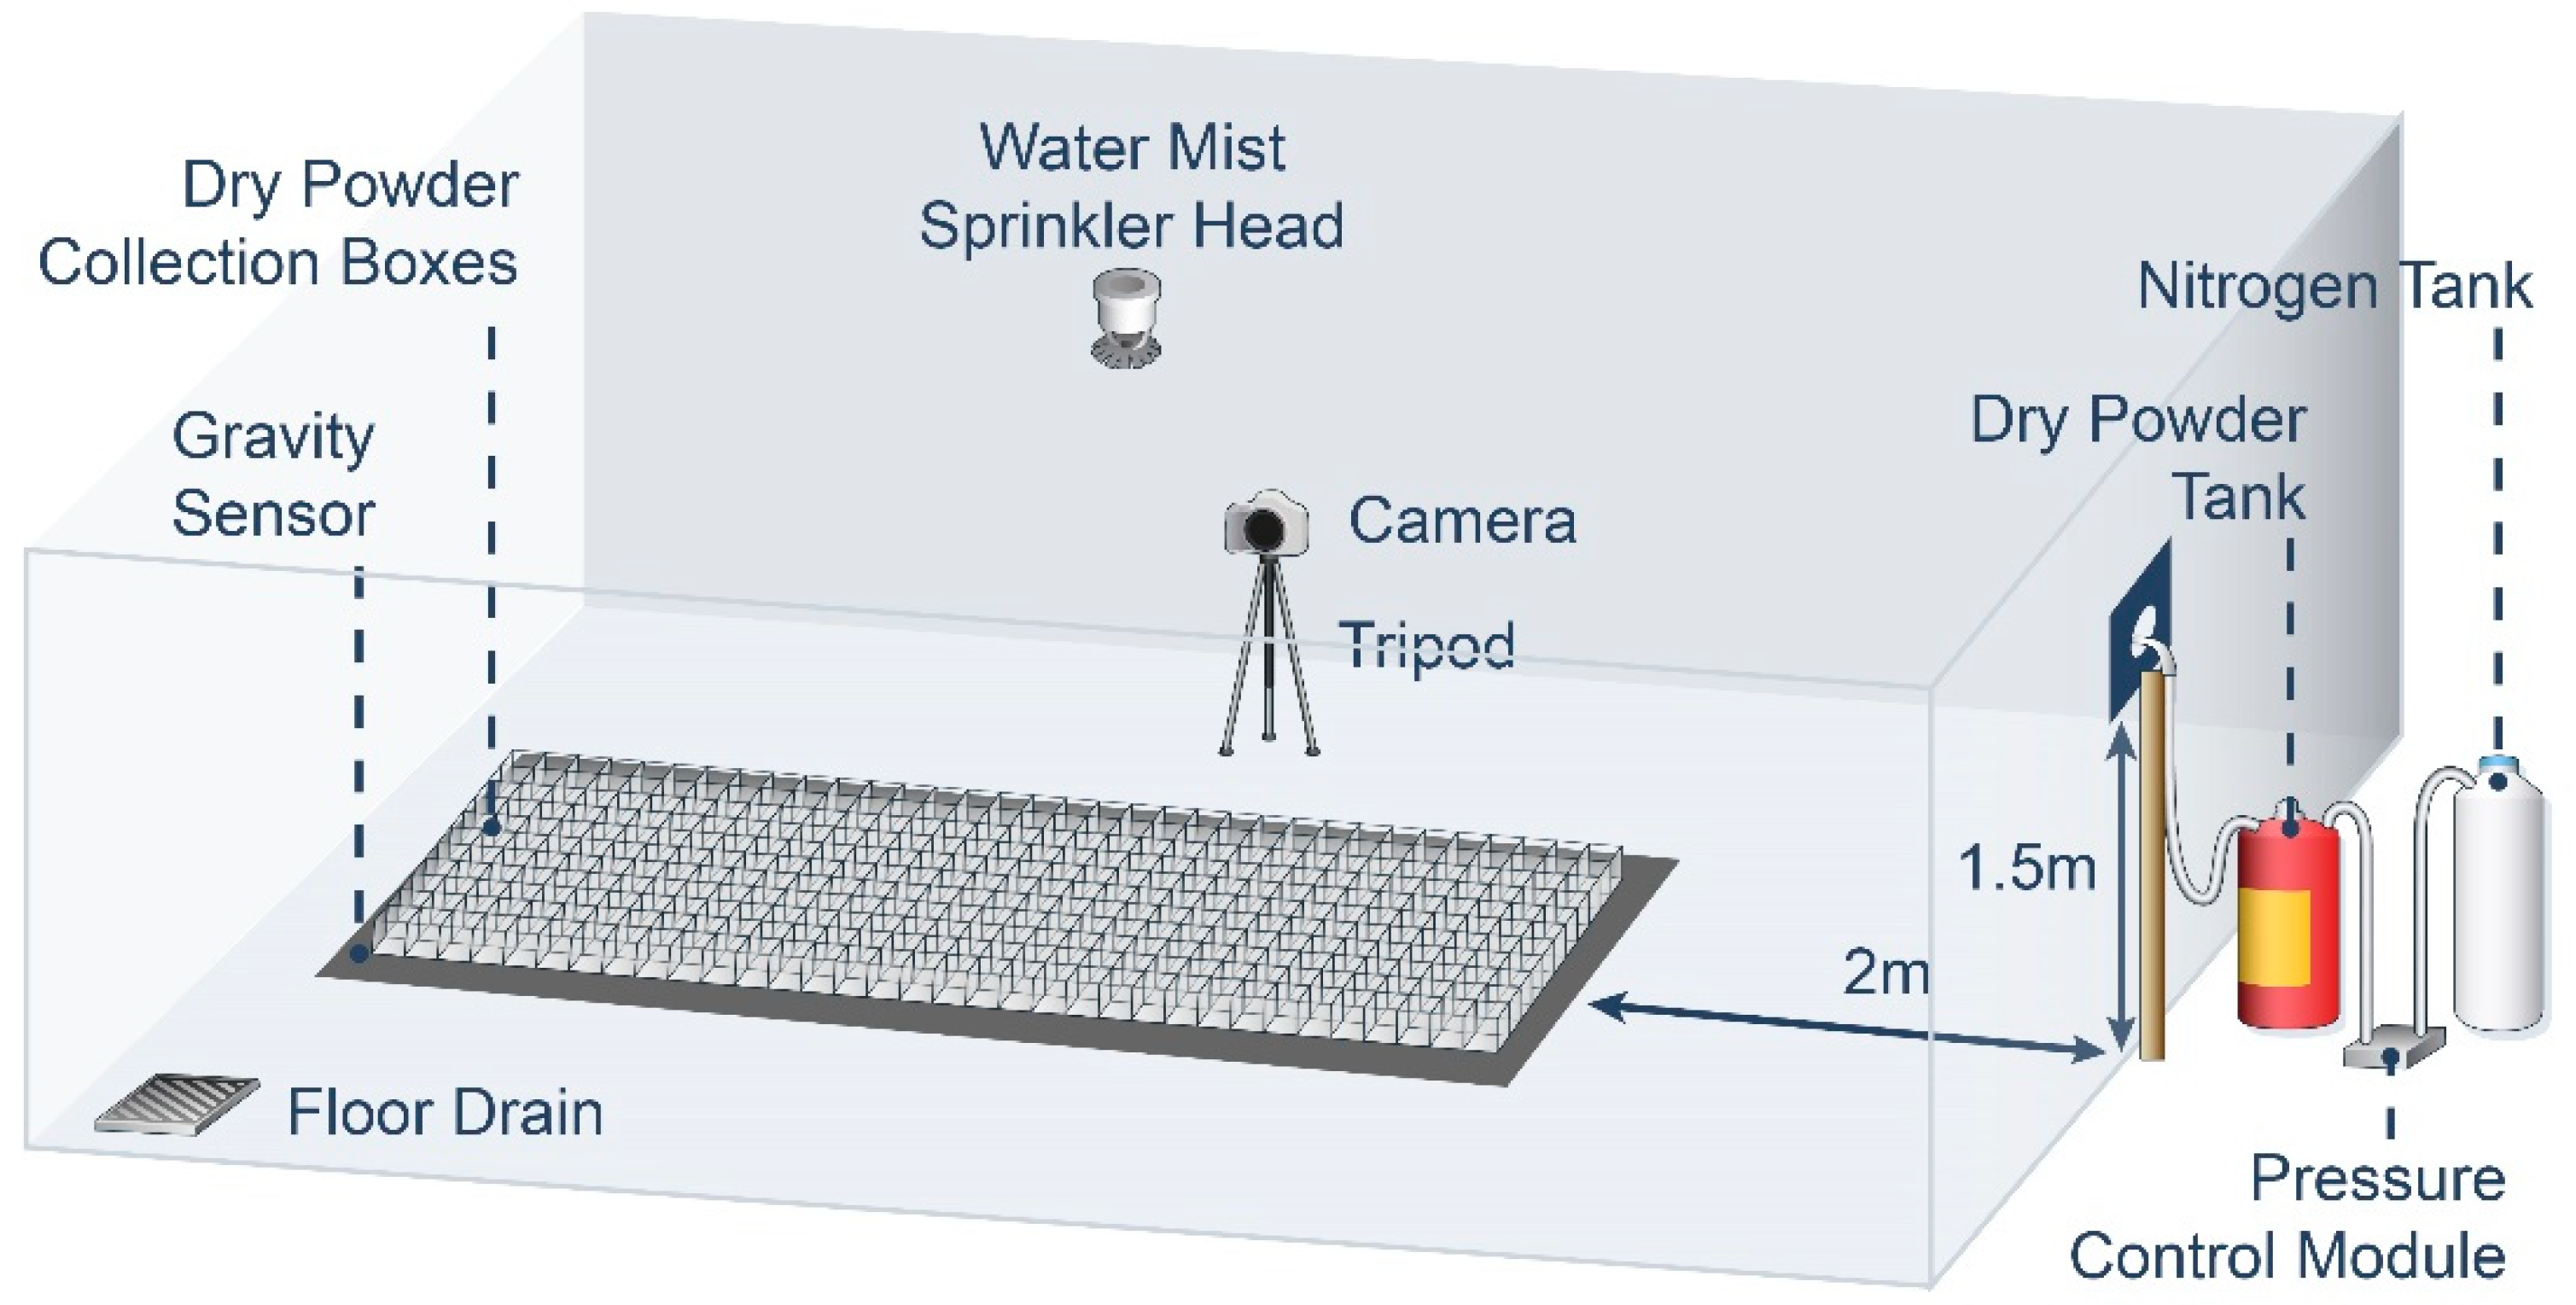
3.2. Experimental Model Construction
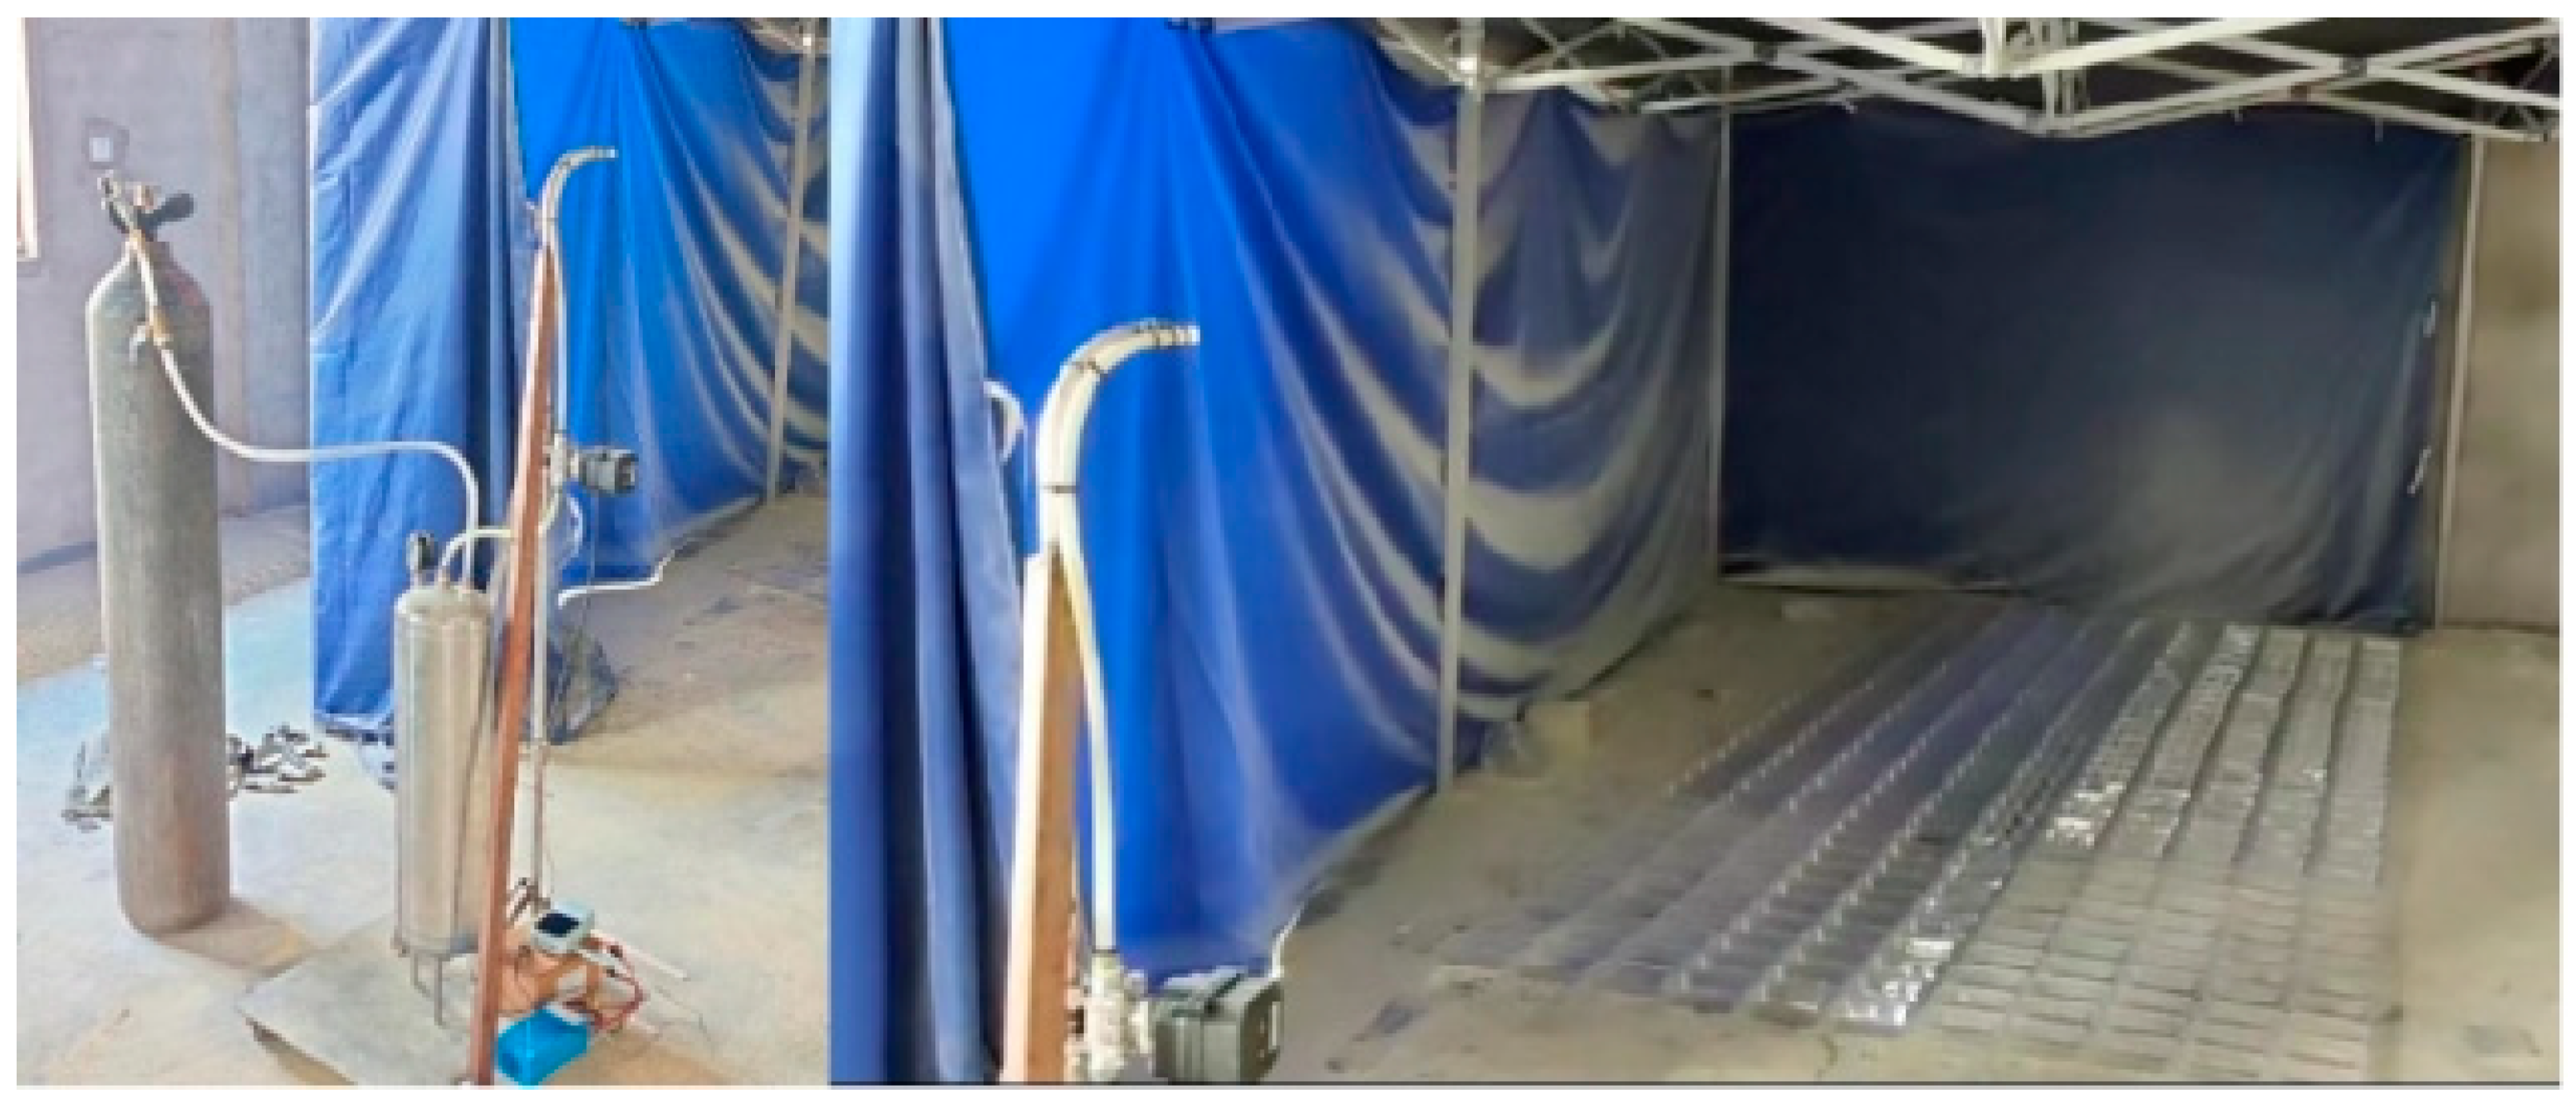
The dry powder spraying experimental device mainly consists of a dry powder tank, nitrogen tank, pressure-reducing valve, electromagnetic proportional valve, ball valve, dry powder collection box (L × W × H: 17 cm × 11 cm × 4 cm), gravity sensors, water spray nozzle, and other components. A diagram of the experimental device and the dry powder box setup is shown in
Figure 16. The device nozzle is positioned 1.5 m from the ground; the nozzle is kept horizontal and is placed 2 m directly in front of the dry powder collection box consisting of 11 columns × 34 rows. The plane schematic diagram is shown in
Figure 17. The nozzle outlet is defined as the origin, the horizontal direction of the center axis for the X-axis, and the vertical direction for the Y-axis. The sweeping device adopts a high-pressure fine mist water gun to carry out dust reduction and rinsing, and there is a filter screen at the floor drain to collect waste dry powder so as to reduce the amount of environmental pollution. The gravity sensor determines the quality of the sprayed dry powder in real time and feeds the result back to the computer.
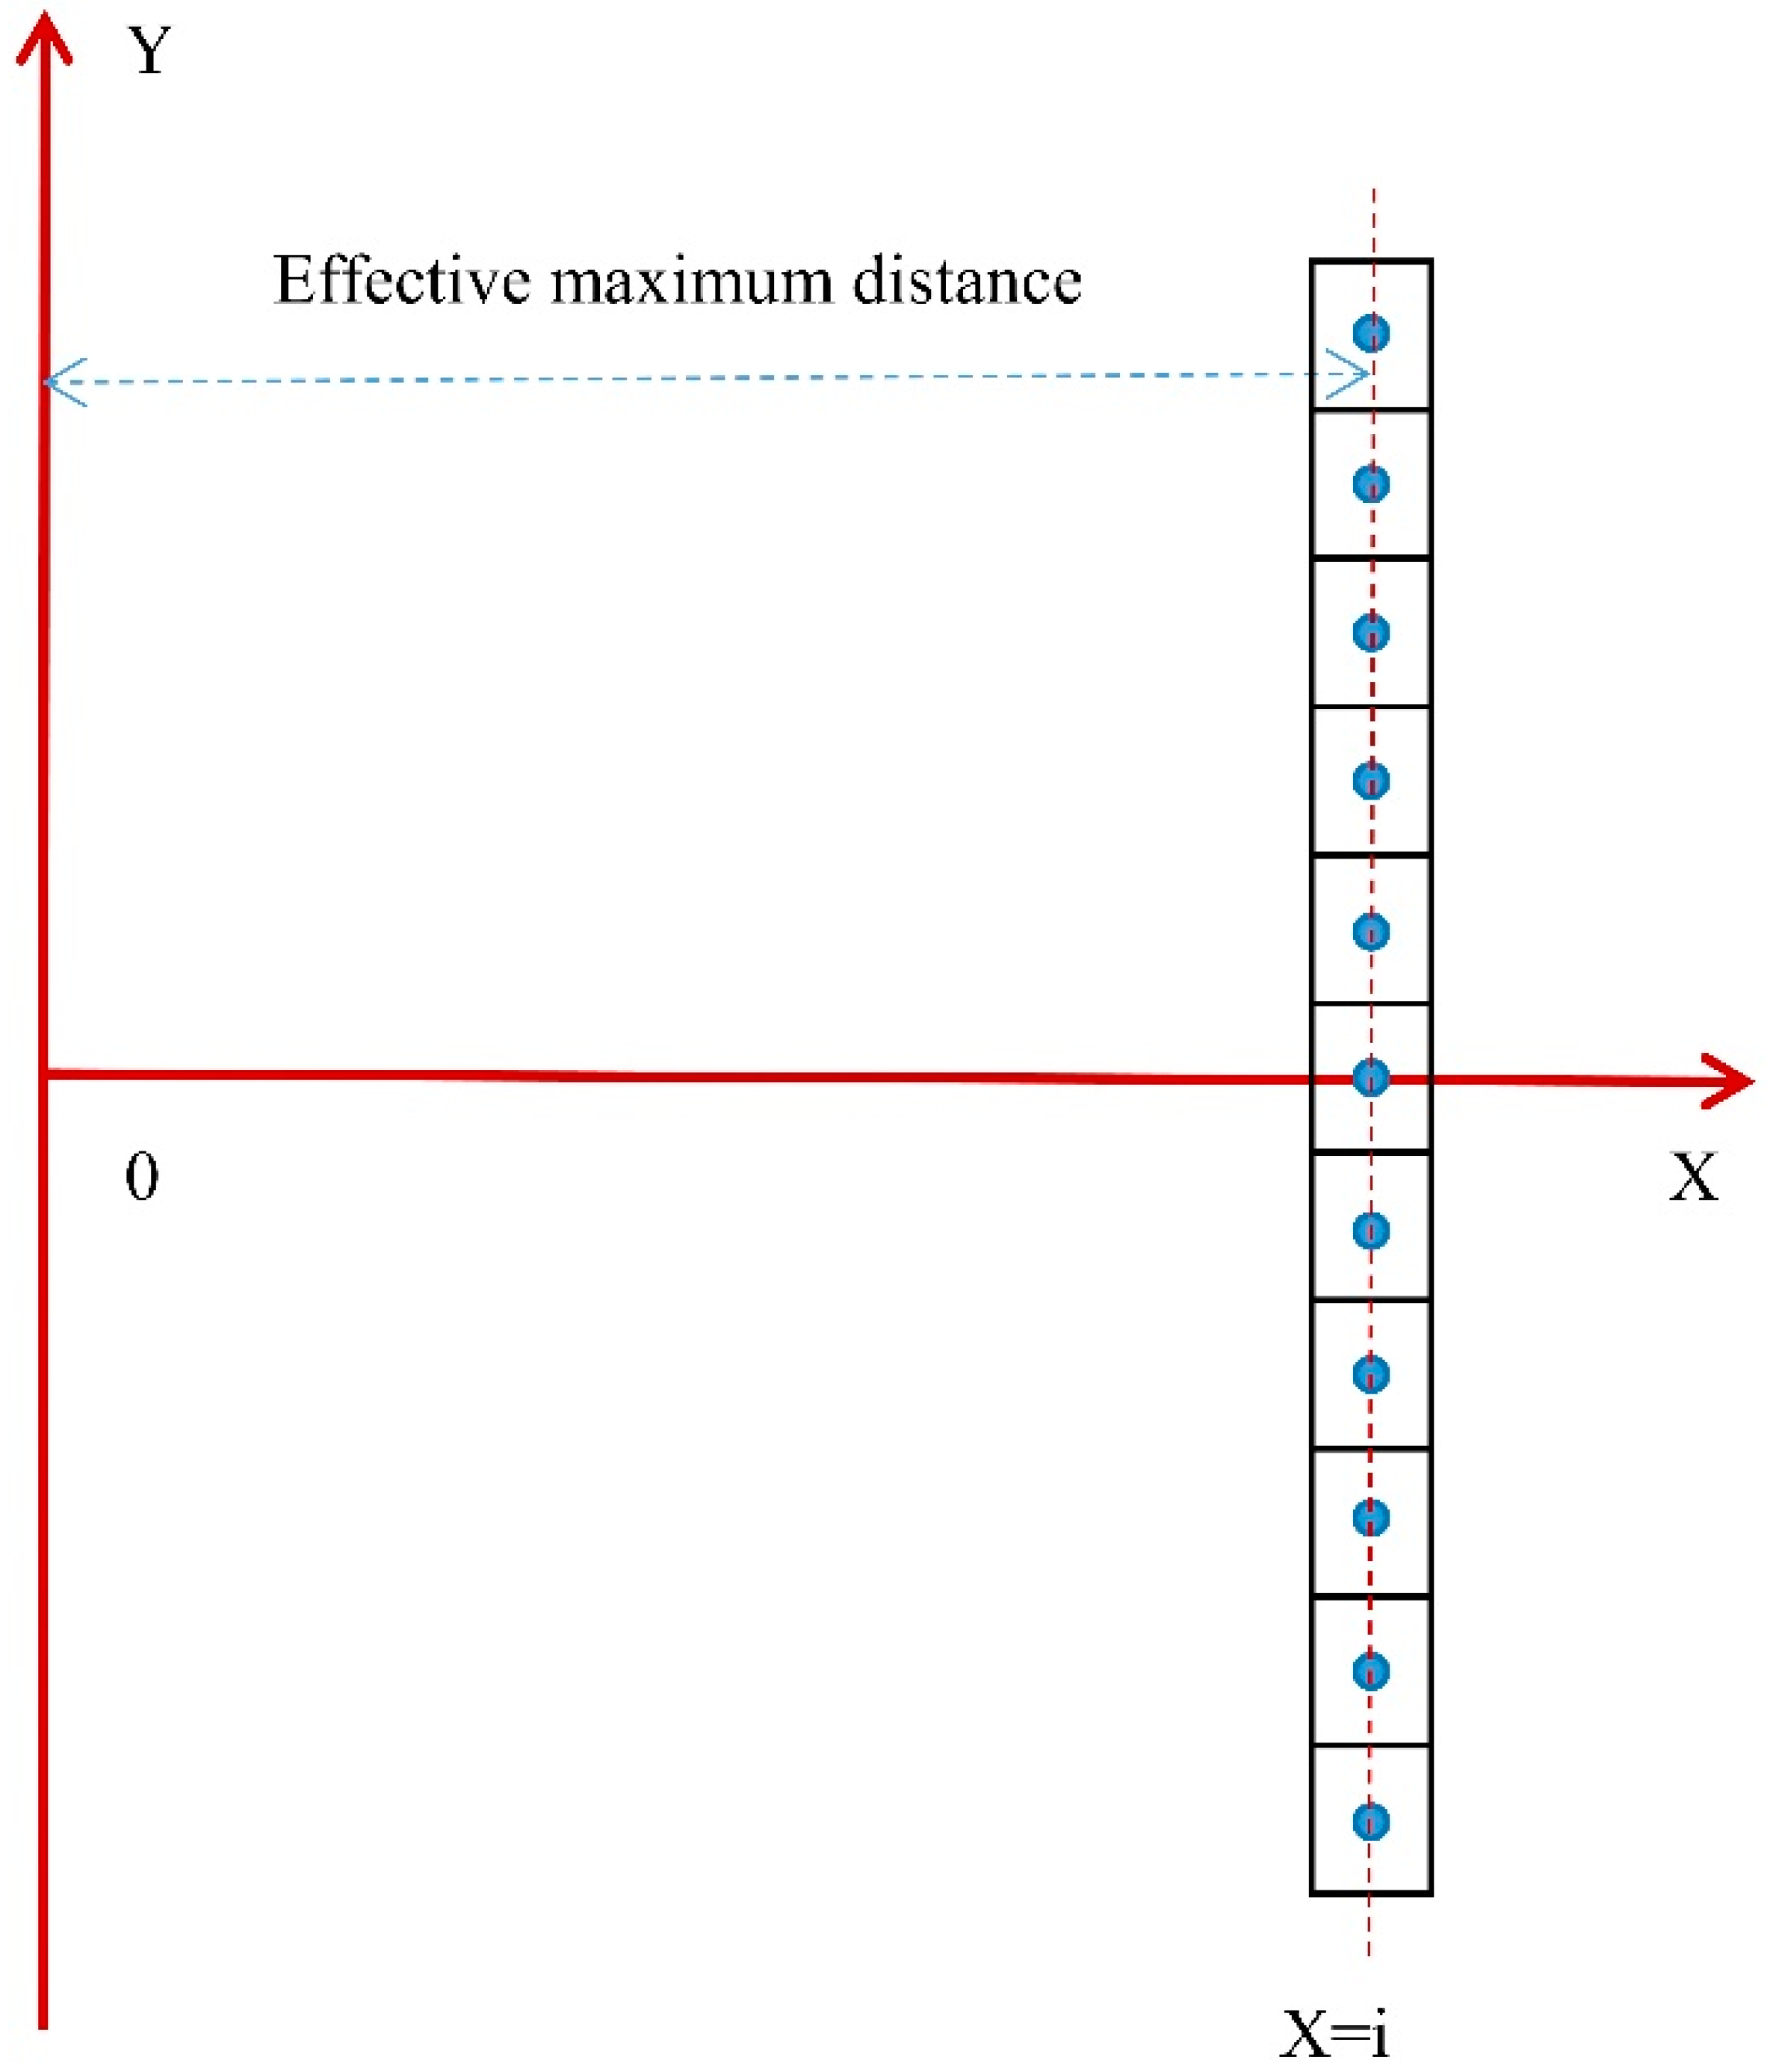
This study examines 374 dry powder collection boxes as 374 points (the schematic diagram of the plan was shown in
Figure 18), and the dry powder quality at the center point of each dry powder collection box represents the dry powder quality inside the collection box. If the total dry powder mass at the point on the X = i axis is the largest, then the horizontal distance from the X = i axis to the origin 0 is the effective farthest distance of the fire-extinguishing device. The indicator diagram is shown in
Figure 19.
By weighing each dry powder box, the average dry powder strength R in the area where each dry powder collection box is located can be calculated.
In the formula, R is the average strength of the dry powder, g/m2·s; M is the mass of the dry powder in the dry powder box, g; S is the bottom area of a dry powder box, 0.0187 m2; T is the time required for one dry powder injection, 10 s.
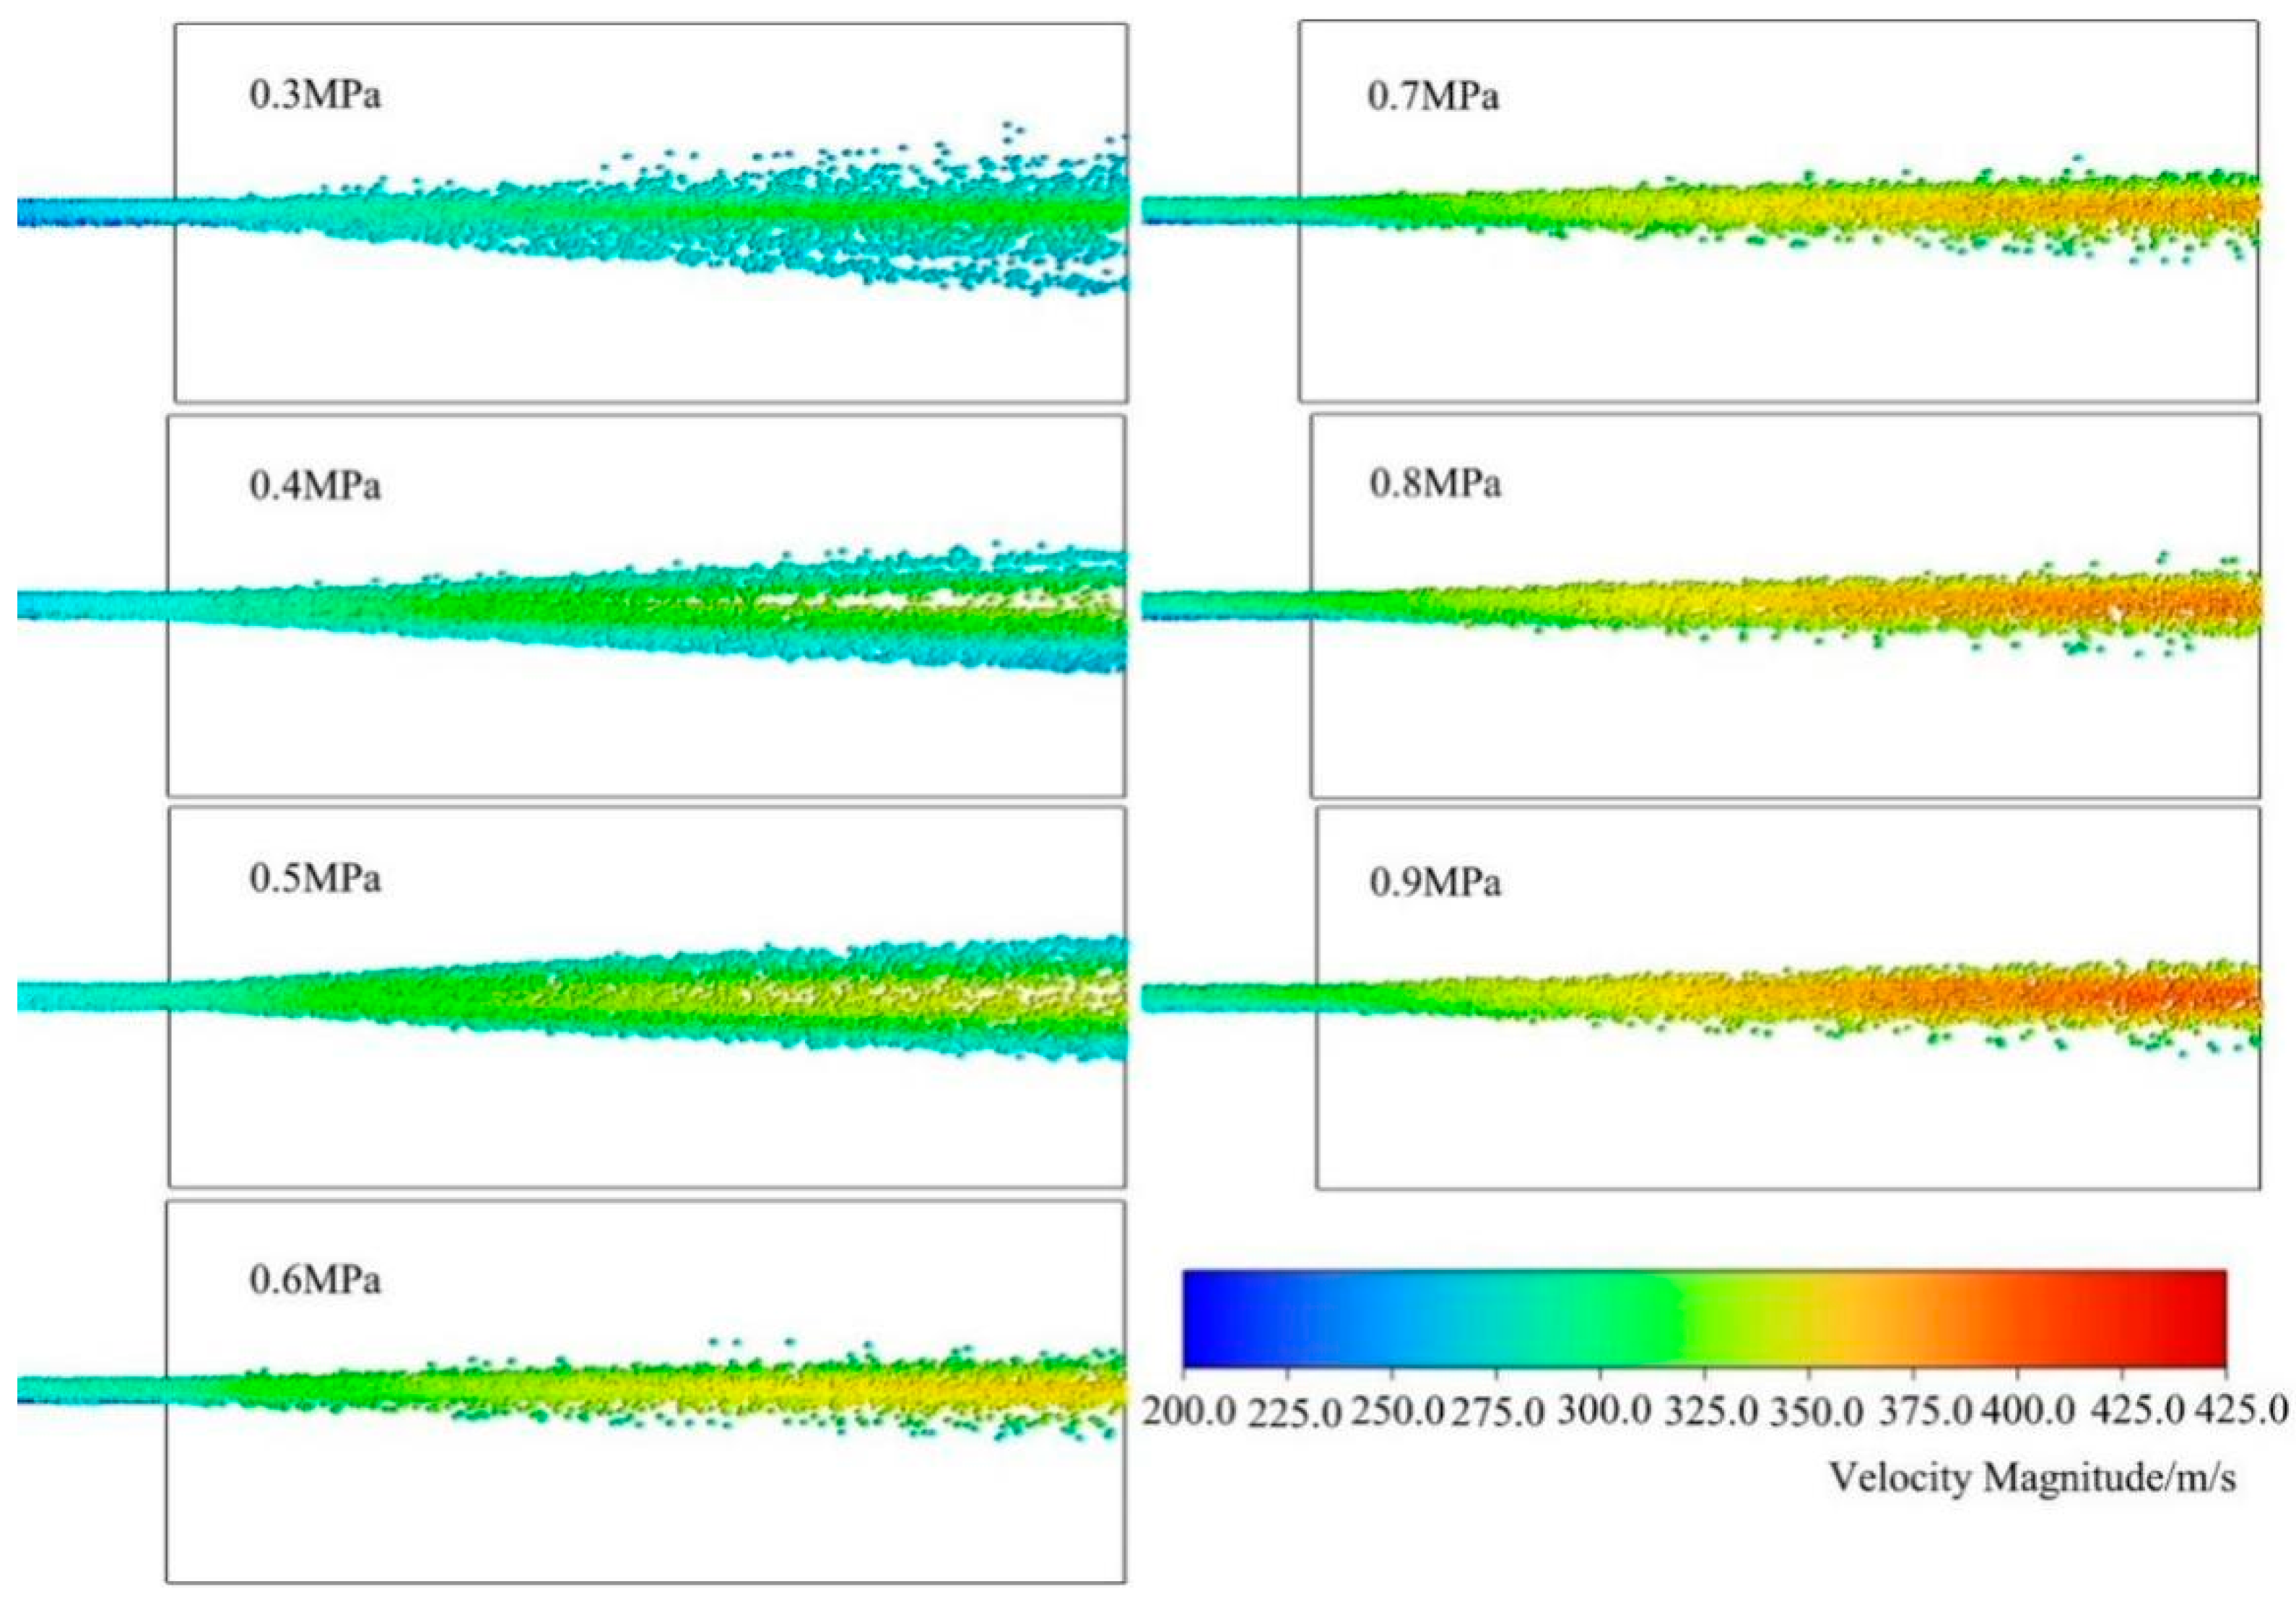
3.3. Experimental Study on Effect of Dry Powder Injection under Different Injection Pressure Conditions
Using a straight nozzle and a 10-mm-diameter dry powder pipe, we conducted dry powder spraying experiments under different driving pressures. The effective farthest distance results are shown in
Table 4 and
Figure 20.
According to
Table 5, as the nitrogen driving pressure increases, the effective maximum distance of the fire-extinguishing device gradually increases.
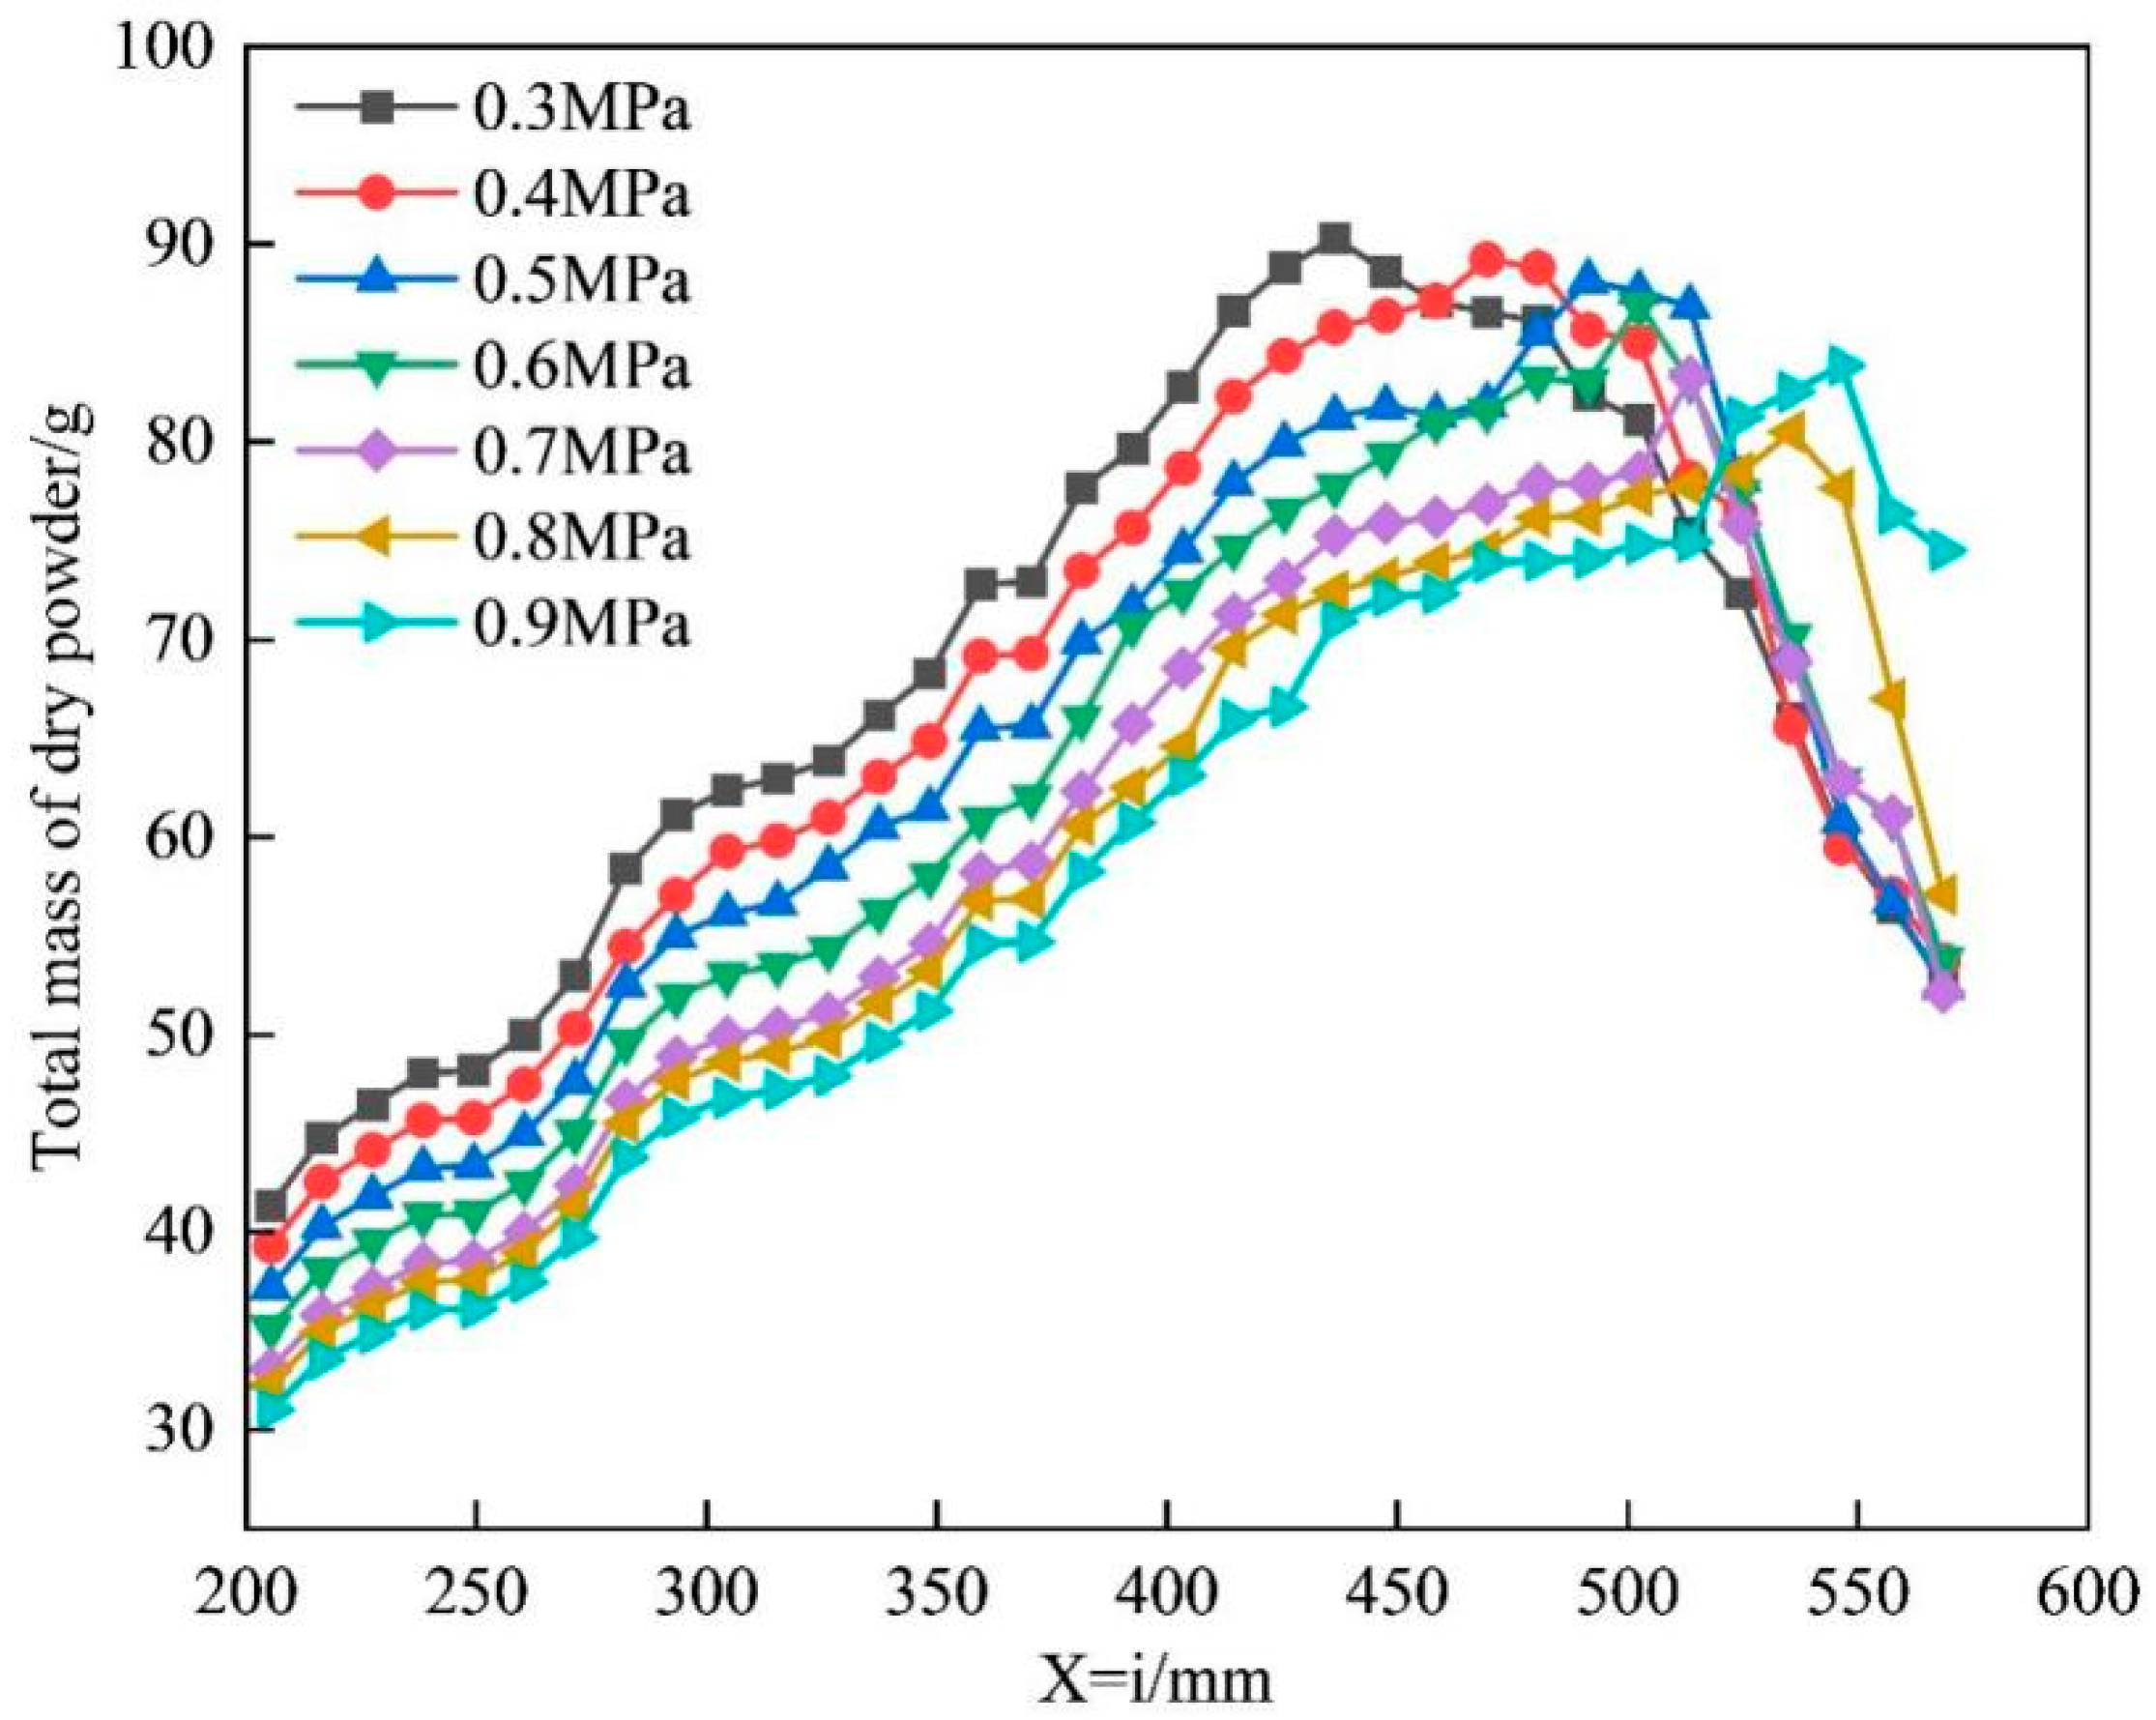
Figure 20
shows the total mass curve of the dry powder on the X = i axis under different pressures. It can be seen from the graph that as the i value increases, the total mass of the dry powder on the axis first increases and then decreases. The peak value of the curve is the effective farthest fire-extinguishing distance. In the interval before reaching the peak, as the pressure increases, the total mass of the dry powder on the axis decreases.
The results for the effective fire-extinguishing area are shown in
Table 6 and
Figure 21.
Table 6 shows the comparison of the effective fire-extinguishing area under different pressures. It can be seen from the table that as the nitrogen driving pressure increases, the effective fire-extinguishing area gradually decreases. When the driving pressure increases from 0.3 MPa to 0.9 MPa, the effective fire-extinguishing area decreases by 1683 cm
2.
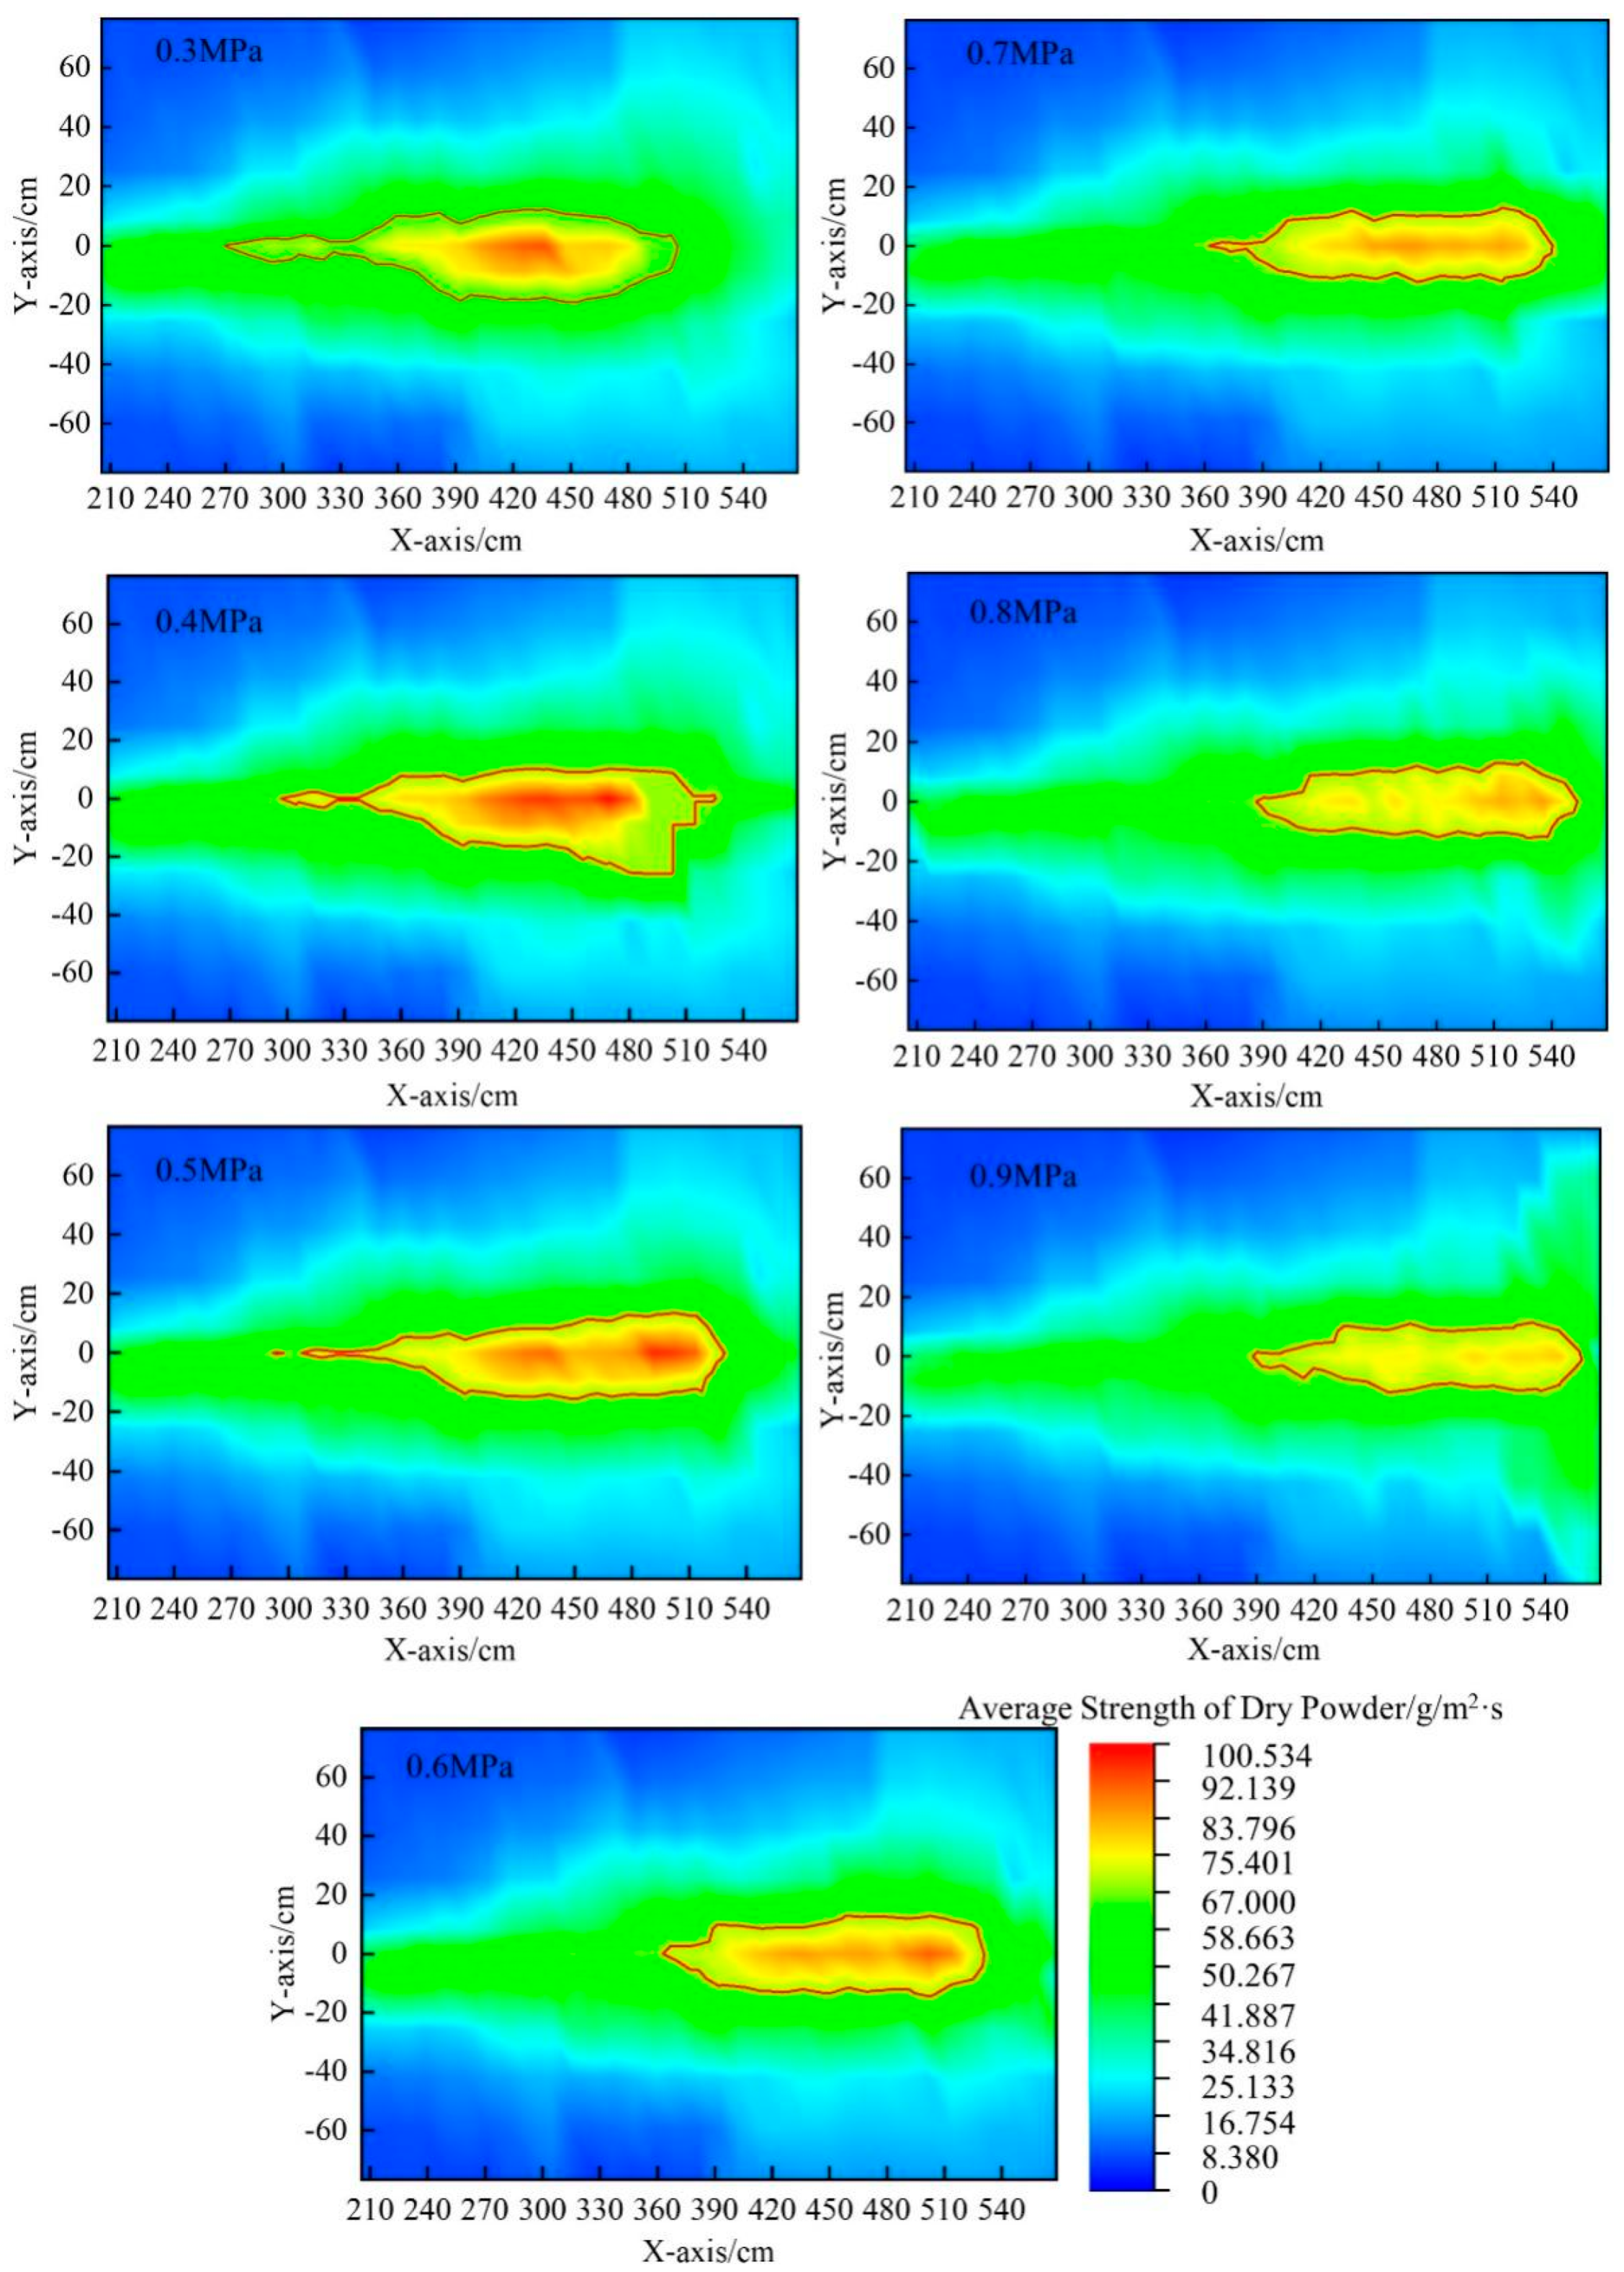
Figure 21 shows the cloud map of the average strength of the dry powder under different pressures. It is found that 67 g/m
2·s is the critical average strength of the dry powder, and the red line in the cloud map is the contour line of 67 g/m
2·s. The area within the red line is defined as the effective fire-extinguishing area. As shown in the figure, the dry powder diffuses in a “trumpet” shape, while the effective fire-extinguishing area forms a “V” shape. As the pressure increases, the average dry powder intensity of the effective fire-extinguishing area decreases, and the effective fire-extinguishing area moves backward, resulting in a reduction in the area.
In summary, the experimental and numerical simulation results are consistent. The shock wave intensity and influence range in the external flow field of the gas–solid two-phase flow increase, which affects the landing of the dry powder particles and leads to a decrease in the average dry powder intensity in the effective fire-extinguishing area. Based on the simulation and experiments, it is concluded that dry powder injection has the best effect at 0.3 MPa.
3.4. Experimental Study on Effect of Dry Powder Spraying under Different Pipe Diameter Conditions
Dry powder injection experiments were conducted on three different pipe diameters using a 0.3 MPa nitrogen-driven straight nozzle. The effective farthest distance results are shown in
Table 7 and
Figure 22.
Table 7 shows the comparison of the maximum effective distances of the fire-extinguishing devices under different pipe diameters. It can be seen from the table that as the diameter of the dry powder pipe increases, the maximum effective distance of the fire-extinguishing device gradually increases.
Figure 22 shows the total mass curve of the dry powder on the X = i axis under dry powder pipes with different diameters. It can be seen from the figure that as the i value increases, the total mass of the dry powder on the line first increases and then decreases. Through the comparison, it can be found that, within the range of 200–400 cm, when the pipe diameter is 8 mm, the total mass of the dry powder on the axis is greater than that under other pipe diameters. When the pipe diameter is 10 mm, the total mass of the dry powder on the axis is the lowest.
The results for the effective fire-extinguishing area are shown in
Table 8 and
Figure 23.
Table 8 shows the comparison of the effective fire-extinguishing area under dry powder pipes of different diameters. When the pipe diameter is 8 mm, the effective fire-extinguishing area is the largest, and when the pipe diameter is 10 mm, the effective fire-extinguishing area is the smallest, with a difference of 2057 cm
2 between the two.
Figure 23 shows the average strength cloud map of the dry powder under different pipe diameters. It can be seen from the figure that the dry powder diffuses in a “horn” shape, and the effective fire-extinguishing area has a “V” shape. When the diameter of the dry powder pipe is 8 mm, the average strength of the dry powder in the effective fire-extinguishing area is relatively high.
In summary, the experimental results are consistent with the numerical simulation results for the gas–solid two-phase flow in dry powder pipes with different diameters. Under a diameter of 8 mm, the shock wave intensity in the external flow field is smaller than that under a diameter of 10 mm. The gas velocity distribution is the most uniform at the nozzle outlet, which is more conducive to particle landing. When the diameter of the dry powder pipe is 8 mm, the best dry powder spraying effect is achieved.
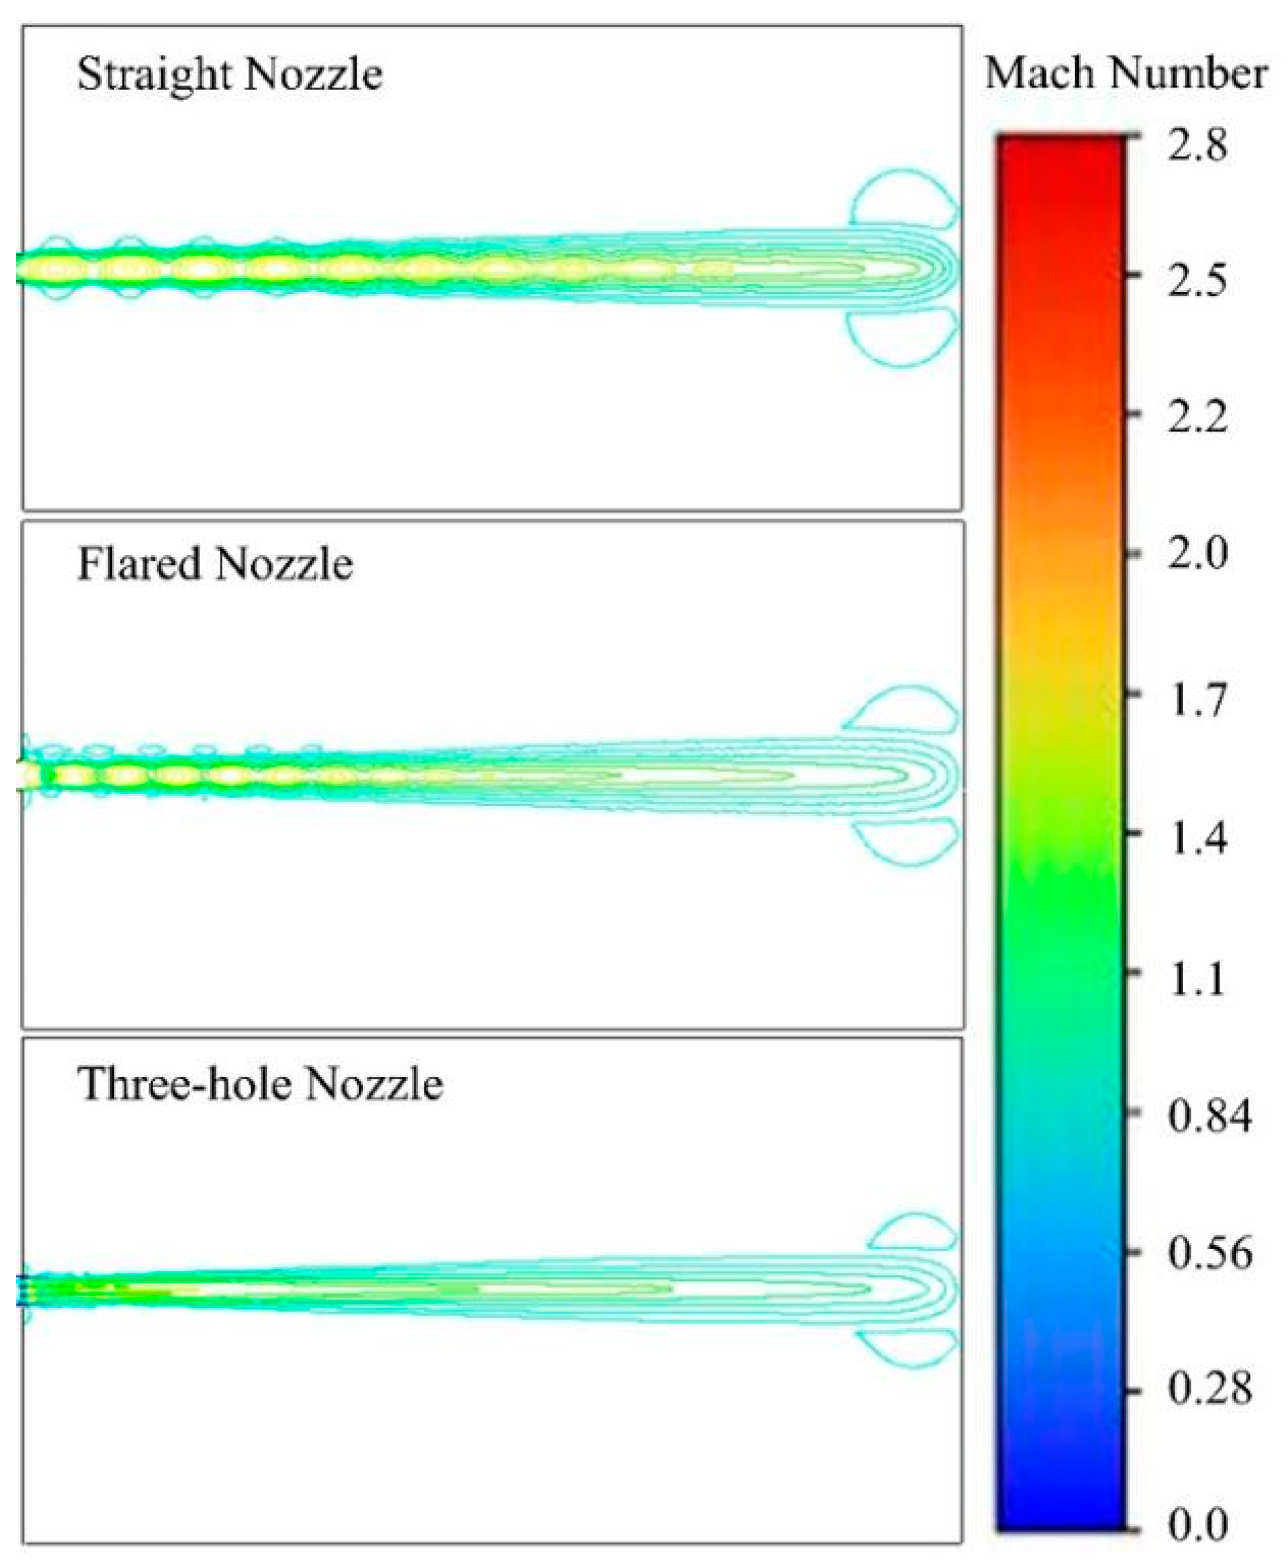
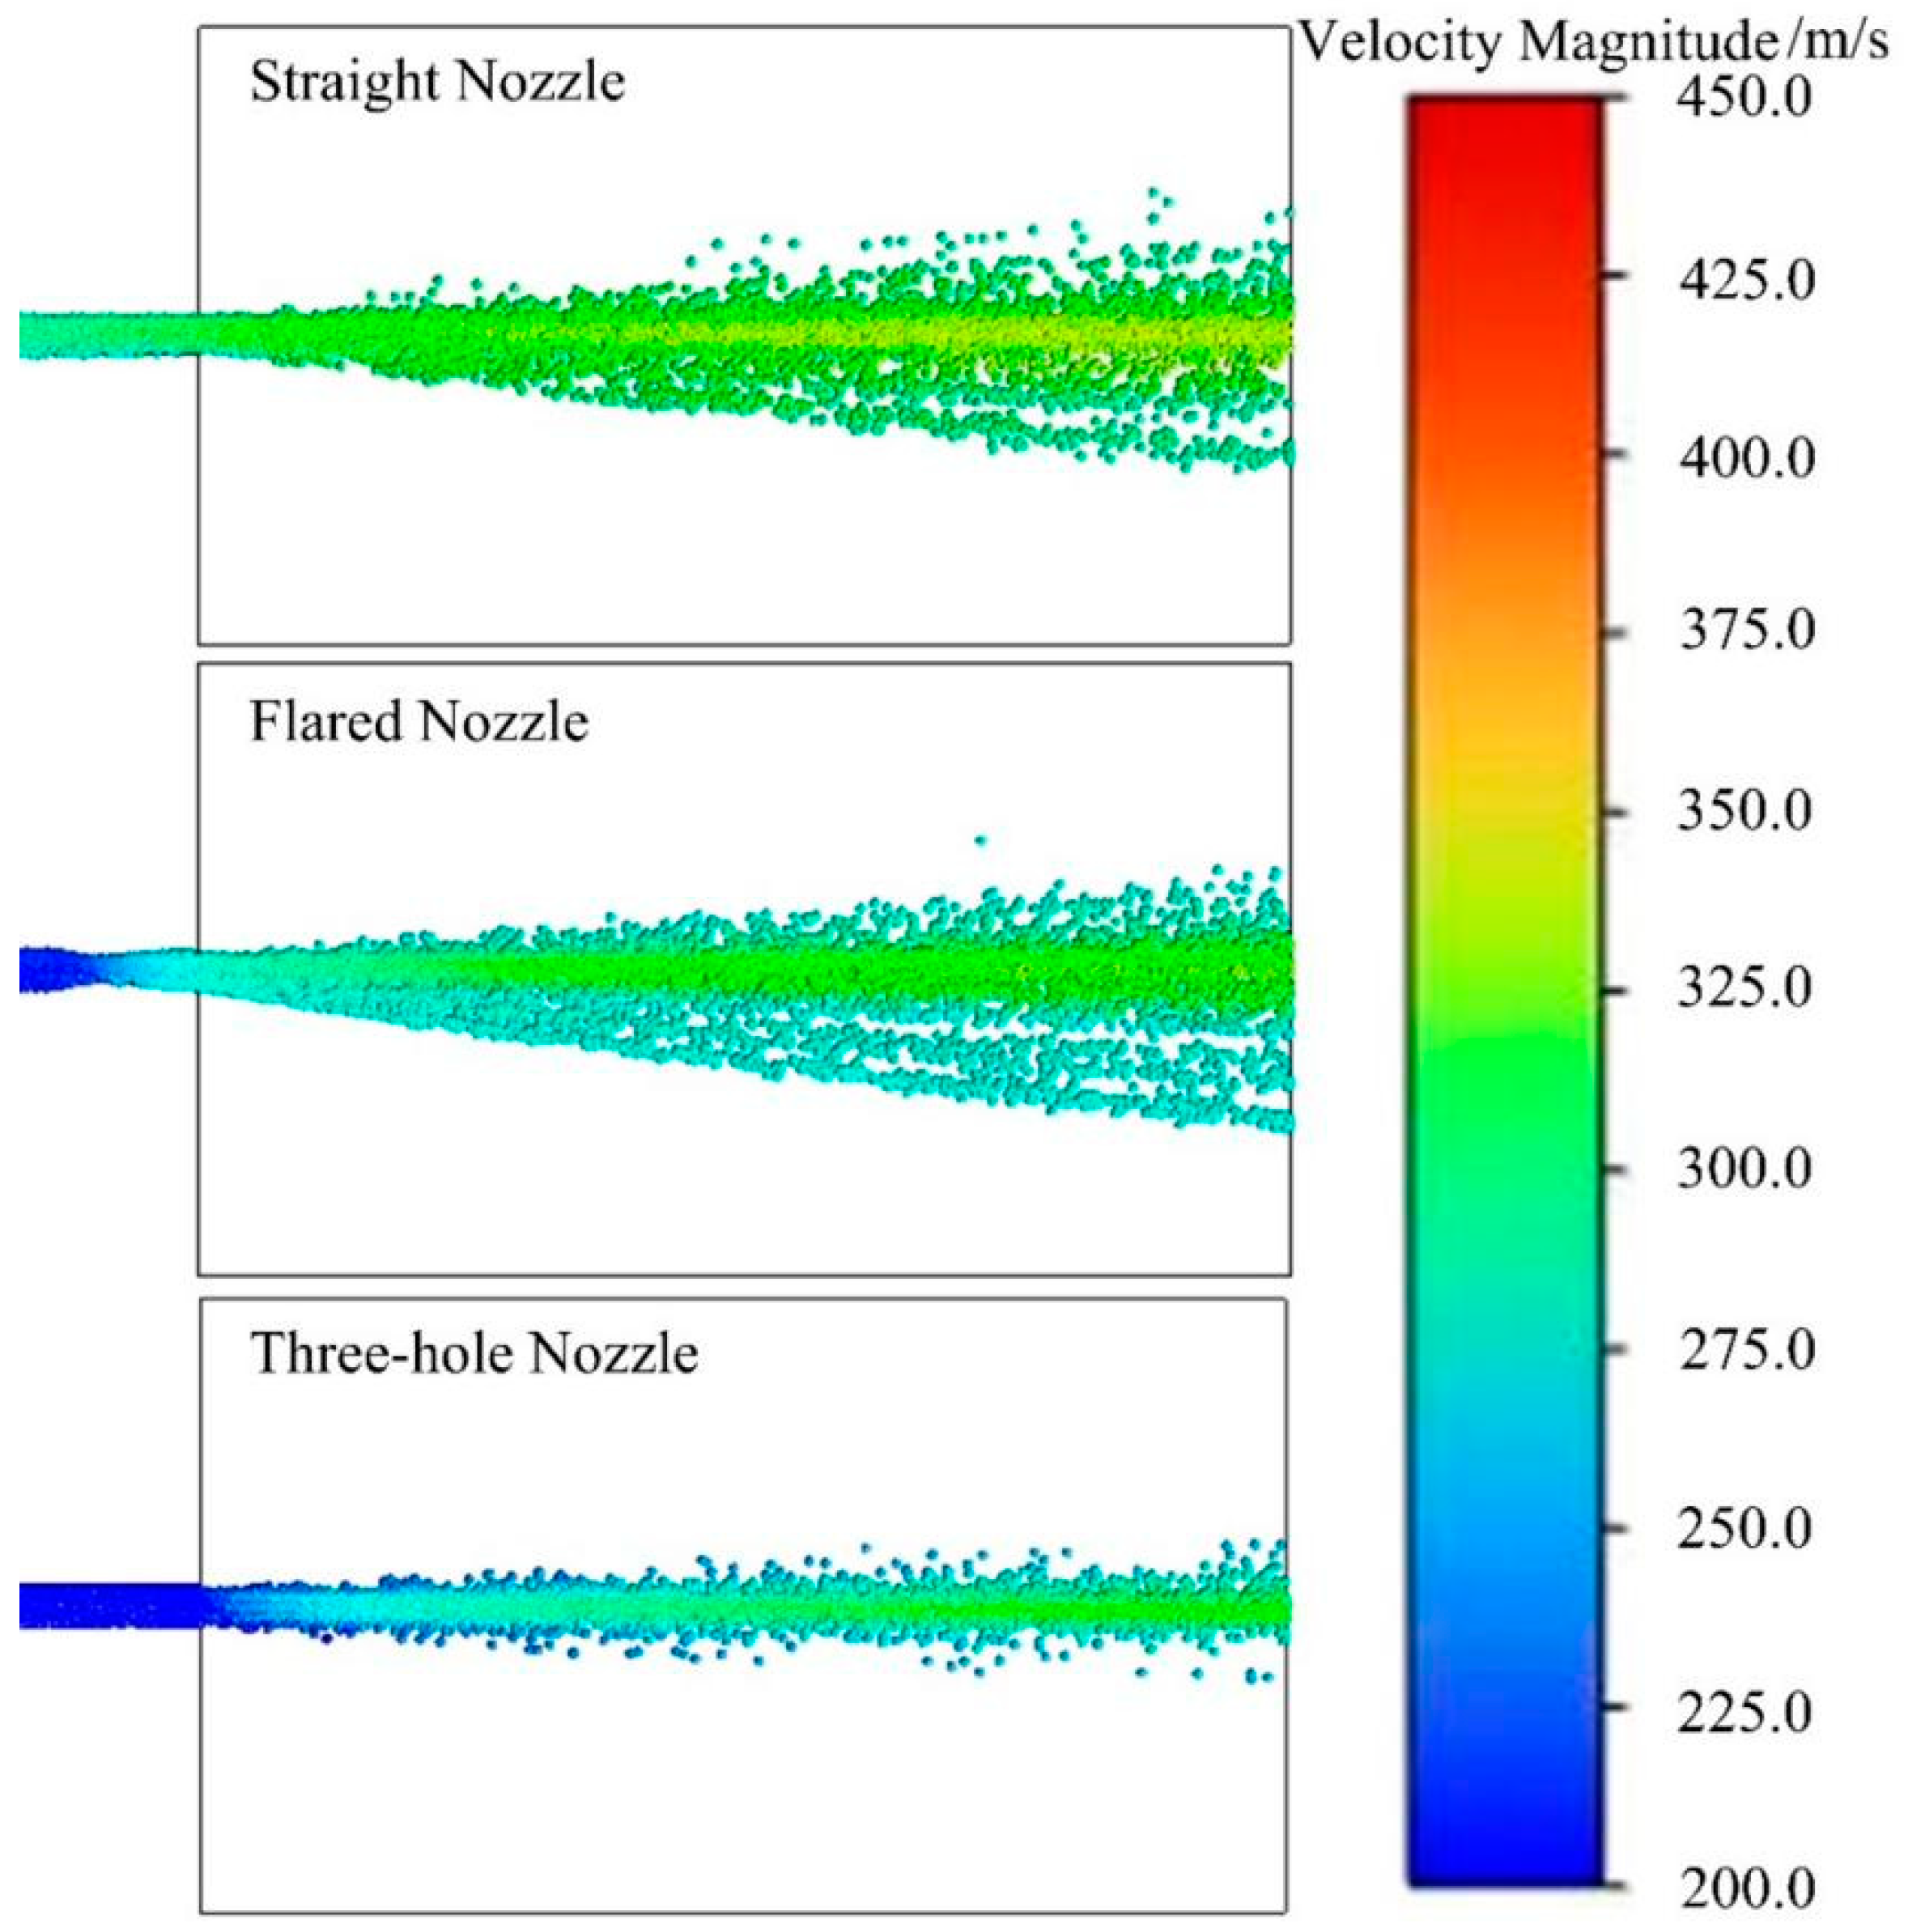
3.5. Experimental Study on Effect of Dry Powder Injection under Different Nozzle Configurations
Dry powder injection experiments were conducted on different nozzle configurations using a 10 mm dry powder tube driven by 0.3 MPa nitrogen gas. The effective farthest distance results are shown in
Table 9 and
Figure 24.
Table 9 shows a comparison of the maximum effective distance under different nozzles. When the nozzle is of a straight mouth type, the maximum effective distance is 436.5 cm, and under a three-hole-type nozzle, the maximum effective distance is 304.5 cm.
Figure 24 shows the total dry powder mass curve on the X = i axis under different nozzles. It can be seen from the figure that as the i value increases, the total dry powder mass on the axis first increases and then decreases. When the nozzle is of a three-hole type, the peak of the total dry powder mass curve on the axis appears the earliest. When the nozzle is of a horn type, the total dry powder mass on the axis is greater than that for the straight mouth type.
The results for the effective fire-extinguishing area are shown in
Table 10 and
Figure 25.
Table 10 shows the comparison of the effective fire-extinguishing areas of the fire-extinguishing devices under different nozzles. When the nozzle is of a three-hole type, the effective fire-extinguishing area is the smallest. When the nozzle is of a horn type, the effective fire-extinguishing area is the largest, with a difference of 7480 cm
2 between the two.
Figure 25 shows the average intensity cloud map of the dry powder under different nozzles. When the nozzles are horn-shaped and straight-mouthed, the diffusion of the dry powder takes on a “horn” shape, and the effective fire-extinguishing area takes on a “V” shape. The effective fire-extinguishing area of the three-hole nozzle is the smallest, and the difference in the fire-extinguishing area between the straight-mouthed nozzle and the horn nozzle is not significant. Regarding the effective fire-extinguishing area of the horn type, the area with an average dry powder intensity greater than 90 g/m
2s is greater than that with the straight-mouthed nozzle.
In summary, the experimental results are consistent with the simulation results for the gas–solid two-phase flow under different nozzles. When the nozzle is the three-hole type, the dry powder particle velocity is approximately 200 m/s in the external flow field, with a low particle velocity and a small particle diffusion range. The gas velocity distribution at the outlet of the horn-shaped nozzle is the most uniform, which is more conducive to dry powder injection. When the nozzle is of a straight mouth type, it has the largest fluctuation and the maximum range of gas-phase velocities, which is not conducive to the concentrated deposition of the dry powder. Therefore, when the nozzle is horn-shaped, the dry powder spraying effect is optimal.
3.6. Experimental Study on the Effect of Dry Powder Spraying under Different Loading Ratios
Using a straight nozzle, driven by 0.3 MPa nitrogen gas, with a dry powder pipe diameter of 10 mm, dry powder injection experiments were conducted with different dry powder loading ratios. The formula for the calculation of the dry powder loading ratio K is as follows:
Here, K is the dry powder loading ratio, m is the mass of the filled dry powder fire-extinguishing agent in kg and is the volume of the dry powder tank in L. The volume of the dry powder tank designed in this study is 8 L.
Table 11 shows the comparison of the effective longest distances of the fire-extinguishing devices under different dry powder loading ratios. The effective longest distance remains unchanged under the different dry powder loading ratios.
Figure 26 shows the total mass curve of the dry powder on the X = i axis under different dry powder loading ratios. It can be seen from the figure that the total mass of the dry powder on the axis first increases and then decreases. As the dry powder loading ratio increases, the total mass of the dry powder on the axis gradually increases. When the dry powder loading ratio is 1, the total mass of the dry powder on the axis is significantly higher than that at other loading ratios. This may be due to the increase in the dry powder concentration as the dry powder loading ratio increases.
The results for the effective fire-extinguishing area are shown in
Table 12 and
Figure 27.
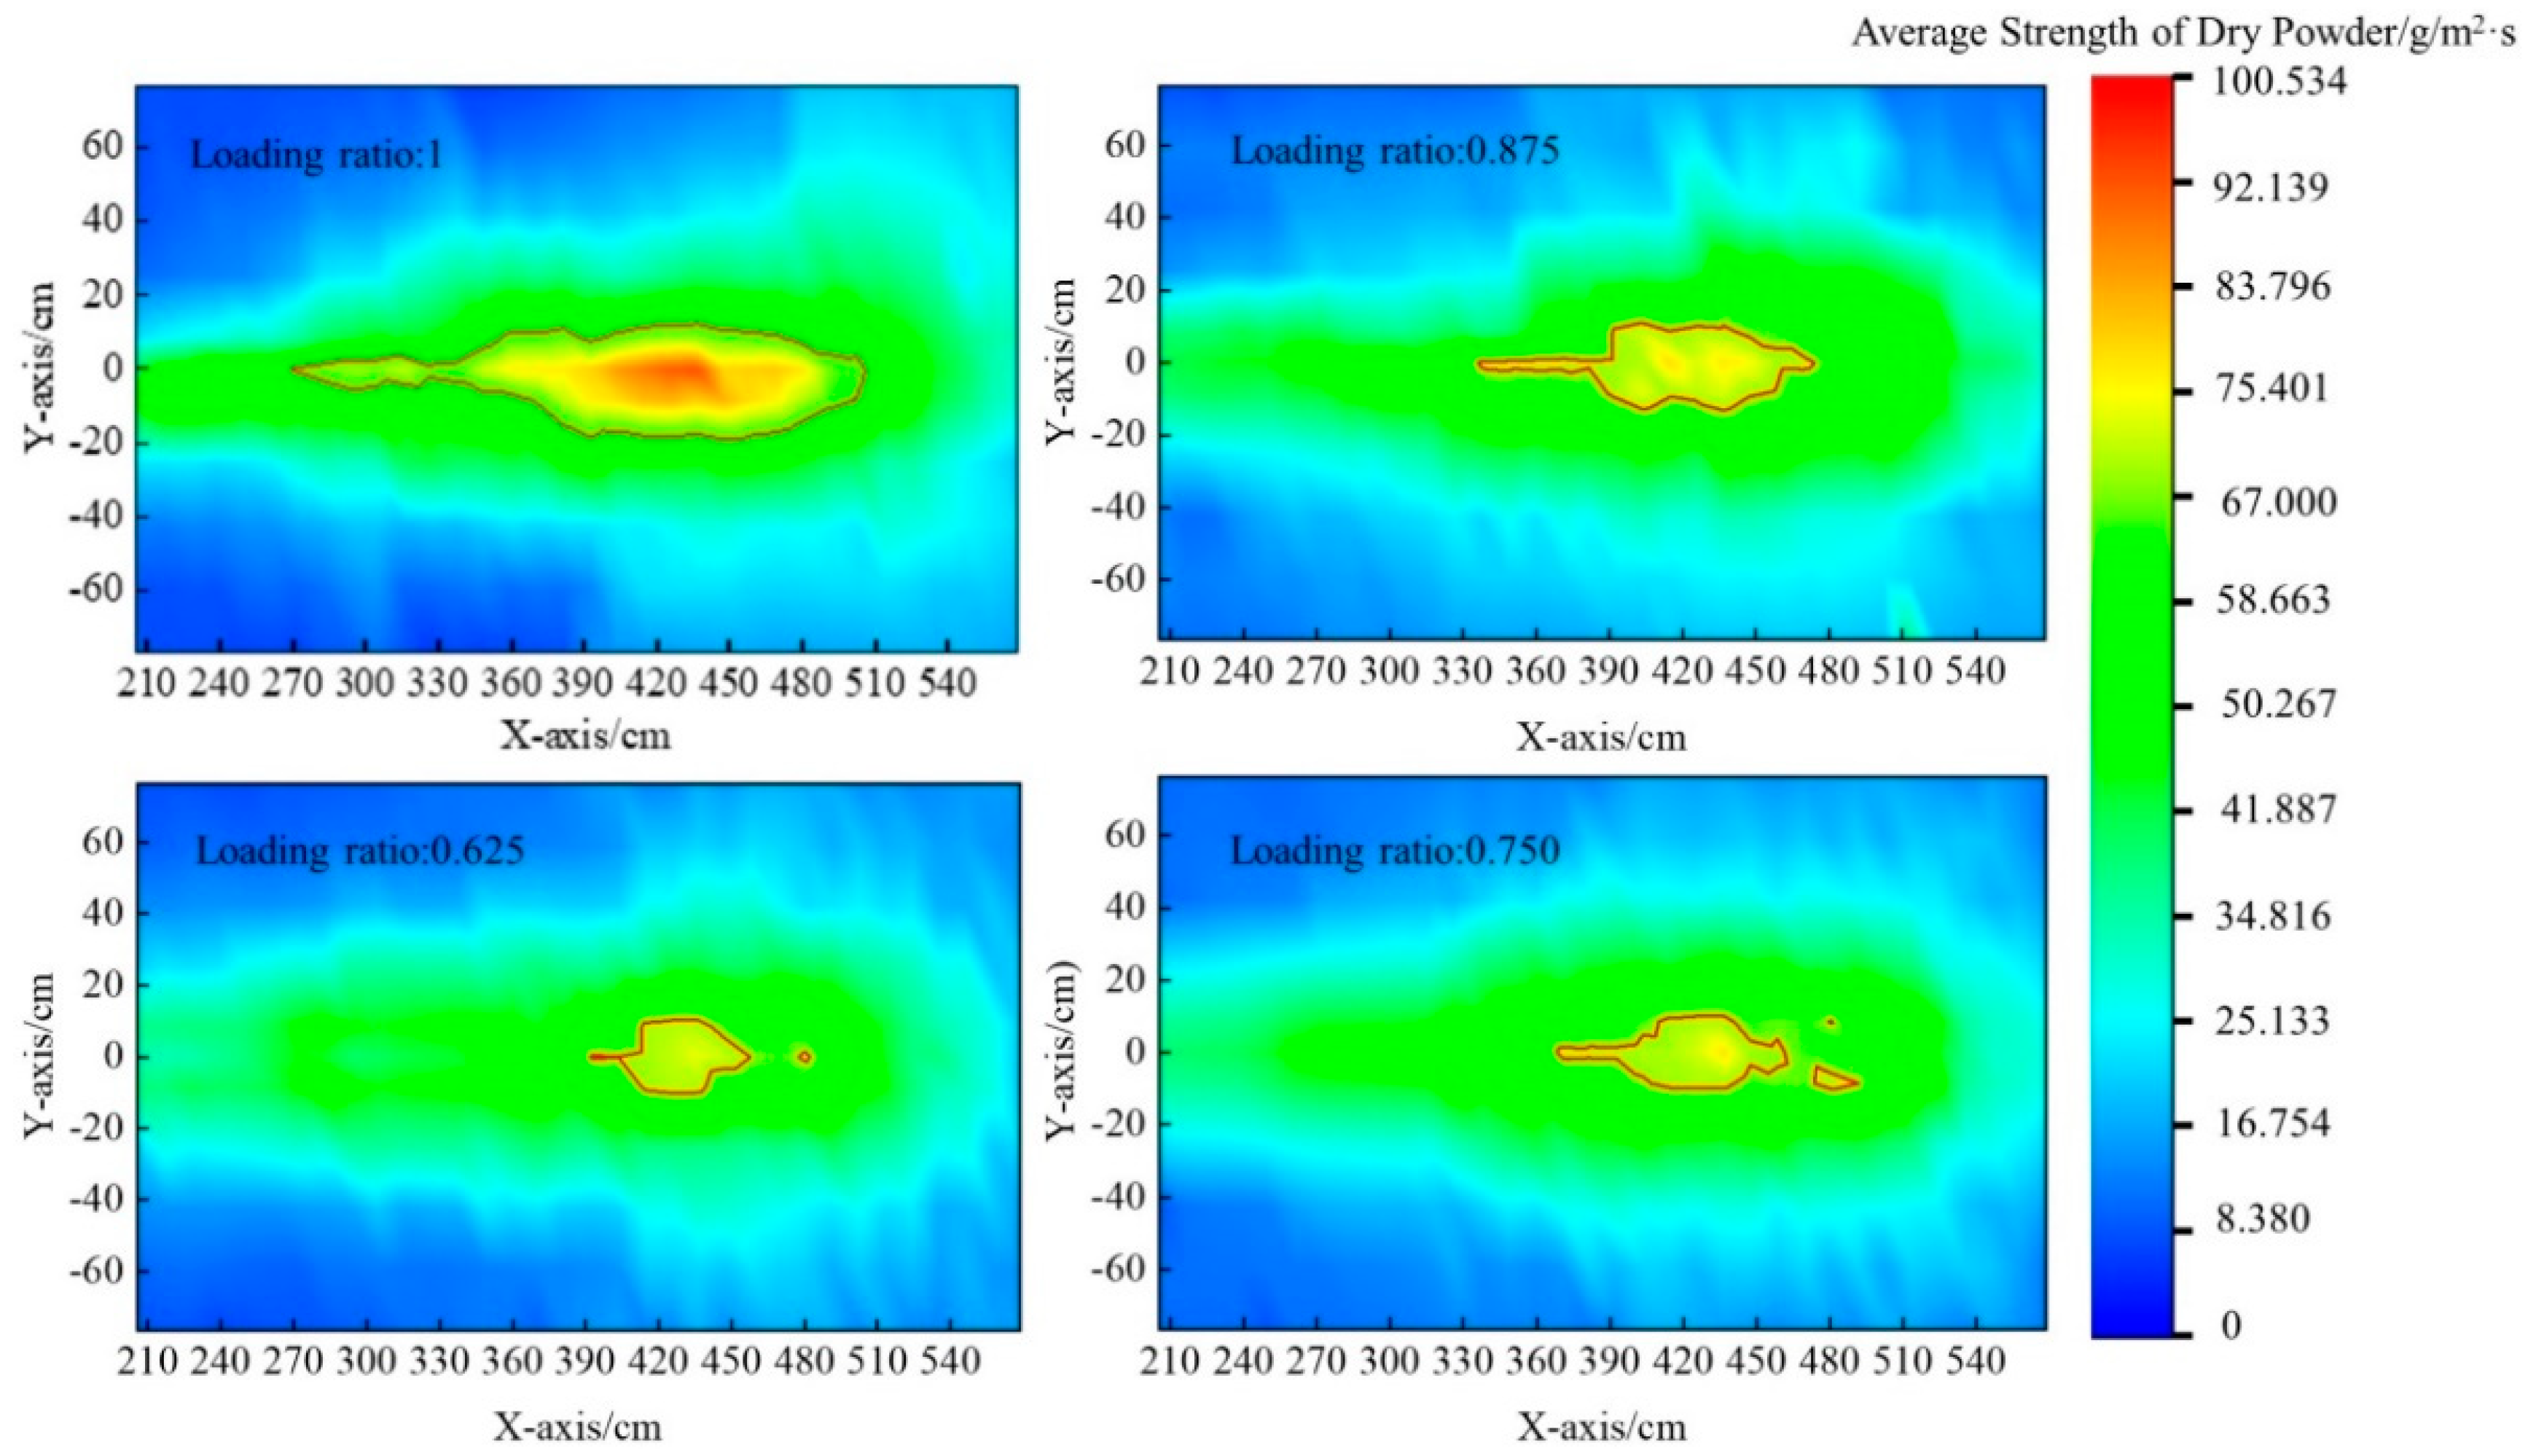
Table 12 shows the effective fire-extinguishing area under different dry powder loading ratios. It can be seen from the table that when the dry powder loading ratio is 1, the effective area is the largest, with a difference of 6171 cm
2 compared to when the dry powder loading ratio is 0.625.
Figure 27 shows the average strength cloud map of the dry powder under different loading ratios. It can be seen from the figure that, under different loading ratios, the diffusion of the dry powder has a “horn” shape, and the effective fire-extinguishing area has a “V” shape. As the dry powder loading ratio increases, the effective fire-extinguishing area gradually increases, and the average dry powder strength in the effective fire-extinguishing area gradually increases. When the dry powder loading ratio is 1, the effective fire-extinguishing area is the largest, and the average dry powder strength in the effective fire-extinguishing area is also significantly higher than for other average dry powder strengths.
4. Research on Combination of Parameters for Optimal Spraying Effect in Dry Powder Controlled-Pressure Spraying Fire-Extinguishing System
The previous sections described numerical simulations and experiments on different pressures, pipe diameters, and nozzle configurations, as well as dry powder injection experiments using different dry powder loading ratios. However, the pressure-controlled dry powder fire-extinguishing device represents a system that is the result of the joint influence of each factor. Therefore, the four influencing factors were comprehensively studied to identify the optimal parameter ratio so as to achieve the maximum effective fire-extinguishing area, providing a reliable basis for the future design of pressure-controlled fire-extinguishing devices for intelligent fire-extinguishing robots.
This study uses the orthogonal experimental method to study the influence of a comprehensive set of factors on fire-extinguishing devices. After obtaining the results of each group of experiments through the orthogonal method, the optimal level for each factor is determined by calculating the average value of each factor at each level. By calculating the difference between the average values, i.e., the range, the most important factor affecting the experimental results is determined. The larger the range of the influencing factor, the greater its impact on the experimental results [
30,
31]. The formula is
Here, K is the sum of the experimental results for each factor at different levels, n is the number of levels, Rj is the range, kmax is the maximum value of the mean k, and kmin is the minimum value.
This study considers four influencing factors: A is the nitrogen driving pressure, B is the diameter of the dry powder pipe, C is the nozzle configuration, and D is the dry powder loading ratio (
Table 13). Through the previous single-factor experiment, we select three optimal levels for each factor. According to the analysis of the dry powder spraying experiments described in the previous sections, with the exception of the three-hole nozzle, the effective farthest distance of the fire-extinguishing device can fulfill the standard under all conditions. Therefore, the effective fire-extinguishing area of the fire-extinguishing device is used as an experimental indicator to evaluate the spraying effect of the dry powder. Usually, the orthogonal experimental table L9 (34) can be used for four factors and three levels. Therefore, a total of nine sets of orthogonal experiments were designed in this study. The factor levels of the orthogonal experiments are shown in
Table 14.
For statistical convenience and an intuitive analysis, the effective fire-extinguishing area’s index value is simplified. The effective fire-extinguishing area is set as S, and the simplified effective fire-extinguishing area is s, where s = S/187, as 187 cm2 is the size of the bottom area of the collection box.
This study adopts intuitive analysis, where k1 is the mean of the experimental results of this factor at all levels, i.e., k1, k2, k3, etc. By comparing the means of all levels under a certain factor, the level with the highest mean is obtained as the optimal level. From the analysis of the orthogonal experiments’ results, it can be seen that R3 > R4 > R1 > R2, and the four influencing factors, in order of significance, are the nozzle configuration, dry powder loading ratio, nitrogen driving pressure, and dry powder pipe diameter. The optimal level is determined based on the level with the highest mean. Therefore, the optimal combination to achieve the maximum effective fire-extinguishing area of the pressure-controlled fire-extinguishing device is A1B2C1D1, which means that the nitrogen driving pressure is 0.3 MPa, the dry powder pipe diameter is 8 mm, the nozzle is horn-shaped, and the dry powder loading ratio is 1. At these settings, the effective fire-extinguishing area of the pressure-controlled fire-extinguishing device is the largest, and the dry powder spraying effect is the best.
The optimal combination of the factors that affect the effective fire-extinguishing area of the fire-extinguishing device, as obtained from the orthogonal experiment, does not exist in the orthogonal experiment table. To verify the correctness of this conclusion, experimental verification is conducted. The experimental verification results are shown in
Table 15.
Through the experimental verification, it is found that when nitrogen is driven at 0.3 MPa, the diameter of the dry powder pipe is 8 mm, the nozzle is the horn type, and the dry powder loading ratio is 1, the effective farthest distance of the fire-extinguishing device is 414.5 cm, and the effective fire-extinguishing area of the fire-extinguishing device is 11,033 cm2. This is much larger than the effective fire-extinguishing area measured in the previous single-factor experiment and orthogonal experiment. Therefore, the optimal parameter combination obtained from the orthogonal experiment is validated.
5. Conclusions
(1) An intelligent inspection and fire-extinguishing robot was developed, which included five modules: the main control module, power module, detection module, fire-extinguishing module, and wireless charging module. The robot also included a visual detection system and sensor detection system in the detection module, as well as four subsystems, including an automatic release system for the fire-extinguishing agent and a fire-extinguishing execution system in the fire-extinguishing module. It showed excellent performance regarding intelligent autonomous inspection and allowed control over the spray pressure of the dry powder fire-extinguishing agent (referred to as “pressure-controlled fire extinguishing”). Through the numerical simulation and experimental verification of different influencing factors, it was possible for the robot to achieve pressure control and extinguish the fire.
(2) A numerical simulation model for dry powder particle injection was established by considering the effects of the fluid resistance, pressure gradient force, virtual mass force, and particle collision force. The mechanism and influence of the dry powder injection gas–solid two-phase flow were studied based on different injection pressures, dry powder pipe diameters, and nozzle configurations. Under different driving pressures, the greater the pressure, the stronger the shock wave intensity is in the external flow field, and the larger the negative pressure area, the higher the overall particle velocity is and the smaller the diffusion range. The best dry powder particle injection effect is achieved under a driving pressure of 0.3 MPa. Under different pipe diameters, the larger the pipe diameter, the stronger the shock wave intensity is and the longer the core jet area. The particle velocity distribution is the most uniform, and the dry powder distribution is the most concentrated under an 8 mm pipe diameter. Under different nozzle configurations, the horn-shaped nozzle has a lower shock wave intensity, a more uniform particle velocity distribution, a wider range, and the best spraying effect.
(3) Considering the macroscopic effects of the driving pressure, dry powder pipe diameter, nozzle configuration, and loading ratio, a dry powder injection experimental platform was established, and dry powder injection experiments were conducted based on different influencing factors. When the driving pressure increased from 0.3 MPa to 0.9 MPa, the effective fire-extinguishing area decreased by 1683 cm2. When the pipe diameter was 8 mm, the effective fire-extinguishing area was the largest. When the pipe diameter was 10 mm, the effective fire-extinguishing area was the smallest, with a difference of 2057 cm2 between the two. When the nozzle was of a three-hole type, the effective fire-extinguishing area was the smallest. When the nozzle was of a horn type, the effective fire-extinguishing area was the largest, with a difference of 7480 cm2 between the two. When the dry powder loading ratio was 1, the effective fire-extinguishing area was the largest, which differed by 6171 cm2 from the case in which the dry powder loading ratio was 0.625.
(4) We obtained the optimal parameter combination by designing an orthogonal experiment table and conducting experimental verification on it. After verification, it was determined that the optimal nitrogen driving pressure was 0.3 MPa, the dry powder pipe diameter was 8 mm, the nozzle was a horn type, and the dry powder loading ratio was 1; this is the optimal parameter combination and provides a theoretical basis for subsequent robotic pressure-controlled fire-extinguishing work.

 ,
, 


