
Discovery of Natural Compound-Based Lead Molecule against Acetyltransferase Type 1 Bacterial Enzyme from Morganella morgani Using Machine Learning-Enabled Molecular Dynamics Simulation


Abstract
1. Introduction
2. Material and Method
2.1. Protein Sequence Retrieval
- MDSSPLVRPVETTDSASWLSMRCELWPDGTCQEHQSEIAEFLSGKVARPAAVLIAVAP DGEALGFAELSIRPYAEECYSGNVAFLEGWVVSARRQGVGVALVKAAEHWARGRGC TEFASDTQLNSASTSAHLAAGFTEVAQVRCFRKPL
2.2. Predictions for Stability and Pathogenicity
2.3. Homology Modeling
2.4. Ligand Retrieval
2.5. Ligand Toxicity Prediction
2.6. Molecular Docking of aacA7 with Known Drugs
2.7. Molecular Dynamic Simulations
2.7.1. System Setup
2.7.2. Data Analyses
2.7.3. Analysis of Binding Free Energy (MMPBSA) from MD Simulations
2.7.4. Chemical Similarity Index
3. Results and Discussion
3.1. Sequence Retrieval and Primary Sequence Analysis
3.2. Physico-Chemical Analysis of the Primary AAC6_MORMO Sequence
3.3. Phenotypic Analysis for Stability and Pathogenicity Prediction
3.4. Tertiary Structure Prediction, Energy Minimization, Structure Analysis, and Visualization
3.5. Molecular Docking of aacA7 with Drug Molecules
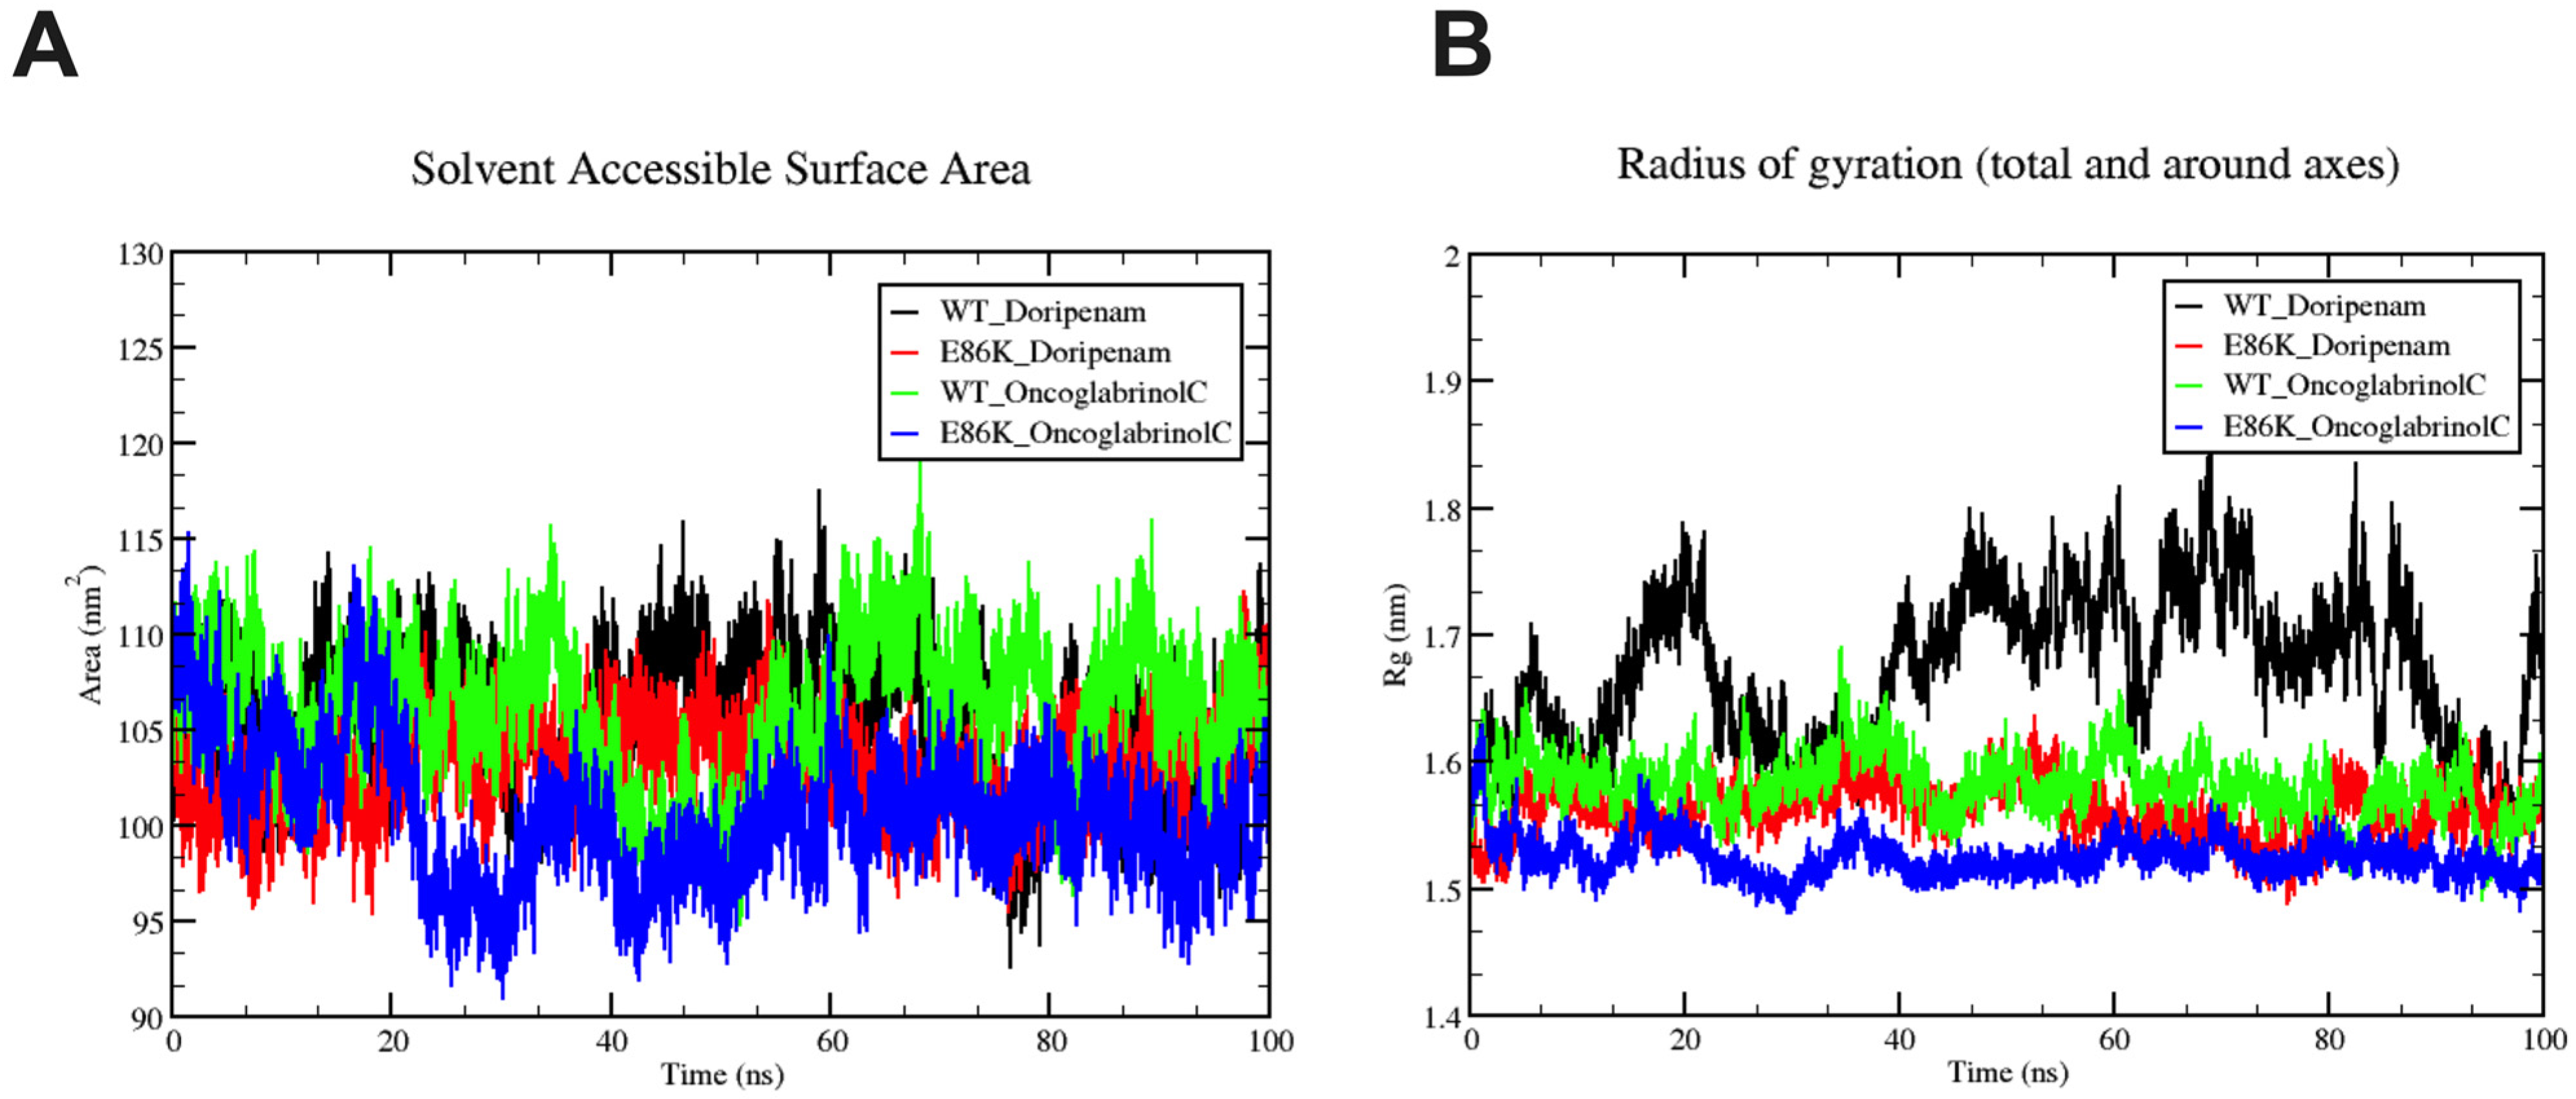
3.6. Molecular Dynamics Simulation
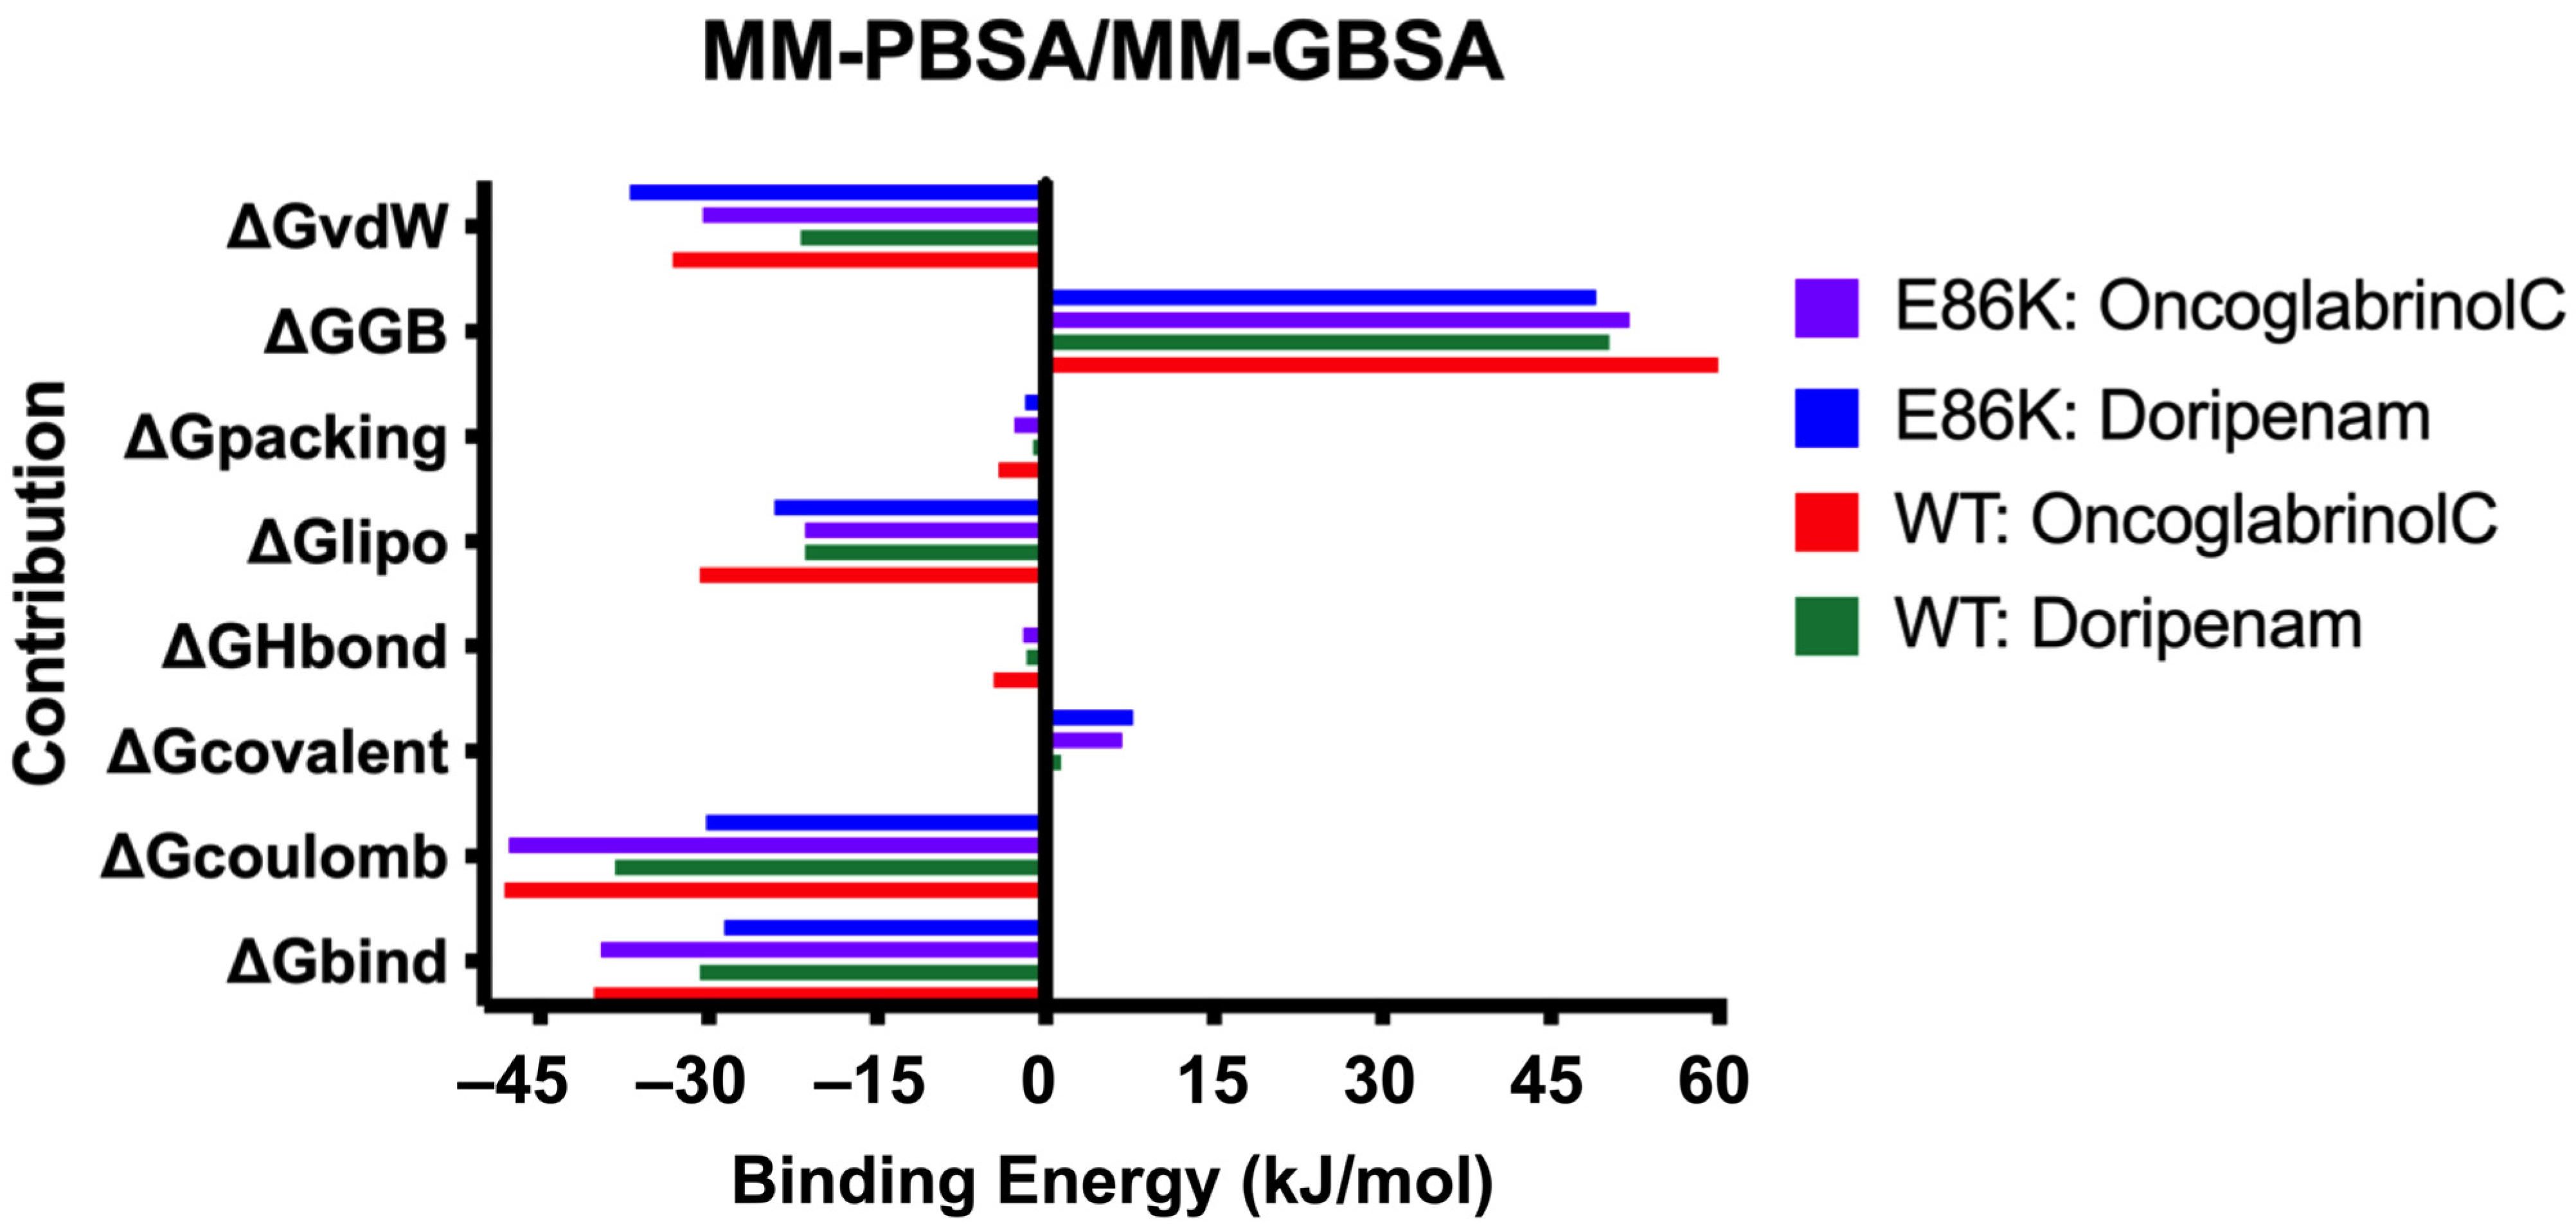
3.7. Binding Free Energy (MMPBSA/MMGBSA) Analysis
3.8. PCA Analysis
4. Conclusions
Supplementary Materials
Author Contributions
Funding
Data Availability Statement
Conflicts of Interest
References
- Patil, A.B.; Nadagir, S.D.; Lakshminarayana, S.A.; Fasiha, M.S. Morganella morganii, subspecies morganii, biogroup A: An unusual causative pathogen of brain abscess. J. Neurosci. Rural Pract. 2012, 3, 370–372. [Google Scholar] [CrossRef] [PubMed]
- Zaric, R.Z.; Jankovic, S.; Zaric, M.; Milosavljevic, M.; Stojadinovic, M.; Pejcic, A. Antimicrobial treatment of Morganella morganii invasive infections: Systematic review. Indian J. Med. Microbiol. 2021, 39, 404–412. [Google Scholar] [CrossRef] [PubMed]
- Liu, H.; Zhu, J.; Hu, Q.; Rao, X. Morganella morganii, a non-negligent opportunistic pathogen. Int. J. Infect. Dis. 2016, 50, 10–17. [Google Scholar] [CrossRef]
- Amini, M.; Motie, M.R.; Amel Jamehdar, S.; Kasraei, M.R.; Sobhani, M. Concomitant empyema and peritonitis with Morganella morganii in an immunocompetent patient: A case report. Casp. J. Intern. Med. 2021, 12, 232–235. [Google Scholar]
- Xiang, R.; Li, M. Identification of Tn6835 and a Novel Genomic Island, MMGI-1, in a Pan-Resistant Morganella morganii Strain. Antimicrob. Agents Chemother. 2021, 65, e02524-20. [Google Scholar] [CrossRef]
- Toleman, M.A.; Walsh, T.R. Combinatorial events of insertion sequences and ICE in Gram-negative bacteria. FEMS Microbiol. Rev. 2011, 35, 912–935. [Google Scholar] [CrossRef]
- Harada, S.; Ishii, Y.; Saga, T.; Kouyama, Y.; Tateda, K.; Yamaguchi, K. Chromosomal integration and location on IncT plasmids of the blaCTX-M-2 gene in Proteus mirabilis clinical isolates. Antimicrob. Agents Chemother. 2012, 56, 1093–1096. [Google Scholar] [CrossRef] [PubMed]
- Rojas, L.; Vinuesa, T.; Tubau, F.; Truchero, C.; Benz, R.; Viñas, M. Integron presence in a multiresistant Morganella morganii isolate. Int. J. Antimicrob. Agents 2006, 27, 505–512. [Google Scholar] [CrossRef] [PubMed]
- Shi, D.-S.; Wang, W.-P.; Kuai, S.-G.; Shao, H.-F.; Huang, M. Identification of bla KPC-2 on different plasmids of three Morganella morganii isolates. Eur. J. Clin. Microbiol. Infect. Dis. 2012, 31, 797–803. [Google Scholar] [CrossRef]
- Tsakris, A.; Ikonomidis, A.; Spanakis, N.; Poulou, A.; Pournaras, S. Characterization of In3Mor, a new integron carrying VIM-1 metallo-beta-lactamase and sat1 gene, from Morganella morganii. J. Antimicrob. Chemother. 2007, 59, 739–741. [Google Scholar] [CrossRef]
- Ramirez, M.S.; Nikolaidis, N.; Tolmasky, M.E. Rise and dissemination of aminoglycoside resistance: The aac(6′)-Ib paradigm. Front. Microbiol. 2013, 4, 121. [Google Scholar] [CrossRef] [PubMed]
- Lin, D.L.; Tran, T.; Adams, C.; Alam, J.Y.; Herron, S.R.; Tolmasky, M.E. Inhibitors of the aminoglycoside 6′-N-acetyltransferase type Ib [AAC(6′)-Ib] identified by in silico molecular docking. Bioorg. Med. Chem. Lett. 2013, 23, 5694–5698. [Google Scholar] [CrossRef] [PubMed]
- Wybenga-Groot, L.E.; Draker, K.; Wright, G.D.; Berghuis, A.M. Crystal structure of an aminoglycoside 6’-N-acetyltransferase: Defining the GCN5-related N-acetyltransferase superfamily fold. Structure 1999, 7, 497–507. [Google Scholar] [CrossRef] [PubMed]
- Neuwald, A.F.; Landsman, D. GCN5-related histone N-acetyltransferases belong to a diverse superfamily that includes the yeast SPT10 protein. Trends Biochem. Sci. 1997, 22, 154–155. [Google Scholar] [CrossRef] [PubMed]
- Huang, W.-H.; Kao, C.-C.; Mao, Y.-C.; Lai, C.-S.; Lai, K.-L.; Lai, C.-H.; Tseng, C.-H.; Huang, Y.-T.; Liu, P.-Y. Shewanella algae and Morganella morganii Coinfection in Cobra-Bite Wounds: A Genomic Analysis. Life 2021, 11, 329. [Google Scholar] [CrossRef] [PubMed]
- Fourmy, D.; Recht, M.I.; Blanchard, S.C.; Puglisi, J.D. Structure of the A site of Escherichia coli 16S ribosomal RNA complexed with an aminoglycoside antibiotic. Science 1996, 274, 1367–1371. [Google Scholar] [CrossRef] [PubMed]
- Mingeot-Leclercq, M.P.; Glupczynski, Y.; Tulkens, P.M. Aminoglycosides: Activity and resistance. Antimicrob. Agents Chemother. 1999, 43, 727–737. [Google Scholar] [CrossRef] [PubMed]
- Goh, E.-B.; Yim, G.; Tsui, W.; McClure, J.; Surette, M.G.; Davies, J. Transcriptional modulation of bacterial gene expression by subinhibitory concentrations of antibiotics. Proc. Natl. Acad. Sci. USA 2002, 99, 17025–17030. [Google Scholar] [CrossRef]
- Possoz, C.; Newmark, J.; Sorto, N.; Sherratt, D.J.; Tolmasky, M.E. Sublethal concentrations of the aminoglycoside amikacin interfere with cell division without affecting chromosome dynamics. Antimicrob. Agents Chemother. 2007, 51, 252–256. [Google Scholar] [CrossRef]
- Li, Y.; Green, K.D.; Johnson, B.R.; Garneau-Tsodikova, S. Inhibition of aminoglycoside acetyltransferase resistance enzymes by metal salts. Antimicrob. Agents Chemother. 2015, 59, 4148–4156. [Google Scholar] [CrossRef]
- Krause, K.M.; Serio, A.W.; Kane, T.R.; Connolly, L.E. Aminoglycosides: An Overview. Cold Spring Harb. Perspect. Med. 2016, 6, a027029. [Google Scholar] [CrossRef] [PubMed]
- Vong, K.; Auclair, K. Understanding and overcoming aminoglycoside resistance caused by N-6′-acetyltransferase. MedChemComm 2012, 3, 397–407. [Google Scholar] [CrossRef]
- Kelley, L.A.; Mezulis, S.; Yates, C.M.; Wass, M.N.; Sternberg, M.J.E. The Phyre2 web portal for protein modeling, prediction and analysis. Nat. Protoc. 2015, 10, 845–858. [Google Scholar] [CrossRef]
- Jumper, J.; Evans, R.; Pritzel, A.; Green, T.; Figurnov, M.; Ronneberger, O.; Tunyasuvunakool, K.; Bates, R.; Žídek, A.; Potapenko, A.; et al. Highly accurate protein structure prediction with AlphaFold. Nature 2021, 596, 583–589. [Google Scholar] [CrossRef]
- Zheng, Y.G. (Ed.) Epigenetic Technological Applications; Elsevier: Cham, Switzerland, 2015. [Google Scholar] [CrossRef]
- UniProt Consortium. The universal protein resource (UniProt). Nucleic Acids Res. 2008, 36, D190–D195. [Google Scholar]
- UniProt Consortium. UniProt: A hub for protein information. Nucleic Acids Res. 2015, 43, D204–D212. [Google Scholar] [CrossRef]
- The UniProt Consortium. UniProt: The universal protein knowledgebase. Nucleic Acids Res. 2017, 45, D158–D169. [Google Scholar] [CrossRef]
- Bendl, J.; Stourac, J.; Salanda, O.; Pavelka, A.; Wieben, E.D.; Zendulka, J.; Brezovsky, J.; Damborsky, J. PredictSNP: Robust and accurate consensus classifier for prediction of disease-related mutations. PLoS Comput. Biol. 2014, 10, e1003440. [Google Scholar] [CrossRef] [PubMed]
- Capriotti, E.; Calabrese, R.; Casadio, R. Predicting the insurgence of human genetic diseases associated to single point protein mutations with support vector machines and evolutionary information. Bioinformatics 2006, 22, 2729–2734. [Google Scholar] [CrossRef] [PubMed]
- Adzhubei, I.A.; Schmidt, S.; Peshkin, L.; Ramensky, V.E.; Gerasimova, A.; Bork, P.; Kondrashov, A.S.; Sunyaev, S.R. A method and server for predicting damaging missense mutations. Nat. Methods 2010, 7, 248–249. [Google Scholar] [CrossRef]
- Pauline, C.N.; Henikoff, S. Predicting deleterious amino acid substitutions. Genome Res. 2001, 11, 863–874. [Google Scholar]
- Sim, N.-L.; Kumar, P.; Hu, J.; Henikoff, S.; Schneider, G.; Ng, P.C. SIFT web server: Predicting effects of amino acid substitutions on proteins. Nucleic Acids Res. 2012, 40, W452–W457. [Google Scholar] [CrossRef] [PubMed]
- Johnson, A.D.; Handsaker, R.E.; Pulit, S.L.; Nizzari, M.M.; O’Donnell, C.J.; De Bakker, P.I. SNAP: A web-based tool for identification and annotation of proxy SNPs using HapMap. Bioinformatics 2008, 24, 2938–2939. [Google Scholar] [CrossRef] [PubMed]
- Mi, H.; Muruganujan, A.; Thomas, P.D. PANTHER in 2013: Modeling the evolution of gene function, and other gene attributes, in the context of phylogenetic trees. Nucleic Acids Res. 2013, 41, D377–D386. [Google Scholar] [CrossRef] [PubMed]
- Roy, A.; Kucukural, A.; Zhang, Y. I-TASSER: A unified platform for automated protein structure and function prediction. Nat. Protoc. 2010, 5, 725–738. [Google Scholar] [CrossRef] [PubMed]
- Yang, J.; Zhang, Y. I-TASSER server: New development for protein structure and function predictions. Nucleic Acids Res. 2015, 43, W174–W181. [Google Scholar] [CrossRef] [PubMed]
- Nielsen, M.; Lundegaard, C.; Lund, O.; Petersen, T.N. CPHmodels-3.0—Remote homology modeling using structure-guided sequence profiles. Nucleic Acids Res. 2010, 38, W576–W581. [Google Scholar] [CrossRef] [PubMed]
- Waterhouse, A.; Bertoni, M.; Bienert, S.; Studer, G.; Tauriello, G.; Gumienny, R.; Heer, F.T.; de Beer, T.A.P.; Rempfer, C.; Bordoli, L.; et al. SWISS-MODEL: Homology modelling of protein structures and complexes. Nucleic Acids Res. 2018, 46, W296–W303. [Google Scholar] [CrossRef] [PubMed]
- Krieger, E.; Joo, K.; Lee, J.; Lee, J.; Raman, S.; Thompson, J.; Tyka, M.; Baker, D.; Karplus, K. Improving physical realism, stereochemistry, and side-chain accuracy in homology modeling: Four approaches that performed well in CASP8. Proteins 2009, 77 (Suppl. S9), 114–122. [Google Scholar] [CrossRef]
- Lovell, S.C.; Davis, I.W.; Arendall, W.B.; de Bakker, P.I.W.; Word, J.M.; Prisant, M.G.; Richardson, J.S.; Richardson, D.C. Structure validation by Calpha geometry: Phi, psi and Cbeta deviation. Proteins 2003, 50, 437–450. [Google Scholar] [CrossRef]
- Carugo, O.; Djinovic-Carugo, K. Half a century of Ramachandran plots. Acta Crystallogr. Sect. D Biol. Crystallogr. 2013, 69, 1333–1341. [Google Scholar] [CrossRef] [PubMed]
- Wiederstein, M.; Sippl, M.J. ProSA-web: Interactive web service for the recognition of errors in three-dimensional structures of proteins. Nucleic Acids Res. 2007, 35, W407–W410. [Google Scholar] [CrossRef] [PubMed]
- Colovos, C.; Yeates, T.O. Verification of protein structures: Patterns of nonbonded atomic interactions. Protein Sci. 1993, 2, 1511–1519. [Google Scholar] [CrossRef] [PubMed]
- Eisenberg, D.; Lüthy, R.; Bowie, J.U. VERIFY3D: Assessment of protein models with three-dimensional profiles. Meth. Enzymol. 1997, 277, 396–404. [Google Scholar]
- Laskowski, R.A.; MacArthur, M.W.; Moss, D.S.; Thornton, J.M. PROCHECK: A program to check the stereochemical quality of protein structures. J. Appl. Crystallogr. 1993, 26, 283–291. [Google Scholar] [CrossRef]
- Kim, S.; Thiessen, P.A.; Bolton, E.E.; Chen, J.; Fu, G.; Gindulyte, A.; Han, L.; He, J.; He, S.; Shoemaker, B.A.; et al. PubChem Substance and Compound databases. Nucleic Acids Res. 2016, 44, D1202–D1213. [Google Scholar] [CrossRef]
- Kim, S.; Chen, J.; Cheng, T.; Gindulyte, A.; He, J.; He, S.; Li, Q.; Shoemaker, B.A.; Thiessen, P.A.; Yu, B.; et al. PubChem in 2021: New data content and improved web interfaces. Nucleic Acids Res. 2021, 49, D1388–D1395. [Google Scholar] [CrossRef]
- Morris, G.M.; Huey, R.; Lindstrom, W.; Sanner, M.F.; Belew, R.K.; Goodsell, D.S.; Olson, A.J. AutoDock4 and AutoDockTools4: Automated docking with selective receptor flexibility. J. Comput. Chem. 2009, 30, 2785–2791. [Google Scholar] [CrossRef]
- Adaptation in Natural and Artificial Systems. Available online: https://mitpress.mit.edu/9780262581110/adaptation-in-natural-and-artificial-systems/ (accessed on 12 December 2023).
- Huang, J.; MacKerell, A.D. CHARMM36 all-atom additive protein force field: Validation based on comparison to NMR data. J. Comput. Chem. 2013, 34, 2135–2145. [Google Scholar] [CrossRef]
- Humphrey, W.; Dalke, A.; Schulten, K. VMD: Visual molecular dynamics. J. Mol. Graph. 1996, 14, 33–38. [Google Scholar] [CrossRef]
- Berendsen, H.J.C.; van der Spoel, D.; van Drunen, R. GROMACS: A message-passing parallel molecular dynamics implementation. Comput. Phys. Commun. 1995, 91, 43–56. [Google Scholar] [CrossRef]
- Kutzner, C.; Páll, S.; Fechner, M.; Esztermann, A.; de Groot, B.L.; Grubmüller, H. More bang for your buck: Improved use of GPU nodes for GROMACS 2018. J. Comput. Chem. 2019, 40, 2418–2431. [Google Scholar] [CrossRef] [PubMed]
- Abraham, M.J.; Murtola, T.; Schulz, R.; Páll, S.; Smith, J.C.; Hess, B.; Lindahl, E. GROMACS: High performance molecular simulations through multi-level parallelism from laptops to supercomputers. SoftwareX 2015, 1–2, 19–25. [Google Scholar] [CrossRef]
- Carrascal, N.; Green, D.F. Energetic decomposition with the generalized-born and Poisson-Boltzmann solvent models: Lessons from association of G-protein components. J. Phys. Chem. B 2010, 114, 5096–5116. [Google Scholar] [CrossRef] [PubMed]
- Lee, M.C.; Yang, R.; Duan, Y. Comparison between Generalized-Born and Poisson-Boltzmann methods in physics-based scoring functions for protein structure prediction. J. Mol. Model. 2005, 12, 101–110. [Google Scholar] [CrossRef] [PubMed]
- Boutet, E.; Lieberherr, D.; Tognolli, M.; Schneider, M.; Bansal, P.; Bridge, A.J.; Poux, S.; Bougueleret, L.; Xenarios, I. UniProtKB/Swiss-Prot, the Manually Annotated Section of the UniProt KnowledgeBase: How to Use the Entry View. Methods Mol. Biol. 2016, 1374, 23–54. [Google Scholar] [PubMed]
- Gasteiger, E.; Hoogland, C.; Gattiker, A.; Duvaud, S.E.; Wilkins, M.R.; Appel, R.D.; Bairoch, A. Protein Identification and Analysis Tools on the ExPASy Server. In The Proteomics Protocols Handbook; Walker, J.M., Ed.; Humana Press: Totowa, NJ, USA, 2005; pp. 571–607. [Google Scholar] [CrossRef]
- Lüthy, R.; Bowie, J.U.; Eisenberg, D. Assessment of protein models with three-dimensional profiles. Nature 1992, 356, 83–85. [Google Scholar] [CrossRef] [PubMed]
- Bowie, J.U.; Lüthy, R.; Eisenberg, D. A method to identify protein sequences that fold into a known three-dimensional structure. Science 1991, 253, 164–170. [Google Scholar] [CrossRef] [PubMed]
- Bikadi, Z.; Hazai, E. Application of the PM6 semi-empirical method to modeling proteins enhances docking accuracy of AutoDock. J. Cheminform. 2009, 1, 15. [Google Scholar] [CrossRef]
- Forli, S.; Huey, R.; Pique, M.E.; Sanner, M.F.; Goodsell, D.S.; Olson, A.J. Computational protein-ligand docking and virtual drug screening with the AutoDock suite. Nat. Protoc. 2016, 11, 905–919. [Google Scholar] [CrossRef]
- Rizvi, S.M.D.; Shakil, S.; Haneef, M. A simple click by click protocol to perform docking: AutoDock 4.2 made easy for non-bioinformaticians. EXCLI J. 2013, 12, 831–857. [Google Scholar] [PubMed]
- Parvez, M.K.; Al-Dosari, M.S.; Ahmed, S.; Rehman, M.T.; Al-Rehaily, A.J.; Alajmi, M.F. Oncoglabrinol C, a new flavan from Oncocalyx glabratus protects endothelial cells against oxidative stress and apoptosis, and modulates hepatic CYP3A4 activity. Saudi Pharm. J. 2020, 28, 648–656. [Google Scholar] [CrossRef] [PubMed]
- Van Der Spoel, D.; Lindahl, E.; Hess, B.; Groenhof, G.; Mark, A.E.; Berendsen, H.J. GROMACS: Fast, flexible, and free. J. Comput. Chem. 2005, 26, 1701–1718. [Google Scholar] [CrossRef] [PubMed]
- Baig, M.H.; Sudhakar, D.R.; Kalaiarasan, P.; Subbarao, N.; Wadhawa, G.; Lohani, M.; Khan, M.K.A.; Khan, A.U. Insight into the effect of inhibitor resistant S130G mutant on physico-chemical properties of SHV type beta-lactamase: A molecular dynamics study. PLoS ONE 2014, 9, e112456. [Google Scholar] [CrossRef] [PubMed]
- Bawn, M.; Magliozzo, R.S. Molecular dynamics investigation of the role of residues D137 and S315 to INH binding in katg. BioRxiv 2018. [Google Scholar] [CrossRef]
- Lobanov, M.Y.; Bogatyreva, N.S.; Galzitskaya, O.V. Radius of gyration as an indicator of protein structure compactness. Mol. Biol. 2008, 42, 623–628. [Google Scholar] [CrossRef]
- Alazmi, M.; Motwalli, O. In silico virtual screening, characterization, docking and molecular dynamics studies of crucial SARS-CoV-2 proteins. J. Biomol. Struct. Dyn. 2021, 39, 6761–6771. [Google Scholar] [CrossRef]
- Motwalli, O.; Alazmi, M. Analysis of natural compounds against the activity of SARS-CoV-2 NSP15 protein towards an effective treatment against COVID-19: A theoretical and computational biology approach. J. Mol. Model. 2021, 27, 160. [Google Scholar] [CrossRef]
- Alazmi, M. Molecular basis of the beta-lactamase protein using comparative modelling, drug screening and molecular dynamics studies to understand the resistance of β-lactam antibiotics. J. Mol. Model. 2020, 26, 200. [Google Scholar] [CrossRef]


| Parameters | Predicted Value |
|---|---|
| Molecular weight | 16,376.45 |
| Theoretical pI | 5.1 |
| Number of positive residues | 13 |
| Number of negative residues | 18 |
| Half-life mammalian reticulocytes (in vitro) | 30 h |
| Half-life yeast (in vivo) | >20 h |
| Half-life E. coli (in vivo) | >10 h |
| Extinction coefficient | 26,720 |
| Instability index | 40.17 |
| Aliphatic index | 77.76 |
| GRAVY index | 0.059 |
| Modeling Servers | Procheck | Veryify % | Errat % | Template Used | ||||||
|---|---|---|---|---|---|---|---|---|---|---|
| Ramachandran Plot (% Residues) | Bad Contacts | G-Factor | Residues | |||||||
| Favored Region (%) | Additional Allowed Regions (%) | Generously Allowed Regions (%) | Disallowed Regions (%) | |||||||
| I-Tasser | 77.9 | 17.6 | 1.5 | 3.1 | 0 | - | 152 | 75.66 | 84.32 | 5hmn.1A |
| Phyre2 server (intensive mode) | 90.8 | 7.6 | 0.8 | 0.8 | 5 | - | 152 | 78.29 | 79.41 | C4e8o.1B |
| D1s3z.1A | ||||||||||
| Swiss modeling | 92.1 | 7.1 | 0.8 | 0.0 | 0 | - | 146 | 85.62 | 94.35 | 4E8O.1A |
| Alphafold2 | 92.0 | 5.6 | 2.4 | 0.0 | 1 | - | 152 | 88.19 | 88.19 | 1s3zb.1B |
| Ligand | Structure | Mol. Wt. (g/mol) | xLogP | Binding Energy (kcal/mol) | Binding Energy (Kj/mol) | Inhibition Constant (nM) | Polar Contacts | Non-Polar Contacts |
|---|---|---|---|---|---|---|---|---|
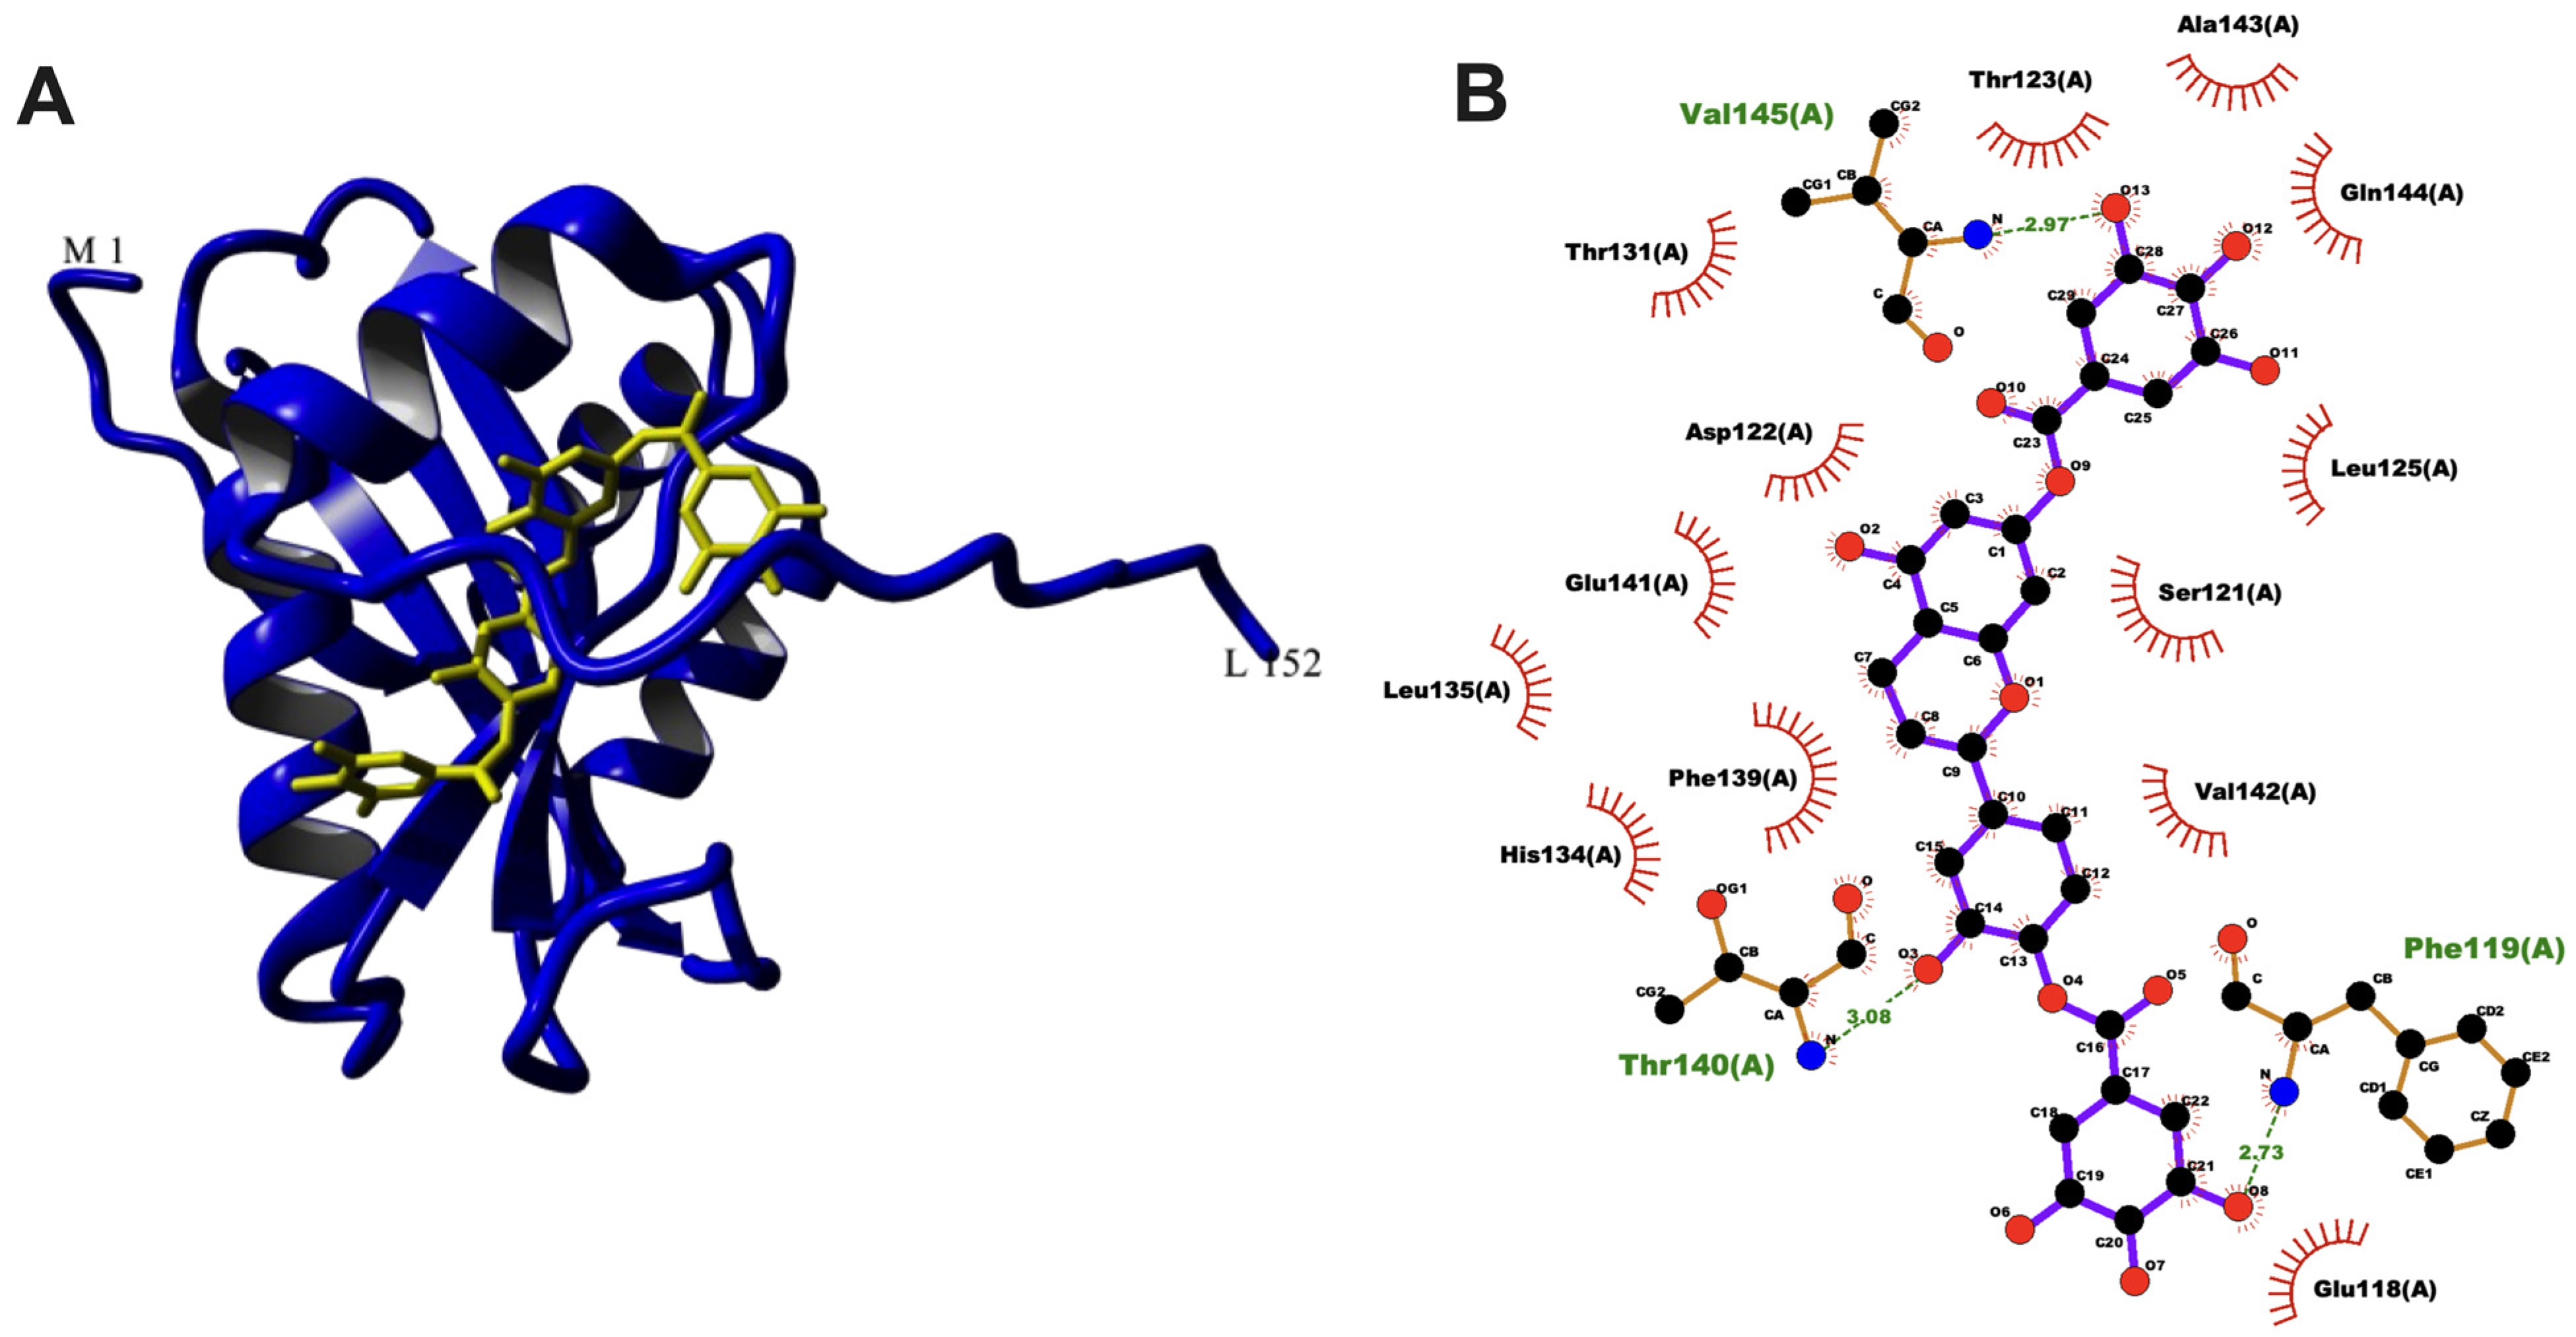
| OncoglabrinolC | 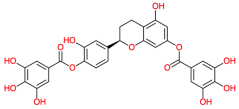 | 556.311 | - | −12.82 | −53.63 | 0.40 | Phe119, Val145, Thr140 | Ala120, Val142, His134, Phe139, Cys77, Leu125, Leu135, Ser121, |
| Doripenem | 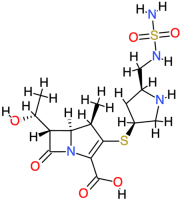 | 420.5 | 0.84 | −10.28 | −43.01 | 29.23 | Gln124, Asn127, Trp88, Arg71 | Asp122, Glu86, Trp6 |
| Silymarin |  | 482.4 | 2.4 | −9.88 | −41.33 | 57.7 | Thr140, Gly138, Glu108, Thr123 | Ala120, Ser121, Val142, Asp122, Cys77, Phe139 |
| Silibinin | 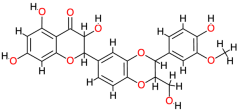 | 482.4 | 2.4 | −9.86 | −41.25 | 59.31 | Thr140, Gly138, Glu108, Thr123 | Ala120, Ser121, Val142, Cys77, Phe139 |
| Malvidin |  | 331.3 | - | −7.78 | −32.55 | 1970 | Ala133, Arg96 | Ala94, Gly100, Ala137 |
| Tetracycline |  | 444.4 | −2 | −8.87 | −37.11 | 316.66 | Val145, Thr123, Glu76, Glu75 | Leu125 |
| Berberine | 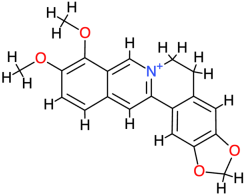 | 336.4 | 3.6 | −8.55 | −35.77 | 540.44 | Thr140 | Val142, Phe119, Glu118, Ala120, Ser121, His134, Asp122, Thr123 |
| Taxifolin | 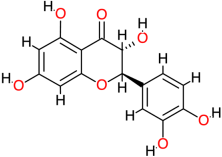 | 304.3 | 1.5 | −7.3 | −30.54 | 4460 | Glu141, Ser121, Val145 | Leu125 |
| Cyanidin | 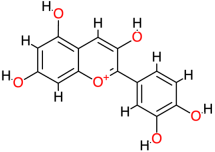 | 287.2 | - | −7.78 | −32.55 | 1970 | Thr123, Thr140, Val145 | Leu125 |
| Catechin | 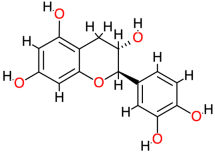 | 290.3 | 0.4 | −7.84 | −32.80 | 1790 | Thr123, Thr140, Val145 | Leu125 |
| Telithromycin | 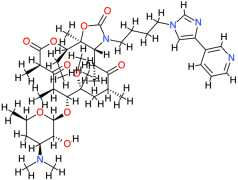 | 812.0 | 4.2 | −7.27 | −30.41 | 4710 | Glu86, Leu125 | Phe84, Cys147, Thr123, Asp122 |
| Relacin | 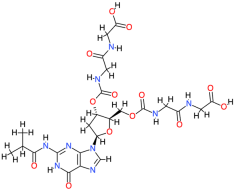 | 653.6 | −2.4 | −8.74 | −36.56 | 389.94 | Glu86, Gln124, Cys147 | Trp26, Asp122, Arg146 |
| Pyrimethamine |  | 248.7 | 2.7 | −7.47 | −31.25 | 3360 | Cys77, Glu118, Thr140 | Ala120, His134, Val142 |
| Doxycycline | 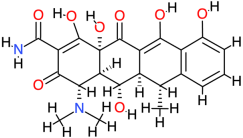 | 444.4 | −0.7 | −9.28 | −38.82 | 157.63 | Glu75, Thr117, Glu118, Phe119, Thr140 | Cys77, Ala120, Gly138, Phe139, Val142 |
| Picloram | 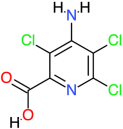 | 241.5 | 2.2 | −5.27 | −22.04 | 136,840 | Ala94, Gln97, Val101, Gly98, Arg96 | Trp88, Arg95, Val90, Ala136, Ala133, Gly100, Val99 |
| Azithromycin | 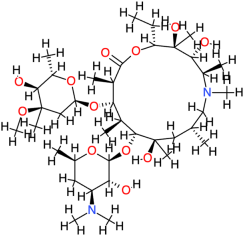 | 749.0 | 4 | −8.86 | −37.07 | 319.06 | Cys147 | Asp122, Glu75, Phe84, Val145, Ser121, His134, Thr123, Leu125, Arg146 |
| Erythromycin | 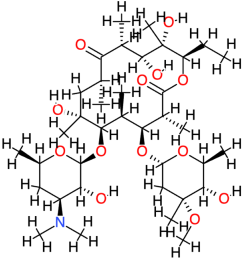 | 733.9 | 2.7 | −5.7 | −23.84 | 66,170 | Asp122, Arg149 | Cys147, Glu76, Ala143, Val145 |
| Ascorbic Acid | 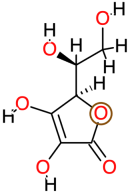 | 176.1 | −1.6 | −4.83 | −20.20 | 288,630 | Gln97, Val99, Gly100, Val101 | Val90, Arg95, Arg96 |
| Clarithromycin | 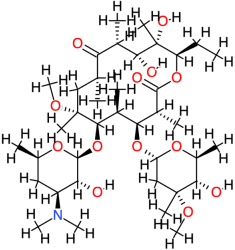 | 748.0 | 3.2 | −6.34 | −26.52 | 22,500 | Thr123, Ala143 | Glu86, Asp122, Gln124, Leu125, Cys147 |
| Adenosine | 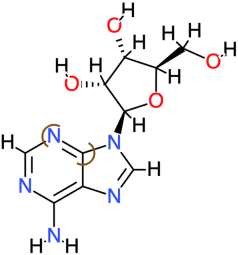 | 267.2 | −1.1 | −4.97 | −20.79 | 226,220 | Phe119, Val142, Ala143 | Ala120, Thr123 |
| Roxithromycin | 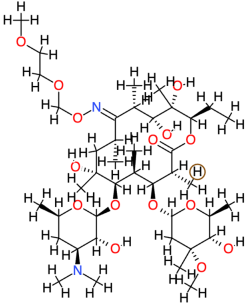 | 837.0 | 3.1 | −4.77 | −19.95 | 320,270 | Leu125, Cys147 | Asp122, Gln124, Arg146, Arg149 |
| Ligand | Total Polar Surface Area (TPSA) | Predicted LD50 | Predicted Toxicity Class | Prediction Accuracy (%) | Toxicity Model Prediction |
|---|---|---|---|---|---|
| OncoglabrinolC | 223.67 | 2170 | 5 | 76.33 | Nephrotoxicity, Respiratory toxicity, Cardiotoxicity, Immunotoxicity, Nutritional Toxicity |
| Doripenem | 195.74 | 5000 | 5 | 69.26 | Nephrotoxicity, Respiratory toxicity, Clinical Toxicity |
| Silymarin | 155.14 | 2000 | 4 | 69.33 | Nephrotoxicity, Respiratory toxicity, Cardiotoxicity, Immunotoxicity, BBB-barrier, Nutritional Toxicity |
| Silibinin | 155.14 | 2000 | 4 | 69.26 | Nephrotoxicity, Respiratory toxicity, Cardiotoxicity, Immunotoxicity, Nutritional Toxicity |
| Malvidin | 112.52 | 5000 | 5 | 69.26 | Nephrotoxicity, Respiratory toxicity, Cardiotoxicity, Immunotoxicity, BBB-barrier, Nutritional Toxicity |
| Tetracycline | 181.62 | 4400 | 4 | 68.07 | Hepatotoxicity, Respiratory toxicity, Immunotoxicity, Clinical toxicity, Nutritional Toxicity |
| Berberine | 40.8 | 200 | 3 | 67.38 | Neurotoxicity, Respiratory toxicity, Carcinogenicity, Immunotoxicity, Mutagenicity, Cytotoxicity, BBB-barrier, Ecotoxicity |
| Taxifolin | 127.45 | 2000 | 4 | 100 | Nephrotoxicity, Respiratory toxicity, Carcinogenicity, Mutagenicity, BBB-barrier, Nutritional Toxicity |
| Cyanidin | 114.29 | 5000 | 5 | 69.26 | Nephrotoxicity, Respiratory toxicity, Carcinogenicity, BBB-barrier, Nutritional Toxicity |
| Catechin | 110.38 | 10,000 | 6 | 100 | Nephrotoxicity, Respiratory toxicity, BBB-barrier, Clinical toxicity, Nutritional toxicity |
| Telithromycin | 171.85 | 300 | 3 | 54.26 | Hepatotoxicity, Neurotoxicity, Nephrotoxicity, Respiratory toxicity, Immunotoxicity, Clinical Toxicity, Nutritional toxicity |
| Relacin | 311.36 | 3000 | 5 | 67.38 | Neurotoxicity, Nephrotoxicity, Respiratory toxicity, Clinical Toxicity |
| Pyrimethamine | 77.82 | 92 | 3 | 100 | Neurotoxicity, Respiratory toxicity, BBB-Barrier, Ecotoxicity, Clinical Toxicity |
| Doxycycline | 181.62 | 2240 | 4 | 68.07 | Hepatotoxicity, Respiratory toxicity, Immunotoxicity, Clinical toxicity |
| Picloram | 76.21 | 686 | 4 | 100 | Hepatotoxicity, Neurotoxicity, Nephrotoxicity, Mutagenicity, BBB-Barrier, Clinical toxicity |
| Azithromycin | 180.08 | 2000 | 4 | 100 | Neurotoxicity, Nephrotoxicity, Respiratory toxicity, Immunotoxicity, Clinical toxicity |
| Erythromycin | 193.91 | 2000 | 4 | 100 | Hepatotoxicity, Neurotoxicity, Nephrotoxicity, Respiratory toxicity, Immunotoxicity, Clinical toxicity |
| Vitamin C | 107.22 | 3367 | 5 | 100 | BBB-barrier, Clinical toxicity, Nephrotoxicity |
| Clarithromycin | 182.91 | 1230 | 4 | 100 | Hepatotoxicity, Neurotoxicity, Nephrotoxicity, Respiratory toxicity, Immunotoxicity, Clinical toxicity |
| Adenosine | 139.54 | 8 | 2 | 100 | Neurotoxicity, Respiratory toxicity, Cytotoxicity, BBB-barrier |
| Roxithromycin | 216.89 | 3.004 | 2 | 100 | Hepatotoxicity, Blood–brain barrier |
Disclaimer/Publisher’s Note: The statements, opinions and data contained in all publications are solely those of the individual author(s) and contributor(s) and not of MDPI and/or the editor(s). MDPI and/or the editor(s) disclaim responsibility for any injury to people or property resulting from any ideas, methods, instructions or products referred to in the content. |
© 2024 by the authors. Licensee MDPI, Basel, Switzerland. This article is an open access article distributed under the terms and conditions of the Creative Commons Attribution (CC BY) license (https://creativecommons.org/licenses/by/4.0/).
Share and Cite
Alazmi, M.; Motwalli, O. Discovery of Natural Compound-Based Lead Molecule against Acetyltransferase Type 1 Bacterial Enzyme from Morganella morgani Using Machine Learning-Enabled Molecular Dynamics Simulation. Processes 2024, 12, 1047. https://doi.org/10.3390/pr12061047
Alazmi M, Motwalli O. Discovery of Natural Compound-Based Lead Molecule against Acetyltransferase Type 1 Bacterial Enzyme from Morganella morgani Using Machine Learning-Enabled Molecular Dynamics Simulation. Processes. 2024; 12(6):1047. https://doi.org/10.3390/pr12061047
Chicago/Turabian StyleAlazmi, Meshari, and Olaa Motwalli. 2024. "Discovery of Natural Compound-Based Lead Molecule against Acetyltransferase Type 1 Bacterial Enzyme from Morganella morgani Using Machine Learning-Enabled Molecular Dynamics Simulation" Processes 12, no. 6: 1047. https://doi.org/10.3390/pr12061047
APA StyleAlazmi, M., & Motwalli, O. (2024). Discovery of Natural Compound-Based Lead Molecule against Acetyltransferase Type 1 Bacterial Enzyme from Morganella morgani Using Machine Learning-Enabled Molecular Dynamics Simulation. Processes, 12(6), 1047. https://doi.org/10.3390/pr12061047