Abstract
The CFD/DEM approach was used for investigating the forces playing a role in a furnace raceway formation and stability. The configuration is an actual pilot-scale hot blast furnace filled only with coke particles. In such a system, the raceway was unstable, with successively a growing phase and a collapse. The CFD/DEM numerical simulations were coupled with a core-shrinking model to mimic coke particle combustion. However, the kinetic reactions and heat transfers were not numerically predicted. Instead, the characteristic combustion timescale of one coke particle was imposed, and the combustion zone was adjusted to match the global combustion measured in the pilot-scale experiment. The results showed that the standard contact model was not enough to resist the pressure exerted by the granular weight on the raceway. However, the addition of a cohesive force, through the Johnson-Kendall-Roberts (JKR) model, allowed the qualitative reproduction of the gas pressure fluctuations and the collapse cycles in accordance with the experiment. A sensitivity analysis of the flow rate showed that CFD/DEM is able to reproduce quantitatively the time between two collapses, as observed in the experiment. Predicted raceway size and shapes are also in agreement with the experimental observations in the range of investigated parameters.
1. Introduction
The iron-making industry produces pig iron in a hot packed-bed gas-solid-liquid furnace called a blast furnace. At the top of the furnace, coke and iron-bearing materials are successively loaded. In a quasi-static regime, the materials are traveling downward while a reducing hot gas is injected at the bottom. In such a system, many complex phenomena take place, such as heat transfers, chemical reactions, and fluid-solid transport. Hot air is injected horizontally from tuyeres located at the bottom of blast furnaces and creates regions with a low solid volume fraction called raceways or cavities. In these regions, the heat is released and reduced gases are generated by coke combustion. The role of the raceway is crucial for the gas distribution in the blast furnace and, consequently, to the production [1]. The raceway results from several associated complex mechanisms, such as combustion and chemical reactions, diffusion in the matrix of grains, fluid-particle interactions, and the contacts between the grains and with the walls. Nomura [2] made a mechanical analysis of the forces acting on the raceway in order to propose a correlation for predicting the raceway length. The analysis consisted of a balance between the gas pressure at the raceway boundary and the weight of the coke particles. However, the resistance due to the formation of arches or cohesive forces between particles was omitted. Nowadays, the understanding of grains’ physics leads people to reconsider the mechanical analysis made by Nomura [2]. Indeed, in industrial blast furnace, the extreme conditions, in terms of temperature and pressure, do not allow for measuring the raceway shape evolution, and the raceway stability mechanism is not fully understood. Experiments have been conducted at different scales to improve our understanding of the main physical phenomena responsible for the raceway formation and its dynamics. However, many uncertainties lead to an incomplete picture of the physical mechanisms [3,4].
Since several decades, the numerical simulation has been a powerful tool for investigating the main phenomena taking place in blast furnaces [5,6]. Basically, two approaches can be used: the Euler-Euler approach, also called the two-fluid model (TFM), and the discrete-based approach coupling computational fluid dynamics and the discrete element method (CFD/DEM). In TFM, both fluid and solid phases are treated as continuous media and require closure models for turbulent quantities, or subgrid contributions [7], and for taking into account complex physics like the frictional effects [8]. However, for computational efficiency reasons, the TFM is very adapted for systems like an actual industrial-scale blast furnace [9,10]. In the CFD/DEM approach, the trajectory of each particle is individually computed while the fluid is modeled as a continuous phase. For example, CFD/DEM has been used for investigating the solid dynamics in a blast furnace [11,12] or the attrition/breakage in raceway [13]. Kuang et al. [14] provides a comprehensive review of the modeling and simulation of the blast furnace raceway with TFM and CFD/DEM, and later Roeplal et al. [15] focuses on CFD/DEM.
Recently, many studies have been conducted on the raceways by means of CFD/DEM numerical simulation. Refs. [16,17,18,19,20,21,22] investigate the raceway formation accounting for the combustion in the raceway and the heat transfers in addition to the fluid-solid flows. These authors obtained satisfactory results about the combustion behaviors and the CO and CO2 composition as a function of the tuyere distance, which is a classical measure in a real blast furnace. Nevertheless, these studies are relevant for the combustion evaluation, but they do not provide an explanation of the mechanical stability of the raceway. One observes that the chosen simulated configurations include a very small system quite far from actual conditions in a blast furnace, notably with the granular pressure exerted by coke particle above the tuyere being very small due to the choice of the 2D configuration constrained by walls or due to a small particle column in a 3D configuration. Aminnia et al. [23] show that 2D numerical simulations overestimate the size of a raceway cavity compared to the 3D simulation. At the pilot scale, Cui et al. [24] found a very small raceway and Umekage et al. [25] a larger one, but in quasi-2D configuration. Finally, Xu et al. [26,27] investigated the reacting flow in one and three raceways in a realistic configuration. In all of these studies, the focus was on the combustion/reaction of the coke and not on the representation of the contact forces, namely from the mechanical point of view. In the present study, a pilot-scale, under actual conditions in terms of thermodynamics and coke loading, has been numerically simulated by CFD/DEM. The configuration corresponds to an experiment conducted using only coke particles in hot conditions similar to an actual blast furnace [4]. The consumption of the coke by combustion is mimicked by a core-shrinking model with two parameters: the characteristic timescale of the coke combustion and the global consumption of the pilot. Such an approach allows us to accurately investigate the forces responsible for the raceway formation.
The article is organized as follows: In the next section, the main experimental raceway pilot and results are detailed. The CFD/DEM approach, including a coke grain size modification model for mimicking the combustion of coke particles, is introduced in the third section. The fourth section is dedicated to the results. The central role of the cohesive forces in the raceway dynamics is shown. A sensitivity analysis of the gas flow rate on the properties of the simulated raceway is done in the fifth section. Conclusions and prospects are drawn in the last section.
2. Configuration and Reference Results of Pilot Experiment
The configuration of the pilot-scale set-up shown by Figure 1 has been developed to investigate how the raceway dynamics are sensitive to the process parameters [4]. The pilot has been designed in order to allow observation of the raceway through a large window in the zone where the combustion takes place. Compared to an actual typical blast furnace, the pilot has been downscaled by a factor of five such that it respects the equilibrium between the gas impulse and the weight of the coke above the cavity. Then the similarity of the pilot experimental results with a real blast furnace process should be respected. Finally, the geometry is pseudo-bi-dimensional, with a rectangular section of and in height. The air is injected, at room temperature, through a rectangular nozzle of . The size of coke particles is in the range [, ], and their shape is irregular, with faceted structures close to industrial coke shapes. The particles are charged from the top with a hopper, which permits a continuous coke feeding of the pilot. Note that the particles are charged at ambient temperature initially. The particle number is approximately about 200,000. The coke is ignited using a burner to start the combustion since the injected air from the tuyere is cold. For observing the time-evolution of the cavity, a window has been installed in front of the tuyere (see Figure 1). This window is made of a double-glazing quartz plate strengthened by metal wire. A brick wall takes place above the nozzle with an angle of 10°. Under the coke bed, only the ash and airflow can pass through a sealed ashtray. Finally, at the top of the pilot, a chimney let the air and combustion gases escape.
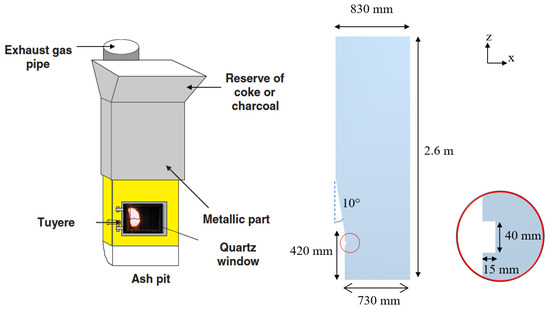
Figure 1.
Pilot’s sketch (from [4]) and geometry represented in the numerical simulation.
As shown by Figure 2, an important observation is that the raceway is not stable with time (here in the case the inlet flow rate is ). The cavity grows up to that arches are formed over the cavity (Figure 2a), then the coke bed becomes unstable and collapses (Figure 2b). Just before the collapse, the raceway length is measured in the x-direction where the cavity size is maximal (see Figure 1 for reference frame definition). Note that the first collapses are usually excluded from the analysis in order to get reproducible raceway length measurements at a constant inlet flow rate. Figure 2 shows that some particles stick to the refractory walls. These observations are at the origin of the subsequent numerical tests shown hereafter.
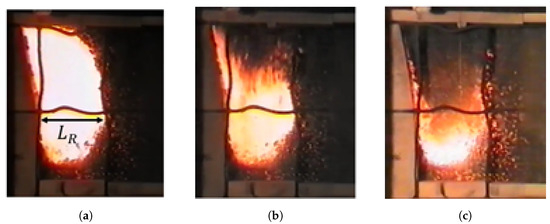
Figure 2.
Snapshots of raceway collapse during from its maximal height (a), during the collapse (b) and after (c). The duration of the collapse is approximately for an inlet flow rate of .
The fluid pressure measured at the middle of the tuyere nose during the experiment is shown by Figure 3. The pressure decreases when the cavity grows and increases suddenly during a collapse event. The pressure fluctuates with a period corresponding to the two successive collapses.
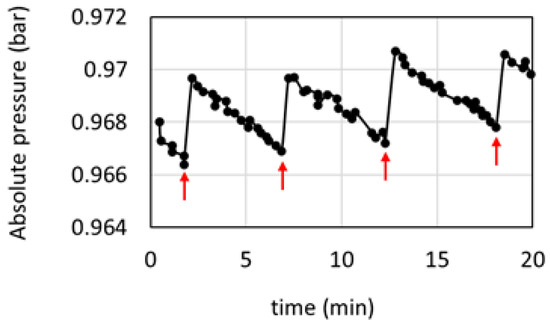
Figure 3.
Absolute pressure measurement in front of the tuyere with respect to the time. The pressure fluctuates with the occurrence of the raceway collapses. The red arrows show the moment where a collapse starts. The data are extracted from [4].
Experiments are also conducted with different flow rates ranging in [, ] for which raceway collapses have different sizes and characteristics time. The raceway length increases with the flow rate, as shown by Figure 4a. The time between two collapses, denoted , is measured in the experiment and given by Figure 4b. The time between two collapses increases with the flow rate and the cavity size is found to be larger, as expected. At a flow rate greater than approximately, a transition occurs, for which the time between two collapses further increases.
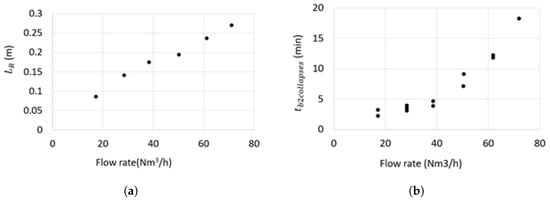
Figure 4.
(a) The raceway length (see the Figure 2a for the definition) and (b) the time between two collapses as a function of the inlet flow rate in the hot raceway experiment. The data are extracted from an experimental campaign realized at ArcelorMittal in the following of the work of [4].
3. Numerical Model Description
In this section, the granular flow model based on the discrete element model is introduced, as well as the fluid flow solver and the unresolved coupling between the fluid and particle dynamics as used by [28]. The core-size modification model of coke is also introduced.
3.1. Particle Flow Model
In the numerical simulations, the particles are considered spherical and polydisperse. The discrete element method is based on the pioneer work of [29] and available in the commercial software EDEM (version 2021). In such an approach, the contact force model is based on the overlapping of the particles. The main advantage of this approach is that it can be applied to quasi-static granular media with long and multiple contacts. The particle translational and rotational velocities are both computed with:
where is the number of particles, the mass of a particle i, the mass of the surrounding fluid contained in the particle volume , its velocity and the particle-fluid drag force, the contact force of a particle j on a particle i, its moment of inertia, particle angular velocity, and the moment generated by the contact forces exerted by a particle j on the particle i. The gravity acceleration, g, is set to . The Hertz-Mindlin model is used to calculate the normal contact force [30]. The Mindlin-Deresiewicz model [31,32] is used for computing the tangential contact force. Damping is included in both the normal and tangential contact forces [33] and is related to the coefficient of restitution. The tangential contact force is limited by Coulomb’s law for modeling the sliding.
In the results section, it will be shown that a cohesive force is required for obtaining raceway stability. It has to be emphasized that the terminology “cohesive force” does not refer to the well-known “cohesive zone” found in a blast furnace. Here, it is referring to a force attracting, or sticking, two grains together. As the actual nature of such a force is unknown, the standard Johnson-Kendall-Roberts (JKR) model [34] is used. Being available in the EDEM software, the JKR contact model is used instead of the contact model of Hertz-Mindlin to account for a sticking phenomenon. The normal component of the contact force is then replaced by the JKR force, given by
where is surface energy, and are respectively the equivalent Young’s modulus and radius, and and a stand for the interpenetration between the particles and equivalent contact radius, respectively. The JKR model is activated only when the particles reach a separation distance below defined as in (3) with . In a nutshell, the JKR model is a normal contact force that accounts for both contact and cohesive interactions. Hence, the cohesion force magnitude is a function of the surface energy , which is the main parameter controlling the cohesion strength.
3.2. CFD/DEM Model
The modeling of the granular phase by DEM is performed at the particle scale as described in the previous section, while the fluid flow is predicted using CFD. Fluid Mach number inside the raceway remaining below 0.3, the flow is incompressible. The numerical simulations are isothermal, but the density and viscosity of the fluid are set to 1600 °C corresponding to the coke flame temperature. The governing equations of the flow are obtained by carrying out an averaging method as in the TFM method [35]. In each computational cell, the following equations are solved with the commercial software FLUENT (version 2021.2):
where is the fluid volume fraction, and are respectively the fluid density and viscosity, and p are respectively the velocity and the pressure of the fluid. The particle-fluid interaction forces is the drag force exerted by the fluid on the particles contained in the fluid cell volume , using the drag law proposed by [36], which combines the correlations of [37,38]. The standard model [39] is used for modeling the turbulence in air. In each computational cell, the fluid volume fraction is computed by considering the total volume of particles having their centers of mass in the cell:
The solid volume fraction inside each cell is obtained by . The time step for solving the Equations (4) and (5), , is larger than the particle time step for integrating the particle motion governing equation, . At each fluid time step, the fluid solver calculates the velocity and pressure field of the fluid, knowing the particle data from the DEM. These forces are then transferred to the DEM solver and permitted to update the velocities and positions of the particles.
3.3. Coke Consumption Model
In a blast furnace, the formation of the raceway is directly related to coke combustion. Basically, for modeling the combustion of the coke, it is necessary to predict the transport of the chemical species and to use a combustion model for the coke for predicting the transfers of mass and of enthalpy (see example [18,40]). In the present study, the focus is on the mechanistic aspects through hydrodynamics and inter-particle contacts. Hence, the combustion of one coke particle of mass is represented by
where is the characteristic timescale of coke grain size reduction. Such a simple model does not consider the combustion of the coke accurately but only the mechanical consequences of the combustion on the size of the coke grains. The main limitation of such an approach is that the characteristic timescale of the coke reduction is imposed at the same value for all particles at any time. Whereas, in reality, it is spatially distributed due to the diffusion of air into the cavity [20]. However, this limitation should not be crucial for the stability and dynamics of the cavity. Equation (7) has to be applied only to reacting particles that are close to the tuyere where fresh air is injected and where the combustion zone actually takes place. To define the reacting particles, a reacting zone having a cylindrical shape and an imposed position of its center is defined (see Figure 5). The length of the cylinder is an imposed constant (and of the width of the pilot). For the radius in the experiment, the consumption of coke is almost constant, meaning that the cavity size increases when the particles are burned. Here, the cylinder radius is made adjustable in time according to the overall consumption rate. Hence, for each time step, the cylinder radius changes according to where is the imposed total consumption of coke in the pilot (the target value). Such a methodology allows the reactive zone to evolve with time and to keep the overall consumption rate nearly constant, as in the experiment.
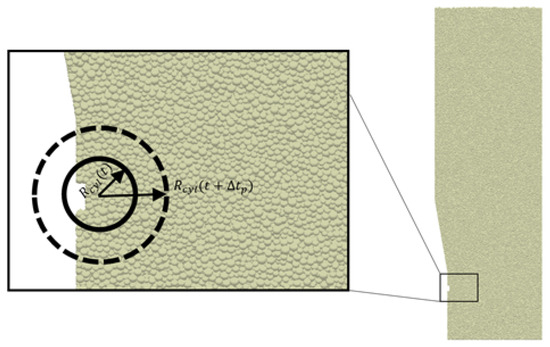
Figure 5.
Close up view of the cylindrical coke combustion model in the raceway pilot.
Preliminary tests of the coke consumption model have highlighted numerical instabilities requiring the addition of a numerical constraint. Basically, particles with a diameter smaller than are removed from the numerical simulation. This limitation allows us to prevent a bad resolution of the fine particles from the DEM. The consumption rate accounts for the fine particles that are removed from the simulation. It has been verified in the numerical simulation that the total mass of these fine particles is small enough, namely 0.001%, to not have a significant impact on the gas-particle raceway dynamics.
Finally, the model has two parameters: the characteristic time of one particle consumption, , and the global consumption of the pilot, . Practically, the consumption rate is increased by a factor of in the simulation compared to the pilot experiment in order to have a reasonable simulation time.
3.4. Parameters of Simulation and Initiation
The computational domain fits exactly the experimental one described in Section 2. A log-normal distribution with a mean diameter of and a span of 0.17 has been used to generate the granular phase, namely the coke’s grains. As in the experiments, grains with a diameter above and below have been removed. For ensuring accurate modeling of the contacts, even under high granular pressure, Young’s modulus is quite large to guarantee the assumption of a non-deformable body [41]. The particle-particle friction coefficients are identical to those in the work of [42]. The pilot walls are composed of rough refractory materials; the particle-wall friction is set to a large value of 1. As mentioned earlier, it is reasonable to model the fluid as incompressible. Therefore, the viscosity and density of the fluid are fixed to the values of air at a temperature of 1600 °C (the mean temperature in the cavity during the experiment). The investigated flow rates in the numerical simulations are in the same range as in the experiment [, ]. Overall DEM and CFD parameters of numerical simulation are given in Table 1. Approximately 200,000 coke particles are loaded only with DEM code from the top of the pilot. The fluid cell size is about , which leads to approximately 2000 hexahedral cells. Such a mesh size leads to a poor representation of the inlet jet when entering the raceway. However, it leads to a mesh size that is three times larger than the larger particle diameter. This condition ensures a good resolution of the fluid-particle interaction. It takes about one week to simulate of physical flow using 1 core (resp. 12 cores) for the CFD (resp. the DEM).

Table 1.
Fluid and particle material properties.
4. Role of Cohesive Forces in the Raceway Stability
The numerical simulations are summarized in Table 2. The cases A, B, and C have been made in order to understand if the drag force and/or the cohesive forces can balance the granular pressure. A prebuilt raceway was imposed at initiation in the cases of A and B. The cases D to I have been carried out to investigate the effect of inlet gas flow rate on the raceway dynamics.

Table 2.
Fluid flow rate and models used for the numerical simulation. As a matter of fact, when the cohesive energy is zero, then contact model is the Hertz-Mindlin.
4.1. Effect of Cohesive Forces without Coke Consumption Model
In this section, case A has been carried out with a prebuilt raceway with a size () and shape corresponding to the cavity observed in the experiment for an inlet flow rate of (Figure 4). In the numerical simulation, the raceway is imposed by adding a wall only for the granular phase, which lets the gas flow through the wall. A steady state is rapidly reached. The velocity field and magnitude are shown by Figure 6. Using air viscosity and density at 1600 °C, the flow rate being , the air velocity at the tuyere outlet is about . Fluid velocities drop quickly in the raceway, and two eddies are observed: the first, counter-clockwise, is located above the tuyere, and the second, clockwise, is below the tuyere. Particle-fluid interaction leads to a slight decrease in the granular pressure at the boundary between the cavity and the bed of the coke particle.
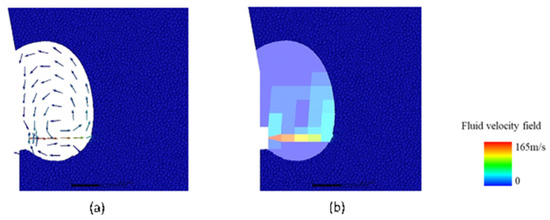
Figure 6.
Fluid velocity field inside the raceway of the CFD/DEM case A. (a) is the velocity vector and (b) the magnitude.
After that, the granular media reaches a stable state, the wall holding the grains is removed while the gas is still injected. Immediately, the granular column falls down, as shown by Figure 7. It shows that the drag and the contact forces do not balance the weight exerted by the granular column above the raceway. After the collapse, a tiny cavity is observed, as well as a clockwise and counter-clockwise motion of particles (see Figure 7). These observations are similar to those of [43].
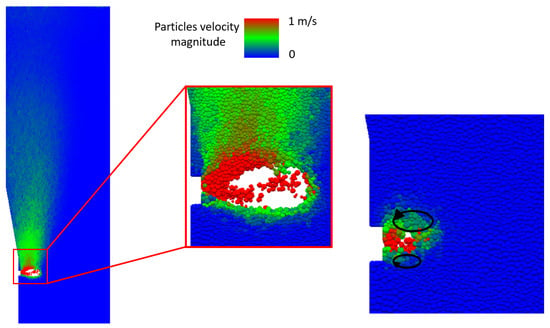
Figure 7.
Collapse of the raceway in case A when the prebuilt raceway defined by a wall for the granular phase is removed. (Left): immediately after the wall is removed and (Right): after a long time. Particles are colored with their velocity magnitude from small values in blue to higher values in red.
In case B, the initiation is identical to case A, but the JKR model is added to take into account the cohesive forces. Without taking into account the fluid, for a given surface energy =, the raceway is frozen, and the cohesion tends to stick to the particles. At a lower magnitude cohesion energy, =, the upper part of the cavity collapses vertically, as observed in experiments and shown by Figure 8. In such a case, the raceway collapsing time is of the order of the time for one particle to cross the raceway, meaning that the collapse dynamics are driven by gravity. Further numerical simulations (not shown here) allow us to understand that the greater the surface energy, the longer the collapse times. Also, using the same surface energy = and by adding the fluid flow resolution, CFD/DEM simulation results show that the cavity holds to the granular pressure (Figure 9a), meaning that together the fluid drag force and the cohesive forces can balance the granular column weight. As in the experiment, Figure 9b shows the formation of clusters, some of which are crumbling at the boundary of the cavity. These observations enforce the idea that a cohesive mechanism could act on the raceway stability.
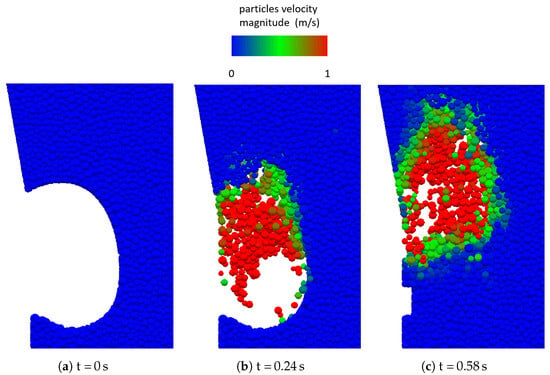
Figure 8.
Time-evolution of the collapse from the prebuilt raceway only the DEM with the JKR contact model with a cohesion energy of (case B). Particles are colored with their velocity magnitude from zero in blue to in red.
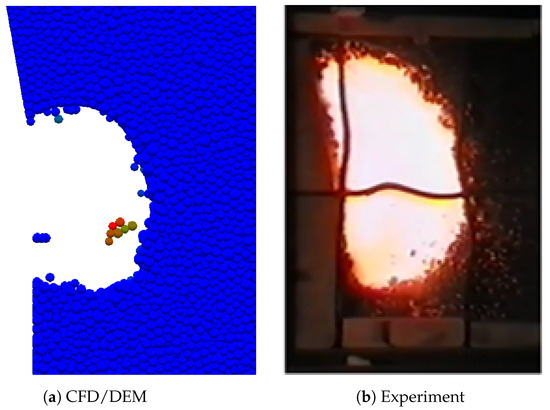
Figure 9.
Qualitative comparison of CFD/DEM with JKR cohesion model (a) and a snapshot of experiment (b). Particles are colored with their velocity magnitude from zero in blue to in red.
4.2. Raceway Dynamics by Adding Coke Consumption Model
Case C is now considered, in which the initiation of the granular phase was performed by particle rainfall in the pilot without fluid injection and no prebuilt raceway. The contact model of Hertz-Mindlin is used namely without the effect of cohesion. At time, , the coke consumption model and the CFD/DEM resolution are both activated. The particle flow is shown by Figure 10 for several times. A continuous flow of the particles without the creation of a raceway is observed.
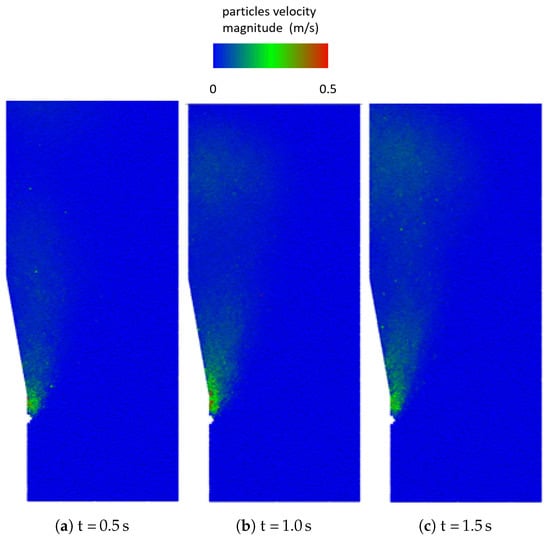
Figure 10.
Particle flow in the case C at time , and . Particles are colored with their velocity magnitude from zero in blue to in red.
Case F is similar to case C, but the JKR model is used instead of the Hertz-Mindlin contact model to account for particle-scale cohesion. Note that the coke consumption model and CFD/DEM coupling are still used. It must be noted that the cohesion forces are defined for particle-to-particle as well as for particles-to-wall below the dotted line shown by Figure 11 at time in order to mimic the local effect of the cohesion in the raceway region. case F has the same initialization of the granular phase as case C. The temporal evolution of the granular flows is shown by Figure 11. It is observed that a raceway can expand and collapse cyclically, which is in qualitative agreement with the experimental results. Also, the collapses occur in the vertical direction, as in the experiments.
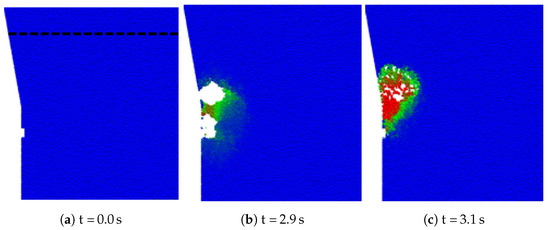
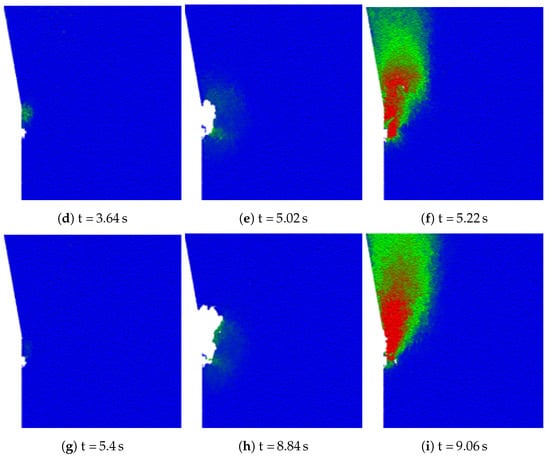
Figure 11.
Particles flow from the case F. Particles are coloured with their velocity magnitude from zero in blue to in red.
The fluid pressure measured at the injection for case F is shown by Figure 12. The fluid pressure fluctuates with a strong increase when a collapse starts in a similar manner than shown by Figure 3 from the experiment. The pressure signal also exhibits plateaus, which are due to the accumulation of particles by avalanches in front of the tuyere after a collapse has occurred.
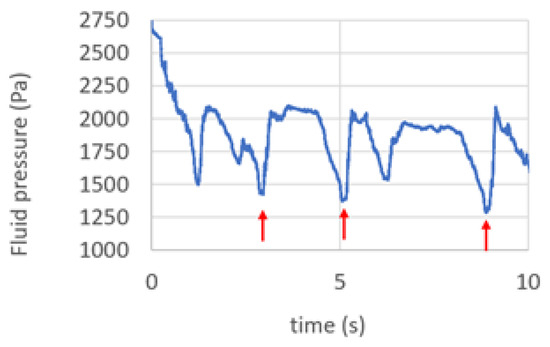
Figure 12.
Gas pressure at the tuyere nose as a function of the time in case F. Pressure fluctuations are observed with a strong increase when a collapse occurs.
The distribution of the particle interaction forces is given by Figure 13 for the three first successive collapses. One observes that the first collapse tends to decrease the contact force above the cavity since the collapse propagates to the top of the pilot. This effect is due to the initialization of the granular system, which was realized with only the DEM. The first collapse changes the inter-particle force distribution in the granular phase. One then decides not to take into account in the following analysis the first collapse, which is a peculiar one, but rather to focus on the following collapse occurrences.
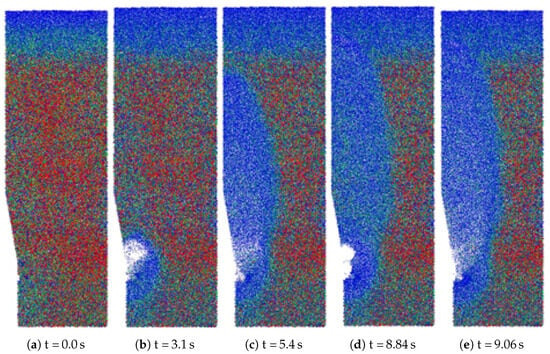
Figure 13.
Contact force distribution in simulation F for the three successive collapses. The particles are colored with the normal contact force magnitude in blue to value in red.
5. Effect of Gas Mass Flow Rate on the Raceway Shape
A parametric study on the flow rate using the CFD/DEM model, which includes cohesive forces and a coke consumption model, has been conducted. The investigated range of the flow rate is [; ] for the cases D, E, F, G, H, and I, as detailed in the Table 2. In all cases, in qualitative agreement with all the experiments, successive granular collapses have been observed. Before each collapse, the raceway length and its shape have been measured, as well as the time between two consecutive collapses. As explained in the previous section, the first collapse was excluded from the analysis. Furthermore, at a low flow rate, large bubbles can stagnate at the top of the pilot but disappear after a sufficiently long time. The data presented here only take into account the results after these events that are due to the initialization of the granular flow.
The coke consumption model being accelerated by a factor in the numerical simulation compared to reality, the time between two consecutive collapses in the CFD/DEM simulations can not be compared directly to the experimental one. The mass of the particles consumed between two consecutive collapses is defined by that have been measured in the numerical simulations and deduced also from the experimental data. The raceway length and consumed mass of coke during the collapse cycle are respectively shown by Figure 14. The prediction by Nomura’s correlation is also shown by Figure 14 in order to have a comparison with usual raceway length predictions. At a high flow rate, the raceway length measured in our simulations increases linearly with respect to the flow rates with a similar slope to those in the experiments. The offset values in the raceway length in the experiments compared to the Nomura correlation were not understood previously. The present numerical simulation results permit us to postulate that the presence of cohesive forces between coke particles and the wall might explain the deviation in the raceway length between the one from the Nomura correlation and the one obtained in the experiments. The results from the CFD/DEM simulations are surprisingly closer to the correlation at a higher flow rate. At small flow rates, the simulation results deviate from the experimental ones. In experiment, below 17, chaotic collapses of small raceways have been observed, and it was not possible to build a stable cavity. We found that, at flow rate below 35, simulated raceway length saturates to a value nearly about , which is a value close to the smaller experimental value for a stable cavity at 17. The minimal value of the raceway length obtained in our simulations is similar to the minimal value obtained in the experiment. We then postulate that the reason that may explain this deviation is that the magnitude of the cohesion value used in our simulations may be too small. Indeed, the origin and properties of the cohesion forces are not known, and a detailed study would be required to prescribe a representative cohesion model, which is out of the scope of the present paper. The consumed mass between two collapses in the simulation follows the same trend as in experiment, which is a small increase followed by a higher increase, as shown by Figure 14.

Figure 14.
Raceway length (left) and the consumed mass between two collapses (right). On the left panel, (•) corresponds to the experiments, (□) to the CFD/DEM, and the solid line is prediction by Nomura [2].
The raceway shapes observed in the numerical simulations have two types of shapes depending on the flow rate magnitude. At small flow rate, the shape of the raceway before the collapse is vertically elongated, as shown by Figure 15a. At larger flow rates, the shape evolves toward a balloon-like shape, as shown by Figure 15c. Experimental raceways for small and large flow rates are also depicted by Figure 15b and Figure 15d, respectively. It is observed that the simulated shapes with the CFD/DEM model with cohesion force and coke consumption model are in good agreement with the experimental raceway shapes in both cases, although the size magnitude is not the same, as shown by Figure 14 and previously discussed. These two types of shapes at small and large flow rates might be attributed to the effects of confinement and the particles interlocking. If the raceway length is below approximately, interlocking can play a role in the stability, whereas at a larger raceway size, the balance at the raceway interface is only a function of the cohesive forces, the weight, and the drag force. This interpretation needs to be verified with further simulations and experiments.
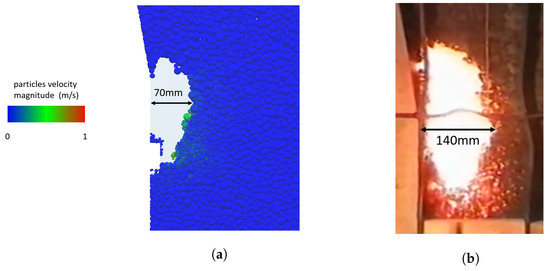
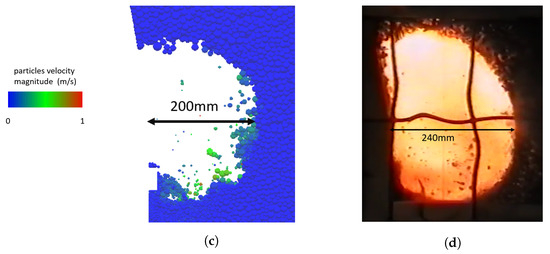
Figure 15.
Comparison of raceway shapes at small and large flow rates from CFD/DEM simulation and experiment. The particles are colored according to their velocity magnitude, from zero in blue to in red. (a) CFD/DEM simulation with at time ; (b) Experiment with ; (c) CFD/DEM simulation with at time ; (d) Experiment with .
It is known that in front of the tuyere a specific solid structure, called bird’s nest, appears in the blast furnace ([44] for a review on bird’s nest). The presence of the bird’s nest is important because it may modify the transport of air in the raceway [45] and the presence of cinder [44]. Figure 16 shows the spatial distribution of small particles (typically smaller than ) for case where the flow rate is . It can be seen that without the cohesion model, the CFD-DEM is not able to predict the bird’s nest. In contrast, the addition of the JKR model led to the formation of the bird’s nest with a shape similar to the one given by Nogami et al. [16]. More, Figure 16 shows the effect of the flow rate on the bird’s nest. As expected, the bird’s nest structure is enlarged when the flow rate is increased. The quantity of small particles is more important at the bottom of the nest than in front of the tuyere. The width of the bird’s nest is increased, meaning that small particles have migrated through the matrix made of coke.
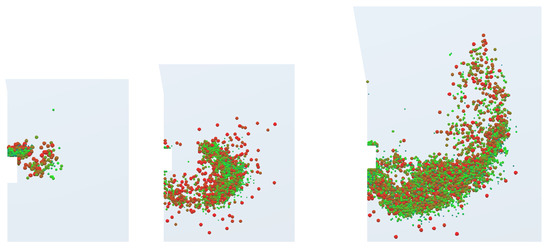
Figure 16.
Effect of cohesion model and flow rate on the distribution of small particles in front of the tuyere. On the left and middle, the flow rate is , but the left panel is without a cohesion model and the right panel has a JKR model. On the middle and right, the JKR model is enabled, but the flow rate is (middle) and (right). Left: case C at ; middle: case F at ; and right: case I at . Particles of size above are not displayed.
6. Conclusions
CFD/DEM simulations have been carried out to improve the understanding of a hot raceway pilot. The CFD/DEM model provided with a JKR cohesion model was able to reproduce the stability of a preset cavity and the vertical collapse as in the pilot experiment. The results show that a cohesive mechanism of coke exists at the raceway interface that controls the pilot raceway’s stability. Adding a coke consumption model to the CFD/DEM with the JKR cohesion model allows to simulate the dynamics of the successive collapses as observed in the experiment. The gas pressure evolution in the raceway, the time between successive collapses, and the size and shapes in the simulations are qualitatively in accordance with experiments. It has been identified that a particle-scale cohesion mechanism could control the raceway stability and dynamics at the pilot scale. The present model offers the opportunity to investigate the effect of particle size, cohesion nature and magnitude, and consumption rate on cavity dynamics. From a numerical point of view, heat transfers, gas species evolution, and mass transfers linked to coke combustion should be considered in the evolution of the present simple coke consumption model with the objective of injection optimizations for CO2 reduction. Furthermore, the nature of the cohesion mechanism must be clarified. An experiment to measure the nature and properties of cohesion should be set up to better define a particle-particle cohesion model for coke.
Author Contributions
Validation, F.R. and E.I.; investigation, F.R., E.I., and P.F.; writing-original draft preparation, F.R., E.I., and P.F.; writing-review and editing, E.I. and P.F.; supervision, E.I. and P.F.; project administration, E.I.; funding acquisition, E.I. All authors have read and agreed to the published version of the manuscript.
Funding
This work has been co-funded by ArcelorMittal and ANRT under grant CIFRE N° 2019/0266.
Data Availability Statement
Data are contained within the article.
Acknowledgments
The authors thank Olivier Simonin for fruitful discussions.
Conflicts of Interest
The authors declare no conflicts of interest.
References
- Nishi, T.; Haraguchi, H.; Miura, Y.; Sakurai, S.; Ono, K.; Kanoshima, H. Relationship between Shape of Raceway and Productivity of Blast Furnace Taking Account of Properties of Coke Sampled at Tuyere Level. Trans. Iron Steel Inst. Jpn. 1982, 22, 287–296. [Google Scholar] [CrossRef]
- Nomura, S. A simple treatment on the geometry of raceway zone. Trans. Iron Steel Inst. Jpn. 1986, 26, 107–113. [Google Scholar] [CrossRef]
- Flint, P.J.; Burgess, J.M. A fundamental study of raceway size in two dimensions. Metall. Mater. Trans. B 1992, 23, 267–283. [Google Scholar] [CrossRef]
- Danloy, G.; Lectard, E.; Blacknik, W.; Mülheims, K. Optimisation of Blast Furnace Raceway at High Injection Rates; European Commission and Directorate-General for Research and Innovation, Publications Office: Brussels, Belgium, 2005. [Google Scholar]
- Ghosh, S.; Viswanathan, N.N.; Ballal, N.B. Flow Phenomena in the Dripping Zone of Blast Furnace—A Review. Steel Res. Int. 2017, 88, 1600440. [Google Scholar] [CrossRef]
- Abhale, P.B.; Viswanathan, N.N.; Saxén, H. Numerical modelling of blast furnace—Evolution and recent trends. Miner. Process. Extr. Metall. 2020, 129, 166–183. [Google Scholar] [CrossRef]
- Yu, W.; Fede, P.; Yazdanpanah, M.; Amblard, B.; Euzenat, F.; Simonin, O. Gas-solid fluidized bed simulations using the filtered approach: Validation against pilot-scale experiments. Chem. Eng. Sci. 2020, 217, 115472. [Google Scholar] [CrossRef]
- Bennani, L.; Neau, H.; Baudry, C.; Laviéville, J.; Fede, P.; Simonin, O. Numerical Simulation of Unsteady Dense Granular Flows with Rotating Geometries. Chem. Eng. Res. Des. 2017, 120, 333–347. [Google Scholar] [CrossRef]
- Mondal, S.S.; Som, S.K.; Dash, S.K. Numerical predictions on the influences of the air blast velocity, initial bed porosity and bed height on the shape and size of raceway zone in a blast furnace. J. Phys. D Appl. Phys. 2005, 38, 1301–1307. [Google Scholar] [CrossRef]
- Rangarajan, D.; Shiozawa, T.; Shen, Y.; Curtis, J.S.; Yu, A. Influence of Operating Parameters on Raceway Properties in a Model Blast Furnace Using a Two-Fluid Model. Ind. Eng. Chem. Res. 2013, 53, 4983–4990. [Google Scholar] [CrossRef]
- Zhou, Z.; Zhu, H.; Wright, B.; Yu, A.; Zulli, P. Gas–solid flow in an ironmaking blast furnace-II: Discrete particle simulation. Powder Technol. 2011, 208, 72–85. [Google Scholar] [CrossRef]
- Bambauer, F.; Wirtz, S.; Scherer, V.; Bartusch, H. Transient DEM-CFD simulation of solid and fluid flow in a three dimensional blast furnace model. Powder Technol. 2018, 334, 53–64. [Google Scholar] [CrossRef]
- Li, X.; Pang, K.; Liang, C.; Liu, D.; Ma, J.; Chen, X. Particle attrition-breakage model for CFD-DEM simulation based on FRM and WPM: Application in blast furnace raceway. Powder Technol. 2023, 414, 118105. [Google Scholar] [CrossRef]
- Kuang, S.; Li, Z.; Yu, A. Review on Modeling and Simulation of Blast Furnace. Steel Res. Int. 2017, 89, 1700071. [Google Scholar] [CrossRef]
- Roeplal, R.; Pang, Y.; Adema, A.; van der Stel, J.; Schott, D. Modelling of phenomena affecting blast furnace burden permeability using the Discrete Element Method (DEM)—A review. Powder Technol. 2023, 415, 118161. [Google Scholar] [CrossRef]
- Nogami, H.; Yamaoka, H.; Takatani, K. Raceway Design for the Innovative Blast Furnace. ISIJ Int. 2004, 44, 2150–2158. [Google Scholar] [CrossRef]
- Wang, S.; Shen, Y. CFD-DEM modelling of raceway dynamics and coke combustion in an ironmaking blast furnace. Fuel 2021, 302, 121167. [Google Scholar] [CrossRef]
- Dianyu, E.; Zhou, P.; Guo, S.; Zeng, J.; Xu, Q.; Guo, L.; Hou, Q.; Yu, A. Particle-scale study of coke combustion in the raceway of an ironmaking blast furnace. Fuel 2022, 311, 122490. [Google Scholar]
- E, D.; Zhou, P.; Ji, L.; Cui, J.; Xu, Q.; Guo, L.; Yu, A. Particle-scale modelling of injected hydrogen and coke co-combustion in the raceway of an ironmaking blast furnace. Fuel 2023, 336, 126778. [Google Scholar] [CrossRef]
- Wei, G.; Zhang, H.; An, X.; Xiong, B.; Jiang, S. CFD-DEM study on heat transfer characteristics and microstructure of the blast furnace raceway with ellipsoidal particles. Powder Technol. 2019, 346, 350–362. [Google Scholar] [CrossRef]
- Wei, G.; Zhang, H.; An, X.; Jiang, S. Influence of particle shape on microstructure and heat transfer characteristics in blast furnace raceway with CFD-DEM approach. Powder Technol. 2020, 361, 283–296. [Google Scholar] [CrossRef]
- Wei, G.; Zhang, H.; An, X.; Hou, Q. Effect of particle shape on raceway size and pressure drop in a blast furnace: Experimental, numerical and theoretical analyses. Adv. Powder Technol. 2022, 33, 103455. [Google Scholar] [CrossRef]
- Aminnia, N.; Adhav, P.; Darlik, F.; Mashhood, M.; Saraei, S.H.; Besseron, X.; Peters, B. Three-dimensional CFD-DEM simulation of raceway transport phenomena in a blast furnace. Fuel 2023, 334, 126574. [Google Scholar] [CrossRef]
- Cui, J.; Hou, Q.; Shen, Y. CFD-DEM study of coke combustion in the raceway cavity of an ironmaking blast furnace. Powder Technol. 2020, 362, 539–549. [Google Scholar] [CrossRef]
- Umekage, T.; Yuu, S.; Kadowaki, M. Numerical Simulation of Blast Furnace Raceway Depth and Height, and Effect of Wall Cohesive Matter on Gas and Coke Particle Flows. ISIJ Int. 2005, 45, 1416–1425. [Google Scholar] [CrossRef]
- Xu, D.; Wang, S.; Shen, Y. An improved CFD-DEM modelling of raceway dynamics and coke combustion in an industrial-scale blast furnace. Chem. Eng. J. 2023, 455, 140677. [Google Scholar] [CrossRef]
- Xu, D.; Wang, S.; Shen, Y. Numerical investigation of the reacting flows of three adjunct raceways in an industrial-scale blast furnace. Fuel 2023, 354, 129339. [Google Scholar] [CrossRef]
- Romano, F.; Izard, E.; Fede, P. Toward CFD-DEM simulations of the blast furnace raceway. In Proceedings of the VII International Conference on Particle-based Methods (PARTICLES 2021), Hamburg, Germany, 4–6 October 2021; CIMNE: Catalonia, Spain, 2021. [Google Scholar] [CrossRef]
- Cundall, P.A.; Strack, O.D.L. A discrete numerical model for granular assemblies. Géotechnique 1979, 29, 47–65. [Google Scholar] [CrossRef]
- Hertz, H. On the Contact of Elastic Solids. Crelle’s J. 1881, 92, 156–171. [Google Scholar]
- Mindlin, R.D. Compliance of Elastic Bodies in Contact. J. Appl. Mech. 1949, 16, 259–268. [Google Scholar] [CrossRef]
- Mindlin, R.D.; Deresiewicz, H. Elastic Spheres in Contact Under Varying Oblique Forces. J. Appl. Mech. 1953, 20, 327–344. [Google Scholar] [CrossRef]
- Tsuji, Y.; Tanaka, T.; Ishida, T. Lagrangian numerical simulation of plug flow of cohesionless particles in a horizontal pipe. Powder Technol. 1992, 71, 239–250. [Google Scholar] [CrossRef]
- Johnson, K.; Kendall, K.; Roberts, A. Surface energy and the contact of elastic solids. Proc. R. Soc. Lond. A Math. Phys. Sci. 1971, 324, 301–313. [Google Scholar] [CrossRef]
- Anderson, T.B.; Jackson, R. Fluid Mechanical Description of Fluidized Beds. Equations of Motion. Ind. Eng. Chem. Fundam. 1967, 6, 527–539. [Google Scholar] [CrossRef]
- Gobin, A.; Neau, H.; Simonin, O.; Llinas, J.R.; Reiling, V.; Sélo, J.L. Fluid dynamic numerical simulation of a gas phase polymerization reactor. Int. J. Numer. Methods Fluids 2003, 43, 1199–1220. [Google Scholar] [CrossRef]
- Wen, Y.; Yu, Y. Mechanics of Fluidization. Chem. Eng. Symp. Ser. 1965, 62, 100–111. [Google Scholar]
- Ergun, S. Fluid flow through packed columns. Chem. Eng. Prog. 1952, 48, 89–94. [Google Scholar]
- Nallasamy, M. Turbulence models and their applications to the prediction of internal flows: A review. Comput. Fluids 1987, 15, 151–194. [Google Scholar] [CrossRef]
- Ren, Y.; Mahinpey, N.; Freitag, N. Kinetic model for the combustion of coke derived at different coking temperatures. Energy Fuels 2007, 21, 82–87. [Google Scholar] [CrossRef]
- Agnolin, I.; Roux, J.N. Internal states of model isotropic granular packings. II. Compression and pressure cycles. Phys. Rev. E 2007, 76, 061303. [Google Scholar] [CrossRef]
- Miao, Z.; Zhou, Z.; Yu, A.; Shen, Y. CFD-DEM simulation of raceway formation in an ironmaking blast furnace. Powder Technol. 2017, 314, 542–549. [Google Scholar] [CrossRef]
- Hilton, J.; Cleary, P. Raceway formation in laterally gas-driven particle beds. Chem. Eng. Sci. 2012, 80, 306–316. [Google Scholar] [CrossRef]
- Zong, Y.; Guo, Z.; Zhang, J.; Liu, Y.; Wang, C.; Xiao, Z.; Zhang, Y.; Jiao, K. Formation and modification of cinder in tuyere bird’s nest area of blast furnace: A review. Fuel 2024, 358, 130236. [Google Scholar] [CrossRef]
- Shen, Y.; Shiozawa, T.; Austin, P.; Yu, A. Model study of the effect of bird’s nest on transport phenomena in the raceway of an ironmaking blast furnace. Miner. Eng. 2014, 63, 91–99. [Google Scholar] [CrossRef]
Disclaimer/Publisher’s Note: The statements, opinions and data contained in all publications are solely those of the individual author(s) and contributor(s) and not of MDPI and/or the editor(s). MDPI and/or the editor(s) disclaim responsibility for any injury to people or property resulting from any ideas, methods, instructions or products referred to in the content. |
© 2024 by the authors. Licensee MDPI, Basel, Switzerland. This article is an open access article distributed under the terms and conditions of the Creative Commons Attribution (CC BY) license (https://creativecommons.org/licenses/by/4.0/).