Article

Research on the Scaling Mechanism and Countermeasures of Tight Sandstone Gas Reservoirs Based on Machine Learning

1
College of Petroleum Engineering, Xi’an Shiyou University, Xi’an 710065, China
2
Department of Chemical and Petroleum Engineering, University of Calgary, Calgary, AB T2N 2N4, Canada
*
Authors to whom correspondence should be addressed.
Processes 2024, 12(3), 527; https://doi.org/10.3390/pr12030527
Submission received: 15 January 2024 / Revised: 2 March 2024 / Accepted: 5 March 2024 / Published: 6 March 2024
(This article belongs to the Special Issue Advances in Enhancing Unconventional Oil/Gas Recovery)

Abstract

:
The Sulige gas field is a typical “three lows” (low permeability, low pressure, and low abundance) tight sandstone gas reservoir, with formation pressures often characterized by abnormally high or low pressures. The complex geological features of the reservoir further deviate from conventional understanding, impacting the effective implementation of wellbore blockage removal measures. Therefore, it is imperative to establish the wellbore blockage mechanism, prediction model, and effective prevention measures for the target area. In this study, based on field data, we first experimentally analyzed the water quality and types of blockage in the target area. Subsequently, utilizing a BP neural network model, we established a model for predicting the risk of wellbore blockage and analyzing mitigation measures in the target reservoir. The model’s prediction results, consistent with on-site actual results, demonstrate its reliability and accuracy. Experimental results show that the water quality in the target area is mainly a CaCl2 type, and the predominant scales produced are CaCO3 and BaSO4. Model calculations reveal that temperature, pressure, and ion concentration all influence scaling, with BaSO4 more influenced by pressure and CaCO3 more influenced by temperature. Under the combined effect of temperature, pressure, and ion concentration, different types of scales exhibit distinct trends in scaling quantity. Combining scaling quantity calculations with wellbore contraction ratios, it was found that when the temperature, pressure, and ion concentration are within a certain range, the wellbore contraction rate can be controlled below 4%. At this point, the wellbore scaling risk is minimal, and preventive measures against wellbore scaling can be achieved by adjusting production systems, considering practical production conditions. This study investigates the mechanism of scaling in wellbores of tight sandstone gas reservoirs and proposes a cost-effective scaling prevention measure. This approach can guide the prediction of scaling risks and the implementation of scaling prevention measures for gas wells in tight sandstone reservoirs.

1. Introduction

As exploration and development practices in unconventional reservoirs such as shale and tight sandstones continue to deepen, many limitations and characteristics inconsistent with actual geological conditions have been exposed in traditional geological understanding. Consequently, numerous scholars have conducted extensive research on how to improve the recovery factor of such reservoirs. This includes studying the relationship between pores and fluids from a nanoscale perspective [1,2], researching enhanced oil recovery methods [3], and reservoir modification through hydraulic fracturing [4], among other approaches. The Sulige gas field is a typical “three lows” gas field, characterized by low permeability, low pressure, and low abundance. The reservoir properties are poor, belonging to low porosity and low permeability sandstone lithology gas reservoirs. This makes the problem of wellbore plugging particularly prominent in the Sulige gas field, especially due to changes in reservoir pressure, physical properties, and lithological characteristics. These changes result in production conditions in the wellbore of gas wells in the target area being different from those of conventional gas wells. Traditional scale and corrosion control measures cannot be effectively applied to the target block.
The target block is located in the northern slope of the Shaanbei area of the Ordos Basin in China, characterized by a monocline structure trending high in the northeast and low in the southwest. The Upper Paleozoic strata in the area consist of the Permian and Carboniferous formations, including the Shi’qianfeng Formation, Shi’hezi Formation, Shanxi Formation, and Taiyuan Formation of the Permian, while the Carboniferous is predominantly represented by the Benxi Formation. The primary producing reservoir in the target block is currently the Shan 1 Member of the Shanxi Formation, with the upper reservoir being the Shi’hezi Formation and the lower reservoir being the Taiyuan Formation. Currently, the Shanxi Formation in the research block is subdivided into the Shan 1 Member and the Shan 2 Member, with the latter representing lacustrine deposits, mainly characterized by marginal shallow lake sedimentation. The Shan 1 Member primarily consists of delta-front deposits, subdivided into subaqueous distributary channels and subaqueous distributary bay microfacies. The lithology is dominated by dark gray mudstone and light gray sandstone.
The target block’s formation water exhibits elevated concentrations of scale-forming ions. Additionally, the corrosion and deformation of wellbores in these production wells, coupled with frequent downhole operations, result in a significant proportion of workover fluids being retained on the inner walls of the wellbore, leading to complex wellbore conditions. Under the complex conditions in the wellbore, these scaling ions form insoluble scale deposits, leading to wellbore blockages and causing significant losses [5]. Conventional methods to address scaling issues mainly involve chemical means to delay or prevent the formation of scale deposits [6,7,8,9,10,11], or using mechanical methods to remove scaling deposits from the pipe walls [12]. The target block once employed a detoxifier primarily composed of organic sulfonic acid. Three years into production, trace amounts (0.001 mg/L) of organic sulfonic acid were detected in groundwater quality tests, posing significant health risks to the local residents and causing environmental damage. Consequently, it is imperative to grasp the intricacies of scaling and blockage mechanisms within the Sulige gas field, scrutinize the reasons behind scaling, and devise anti-scaling measures that safeguard the environment while curbing costs.
Over the years, numerous scholars have conducted in-depth research and analysis on scaling issues. The earliest study on scaling prediction was the saturation index method proposed by Langelier [13] in 1936. This method primarily relies on the principles of dissolution equilibrium theory to calculate the pH of the solution, thereby determining the tendency for scale formation. As development progresses, the underground water systems faced by oil wells become increasingly complex. Furthermore, with the deepening of the wells, the bottom temperatures continue to rise, amplifying the impact of temperature on scaling. Engineers have gradually become aware of this issue. Therefore, Davis and Stiff [14], as well as Ryznar [15], based on the saturation index method, made certain innovations and breakthroughs, mainly by introducing correction coefficients K, ionic strength, alkalinity, and other parameters to assess scaling trends. This made the method consistent with the development conditions of oil fields at that time. Skillman [16] used the thermodynamic solubility method to predict the scaling tendency of calcium sulfate. Although the prediction results were generally consistent with the actual site conditions, the method had limitations due to the lack of consideration of pressure and other equilibrium effects. By 1994, Oddo and Tomson [17] integrated thermodynamics, ionic strength, solubility product, and ion association factors based on the saturation index theory and proposed the Oddo–Tomson saturation index method. They used different equations for situations with and without a gas phase, making it one of the most widely applied models. However, as oil and gas field development progressed, and with breakthroughs in theory and technology, more scholars tended to use complex mathematical models to describe scaling issues and solve them using computers. For instance, Hasson et al. [18,19] studied the formation of CaCO3 scale samples and established an ion diffusion model considering ion concentration, temperature, and pressure. However, this model only considered crystalline scale and did not account for particulate scale. Brahim et al. [20] considered the heat and mass transfer processes in the system based on the Ker–Seanton differential equation model and established a mathematical model for CaSO4 scaling on the inner wall of a rectangular cross-section. Xiaoxi Yang et al. [21] established a model for predicting CaCO3 scaling based on the sediment removal rate calculation model, considering fluid flow and heat transfer between the fluid and the wall surface. However, this model did not consider changes in wellhead pressure and wellbore diameter under the influence of scaling. Liang Z et al. [22] developed a mathematical model considering holdup ratio and developed corresponding software for scaling prediction. The aforementioned scholars provided excellent predictions and solutions for scaling issues, but complex theoretical models struggle to promptly adapt to increasingly complex oil field production conditions. With the continuous expansion of oil field scale and technological development, a vast amount of data is generated. Machine learning has shown great advantages in processing and utilizing data. Therefore, an increasing number of scholars are exploring how to leverage machine learning to fully utilize the massive amount of data from oil fields to address the increasingly complex on-site production conditions. Researchers such as Zhao [23], Gabetta, G. [24], Paulo A. Paz [25], Wang [26], and Bruno X. Ferreira [27] have integrated machine learning into scaling considerations and achieved significant results.
Due to the fact that BP neural networks do not require predefined mathematical equations for the mapping relationship between inputs and outputs and instead learn certain rules through training to obtain results closest to the expected output when given input values, this study is based on BP neural networks to investigate scaling problems in a block of wells in the Sulige gas field. Data from 93 wells were gathered and structured, with data from 89 wells serving as training data and the remaining four sets reserved as a validation dataset. A neural network was trained utilizing the compiled data, and an algorithm was formulated to scrutinize the distribution of major scaling anions (SO42− and HCO3) and major scaling cations (Ca2+ and Ba2+) across various temperatures and pressures. Furthermore, the fluctuation of contraction ratio under diverse input parameters was examined, and ranges of input parameters capable of keeping the contraction ratio near or below 4% were outlined. This can aid in forecasting scaling risks and devising on-site scaling prevention strategies.

2. Data Collection

On-site deposits generally consist of sulfides, oxides, sulfates, and carbonates [28]. However, not all deposits occur in oil and gas fields; it depends on geological conditions, including parameters such as formation water quality, temperature, and pressure in the formation and wellbore. Calcium carbonate scale is the most common type of deposit and is typically widespread in production facilities such as surface pipelines and oil tubing [29].
The study area is a specific block within the Sulige gas field, with a burial depth ranging from 3500 m to 4160 m and a geothermal gradient of 3 °C/100 m. The formation water in this area is characterized by a CaCl2 type, exhibiting higher production water yields in the central part and lower yields in the surrounding areas. The average salinity is 49,708.68 mg/L, with the highest salinity recorded at 93,306.86 mg/L. The entire block produces an average daily gas output of 237 × 104 m3/d and a daily water production of 650 m3/d. The water–gas ratio is high, measuring 2.74 m3/104 m3 (The typical water-to-gas ratio in the block is around 0.1 m3/104 m3). The pH of the formation water ranges between 6.2 and 6.5. Table 1 presents the results of the formation water quality analysis in the study block. (Data from 118 wells have been compiled for statistical analysis.)
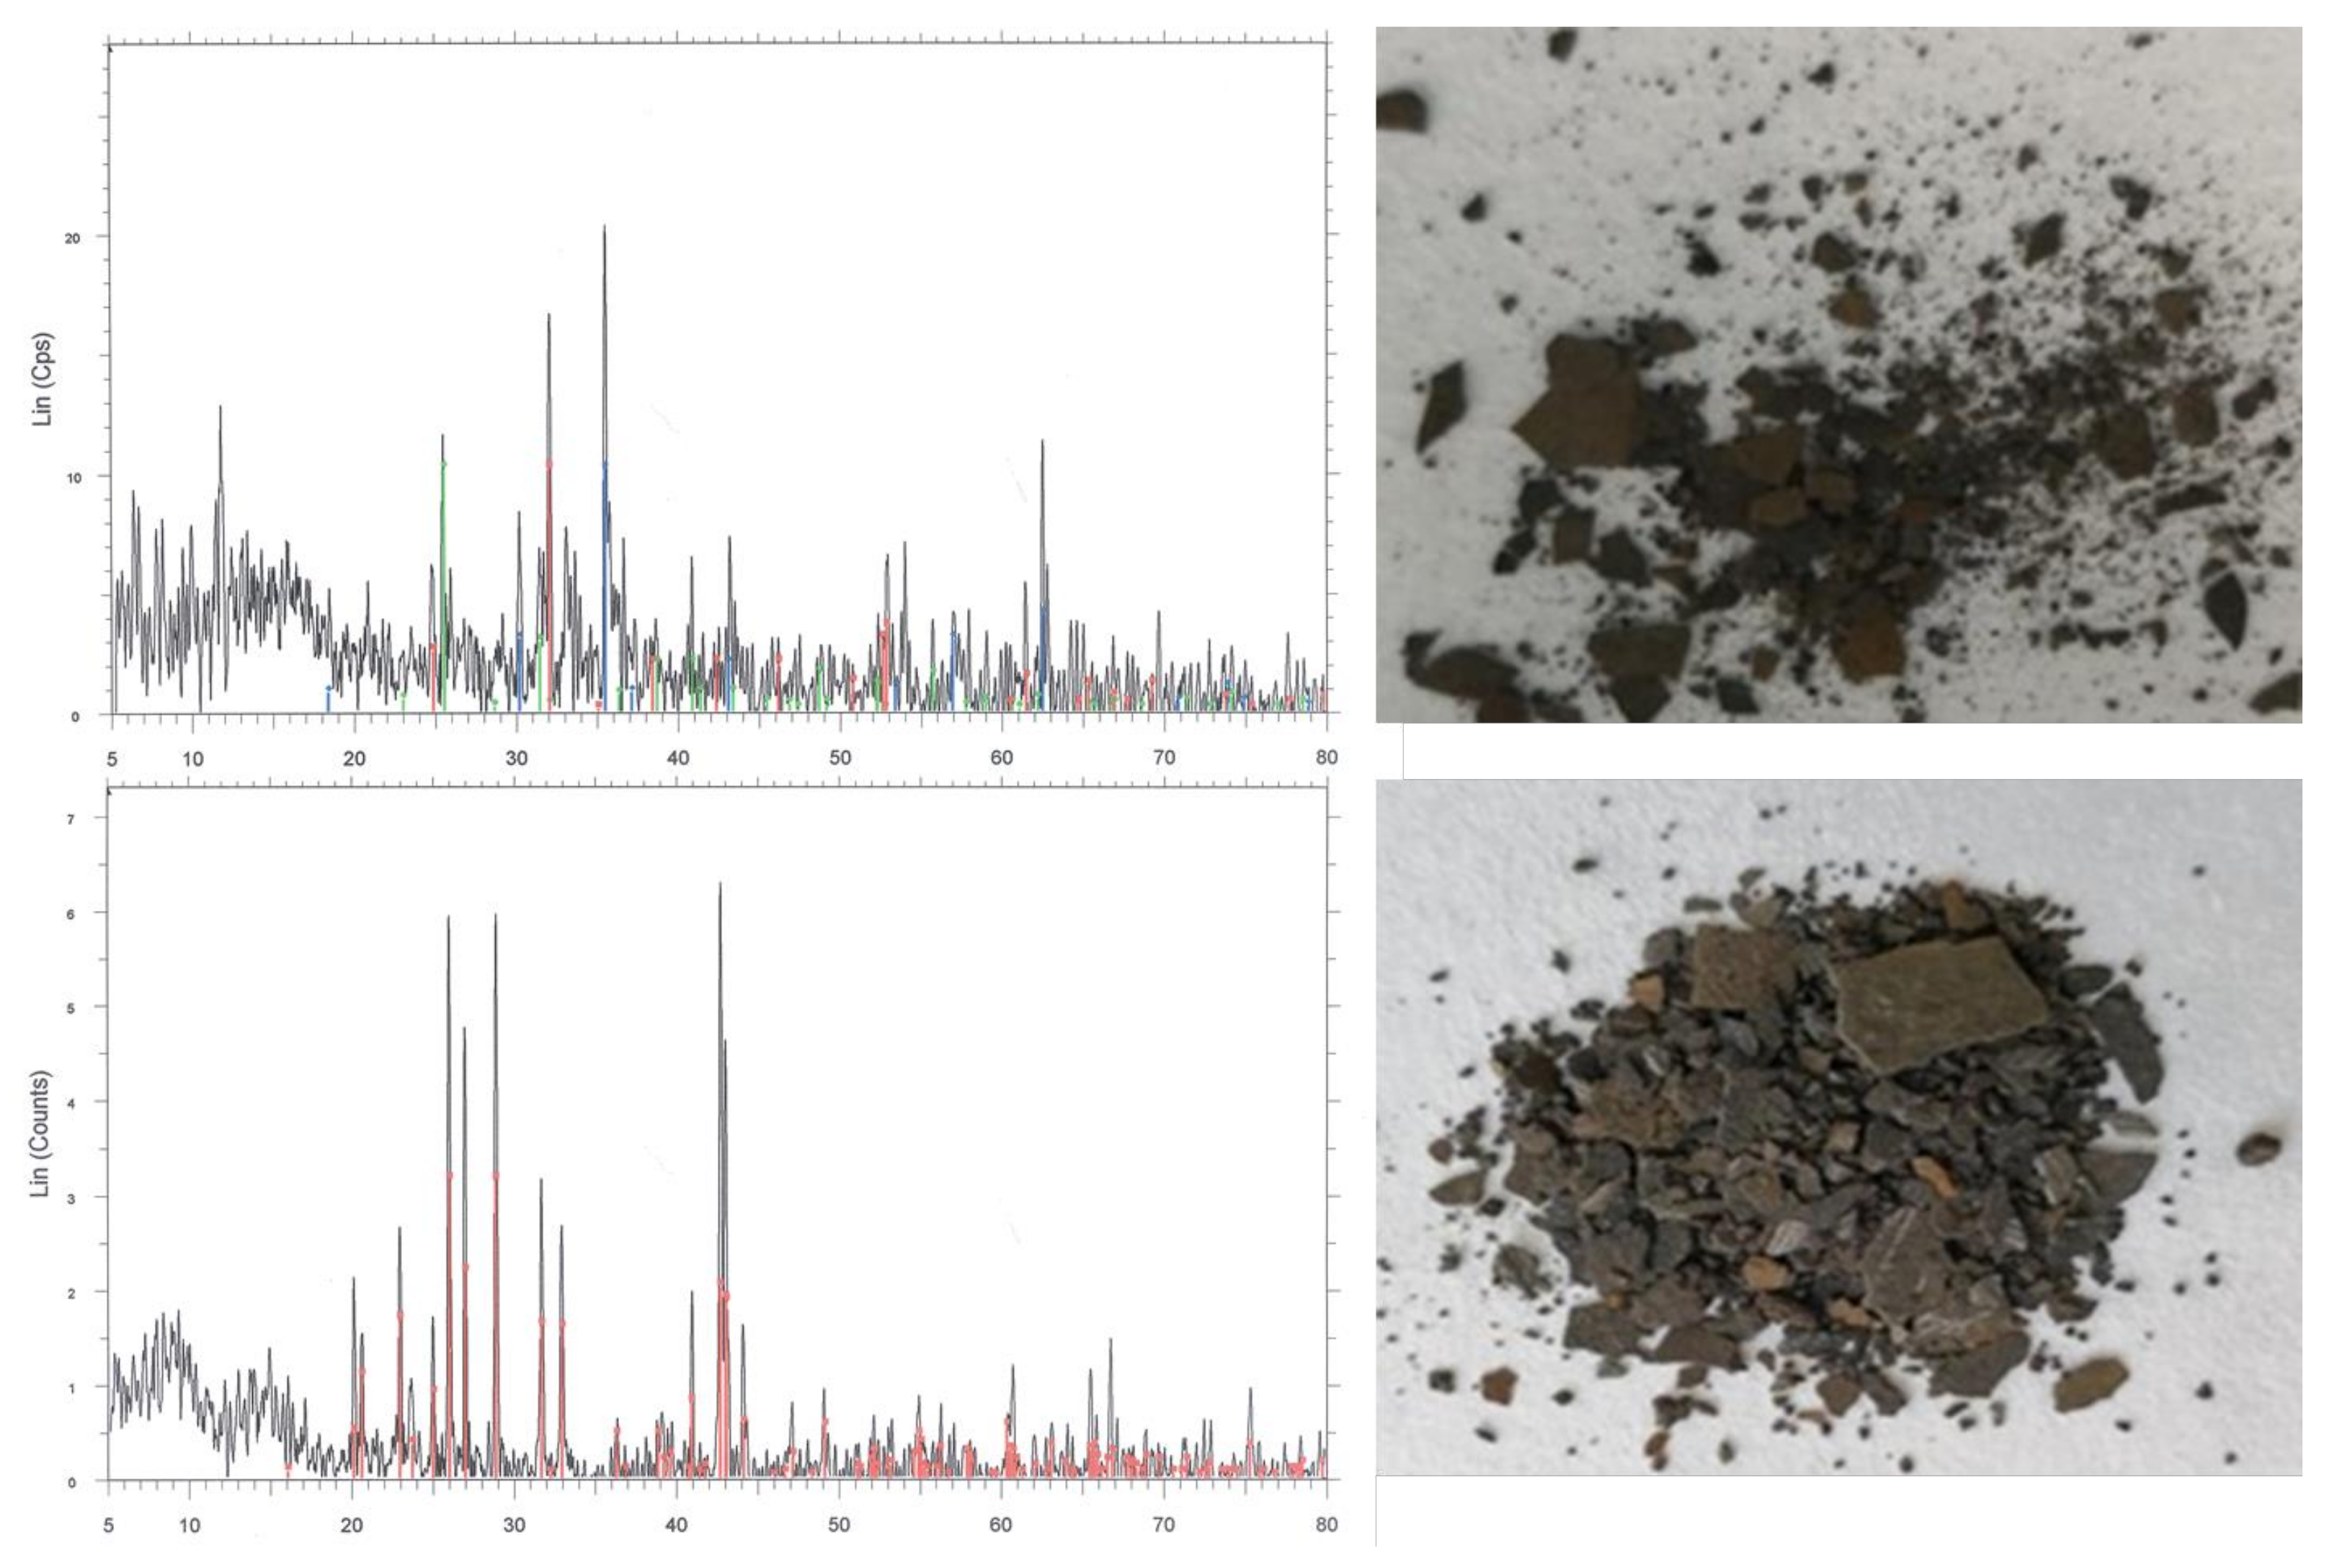
Analysis of the blockage material composition unveiled that around 20% of the blockage comprises water and organic compounds (refer to Table 2), while the remaining 80% comprises inorganic materials. Among the organic compounds, hydrocarbons make up a minimal percentage, accounting for only 3%. Preliminary conclusions indicate that the primary culprit behind wellbore blockage is the buildup of inorganic scale deposits. Analysis of scale samples from five gas wells using a D/MAX-2400 X-ray diffractometer from Rigaku Corporation, Japan, indicates that the predominant scales in the study area are CaCO3 and BaSO4 (Table 3). Figure 1 displays partial scale samples from the wellbore along with their X-ray diffraction patterns (Red represents Barite (The image above) and Siderite (The image below), blue represents Magnetite, and green represents Anhydrite).
The scaling issue in gas wells has been extensively studied by numerous scholars. Currently, a well-established understanding of the influencing factors on scaling includes pressure, temperature, scaling ion concentration, pH, and flow velocity. However, in the study block, the gas wells exhibit high production rates (237 × 104 m3/d) and high gas flow velocities (9.8 m/s). In fact, determining flow velocity is not easy. Considering that the basic process of scaling involves deposition and detachment of scale, we introduce the attachment coefficient to comprehensively consider both aspects. This essentially translates the factor of flow velocity into the selection of the attachment coefficient (further explained in subsequent sections), hence neglecting the influence of flow velocity. Additionally, the pH of the formation water in the study area remains stable between 6.2 and 6.5. Therefore, this study disregards the influences of flow velocity and pH on scaling.
In this study, data from 118 wells were collected, and after processing, data from 93 wells were deemed usable. The data were obtained through on-site experiments of formation water. The experiments utilized high-temperature and high-pressure reaction vessels to simulate downhole temperature and pressure, allowing for thorough scaling of the vessel’s formation water. The total scale deposition was calculated by measuring the change in concentration of scaling ions in the formation water before and after titration of the scale. The specific experimental steps are as follows: (1) A certain amount of formation water was taken according to the experimental requirements and filtered to remove solid-phase impurities; (2) The concentration of scaling ions (SO42−, HCO3, Ca2+, and Ba2+) was determined using ion titration; (3) The processed formation water was introduced into the reaction vessel, vacuum was applied, methane was added to the designed pressure, and the reaction vessel was placed in a constant temperature chamber to maintain the design temperature for 24 h to allow for thorough scaling of the formation water; (4) The reaction vessel was opened, and the formation water was filtered. The concentration of scaling ions (SO42−, HCO3, Ca2+, and Ba2+) in the filtered formation water was determined using titration. Each experiment was conducted three times and the average value was taken. The total scale deposition was calculated based on the difference in ion concentration before and after the reaction. Each well’s formation water sample in the target block underwent the above steps to conduct experiments and obtain the necessary data for final simulation. Table 4 presents part of the acquired data.
In the end, data from 118 wells were collected on-site. After sorting, data from 93 wells were deemed suitable for training the neural network. Four wells’ data were reserved as a validation dataset for the network, and the remaining data were utilized for the neural network training. Some of the training data are presented in Table 4.

3. Construction of BP Neural Network Model

3.1. Neural Network Model Theory

Artificial Neural Networks (ANNs) are systems designed to replicate the synaptic structure of biological neural networks in terms of information processing. By imitating the connections between neurons and their synaptic weights, akin to the neural pathways in the human brain, these networks possess the capability to filter, analyze, learn, and make decisions regarding information. Among them, the backpropagation (BP) neural network utilizes various gradient descent theories. It iteratively adjusts the weights and bias parameters of network nodes via backpropagation using the chain rule, aiming to minimize the network’s mean square error [30]. Leveraging these principles, this paper constructs a BP neural network to simulate the evolving patterns of wellbore scale formation induced by various factors.

3.2. Model Construction

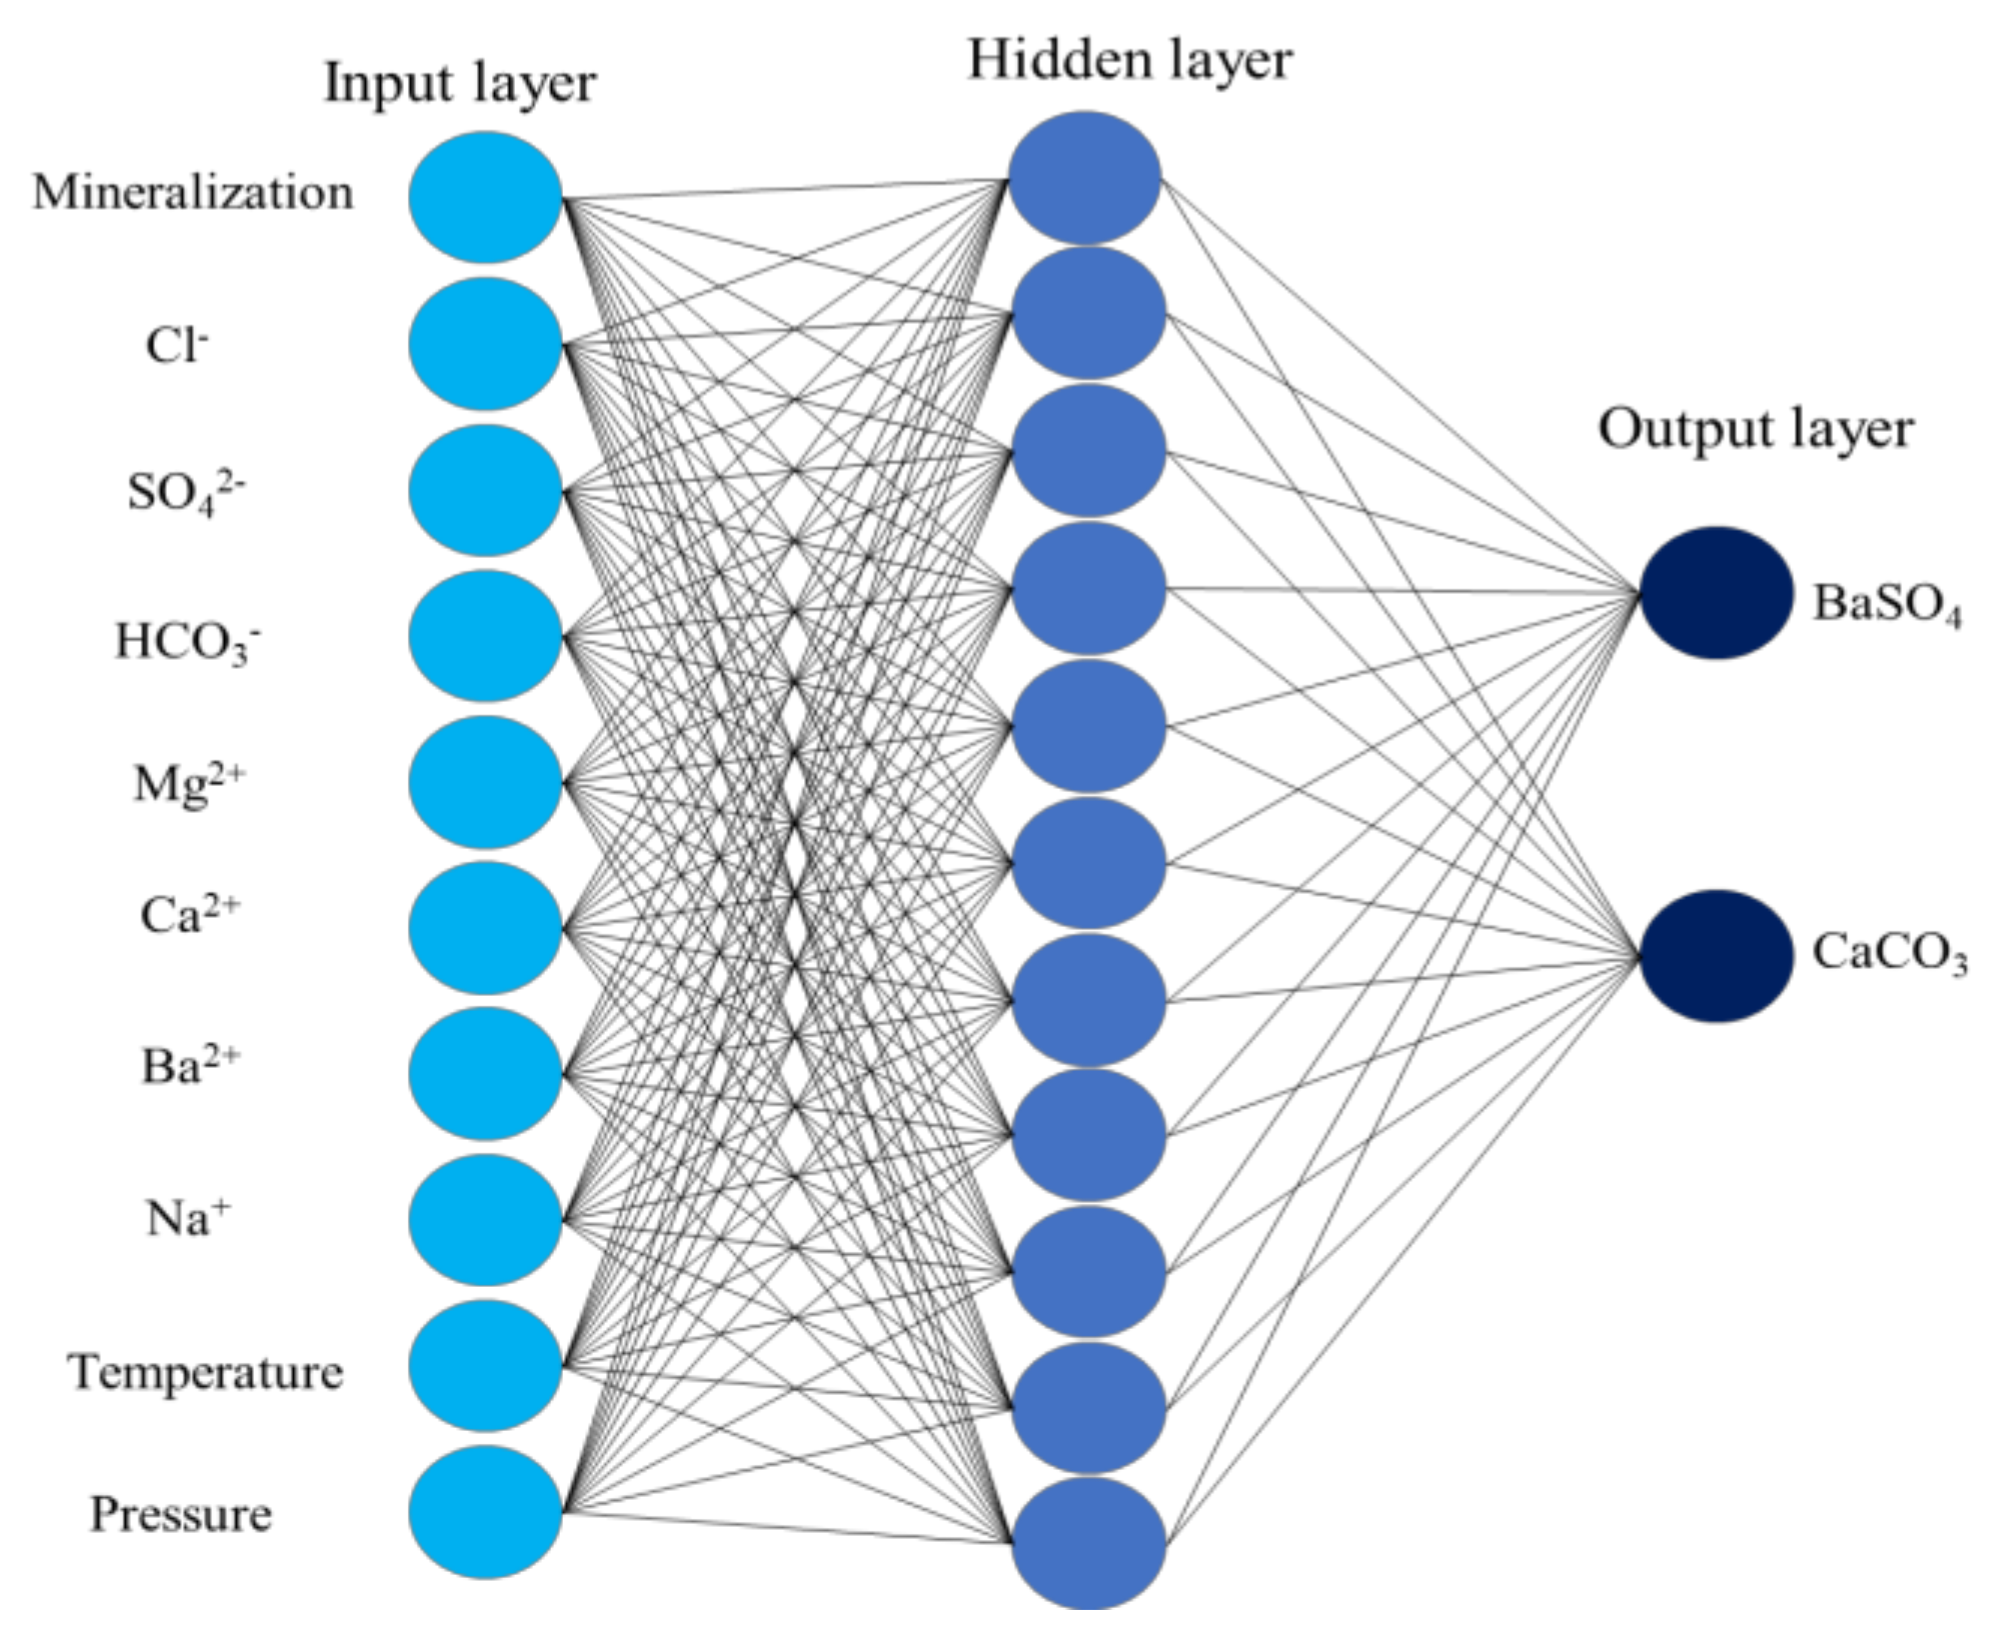
The factors influencing wellbore scale formation, including Cl, SO42−, HCO3, Mg2+, Ca2+, Ba2+, Na+, salinity, temperature, and pressure, are considered as the input layer of the neural network. The output layer consists of CaCO3 and BaSO4 scale quantities. Through comparative calculations, it was determined that the model achieved satisfactory accuracy with 11 hidden layers. The final constructed neural network structure is illustrated in Figure 2.
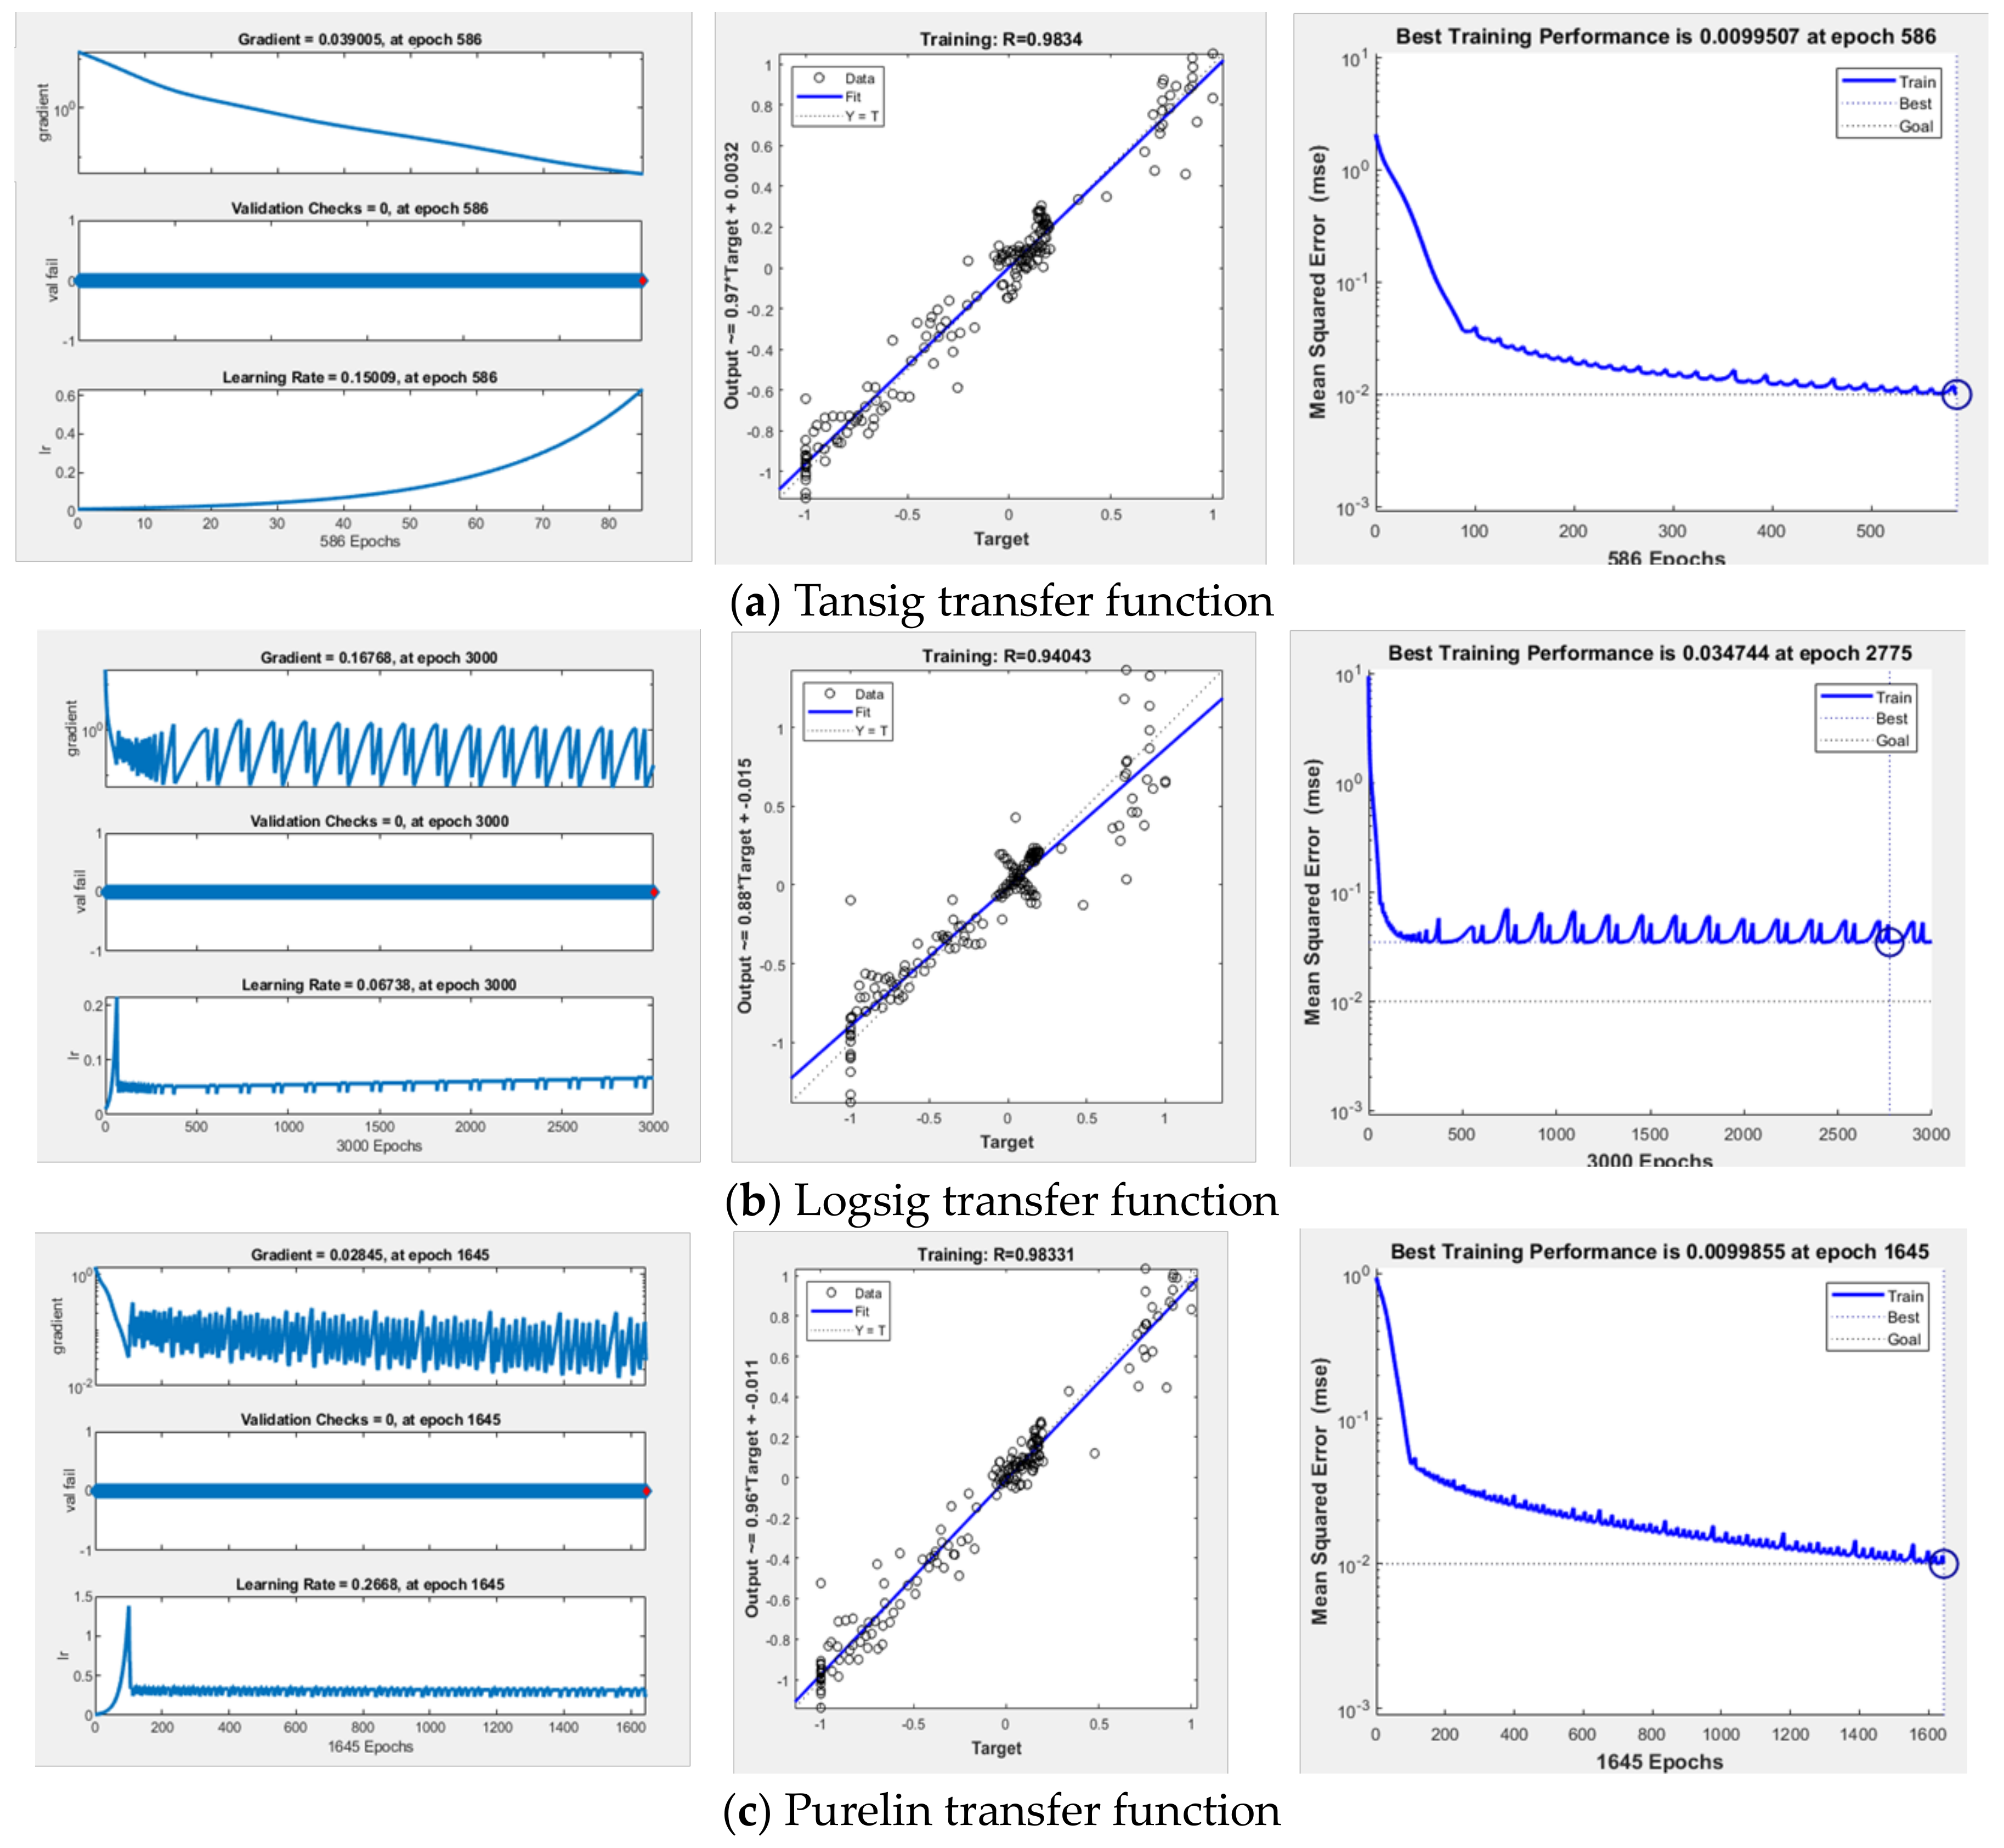
Using the data collected from the field, the neural network was trained, and four sets of test data were reserved to verify the model’s reliability. The learning rate of the model was set to 0.05, with an error threshold of 0.01, and the iteration step was set to 3000. Three commonly used transfer functions in BP neural networks are logsig, tansig, and purelin. The logsig function allows input values to range arbitrarily while constraining output values between 0 and 1. Tansig permits input values of any magnitude, mapping them to an output range between −1 and +1. The linear transfer function, purelin, accommodates arbitrary input and output values. Considering the specifics of the problem domain, this study opted for purelin as the transfer function for the output layer. Furthermore, we investigated the adaptability of these three transfer functions to the training data for the output layer, contrasting the computational accuracy of the models under each function. The operational outcomes of the model are depicted in the Figure 3. Under the purelin transfer function, the training efficiency of the model was relatively poor; although the fitting coefficient reached 0.983, gradient convergence proved elusive. In the case of the logsig transfer function, the fitting degree reached 0.94, yet both gradient and error failed to converge, exhibiting divergence. However, with the tansig transfer function, the model achieved a fitting degree of 0.9834, with gradients and errors gradually converging towards their minimum values (Figure 3).

3.3. Model Verification

To assess the accuracy and reliability of the model, four sets of data were set aside from the compiled dataset of 93 wells for both training and validation purposes. The input layer of the validation dataset was then supplied to the well-trained network for computations, yielding the predicted outcomes. Using neural networks trained with the three transfer functions, calculations were performed on reserved validation data. Simultaneously, under identical conditions, the scale buildup was computed using the commercial software OLI ScaleChem (V4.0.3). The final results are presented in Table 5. It is evident that under the tansig transfer function, the model’s computed results exhibited the highest correlation coefficient with the experimental results, reaching 0.9982. For the logsig transfer function, the correlation coefficient was 0.7112, while for the purelin transfer function, it was 0.8405. The correlation coefficient between the results obtained from the commercial software and the experimental values was 0.9891. Hence, it can be concluded that the model based on the tansig function yielded the most accurate computational results.

4. Result Analysis

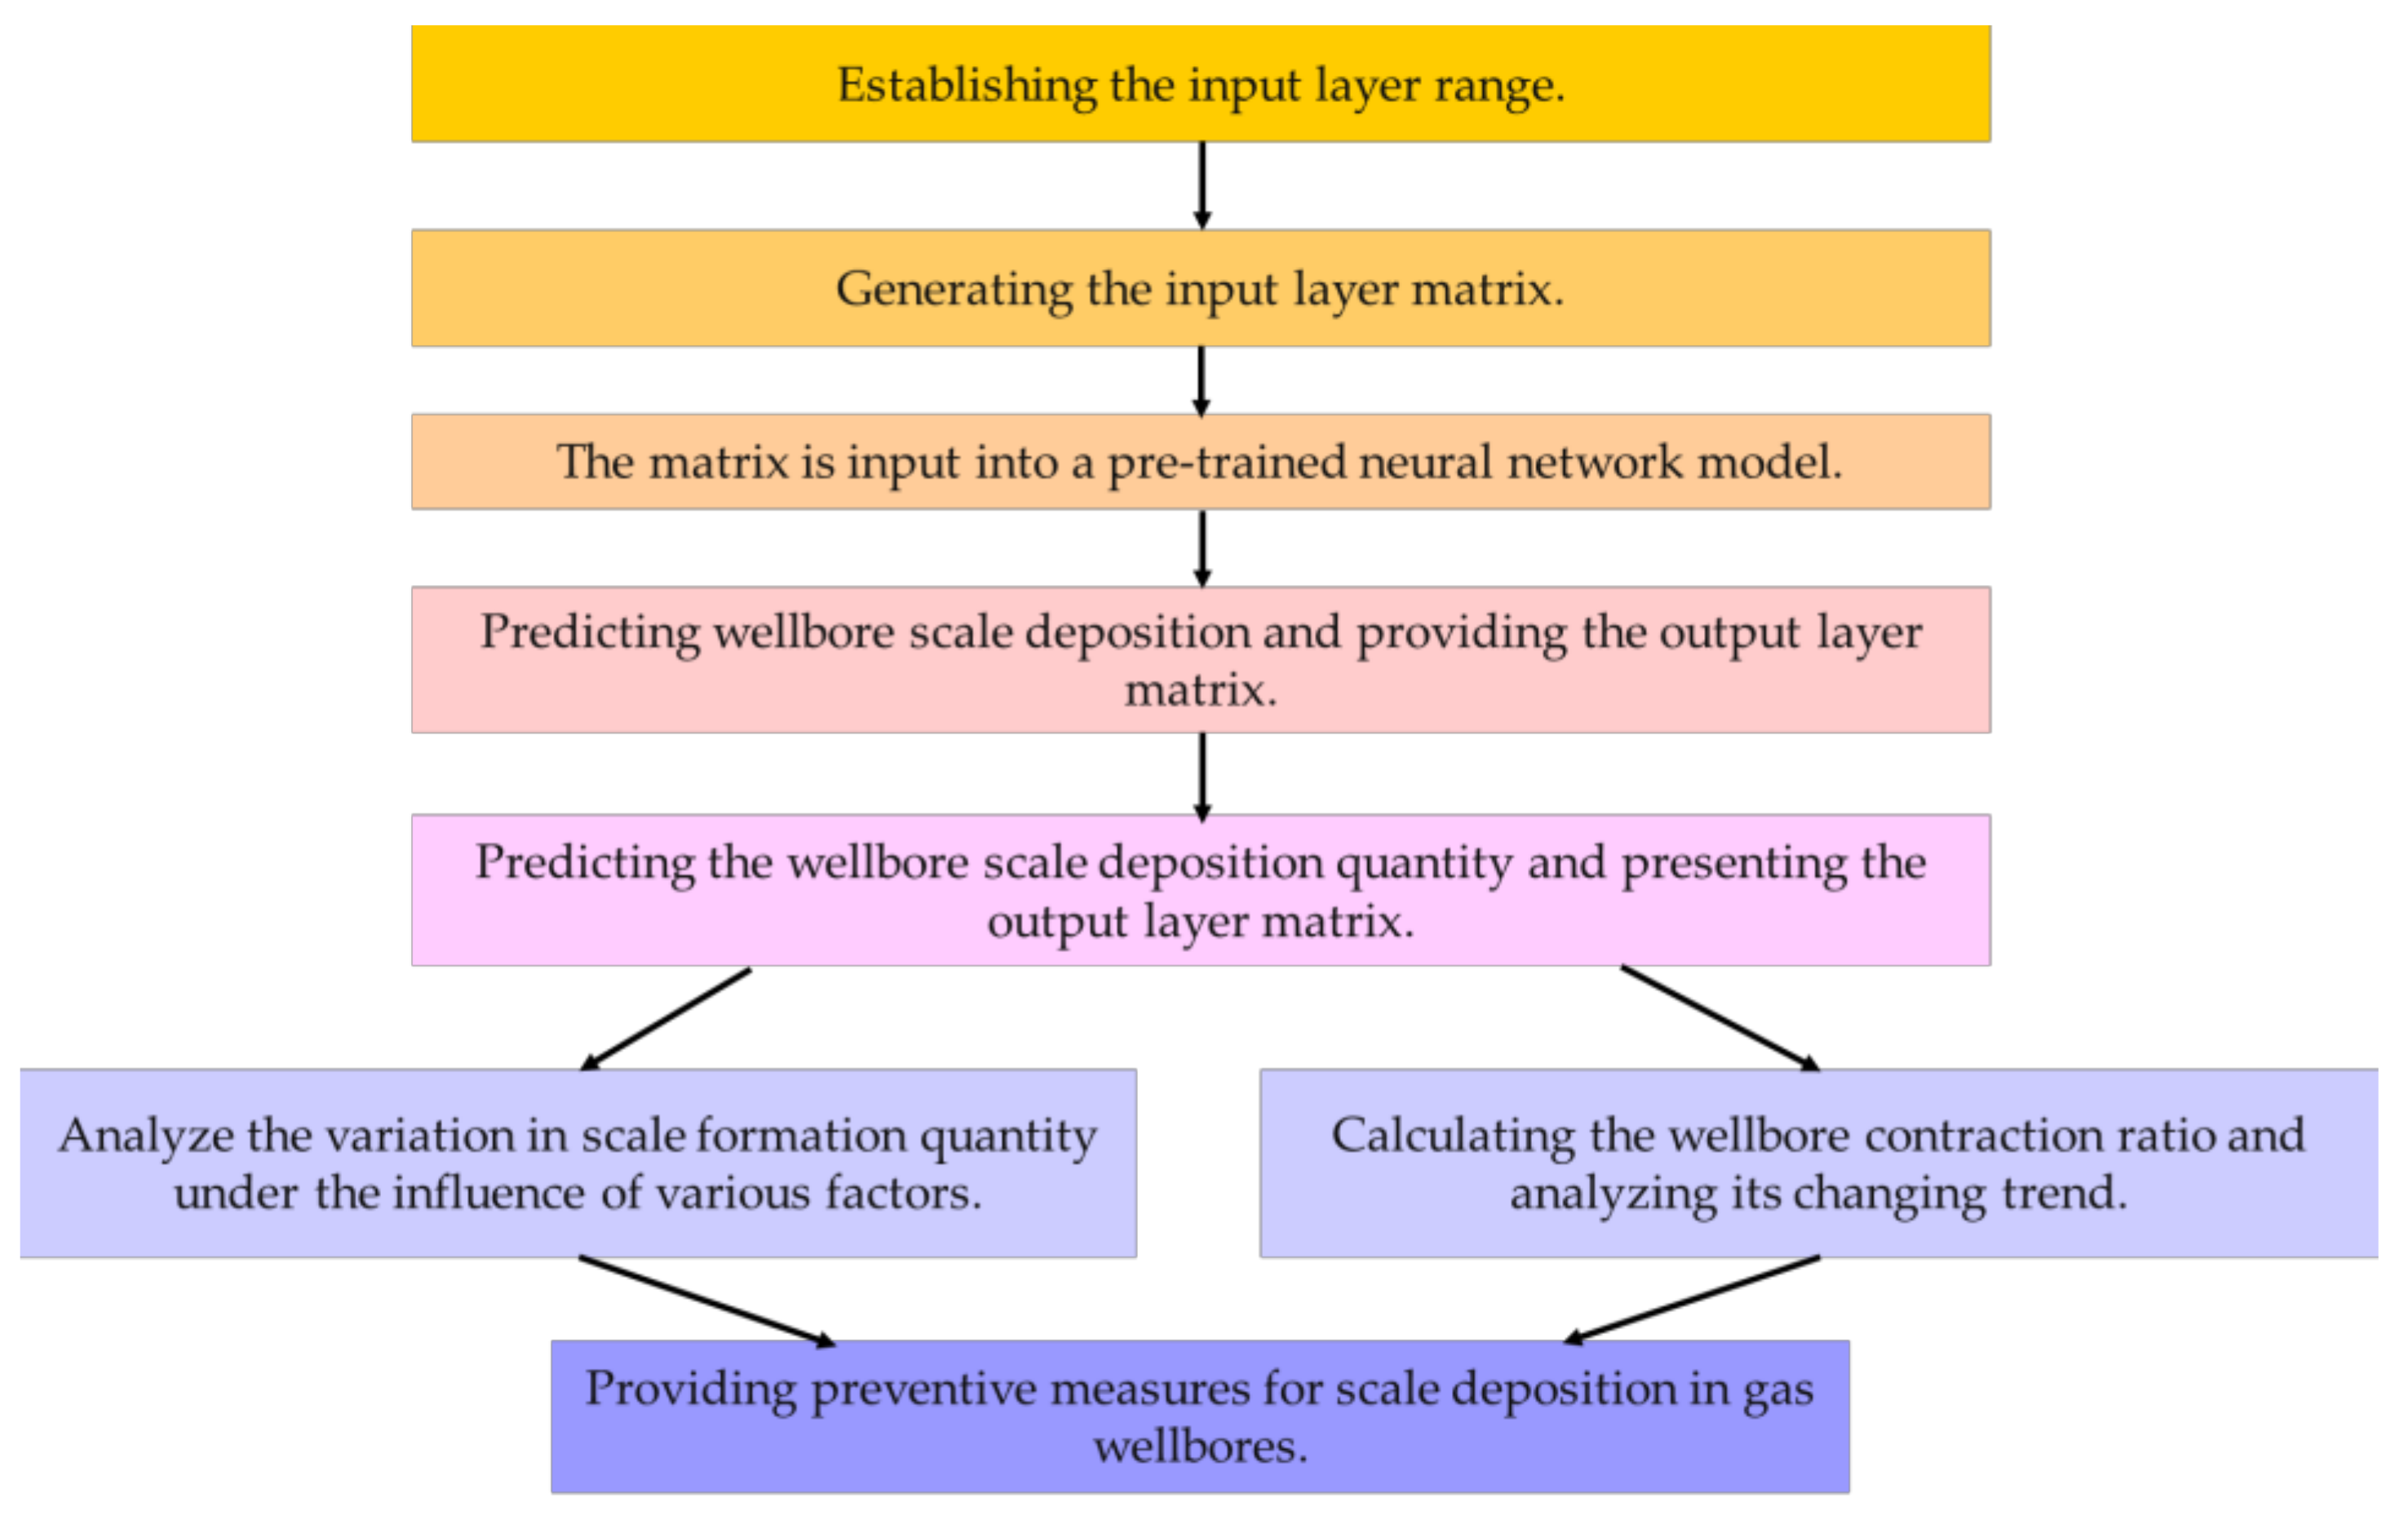
The final depiction of the scale formation mechanism analysis and scale prediction algorithm process is presented in Figure 4. This algorithm initially utilizes on-site data from the research area to establish the range of various parameters for the input layer, based on which an input layer matrix is generated. Subsequently, this input layer matrix is fed into a pre-trained neural network model, and the output layer matrix is computed. At this stage, the output layer matrix reflects the scale formation under different input parameters. The analysis encompasses the diverse trends of scale formation influenced by varying factors and computes the corresponding wellbore contraction ratio. Ultimately, this process furnishes preventive measures for scale formation in gas wellbores.
Utilizing the aforementioned algorithm enables the formulation of anti-scaling measures under various conditions.

4.1. Analysis of Changes in Scaling Amount

(1) Scale anions
This study examines and forecasts scale formation patterns in the Sulige gas field wells across a range of input parameters, encompassing temperature, pressure, ion concentrations, and water salinity, through the development of algorithms. Here, temperature and pressure refer to the reservoir conditions, and scale formation quantity represents the scale concentration in unit volume of formation water at a specified pressure and temperature. The numerical ranges for temperature, pressure, and scale-forming ion concentrations are provided in Table 6. Keeping other ion concentrations constant, the study separately investigates the effects of SO42−, HCO3, Ba2+, and Ca2+ on scale formation quantity. The simulation results are depicted in Figure 3, Figure 4, Figure 5, Figure 6, Figure 7 and Figure 8, where the colors on the scale bar correspond to the scale formation quantity.
Figure 5 displays the distribution of BaSO4 scale quantities under different SO42− ion concentrations (with an HCO3 concentration at 300 mg/L, Ca2+ concentration at 700 mg/L, and Ba2+ concentration at 2000 mg/L). From Figure 5, it is evident that the BaSO4 scale quantities exhibit a “diagonal” distribution under varying SO42− ion concentrations. In the high-pressure low-temperature region (top left corner), BaSO4 scale formation is relatively low, whereas in the high-temperature low-pressure region (bottom right corner), BaSO4 scale formation is higher. Nonetheless, in both the high-pressure low-temperature region and the low-pressure high-temperature region, the impact of temperature and pressure on BaSO4 scale formation appears to be relatively minor. On the other hand, in the low-pressure low-temperature region (bottom left corner) and the high-pressure high-temperature region (top right corner), BaSO4 scale formation is significantly affected by changes in temperature and pressure. Therefore, it can be observed that in gas wells with high temperatures and low pressures, BaSO4 scale formation may be more severe.
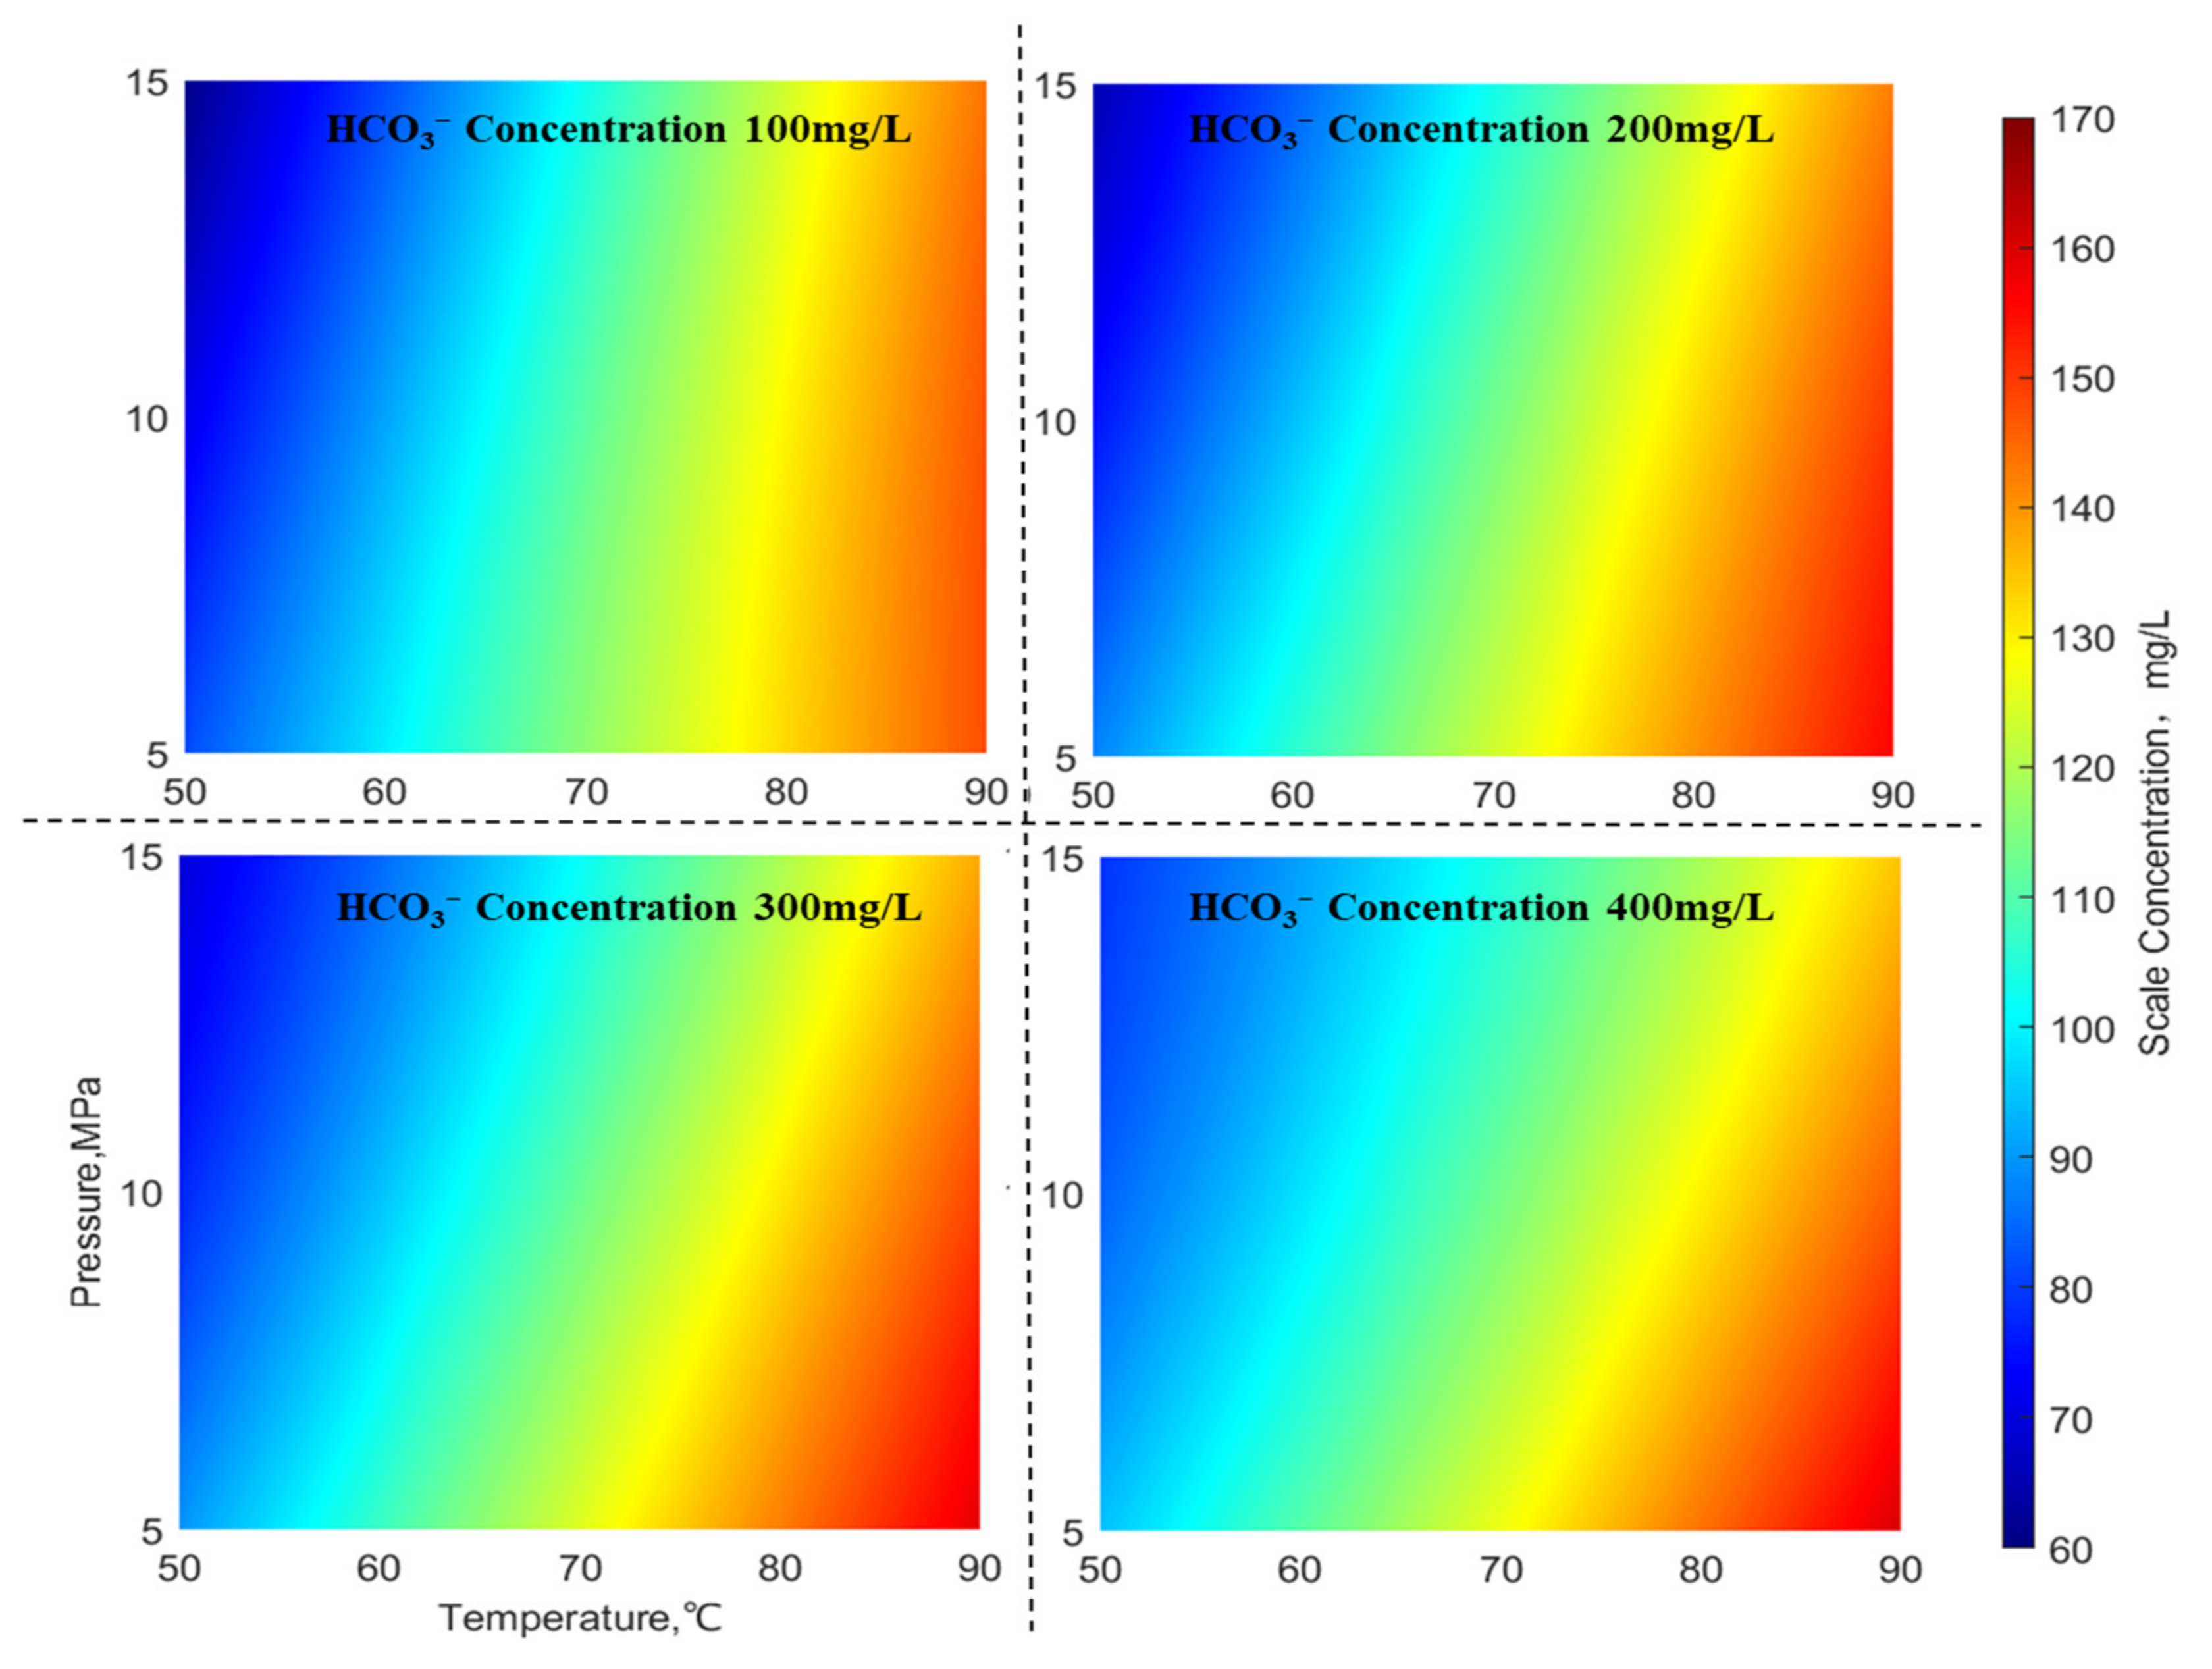
Figure 6 illustrates the distribution of CaCO3 scale quantities under different HCO3 ion concentrations (with an SO42− concentration at 220 mg/L, Ca2+ concentration at 700 mg/L, and Ba2+ concentration at 2000 mg/L). From Figure 6, it can be observed that the CaCO3 scale quantities exhibit a “wave-like” distribution under varying HCO3− ion concentrations. In the high-temperature region (on the right side), CaCO3 scale formation is higher, while in the low-temperature region (on the left side), CaCO3 scale formation is lower. Both high-temperature (right side) and low-temperature (left side) regions are relatively less influenced by temperature and pressure. However, as ion concentrations rise, the effect of temperature and pressure on BaSO4 scale formation becomes markedly more significant, observed in both the high-temperature high-pressure region (top right corner) and the low-temperature low-pressure region (bottom left corner). Therefore, it can be concluded that when ion concentrations are low, CaCO3 scale formation is more severe in high-temperature wells. Conversely, when ion concentrations are high, CaCO3 scale formation is more serious in high-temperature low-pressure wells.
(2) Scale cations
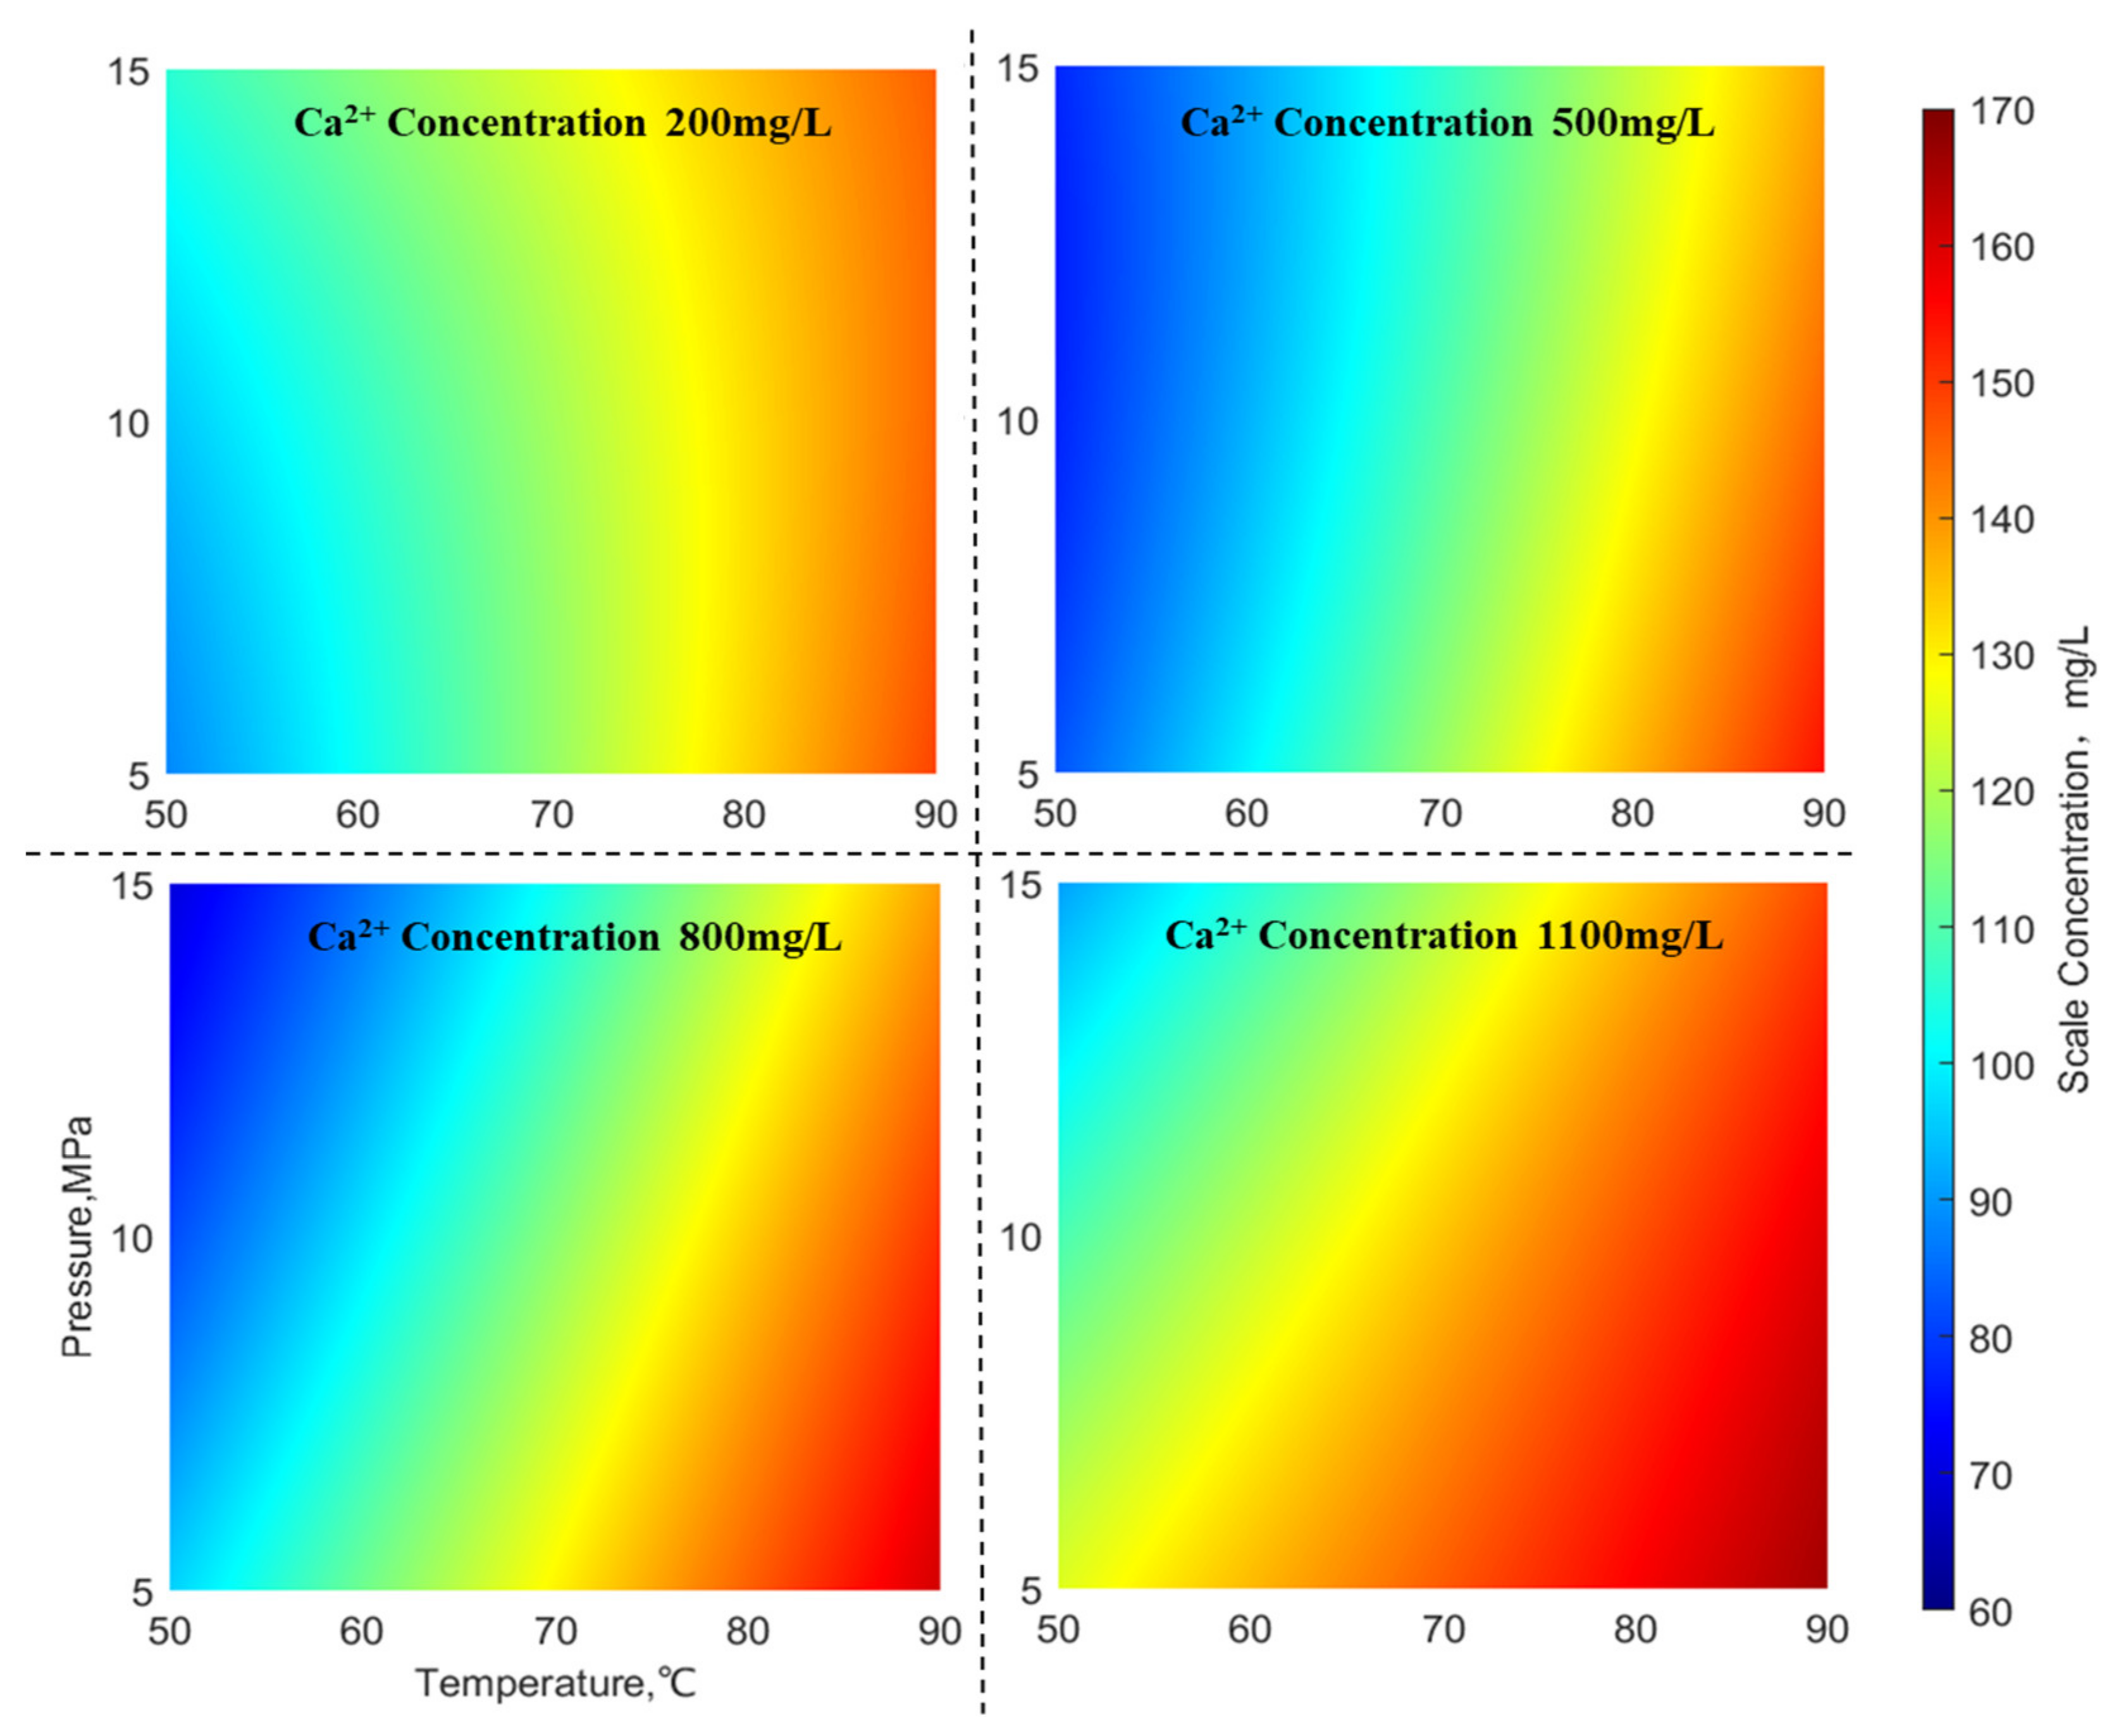
The figure depicted in Figure 7 illustrates the distribution of CaCO3 scaling amounts under different concentrations of Ca2+ ions (with an HCO3 concentration of 300 mg/L, SO42− concentration of 220 mg/L, and Ba2+ concentration of 2000 mg/L). From Figure 7, it can be observed that the scaling amounts of CaCO3 exhibit a “wave-like” pattern at varying concentrations of Ca2+ ions. In the high-temperature region (on the right side), the scaling amount of CaCO3 is relatively high, whereas in the low-temperature high-pressure region (bottom left corner), the scaling amount of CaCO3 is comparatively low. Both the high-temperature region (on the right side) and the low-temperature high-pressure region (bottom left corner) show minor influences of temperature and pressure on CaCO3 scaling. However, with an increase in ion concentration, the impact of temperature and pressure on CaCO3 scaling in the high-temperature high-pressure region (top right corner) and the low-temperature low-pressure region (bottom left corner) gradually intensifies. Additionally, the scaling of CaCO3 in the low-temperature low-pressure region gradually increases, while in the low-temperature high-pressure region (top left corner), the CaCO3 scaling gradually decreases. Therefore, it can be concluded that when the ion concentration is low, CaCO3 scaling is more severe in high-temperature gas wells. Conversely, when the ion concentration is high, CaCO3 scaling becomes even more pronounced in high-temperature low-pressure gas wells.
The graph presented in Figure 8 illustrates the distribution of BaSO4 scaling under different concentrations of Ba2+ ions (with an HCO3 concentration of 300 mg/L, SO42− concentration of 220 mg/L, and Ca2+ concentration of 700 mg/L). From Figure 8, it can be observed that the BaSO4 scaling amounts exhibit a “diagonal” pattern at varying Ba2+ ion concentrations. In the high-pressure low-temperature region (top left corner), the BaSO4 scaling is relatively small, whereas in the high-temperature low-pressure region (bottom right corner), the BaSO4 scaling is significantly larger. However, in both the high-pressure low-temperature area and the low-pressure high-temperature area, BaSO4 scaling is relatively unaffected by changes in temperature and pressure. Conversely, in the low-pressure low-temperature region (bottom left corner) and the high-pressure high-temperature region (top left corner), BaSO4 scaling is significantly affected by fluctuations in temperature and pressure. Consequently, it can be inferred that in gas wells characterized by high temperatures and low pressures, the occurrence of BaSO4 scaling might be more pronounced.
In summary, the formation of BaSO4 scaling under the influence of SO42− and Ba2+ ions follows a “diagonal” distribution pattern. In the high-pressure low-temperature region (top left corner), the BaSO4 scaling is relatively small, whereas in the high-temperature low-pressure region (bottom right corner), the BaSO4 scaling is more significant. However, in both the high-pressure low-temperature area and the low-pressure high-temperature area, BaSO4 scaling is relatively less affected by changes in temperature and pressure. Conversely, in the low-pressure low-temperature region (bottom left corner) and the high-pressure high-temperature region (top left corner), BaSO4 scaling is notably influenced by variations in temperature and pressure. Under the influence of Ca2+ and HCO3 ions, CaCO3 scaling exhibits a “wave-like” distribution pattern. In the high-temperature region (right side), there is a substantial buildup of CaCO3 scaling, whereas in the low-temperature region (left side), the scaling is minimal. Both the high-temperature region (right side) and the low-temperature region (left side) show relatively minor variations in CaCO3 scaling due to changes in temperature and pressure. However, with an increase in ion concentration, the impact of temperature and pressure on CaCO3 scaling becomes increasingly significant in the high-temperature high-pressure area (top right corner) and the low-temperature low-pressure area (bottom left corner). Overall, in gas wells with high temperatures and low pressures, BaSO4 scaling might be more severe. Additionally, when the ion concentration is low, there is severe CaCO3 scaling in high-temperature gas wells, whereas when the ion concentration is high, the scaling becomes even more severe, especially in high-temperature low-pressure gas wells.

4.2. Analysis of Changes in Diameter Reduction Ratio

According to recent research, wellbore scale can be classified into two main types: crystalline scale and particulate scale. Crystalline scale occurs when scale ions precipitate directly onto the wellbore surface from formation water. On the other hand, particulate scale forms when scale ions aggregate into particles within the formation water and then adhere to the wellbore surface as the fluid flows. Along with the deposition of scale particles, there is a process of particle detachment. The interaction between the deposition and detachment processes [31] leads to wellbore scaling issues, gradually affecting the production of gas wells over time.
To simplify the problem, this study modeled the deposition and detachment processes of scale particles in the wellbore as the attachment of particulates from formation water, and a coefficient of attachment was assigned to describe the scaling process. The attachment of scale particles on the wellbore surface reduces the space available for fluid flow, potentially leading to wellbore blockages and impacting gas well production. Hence, to evaluate the potential risk of wellbore scaling and blockage, the Diameter Reduction Ratio (DRR) serves as a metric to gauge the extent of scaling. The DRR quantifies the ratio between the thickness of the scale layer and the internal diameter of the wellbore. Building upon the calculation of scaling quantity in the previous section, the total scaling within the predicted production lifespan is computed. This total scaling is converted into volume and averaged over the scaling intervals in the wellbore to determine the scale layer thickness. The specific calculation method is shown in Equations (1)–(3) [32].
m = qwCt × 10−6
where m—the total scale mass within a certain period of time, kg;
q w —daily water production of gas well, m3/d;
C—scale concentration, kg/L;
t—time, d.
d = m/2ρπrL
where d—scale layer thickness, m;
L—fouling section length, m;
ρ —density of scale, kg/m3.
DRR = 2d/D
where D—wellbore inner diameter, m.
Based on the above analysis, and referring to the work of Zhang and colleagues [22], an attachment ratio of 0.73 was adopted. Based on these principles, the variations in the Diameter Reduction Ratio (DRR) over a 3-year production period were calculated under different temperatures, pressures, and ion concentrations. The calculation process overlooks changes in ion concentration, reservoir temperature and pressure, and wellbore internal diameter, and assumes scaling occurs throughout the entire wellbore segment. The selected parameters for the calculation are detailed in Table 7.
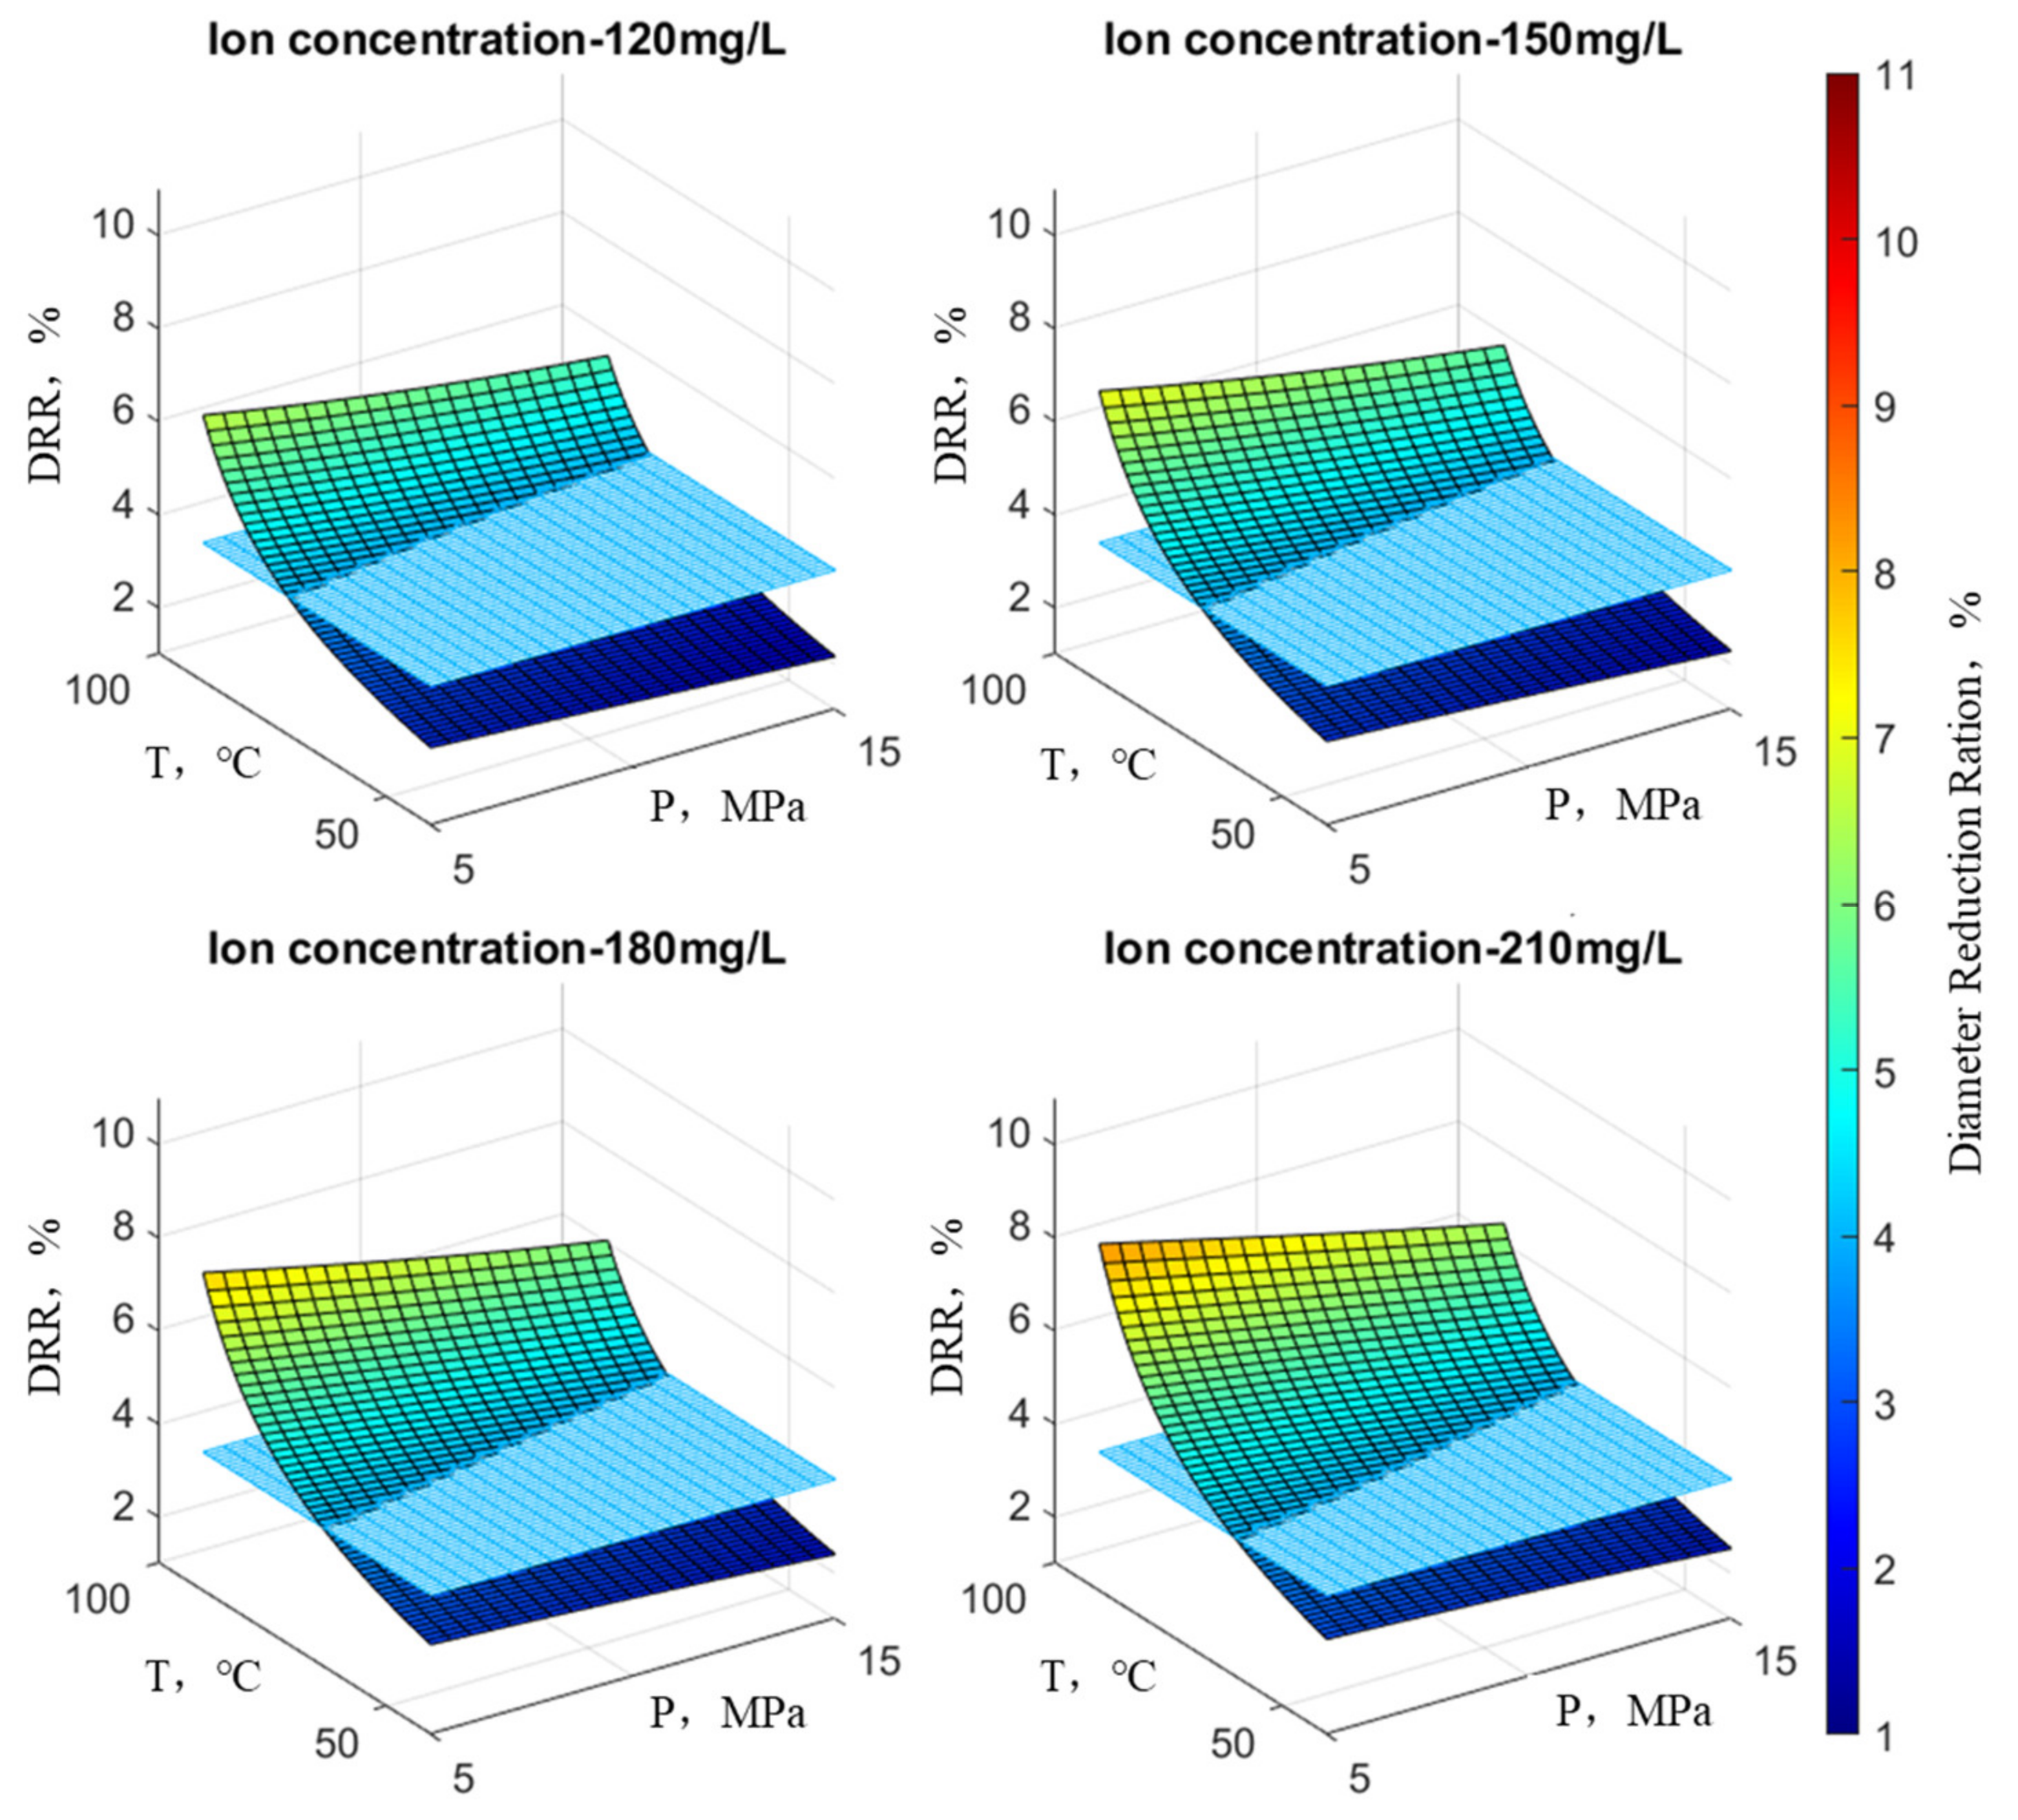
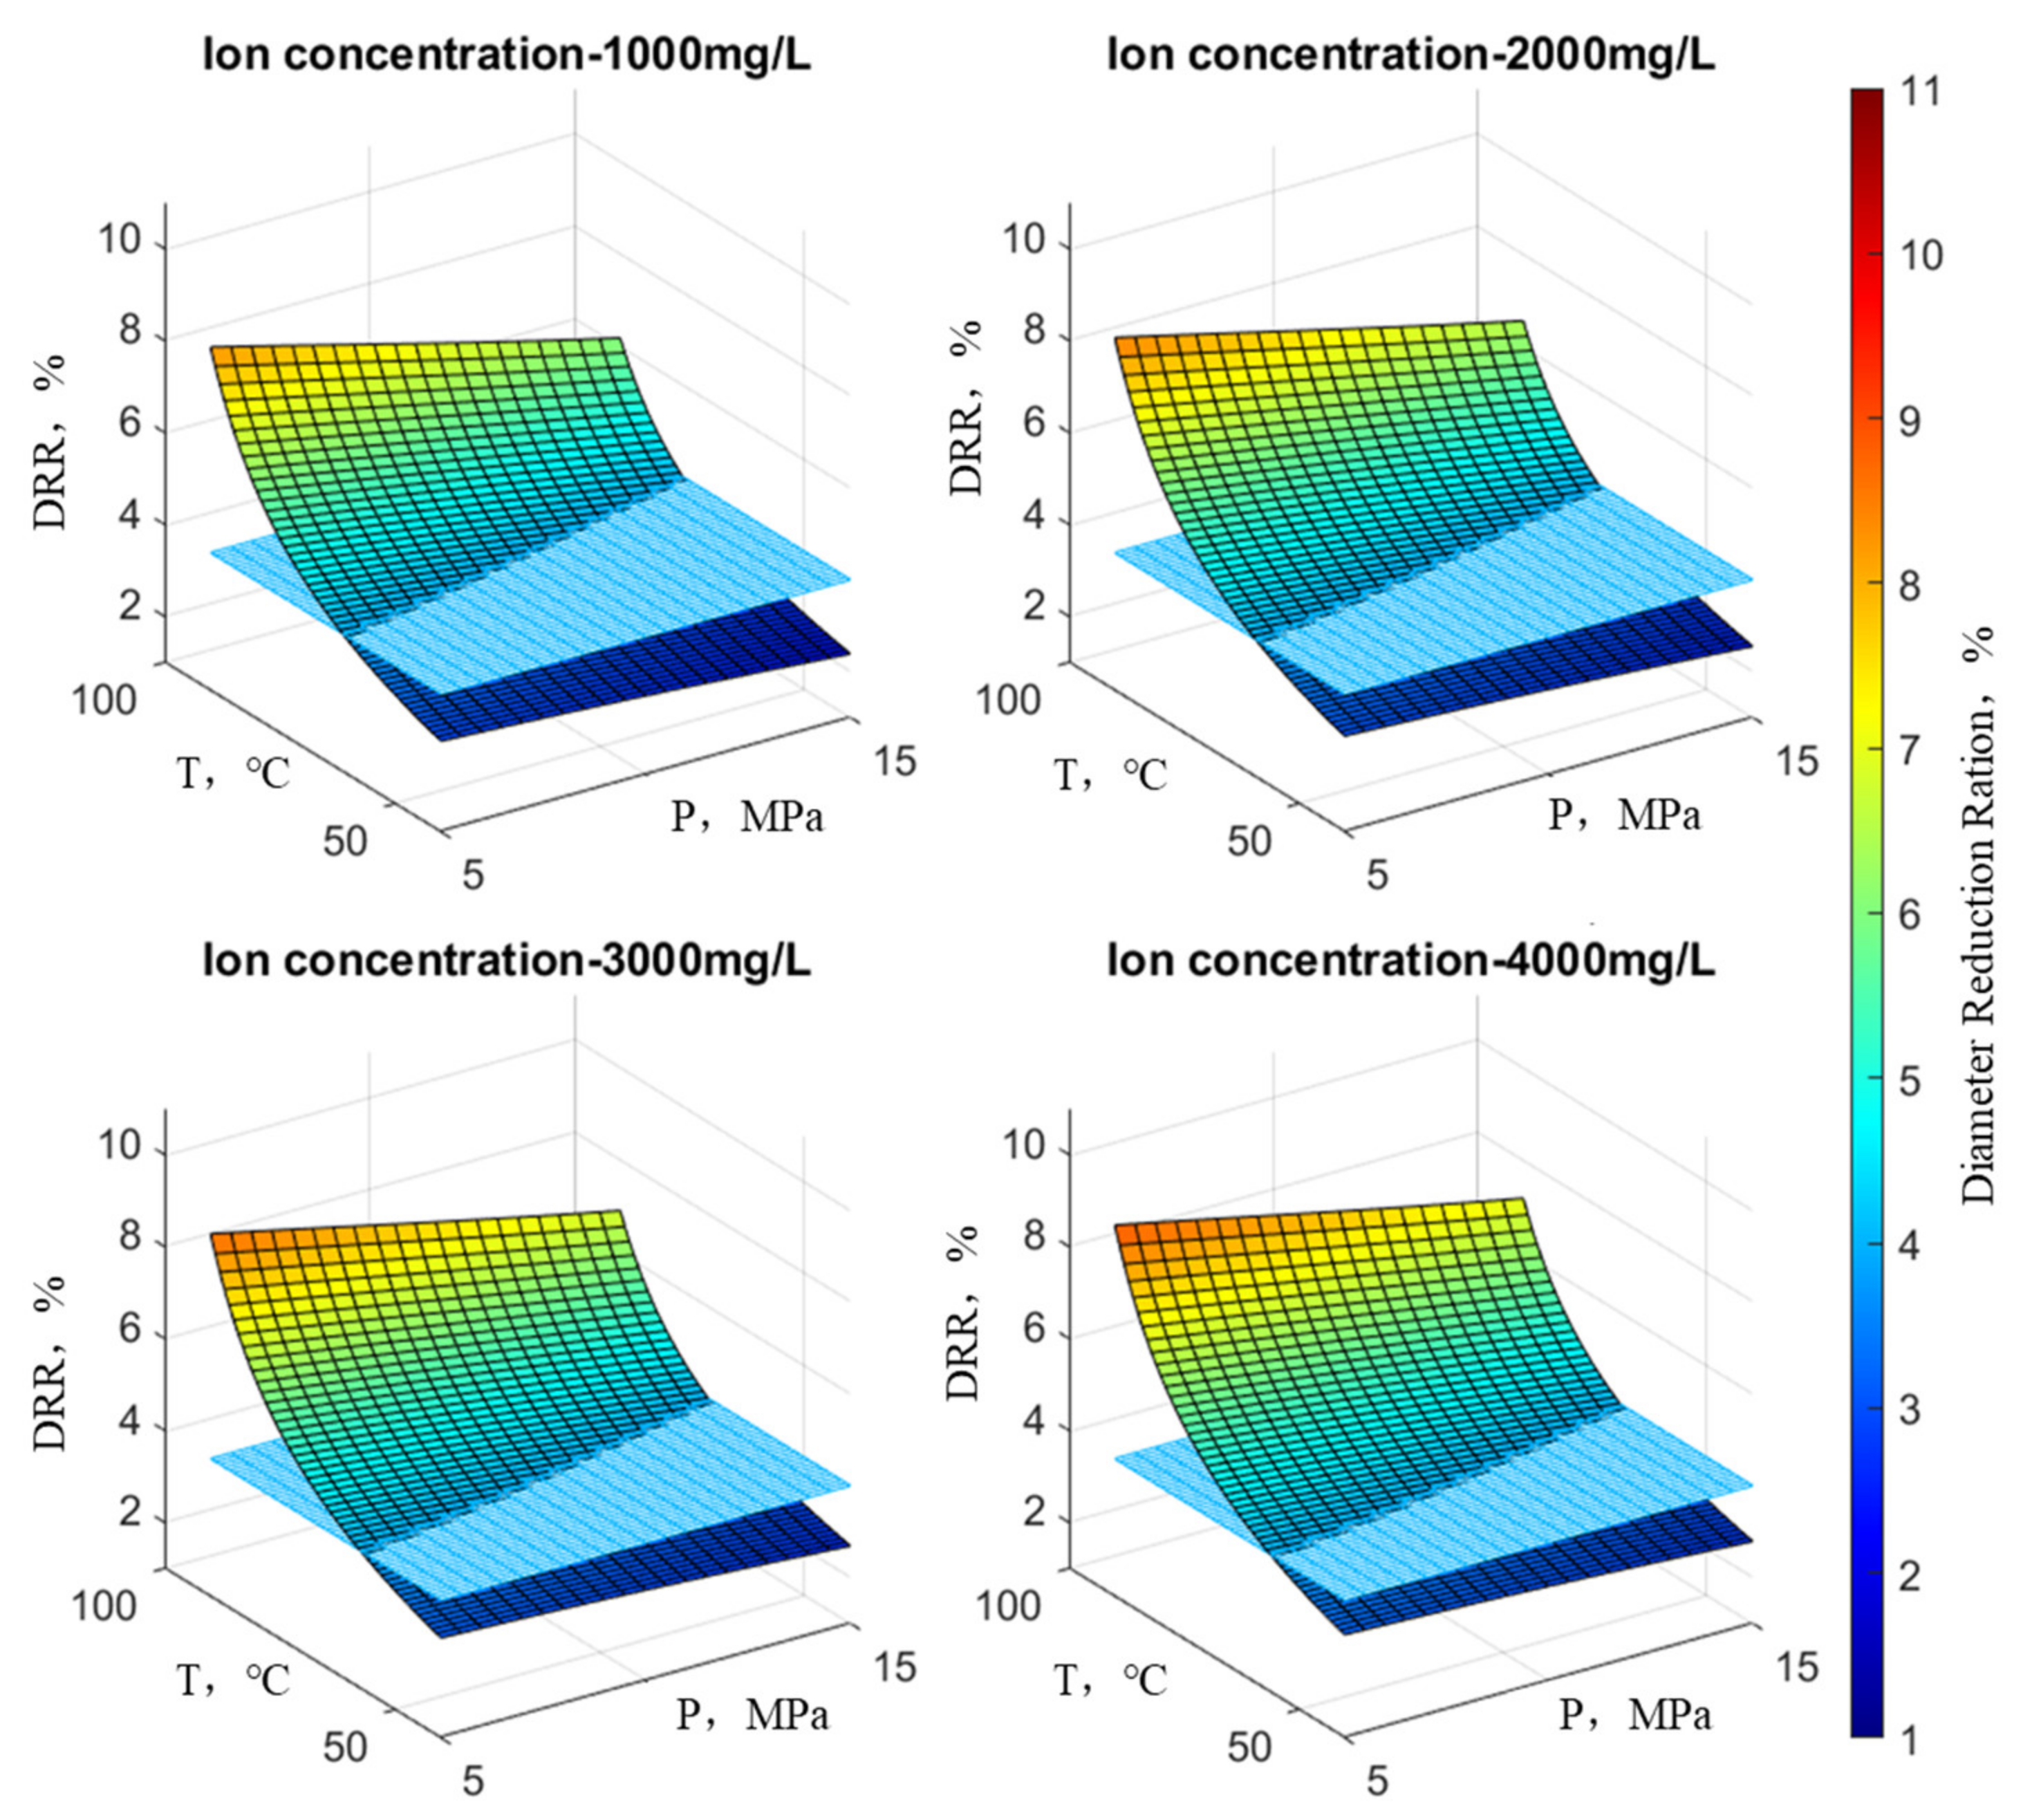
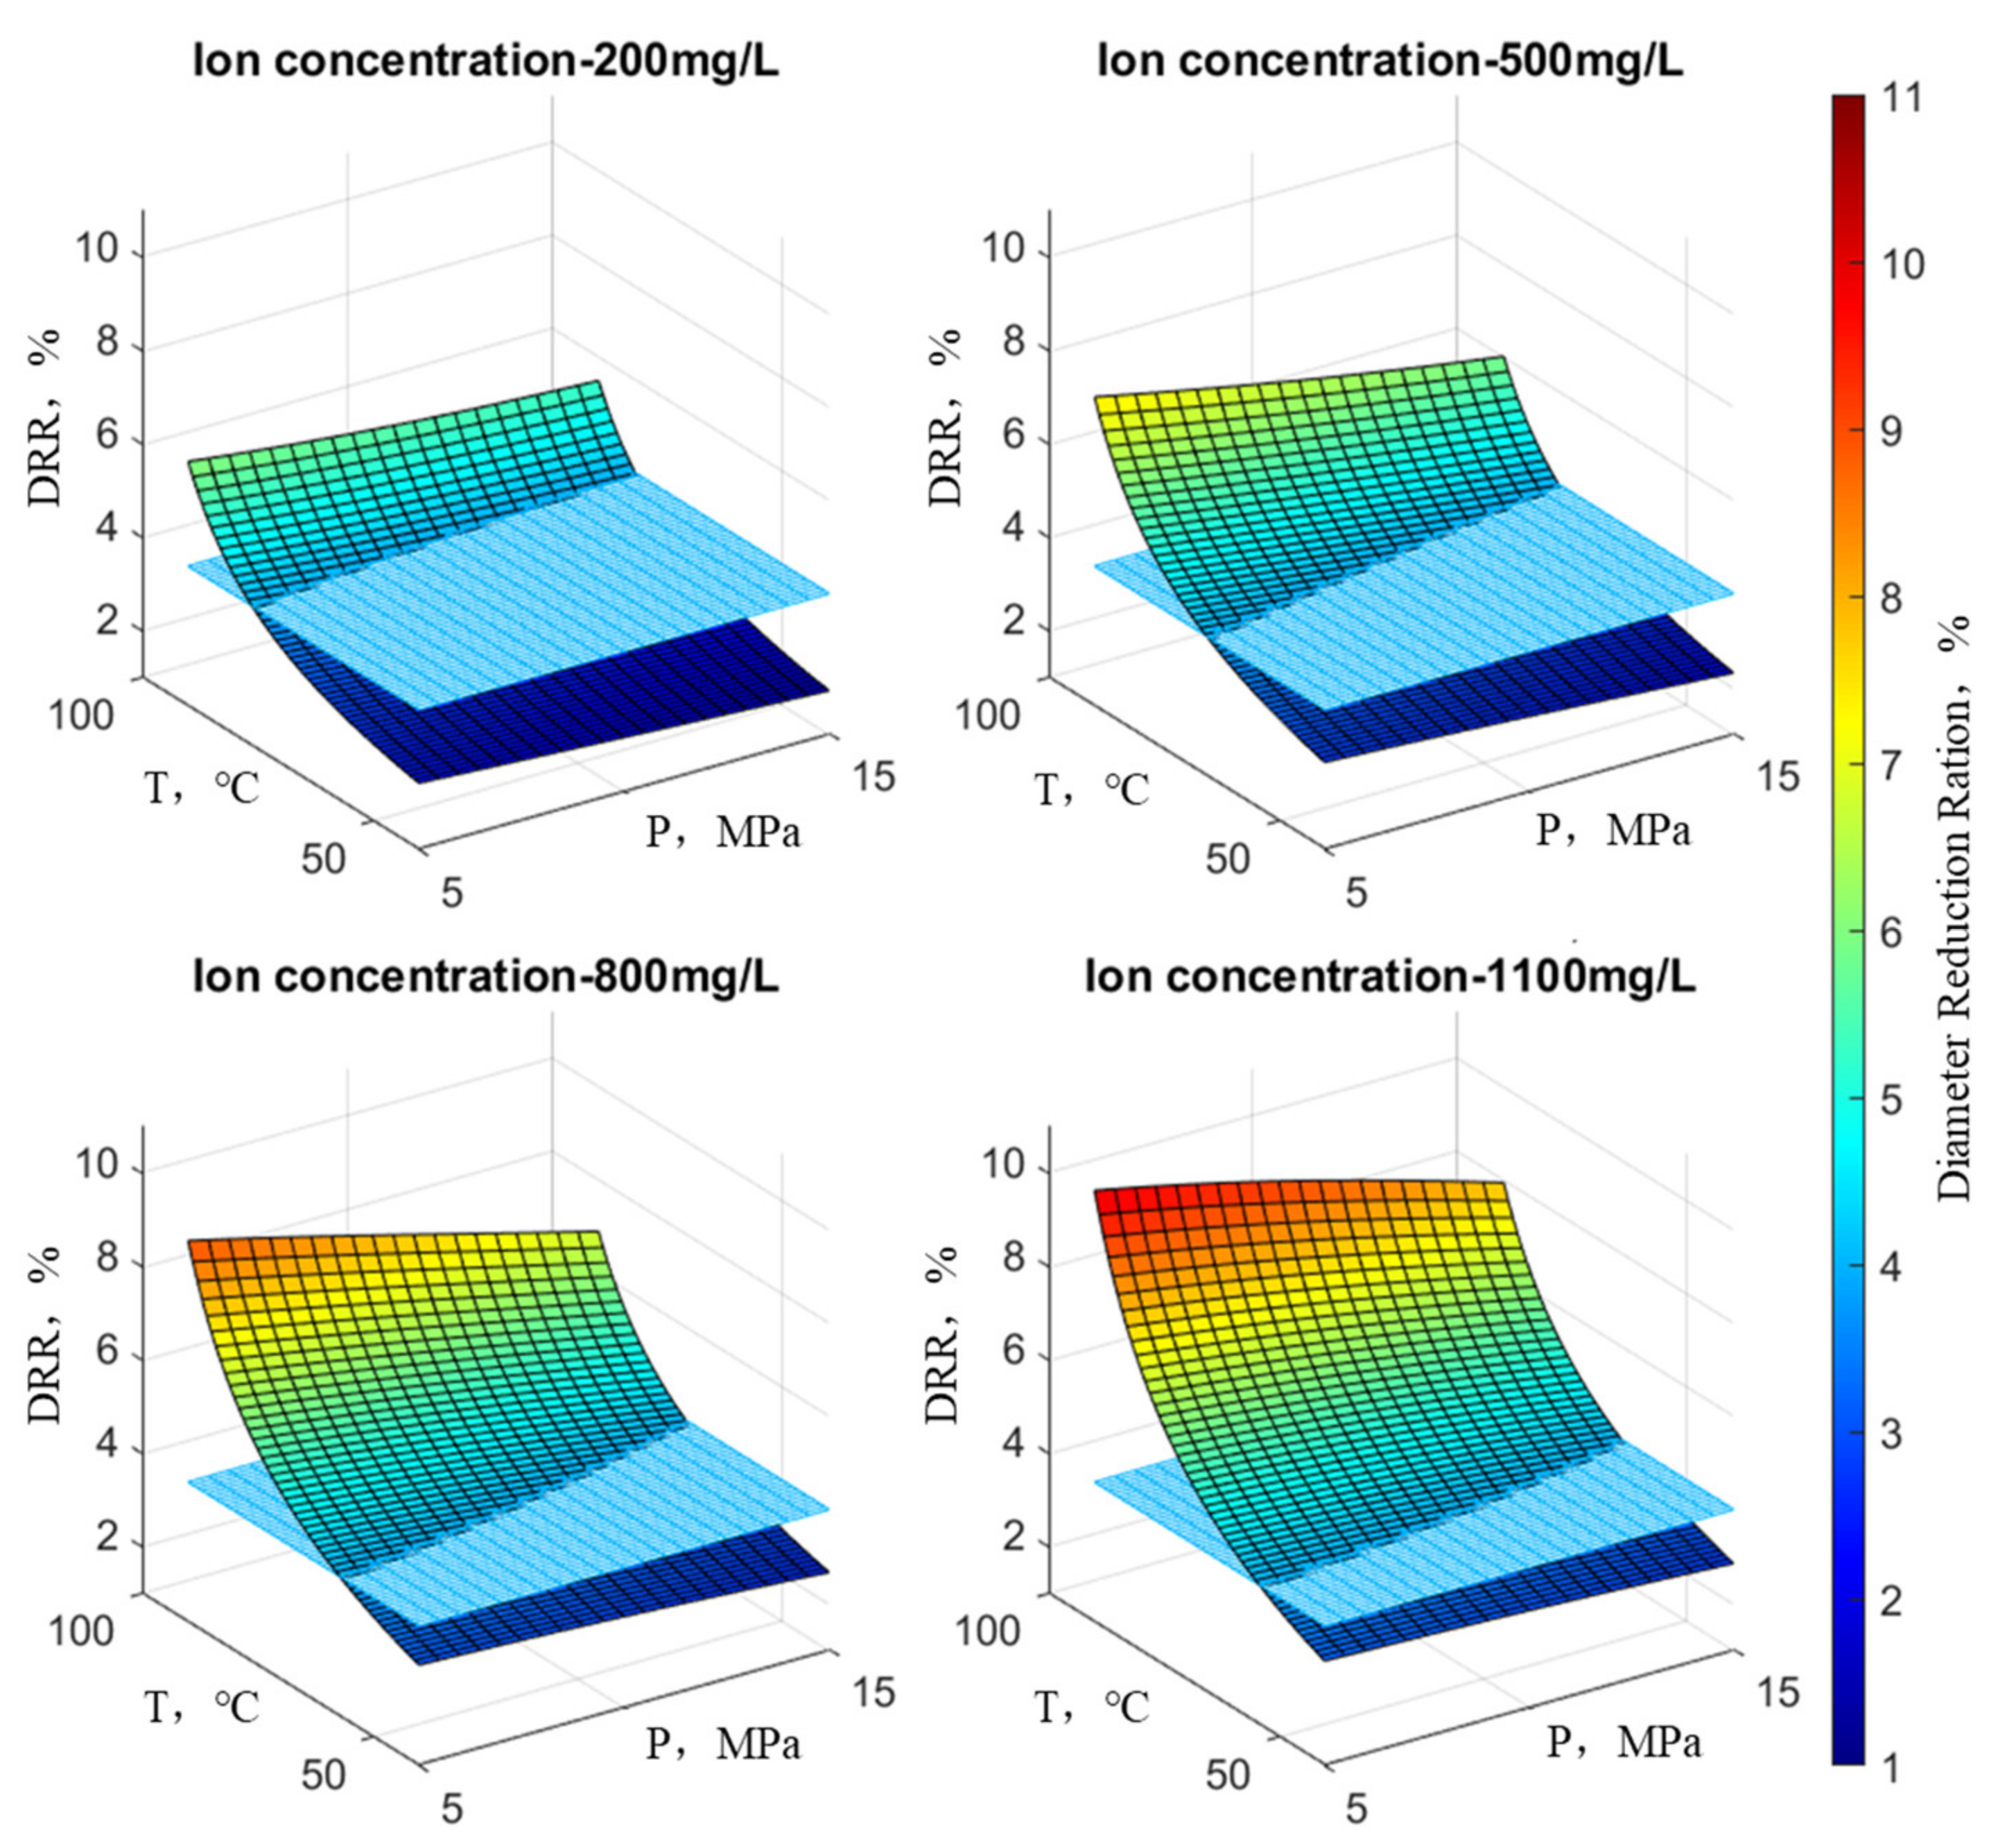
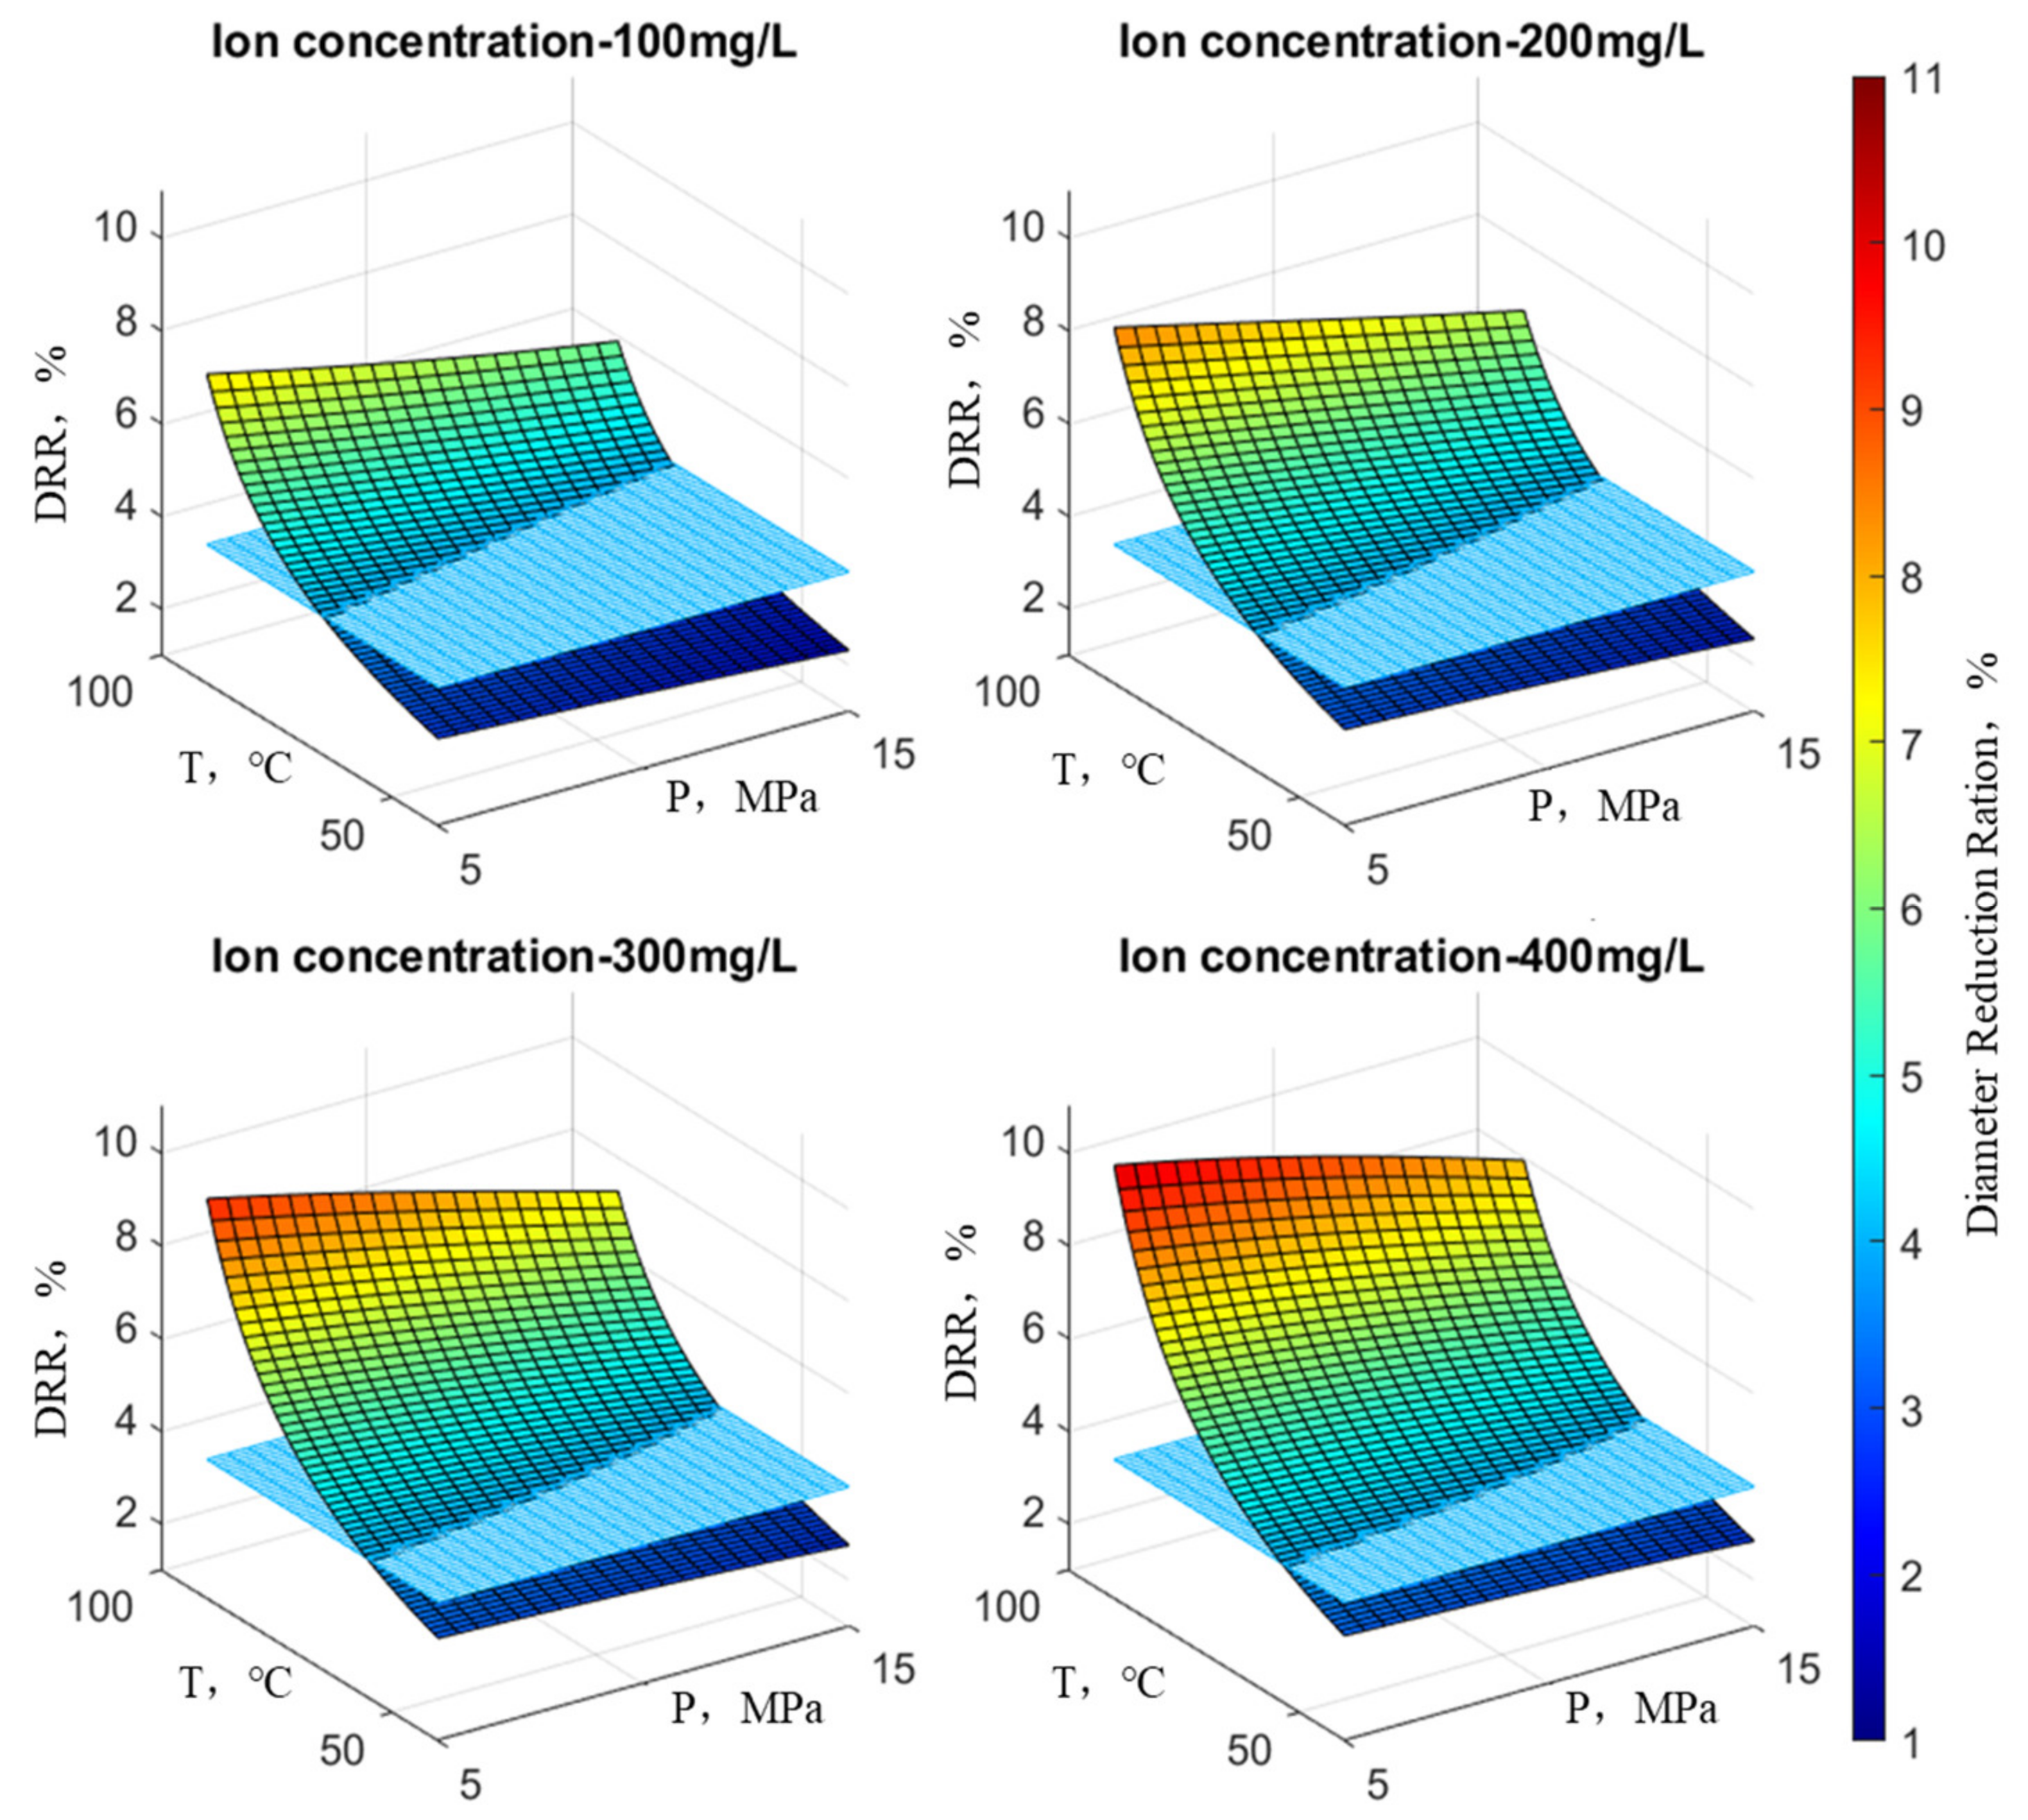
Following the principles outlined above, an examination was conducted on the reduction rate of wellbore diameter concerning scale ion concentration, temperature, and pressure. In the graph, the X-axis and Y-axis denote temperature and pressure, respectively, while the Z-axis illustrates the wellbore’s reduction rate. At any point on the surface of the graph, the height indicates the variation in the reduction rate under the current temperature, pressure, and ion concentration, with the color scale corresponding to the magnitude of the reduction rate. Practical observations on-site suggest that when the reduction rate is below 4%, there is considered to be no scaling risk, representing the position on the graph’s plane. This plane divides the surface representing the reduction rate variation into two parts and is parallel to the plane of temperature and pressure. At any point on this plane, the reduction rate is 4%.
Figure 9 illustrates the variation in the wellbore reduction rate when the concentration of SO42− changes (with an HCO3 concentration at 300 mg/L, Ca2+ concentration at 700 mg/L, and Ba2+ concentration at 2000 mg/L). Similarly, Figure 10 depicts the variation in the wellbore reduction rate when the concentration of HCO3 changes (with SO42− concentration at 220 mg/L, Ca2+ concentration at 700 mg/L, and Ba2+ concentration at 2000 mg/L).
Figure 9 illustrates the trend in wellbore reduction rates under the influence of SO42−. It is evident that when the SO42− concentration remains constant, pressure has a minor impact on the reduction rate at low temperatures but a significant impact at high temperatures. Furthermore, at low pressure, temperature exerts a significant impact on the reduction rate, while at high pressure, the influence of temperature diminishes. With increasing ion concentration, the maximum reduction rate extends from the high-temperature, low-pressure region to encompass the entire surface, indicating variations in reduction rate. Overall, the reduction rate continuously increases, and the surface representing the reduction rate shifts upward. In other words, the surface above the plane where the reduction rate equals 4% becomes increasingly larger. In general, the influence of temperature on the reduction rate is greater than that of pressure.
Figure 10 illustrates the variation in wellbore reduction rates under the influence of HCO3-. It can be observed that the overall trend is similar to the reduction rate variation observed under the influence of SO42−. Once again, temperature has a more significant impact on the reduction rate compared to pressure.
Figure 11 depicts the variation in the wellbore reduction rate when the concentration of Ca2+ changes (with SO42− concentration at 220 mg/L, HCO3 concentration at 300 mg/L, and Ba2+ concentration at 2000 mg/L). Similarly, Figure 12 shows the variation in the wellbore reduction rate when the concentration of Ba2+ changes (with SO42− concentration at 220 mg/L, HCO3 concentration at 300 mg/L, and Ca2+ concentration at 700 mg/L).
Figure 11 represents the variation in wellbore reduction rates under the influence of Ca2+. It is evident that at an ion concentration of 200 mg/L temperature has a far greater impact on the reduction rate than pressure. This is discernible from the spatial extent of the surface’s changes; the surface representing reduction rate variations is nearly perpendicular to the plane defined by reduction rate and temperature. As the ion concentration increases, the reduction rate surface starts to tilt.
This suggests that pressure exerts a lesser influence on the reduction rate at low temperatures but a more substantial impact at high temperatures. Conversely, at low pressure, temperature significantly affects the reduction rate, whereas at high pressure, the influence of temperature is comparatively minor. The wellbore reduction rate reaches its minimum at high temperatures and low pressures. In summary, the effect of temperature on the reduction rate surpasses that of pressure. Additionally, it can be observed that with increasing ion concentration, the reduction rate surface consistently shifts upward, and the portion of the surface above the 4% reduction rate plane becomes larger.
Figure 12 illustrates the variation in wellbore reduction rates under the influence of Ba2+. The trend aligns with the variation observed under the influence of Ca2+, emphasizing once again that temperature’s impact on the reduction rate outweighs that of pressure.
Based on the above analysis, it can be observed that under certain conditions in the research area, controlling the temperature, pressure, and ion concentration of the produced water within specific ranges can maintain the borehole contraction rate below 4% over a three-year production period. Therefore, during on-site production, focusing on parameters such as temperature, pressure, and ion concentration can effectively prevent scaling issues. However, in reality, the temperature of the reservoir and the ion concentration of the produced water are uncontrollable factors determined by geological conditions. On the other hand, the bottom-hole pressure of gas wells is related to the production system, which means that the bottom-hole pressure of gas wells is controllable. Production systems for gas wells include fixed production rate systems and fixed pressure systems. The latter involves fixed wellhead (bottom-hole) pressure systems and fixed pressure difference systems. The formulation of the production system depends on geological conditions and production requirements. Thus, in the gas well production process, mitigating scaling and minimizing associated risks can be achieved by manipulating the production system to regulate bottom-hole pressure, provided certain conditions like fixed temperature and ion concentration. However, due to economic considerations and reservoir constraints, bottom-hole pressure cannot be increased indefinitely. In practice, determining the optimal magnitude of bottom-hole pressure becomes a multi-objective optimization challenge, balancing economic benefits, reservoir conditions, technical costs, and other relevant factors. In conclusion, considering the temperature and ion concentration conditions in the research area, the selected bottom-hole pressure should be adjusted to achieve a borehole contraction rate as close to 4% as possible, striking a balance between scaling prevention and economic efficiency in the given reservoir context.
5. Conclusions

The target area was a tight sandstone gas reservoir, and through the collection of on-site data and laboratory experiments, the water quality and composition of blockage materials in the target area were clarified. Combining this information with a BP neural network model, a model for predicting wellbore scaling risk and analyzing scale prevention measures in the target reservoir was established. Upon elucidating the wellbore blockage mechanism applicable to tight sandstone gas reservoirs in the target area, corresponding preventive measures were proposed. The results indicate:
(1) The water in the target area is of a CaCl2 type, and the analysis of blockage material composition indicates that the predominant scales are CaCO3 and BaSO4. Due to significant production in the target area, it was analyzed that the fluid in the gas wells exhibits a circular flow, with a stable pH ranging between 6.2 and 6.5.
(2) Under the influence of Ba2+ and SO42−, the BaSO4 scaling quantity shows a “diagonal” distribution with changes in temperature and pressure. Under the influence of Ca2+ and HCO3, the CaCO3 scaling quantity exhibits a “wave” distribution with changes in temperature and pressure. Overall, BaSO4 is more influenced by pressure, while CaCO3 is more influenced by temperature.
(3) Controlling temperature, pressure, and scaling ion concentrations within a certain range can keep the contraction ratio within 4% or close to 4%, achieving the prevention of scaling. This can be achieved through adjustments in production systems, primarily by modifying production pressure differentials. This provides guidance for predicting scaling risks and implementing scaling prevention measures in tight sandstone reservoirs.

Author Contributions

Conceptualization, X.S.; methodology, D.Z.; software, X.S.; validation, X.S.; formal analysis, H.W.; investigation, J.X.; data curation, J.X.; writing, X.S. All authors have read and agreed to the published version of the manuscript.

Funding

This research was funded by the National Natural Science Foundation of China, grant number 51934005, U23B2089; and Shaanxi Provincial Natural Science Basic Research Program Project, grant number 2024JC-YBQN-0554.

Data Availability Statement

Data are contained within the article.

Conflicts of Interest

The authors declare no conflicts of interest.

References

  1. Xu, J.; Wu, K.; Yang, S.; Cao, J.; Chen, Z.; Pan, Y.; Yan, B.J.A.J. Real gas transport in tapered noncircular nanopores of shale rocks. AICHE J. 2017, 63, 3224–3242. [Google Scholar] [CrossRef]
  2. Xu, J.; Wu, K.; Li, R.; Li, Z.; Li, J.; Xu, Q.; Li, L.; Chen, Z. Nano-scale Pore Size Distribution Effects on Gas Production from Fractal Shale Rocks. Fractals 2019, 27, 1950142. [Google Scholar] [CrossRef]
  3. Chen, X.; Li, Y.; Liu, Z.; Trivedi, J.; Tang, Y.; Sui, M. Visualized investigation of the immiscible displacement: Influencing factors, improved method, and EOR effect. Fuel 2023, 331, 125841. [Google Scholar] [CrossRef]
  4. Yang, W. Hydraulic fracture initiation for perforated wellbore coupled with the effect of fluid seepage. Energy Rep. 2022, 8, 10290–10298. [Google Scholar]
  5. Quddus, A.; Al-Hadhrami, L.M. Hydrodynamically deposited CaCO3 and CaSO4 scales. Desalination 2009, 246, 526–533. [Google Scholar] [CrossRef]
  6. Chilcott, N.P.; Phillips, D.A.; Sanders, M.G.; Collins, I.R.; Gyani, A. The Development and Application of an Accurate Assay Technique for Sulphonated Polyacrylate Co-polymer Oilfield Scale Inhibitors. In Proceedings of the International Symposium on Oilfield Scale, Aberdeen, UK, 26 January 2000. [Google Scholar]
  7. Li, X.; Gao, B.; Yue, Q.; Ma, D.; Rong, H.; Zhao, P.; Teng, P. Effect of six kinds of scale inhibitors on calcium carbonate precipitation in high salinity wastewater at high temperatures. J. Environ. Sci. 2015, 29, 124–130. [Google Scholar] [CrossRef] [PubMed]
  8. Johnson, A.; Eslinger, D.; Larsen, H. An Abrasive Jetting Scale Removal System. In Proceedings of the SPE/ICoTA Coiled Tubing Roundtable, Houston, TX, USA, 15 March 1998. [Google Scholar]
  9. Morizot, A.P.; Neville, A. Insights into Electrodeposition of an Inhibitor Film and Its Inhibitive Effects on Calcium Carbonate Deposition. J. Colloid Interface Sci. 2002, 245, 40–49. [Google Scholar] [CrossRef] [PubMed]
  10. Wanner, C.; Eichinger, F.; Jahrfeld, T.; Diamond, L.W. Unraveling the Formation of Large Amounts of Calcite Scaling in Geothermal Wells in the Bavarian Molasse Basin: A Reactive Transport Modeling Approach. Procedia Earth Planet. Sci. 2017, 17, 344–347. [Google Scholar] [CrossRef]
  11. Li, Y.; Pang, Z.; Galeczka, I.M. Quantitative assessment of calcite scaling of a high temperature geothermal well in the Kangding geothermal field of Eastern Himalayan Syntax. Geothermics 2020, 87, 101844. [Google Scholar] [CrossRef]
  12. Eseosa, A.; Atubokiki, A.J. Prediction and Monitoring of Oilfield Carbonate Scales Using Scale Check©. In Proceedings of the Nigeria Annual International Conference and Exhibition, Abuja, Nigeria, 30 July 2011. [Google Scholar]
  13. Langelier, W.F. The analytical control of anti-corrosion water treatment. J. AWWA 1936, 28, 1500–1521. [Google Scholar] [CrossRef]
  14. Stiff Jr, H.A.; Davis, L.E. A method for predicting the tendency of oil field waters to deposit calcium carbonate. J. Pet. Technol. 1952, 4, 213–216. [Google Scholar] [CrossRef]
  15. Ryznar, J.W. A new index for determining amount of calcium carbonate scale formed by a water. J. Am. Water Works Assoc. 1944, 36, 472–483. [Google Scholar] [CrossRef]
  16. Skillman, H.; McDonald, J.; Stiff, H. A simple, accurate, fast method for calculating calcium sulfate solubility in oil field brine. In Proceedings of the Spring Meeting of the Southwestern District, API, Lubbock, TX, USA, 14 March 1969. [Google Scholar]
  17. Oddo, J.; Tomson, M. Why scale forms in the oil field and methods to predict it. SPE Prod. Facil. 1994, 9, 47–54. [Google Scholar] [CrossRef]
  18. Hasson, D.; Avriel, M.; Resnick, W.; Rozenman, T.; Windreich, S. Mechanism of calcium carbonate scale deposition on heat-transfer surfaces. Ind. Eng. Chem. Fundam. 1968, 7, 59–65. [Google Scholar] [CrossRef]
  19. Hasan, A.; Kabir, C. Heat transfer during two-Phase flow in Wellbores; Part I—Formation temperature. In Proceedings of the SPE Annual Technical Conference and Exhibition, Dallas, TX, USA, 6 October 1991; p. SPE-22866-MS. [Google Scholar]
  20. Brahim, F.; Augustin, W.; Bohnet, M. Numerical simulation of the fouling process. Int. J. Therm. Sci. 2003, 42, 323–334. [Google Scholar] [CrossRef]
  21. Yang, X.; Li, W.; Guo, L.; Liu, X.; Feng, H. Prediction of CaCO3 scaling in water injection wellbore. Appl. Therm. Eng. 2016, 98, 532–540. [Google Scholar] [CrossRef]
  22. Zhang, L.; Yang, L.; Wang, Z.; Zhang, C.; Meng, W.; Ren, S. Experimental study on scaling and adhesion characteristics in water-producing gas wellbore. Nat. Gas Ind. B 2021, 8, 252–266. [Google Scholar] [CrossRef]
  23. Zhao, B.; Yang, S.; Liu, F.; Hu, Y.; Cao, S.; Men, H.; Xu, Z. Experimental study on dynamic simulation of cooling water fouling resistance prediction by support vector machine. Proc. CSEE 2010, 30, 92–97. [Google Scholar]
  24. Gabetta, G.; De Masi, G.; Gentile, M.; Vichi, R.; Scapin, M. Pipeline Internal Damage Prediction by Deterministic Models and Neural Networks. In Proceedings of the Abu Dhabi International Petroleum Exhibition and Conference, Abu Dhabi, United Arab Emirates, 10 November 2014. [Google Scholar]
  25. Paz, P.A.; Caprace, J.-D.; Cajaiba, J.F.; Netto, T.A. Prediction of calcium carbonate scaling in pipes using artificial neural networks. In Proceedings of the International Conference on Offshore Mechanics and Arctic Engineering, Trondheim, Norway, 25 September 2017; p. V05AT04A044. [Google Scholar]
  26. Wang, J.; Lv, Z.; Liang, Y.; Deng, L.; Li, Z. Fouling resistance prediction based on GA–Elman neural network for circulating cooling water with electromagnetic anti-fouling treatment. J. Energy Inst. 2019, 92, 1519–1526. [Google Scholar] [CrossRef]
  27. Ferreira, B.X.; Barbosa, C.R.H.; Cajaiba, J.o.; Kartnaller, V.; Santos, B.F. Development of Artificial Neural Network Models for the Simulation of a CaCO3 Scale Formation Process in the Presence of Monoethylene Glycol (MEG) in Dynamic Tube Blocking Test Equipment. Energy Fuels 2022, 36, 2288–2299. [Google Scholar] [CrossRef]
  28. Kamal, M.S.; Hussein, I.; Mahmoud, M.; Sultan, A.S.; Saad, M.A. Oilfield scale formation and chemical removal: A review. J. Pet. Sci. Eng. 2018, 171, 127–139. [Google Scholar] [CrossRef]
  29. Lakshmi, D.S.; Senthilmurugan, B.; Drioli, E.; Figoli, A. Application of ionic liquid polymeric microsphere in oil field scale control process. J. Pet. Sci. Eng. 2013, 112, 69–77. [Google Scholar] [CrossRef]
  30. Rumelhart, D.E.; Hinton, G.E.; Williams, R.J. Learning representations by back-propagating errors. Nature 1986, 323, 533–536. [Google Scholar] [CrossRef]
  31. Pääkkönen, T.M.; Riihimäki, M.; Simonson, C.J.; Muurinen, E.; Keiski, R.L. Modeling CaCO3 crystallization fouling on a heat exchanger surface—Definition of fouling layer properties and model parameters. Int. J. Heat Mass Transf. 2015, 83, 84–98. [Google Scholar] [CrossRef]
  32. Mishkhes, A.T.; AlSultan, F.A.; Al-Askar, M. Method and system for predicting caliper log data for descaled wells. U.S. Patent 11,753,926, 12 September 2023. [Google Scholar]
Figure 1. Scale samples from the target area’s wellbores.
Processes 12 00527 g001
Figure 2. Neural network training diagram.
Processes 12 00527 g002
Figure 3. Image of the neural network training process.
Processes 12 00527 g003
Figure 4. Illustrates the algorithmic flowchart.
Processes 12 00527 g004
Figure 5. Distribution diagram of BaSO4 scaling amounts under different SO42− ion concentrations.
Processes 12 00527 g005
Figure 6. Distribution diagram of CaCO3 scaling amounts under different HCO3 ion concentrations.
Processes 12 00527 g006
Figure 7. Distribution diagram of CaCO3 scaling amounts under different Ca2+ ion concentrations.
Processes 12 00527 g007
Figure 8. Distribution diagram of BaSO4 scaling amounts under different Ba2+ ion concentrations.
Processes 12 00527 g008
Figure 9. Distribution of wellbore diameter reduction rate under different SO42− concentrations.
Processes 12 00527 g009
Figure 10. Distribution of wellbore diameter reduction rate under different HCO3 concentrations.
Processes 12 00527 g010
Figure 11. Distribution of wellbore diameter reduction rate under different Ca2+ concentrations.
Processes 12 00527 g011
Figure 12. Distribution of wellbore diameter reduction rate under different Ba2+ concentrations.
Processes 12 00527 g012
Table 1. Research Zone 118 Wellbore Strata Water Quality Analysis Results Statistics (mg/L).
DataClSO42−HCO3Mg2+Ca2+Sr2+/Ba2+Na+/K+Salinity
Minimum27538.2358.799.024113.517.8322086110.5
Maximum5464.3269586.33173.981252.424525.5632,320.893,306.86
Average28,698.35138.6322.54591.502682.962271.717,264.449,708.68
Table 2. Determination Results of Water, Oil, and Organic Matter Content.
Well NameWell Depth, mWater Content, %Oil Content, %Organic Matter, %
W130000.591.8320.94
36000.623.0919.81
W235000.240.4425.33
41000.32.526.99
Table 3. Inorganic Content Determination Results.
Inorganic Mineral Composition, %
WellBaSO4FeCO3CaCO3Fe3O4MgCO3SiO2
W138.34.740.65.67.43.4
W228.54.950.65.16.74.2
Table 4. Partial Training Data.
WellsIon Concentration, mg/LT, °CP, MPaScale Amount, mg/L
ClSO42−HCO3Mg2+Ca2+Ba2+Na+SalinityBaSO4CaCO3
140,84319849877338224718,51662,7178111181.6106.4
243,56036511165243216674251,473891131.5110.9
333,870834151252811992264339,4098110153.2101.4
441,14219328711312371605897753,5547210181.6106.4
545,92167475712913751330553,8818811108.750.2
646,530110301171587385923,96275,5208513182.2107.4
742,14911742274177251216,91962,3707711177.7104.9
845,8891952981318892883637856,6637811181.6106.4
943,2153535342128197716,67962,429761168.821.1
1053,86092322100920156511,72368,5828211172.6101.5
1142,09061631568393891298150,0817413207.381.2
1243,5911128652718180531,39177,7557313176.9102.8
1338,875241262575031818,65458,6108513180.3106.5
1431,3001353451031220319823,17659,477788181.7105.7
1540,4321167576747312320,27164,8407214180.4105.6
1637,7702827185873304622,43764,510701117.9966.54
1741,3572828586949331824,58970,612701026.6565.53
1844,94327300871026359126,74176,715711235.3964.53
1948,53027314871103386328,89282,817751144.2463.53
2019,8363019782489168411,67933,99789136.3270.64
2123,4233021282566195713,83140,100891415.869.66
2227,0102922783642222915,98246,202881325.2868.68
2330,5962924184719250118,13452,305851334.7667.69
2434,1832825685796277420,28658,407851344.2766.7
2537,7702827185873304622,43764,510851353.8165.71
2641,3572828586949331824,58970,612851363.464.71
2744,94327300871026359126,74176,715871573.0463.72
2848,53027314871103386328,89282,817851482.7362.73
2931,60731253118748265718,64554,060731216.2873.26
3035,44631271127832296920,92460,601741128.4573.44
3139,28631289137916328023,20367,142741140.6373.62
3243,125313061461000359225,48373,683731152.8373.79
3346,965313241551084390327,76280,224741265.0773.96
3450,804313411651168421430,04186,766701077.3574.13
3520,0893120090496172311,80634,43685149.8971.82
3623,9283121899580203514,08640,977901322.8772.01
3727,76831236109664234616,36547,518901335.7872.19
3831,60731253118748265718,64554,060851448.6472.37
3935,44631271127832296920,92460,601901361.4672.55
4039,28631289137916328023,20367,142851374.2772.72
4143,125313061461000359225,48373,683871487.0872.89
4246,965313241551084390327,76280,224851599.8873.06
4350,804313411651168421430,04186,7669013112.6973.23
4452,37027332971187417431,17289,358571038.6473.97
4552,622273351051194421331,30089,79753934.4972.78
Table 5. Experimental data and model prediction data.
ScaleExperimentalTansigLogsigPurelinCommercial Software
CaCO3, mg/L73.6272.9168.7170.2674.98
73.7973.0453.2465.3470.21
73.9672.5373.5670.2175.62
74.1373.6165.4170.5377.69
BaSO4, mg/L40.6338.7430.2348.6738.62
52.8351.6768.6959.7449.67
65.0766.160.2160.2965.01
77.35676.5493.4187.6877.31
Table 6. Parameter values.
IonIon Concentration, mg/LTemperature, °CPressure, MPa
ClMg2+Na+Salinity
Value16,24911010,00031,00050–905–15
Table 7. Field data.
Daily Water ProductionGeothermal GradientWellbore Inner DiameterBaSO4 DensityCaCO3 DensityClMg2+Na+Salinity
650 m3/d3 °C/100 m0.062 m4000 kg/m32710 kg/m316,24911010,00031,000
Note: the unit of ion concentration and mineralization is mg/L.
Disclaimer/Publisher’s Note: The statements, opinions and data contained in all publications are solely those of the individual author(s) and contributor(s) and not of MDPI and/or the editor(s). MDPI and/or the editor(s) disclaim responsibility for any injury to people or property resulting from any ideas, methods, instructions or products referred to in the content.