Abstract
In the dynamic optimization problem of the distribution network, a dynamic reconstruction method based on a stochastic probability model and optimized beetle antennae search is proposed. By implementing dynamic reconstruction of distributed energy distribution networks, the dynamic regulation and optimization capabilities of the distribution network can be improved. In this study, a random probability model is used to describe the uncertainty in the power grid. The beetle antennae search is used for dynamic multi-objective optimization. The performance of the beetle antennae search is improved by combining it with the simulated annealing algorithm. According to the results, the optimization success rate of the model was 98.7%. Compared with the discrete binary particle swarm optimization algorithm and bacterial foraging optimization algorithm, it was 9.3% and 26.1% faster, respectively. For practical applications, this model could effectively reduce power grid transmission losses, with a reduction range of 16.7–18.6%. Meanwhile, the charging and discharging loads were effectively reduced, with a reduction range of 16.2–19.7%. Therefore, this method has significant optimization effects on actual power grid operation. This research achievement contributes to the further development of dynamic reconstruction technology for distribution networks, improving the operational efficiency and stability of the power grid. This has important practical significance for achieving green and intelligent operation of the power system.
1. Introduction
To address issues such as energy scarcity and environmental degradation, and to implement the sustainable development resource strategy, China is striving for energy transformation, building an energy supply and demand system centered on new energy sources such as solar and wind energy, and transitioning towards a renewable energy power system [1,2]. The power system can be divided into power generation, transformation, transmission, distribution, and consumption parts. As an intermediate link between the transmission system and users, the distribution network needs to ensure the reliability and quality of power supply. Unlike the transmission network, its voltage level is lower, resulting in greater network losses. Traditional distribution networks generally adopt closed-loop design and open-loop operation, with little active control over steady-state distribution networks [3]. Therefore, traditional distribution networks are also known as passive distribution networks. With the large-scale integration of distributed generation into the distribution network, system uncertainty and correlation factors have surged, posing higher requirements for research on distribution network reconstruction. The traditional static reconstruction of distribution networks only takes into account the real-time changes in system load under a single time section, so it is necessary to study the dynamic reconstruction problem of the continuous changes in system load throughout the entire continuous period [4]. Meanwhile, for distribution network systems that incorporate distributed energy, the dynamic optimization problem is extremely critical [5]. The dynamic reconstruction of the distribution network can effectively improve the operational efficiency of the power grid, reduce energy losses, and enhance the robustness of the power grid. However, it also involves multiple conflicting goals, such as the stability, efficiency, and reliability of the power grid.
The BAS algorithm, as an emerging optimization algorithm, has received widespread attention and application due to its excellent search ability and global optimization performance [6]. However, the BAS often faces problems such as slow convergence speed, low search efficiency, and susceptibility to becoming stuck in local optima when dealing with practical problems. Therefore, this study uses the simulated annealing (SA) algorithm to improve it to better serve the dynamic reconstruction problem of distribution networks. A stochastic probability model-based optimized BAS is proposed to solve the multi-objective dynamic reconstruction problem of distribution networks containing distributed energy. The random probability model and SA are introduced to improve the search efficiency and global optimization ability of the BAS. Meanwhile, considering the multi-objective nature of the distribution network, a suitable objective function is constructed to achieve comprehensive optimization of multiple objectives such as power grid stability, efficiency, and reliability.
There are three main aspects of innovation in research. Firstly, a random probability model is used to describe the uncertainty in the distribution network. Secondly, by constructing appropriate objective functions, the comprehensive optimization of multi-objective dynamic reconstruction problems in distribution networks can be achieved. Thirdly, the improved BAS is applied to the dynamic reconstruction problem of distribution networks containing distributed energy, which is an important extension of the application field for the BAS. This study provides an effective method and tool for solving the multi-objective dynamic reconstruction problem of distribution networks and provides theoretical support and technical support for the rational utilization of distributed energy and the optimized operation of the power grid. This study is divided into four parts. The first part summarizes the research on distribution network optimization and MOO. The second part is the implementation of the method proposed in this study. The third part validates the proposed method. The fourth part summarizes the research content.
2. Related Works
Distribution network optimization is a key technology for improving the performance and efficiency of power systems. Its main goal is to enhance the power system efficiency, reduce operating costs, and enhance system stability, reliability, and environmental protection by optimizing design and operational control. Yan M et al. proposed a dual-layer network constrained energy transmission model to optimize energy transmission in multiple microgrids, providing multiple distributed algorithms to obtain equilibrium. The effectiveness and practicality of this method was verified [7]. Singh P et al. proposed a two-layer optimization model for the optimal allocation problem of wind turbines and battery energy storage systems, aiming to maximize the renewable energy carrying capacity of the system. They used an improved African BAS. The optimization model and the improved African BAS could effectively improve the performance of active distribution systems [8]. Zhang Y et al. proposed a model-free optimization method based on multi-agent deep reinforcement learning for voltage reactive power optimization problems in unbalanced distribution systems. A carefully designed reward function guided the interaction between agents and distribution systems to simultaneously enhance voltage regulation and reduce energy loss. Numerical simulations verified the excellent performance of this method in voltage regulation and energy loss reduction [9]. Shaheen M A M et al. applied a hybrid method of grey wolf optimization and particle swarm optimization (PSO) to the optimal reactive power scheduling problem in power networks. PSO was integrated with grey wolf optimization to improve the performance. The reliability of the hybrid model in finding the global optimal solution was verified [10]. M. S. Javed et al. proposed an optimization method based on an energy storage strategy for the optimization of the renewable energy power supply system in remote islands, considering the economy at the same time. The simulation experiment results proved the effectiveness of the optimization method [11]. M. Sarwar et al. proposed a method based on a hybrid group optimization strategy to solve the network congestion problem of the power system. Through the combination of particle swarm optimization and linear decreasing population technology, simulation experiment results proved its mitigation ability for grid congestion [12]. Q. Hassan proposed a power grid evaluation and optimization scheme based on an off-grid grid connection mode to solve the cost control problem of conventional household photovoltaic systems. The simulation results showed that this method effectively improved the quality of power grids and reduced energy costs [13].
Multi-objective optimization problem is an important field in the field of optimization, which involves finding the optimal solution when considering two or more conflicting objectives. This problem is very common in practical life, such as in engineering design, economic decision-making, resource allocation, etc. In MOO problems, there are usually multiple objective functions that are often contradictory or conflicting with each other. For example, in mechanical design, the performance, cost, and durability of the product may be considered simultaneously. However, improving product performance may increase costs or reduce durability, which is a typical feature of MOO. Abdullah Zadeh et al. developed an MOO solution based on Harris Hawks and Fruitfly optimization for feature selection problems in data mining. It had a promising performance on the dataset [14]. Ma H et al. proposed a multi-stage evolutionary algorithm for MOO problems with complex constraints. The proposed algorithm performed better than several advanced constrained multi-objective evolutionary algorithms when dealing with MOO problems with complex constraints [15]. Wei W et al. modeled the challenges of safety, mobility, environment, and spatial limitations in modern transportation as an MOO problem aimed at maximizing acceptance rates and minimizing provider cloud costs. The simulation results indicated that this method outperformed previous methods in terms of performance [16]. Wang F et al. proposed a new prediction method for dynamic MOO problems. The Gaussian mixture model was combined with the MOEA/D framework to predict new Pareto sets when changes occurred. Experimental results showed that this method performed better in most cases [17]. Zhang D et al. proposed an MOO model that reflected the interests and preferences of multiple parties for the coordinated implementation of demand response technology and dynamic energy prices in intelligent integrated energy systems. The case study validated the effectiveness of this method [18]. Aiming at the problem that the high-pressure side performance of the pump wheel could be easily affected by environmental factors, Y. Qin et al. proposed a multi-objective optimization design scheme, and the simulation experiment results proved that this method effectively improved the operating efficiency [19]. F. Zou et al. proposed a multi-objective optimization strategy method based on reinforcement learning, aiming at the challenge of dynamic factors existing in conventional multi-objective optimization problems, and the experimental results proved the effectiveness of this method for multi-objective optimization strategy adjustment [20]. R. V. Rao and H. S. Keesari proposed an improved multi-objective optimization algorithm for the performance optimization challenge of the solar auxiliary engine system, which did not require specific parameters, and the experimental results proved the excellent performance of this method in engineering applications [21].
In summary, there is a lack of further application of emerging algorithm models in distribution network optimization problems. The optimization effects need to be improved. In current MOO problems, better optimization results can often be achieved through optimizing algorithm models. Therefore, this study first models the uncertainty in distributed energy grids by constructing a random probability pair model and uses probabilistic Power Flow Calculation (PFC) to accurately describe and process the uncertainty in the power grid. Subsequently, a new strategy is adopted to address the shortcomings of the BAS algorithm, such as low search efficiency and slow convergence speed, by introducing the SA algorithm for improvement and combining it with the particle swarm optimization algorithm to obtain the final improved multi-objective Taurus algorithm. This study not only provides a new algorithm model for distribution network optimization problems but also provides effective solutions for dynamic reconstruction of distribution networks. It has important theoretical significance and practical application value for improving the intelligence and modernization level of the power system.
3. Construction of a Multi-Objective Reconstruction Model for Distributed Energy Distribution Networks
In the context of distributed energy, the multi-objective reconstruction of distribution networks has become an important research topic. The random probability model is used to describe the uncertainty in the distribution network. Combined with the BAS, a global search can be performed to further improve the optimization effect. However, the BAS itself also has some limitations, such as slow convergence speed and low search efficiency. Therefore, the SA is used to optimize the BAS, which can improve its search efficiency and global optimization performance. The above model construction is expected to effectively solve the multi-objective reconstruction problem of distributed energy distribution networks, improve the operational efficiency of power systems, and provide theoretical support for the rational utilization of distributed energy.
3.1. Random Probability Model Construction for Distribution Networks
To accurately describe and handle the uncertainty in distributed energy distribution networks, the stochastic probability in distributed energy distribution networks is modeled. In distributed energy distribution networks, there are a large number of uncertain factors, such as load fluctuations, changes in distributed energy production capacity, and fluctuations in electricity market prices [22]. These uncertain factors have significant impacts on the operational performance and economic benefits of the power grid [23]. Therefore, effective modeling and processing of these uncertain factors have become a key step in improving the performance of distribution networks. Random probability models provide an effective tool for describing and handling these uncertain factors [24]. Specifically, these uncertain factors can be considered random variables. A suitable probability distribution model is established, which can effectively describe and process it. For example, the normal distribution model is adopted to describe fluctuations in load and distributed energy production capacity. The logarithmic normal distribution model can be applied to describe fluctuations in electricity market prices. In distributed energy distribution networks, random probabilities are modeled to more accurately describe and handle uncertainties in the power grid. Firstly, the stochastic probability of wind power generation in the distribution network is modeled. Normally, in wind power generation, the wind speed approximately follows a Weibull distribution, as shown in Formula (1).
In Formula (1), represents the wind speed. and represent Weibull distribution parameters [25]. If the output active power of the wind turbine is , the relationship between and is specifically shown in Formula (2).
In Formula (2), refers to the rated power. represents the wind speed at which the fan cuts in. refers to the rated wind speed of the fan. refers to the wind speed at which the fan cuts out. Combining Formulas (1) and (2), the probability distribution of can be derived, as shown in Formula (3).
In Formula (3), , and . Then, the stochastic probability of photovoltaic power generation in distributed energy is modeled. In most cases, the light intensity in photovoltaic power generation follows a Beta distribution, as shown in Formula (4) [26].
In Formula (4), represents the actual illumination intensity. is the ideal maximum light intensity. represents the gamma function. and represent beta distribution parameters. If the output active power in photovoltaic power generation is , the relationship between and is specifically shown in Formula (5).
In Formula (5), represents the total area of photovoltaic power generation. represents the photoelectric conversion efficiency. represents the number of photovoltaic power generation modules. According to Formula (4) and Formula (5), the random probability distribution of can be derived based on normal distribution, as shown in formula (6).
In Formula (6), represents the maximum output power. For the random probability of system load, a normal distribution is usually used to describe it, as shown in Formula (7).
In Formula (7), represents the active power of the system load. represents the expected active power. refers to the active power standard deviation of the load. The reactive power of the load is shown in Formula (8).
In Formula (8), represents the load power factor angle. Facing the uncertainty problem in the power distribution network, the research adopts the method of PFC, the transmission of the power distribution network, and the system running situation of precise calculation, to effectively cope with the uncertainty problem of the institute of obstacles. PFC is an important method in power system analysis, which is particularly suitable for dealing with various uncertainties in power systems, such as load fluctuations, electricity market prices, and the output of distributed energy [27]. Compared with traditional deterministic PFC, PPFC can provide more comprehensive and in-depth system operation information [28]. Based on the established probability model of uncertain factors, the Monte Carlo method is applied for PPFC [29]. The Latin hypercube sampling in the Monte Carlo method is shown in Figure 1 [30].
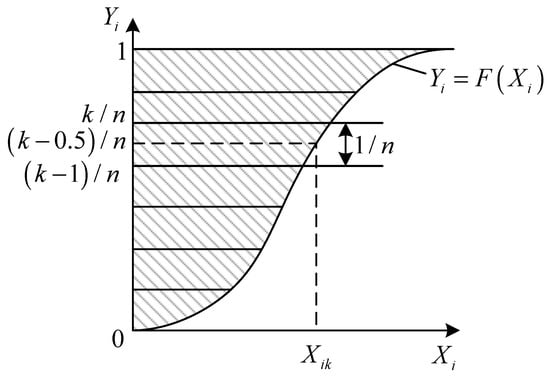
Figure 1.
Latin hypercube sampling diagram.
Figure 1 shows the Latin hypercube sampling with input random variables. In this process, the input random variable is . If is the -th random variable, each input variable is sampled to obtain samples, is the probability distribution function of . is further divided into intervals on average. For example, . For , its corresponding -th sampling value is , as shown in Formula (9).
In Formula (9), represents the inverse function of , , and . The significance of the inverse function here is to transform the probability density function and convert the original data into data with a specific distribution through the equal-rank method for further calculation. After sampling all input variables times, an -order sample matrix can be obtained. Figure 2 is a flow calculation process for random variables in distributed energy distribution networks.
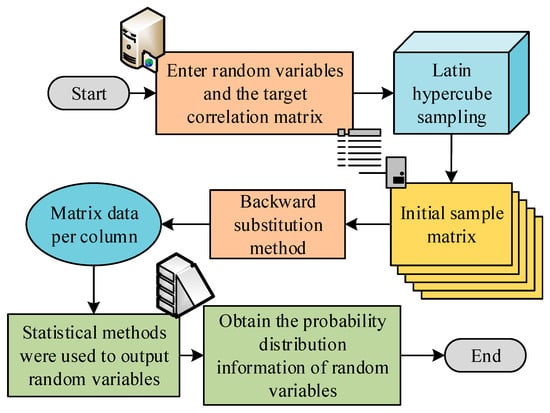
Figure 2.
Flow diagram of random variable power flow calculation in distributed energy distribution network.
PPFC for distribution networks can more accurately describe and handle uncertainties in the power grid. It also provides more comprehensive and in-depth information for the operation control and optimization decision-making of the power grid, thereby improving the operational efficiency and economy of the power system.
3.2. Construction of BAS Algorithm for Distribution Network Optimization
The MOO of distribution networks involves multiple conflicting objectives and requires searching on a global scale. Traditional optimization algorithms often find it difficult to obtain satisfactory solutions. Therefore, the BAS is selected. The BAS is a heuristic global optimization method originating from the biological heuristic algorithms, inspired by the predation behavior of antenna beetles [25]. It has good global search ability and stability. It has obvious advantages in dealing with complex MOO problems [26]. The BAS searches for the solution space by simulating the predation behavior of antenna beetles. The BAS generates a new set of solutions. The advantages and disadvantages of the newly generated solution and the current optimal solution are compared. The current optimal solution is updated [27]. Based on this approach, the BAS can continuously search for better solutions, thereby finding the optimal solution on a global scale. The BAS is used for MOO of distribution networks, which can fully utilize its excellent search ability and global optimization performance. It helps to find satisfactory solutions and improve the operational efficiency and reliability of the distribution network. To be applied to practical problems, the BAS extends the motion characteristics of longhorn beetles in their foraging behavior from three dimensions to multiple dimensions. It is simplified and abstracted to obtain a mathematical model [28]. In the BAS, each solution is considered as an antenna of a beetle. The quality of the solution corresponds to the position of the antennae of the beetle in space. By simulating the movement and exploration process of the antennae of the beetle in multidimensional space, the BAS can search globally and find satisfactory solutions [29]. Specifically, the BAS first randomly generates a set of solutions. Then, the advantages and disadvantages of these solutions are evaluated. The optimal solution is selected as the current optimal solution [30]. Then, the algorithm generates a new set of solutions around the current optimal solution. The advantages and disadvantages of the newly generated solution and the current optimal solution are compared. Then the current optimal solution is updated. Through this approach, the BAS can continuously search for better solutions, thereby finding the optimal solution on a global scale [31,32,33,34,35,36]. The search principle and abstract model of the longhorn beetle are shown in Figure 3.
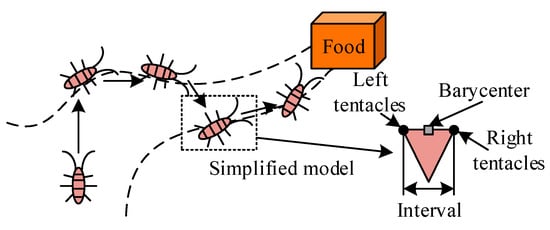
Figure 3.
Schematic diagram of the search food principle and abstract model of beetle.
Firstly, the centroid of the beetle is a fixed point, with its antennae located on either side of that point. Then the search step of the beetle is , and the distance between the two antennae is . The ratio between the two is fixed, as shown in Formula (10).
In Formula (10), is a fixed proportion. If a longhorn beetle engages in foraging behavior in the dimension, its direction of travel is disordered. For each step forward, it will face a random vector, as shown in Formula (11).
In Formula (11), represents the vector towards which the beetle faces. represents generating -dimensional random vectors. After obtaining the random direction vector, the coordinates of the left and right antennae of the beetle are further defined, as shown in Formula (12).
In Formula (12), represents the position coordinate of the left tentacle at . represents the position coordinate of the right tentacle at . represents the centroid position of the beetle at . represents the distance between two tentacles after iterations. The beetle perceives the odor concentration of its prey through its left and right antennae and further confirms the direction and position of the next generation of beetles. The updated position is shown in Formula (13).
In Formula (13), represents the odor concentration, which can also be referred to as the fitness function. The optimal position of this function is where the odor is located. represents a symbolic function. represents the search step size of the beetle in the -th iteration. For the BAS, the step size has a significant impact on the optimization ability. When the step size is large, it is more suitable for global search. Therefore, it is necessary to set the step size update strategy to improve its local optimization ability, as displayed in Formula (14).
In Formula (14), represents the attenuation coefficient. By combining the above constructed formula, the optimized motion of the BAS can be obtained, as displayed in Figure 4.
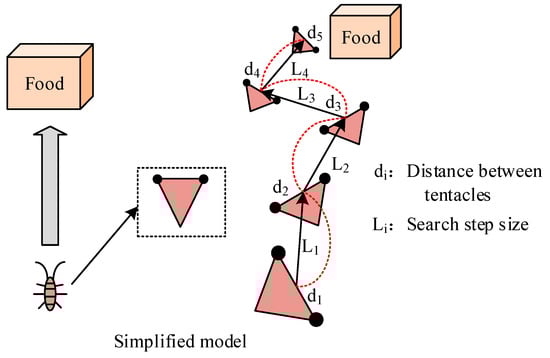
Figure 4.
Schematic diagram of the optimization movement of beetle.
Figure 4 shows the optimized motion of the longhorn beetle. However, although the BAS has shown certain advantages in dealing with MOO problems, it often faces problems such as poor convergence speed, low search efficiency, and ease of falling into local optima when dealing with some complex problems. Therefore, the BAS is further optimized.
3.3. Construction of Multi-Objective Optimization MTTA
To address these issues, a new strategy is adopted in this study, which is to introduce the SA to improve the BAS. The SA is a probabilistic search algorithm inspired by the solid-state annealing process, which simulates the temperature drop and energy minimization during the solid-state annealing process to find the global optimal solution. During the search process, the SA accepts solutions that are better than the current solution. It also has a certain probability of accepting worse solutions, thereby avoiding falling into local optima. Therefore, the SA is introduced into the BAS, which can effectively avoid becoming stuck in local optima, improve search efficiency, and accelerate convergence speed, finding better solutions on a global scale. This improvement strategy provides new possibilities for dealing with complex MOO problems. It is expected to achieve better application results in practical problems. According to the Metropolis criterion, if the energy in state is , then the energy in the next state is . The probability is specifically shown in Formula (15).
When this criterion is introduced into the BAS algorithm, corresponds to the fitness value of in the previous iteration, and corresponds to the fitness value of in the current iteration. The probability of accepting poorer solutions in the BAS optimization is shown in Formula (16).
In Formula (16), represents the annealing temperature. Finally, the improved SA-BAS flow is shown in Figure 5.
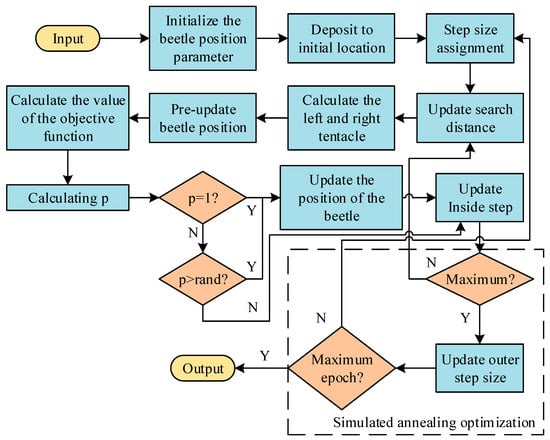
Figure 5.
Flow diagram of SA-BAS algorithm.
However, in the SA-BAS, there is only one beetle, which limits its search ability. The search space for solutions may not be fully explored, especially when dealing with high-dimensional and complex optimization problems. The search ability of a single beetle may be more limited. Therefore, this study combines the PSO model to further construct the beetle antennae swarm algorithm. PSO is a swarm intelligence optimization algorithm that simulates the foraging behavior of bird flocks to achieve a global search of the solution space. The PSO can utilize collective collaborative search to effectively explore the solution space and find the global optimal solution. When constructing the beetle antennae swarm algorithm, the multiple beetle antennae swarm is first considered as a group. Then, the speed and position update rules in the particle swarm model are introduced to adjust the search behavior of the beetle antennae swarm. Specifically, each beetle adjusts its search direction and stride based on its own search experience and the optimal experience of the entire population. Based on this approach, the beetle antennae swarm can collaborate in a vast solution space, thereby improving search efficiency and finding better solutions. Figure 6 shows the flowchart of the improved Multi-target Tenox algorithm (MTTA).
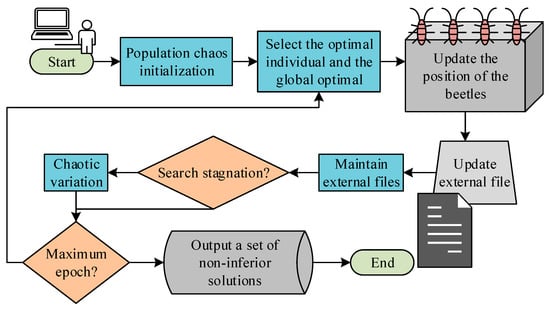
Figure 6.
Schematic diagram of the flow of Multi-target Tenox algorithm.
The introduced chaotic disturbances play a very important role in the MTTA process. Its main purpose is to make the initial beetle antennae population distribution more uniform and enhance the global search ability. The initial population of MTTA is randomly generated in the solution space. If the initial population distribution is uneven, it may cause the algorithm to fall into local optima in early iterations, thereby affecting the search for global optimal solutions. Chaos perturbation is an optimization strategy based on chaos theory, which can make the initial population distribution more uniform in the solution space. Chaos theory is a theory used to study the behavior of complex nonlinear systems, characterized by its extreme sensitivity to initial conditions. Chaotic perturbation is introduced into optimization problems, which utilizes the characteristics of chaotic mapping to make the changes in the solution chaotic through small perturbations, thereby enhancing the randomness and globality of the search. Specifically, chaotic disturbance can be achieved through the following steps. Firstly, after the initial population is generated, a chaotic value is generated for each beetle through chaotic mapping. Then, this chaotic value is added as a disturbance to the beetle position. In this way, the beetle position has a certain degree of randomness and uncertainty. The chaotic disturbance is introduced, which can effectively prevent the algorithm from falling into local optima too early, enhance the global search ability, and improve the quality of solutions and algorithm performance. In this study, logistic mapping is used for chaotic perturbation, as shown in Formula (17).
In Formula (17), and are the current value and the next value, respectively. refers to iterations. refers to the control parameter. Based on this algorithm, the IEEE-33 node is used for reconstruction simulation experiments to test and verify its effectiveness and practicality in actual power grid systems. Node 15 is selected to connect to the wind turbine, and its rated power is set to 500 kW, the inset wind speed is set to 3 m/s, the rated wind speed is set to 13 m/s, and the cut wind speed is set to 20 m/s. Node 30 is selected to access the optical power generation equipment, the rated power is set to 500 kW, the total power generation area to 4320 m2, and the photoelectric conversion efficiency to 15%. The specific IEEE-33 node system is shown in Figure 7.
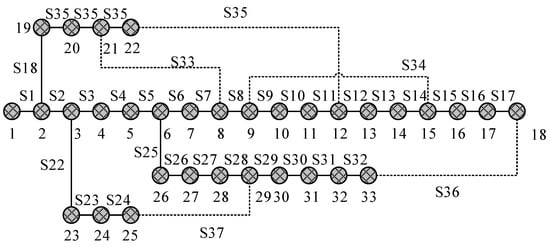
Figure 7.
Schematic diagram of IEEE-33 node system.
Finally, the improved MTTA is applied to effectively solve the multi-objective dynamic reconstruction problem of distribution networks containing distributed energy. This algorithm utilizes the SA strategy to enhance the global search ability, avoid becoming stuck in local optimal solutions, and further improve the efficiency and quality of search. Meanwhile, the MTTA is based on a stochastic probability model. It fully considers the uncertainty of loads, distributed energy production capacity, etc., in the distribution network, making the solution more practical and adaptable. In addition, the algorithm takes into account the MOO needs of the power grid during the processing, such as stability, efficiency, and reliability, providing an effective tool for achieving comprehensive optimization of the power grid.
4. Testing and Validation of Multi-Objective Reconstruction MTTA for Distribution Networks
To test the effectiveness and practicality of the proposed MTTA, considering the economy and convenience, the cloud server platform provided by Amazon was used for experiments to avoid the performance of the testing platform affecting the model. Based on this cloud server platform, the IEEE-33 node was used for simulating the performance of power grid optimization and reconstruction. The Discrete Binary Particle Swarm Optimization Algorithm (BPSO) and Bacterial Foraging Optimization Algorithm (BFOA) were compared with the proposed MTTA algorithm to test the performance. The parameters of the MTTA algorithm were configured. The population size was set to 50. The maximum epoch number was set to 150. The field size was set to 20% of the population size. The selection probability was set to 0.9. The mating probability was set to 0.8. The mutation probability was set to 0.1. The archive set size was set to 50. For the BPSO algorithm, the parameters were set as follows: the population size was set to 50, and the maximum epoch number was set to 150. The inertia weight was set to 0.9, the individual cognitive parameter was set to 2, social cognitive parameters were set to 2, the speed limit ranged from −4 to 4, and the location update threshold was set to 0.5. Regarding the BFOA algorithm, the parameters were set as follows: the population size was set to 50, the swing step was set to 7, the life cycle was set to 15 generations, and the replication step was set to 0.5 lifecycle. The diffusion extinction probability was set to 0.5 and the chemical attraction was set to 0.8. In these configurations, the objective function of the MTTA algorithm aimed to minimize loss, reduce investment and operation costs, and maximize network reliability. The objective function of the BPSO algorithm was focused on minimizing loss, while the BFOA algorithm aimed to minimize operating costs and losses.
Firstly, the corresponding computing resources were configured on the cloud server, and the IEEE-36 node power grid model was set up. For transmission loss data, the calculation of line loss and transformer loss was evaluated: the loss and load during each operation were recorded by the grid simulation software. For the average convergence performance, the minimum improvement value of the algorithm was obtained by setting the stopping condition of the algorithm. The value of the objective function was calculated after each iteration of the model, and its mean and standard deviation were calculated. The success rate of optimization was calculated by setting the threshold of finding the global optimal solution. The ratio of the number of times the algorithm satisfied the condition to the total number of runs was analyzed and recorded. For grid reconstruction time, the time interval between the request being issued and the grid completing the reconstruction was recorded. Table 1 describes the hardware and software configuration details.

Table 1.
Hardware and software configuration details.
The iterative performance of the three models was tested, and the test index was the transmission loss and the load of the grid output by the three models in the iterative process. The Transmission loss/Kw refers to the power loss of the grid during transmission, and the Load/Kw refers to the load of the power grid. The epoch indicates the number of iterations. The test results are shown in Figure 8. From Figure 8a, the proposed MTTA model had the best iterative performance. Its convergence speed was better. It achieved optimal current loss at a faster speed. From Figure 8b, the proposed MTTA model had the best convergence performance, with a lower peak load and the ability to reach the optimal load value at a faster speed.
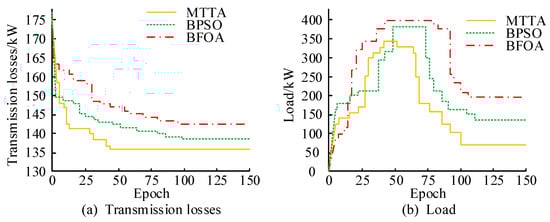
Figure 8.
Iterative performance testing of three models.
The convergence performance of the three models was tested. To ensure that the errors in the test did not affect the experimental conclusions, each model was tested five times. The test results are shown in Table 2. Mean indicates the mean of convergence performance, and Standard indicates the standard deviation of convergence performance. From Table 2, the MTTA had the best convergence performance. Its average convergence performance was 0.000581. Compared with the BPSO model and BFOA model, it was 0.00004508 and 0.00040939 faster, respectively. The standard deviation of the MTTA model’s convergence performance was 0.000006012. Compared with the BPSO model and BFOA model, it was 0.0004771 and 0.00028803 faster, respectively.
Table 2.
Convergence performance test of three models.
The three-dimensional spatial solution sets of three models were tested and compared. The dimensions specifically included transmission loss, voltage deviation, and load balancing. Load balancing indicates the balance of the overall load of the power grid, Voltage deviation indicates the deviation of the output voltage of the power grid, and Transmission losses indicate the losses of the power grid during transmission. The test results are shown in Figure 9. From Figure 9, the proposed MTTA model obtained a larger set of solutions for the three objective optimization problems. It covered a wider solution space, with better diversity of types.
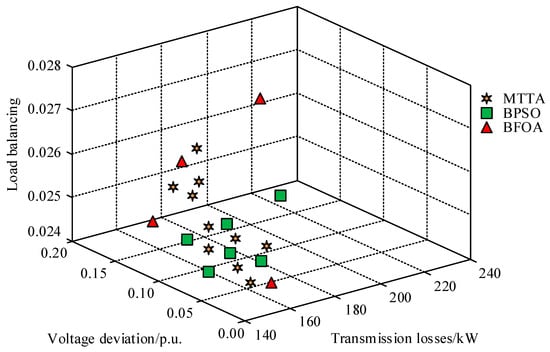
Figure 9.
Three-dimensional space solution set test of three kinds of models.
The optimization success rates of the three models were tested. The test results are shown in Table 3. Min represents the minimum number of iterations, Max represents the maximum number of iterations, and Ave represents the average number of iterations. From Table 3, the proposed MTTA model had the best optimization success rate of 98.7%, which was 9.3% and 26.1% higher than the BPSO model and BFOA model, respectively.
Table 3.
The optimization success rate test of three models.
The reconstruction time of three models was tested, including model response time and reconstruction time. The test results are shown in Figure 10. Corresponding time indicates the response time of the model, and Reconstruction time indicates the reconstruction time of the model. From Figure 10a, the proposed MTTA model had the best response time of 0.41 s. Compared with the BPSO model and BFOA model, it was 0.72 s and 0.93 s faster, respectively. From Figure 10b, the proposed MTTA model had the best reconstruction time of 0.83 s. Compared with the BPSO model and BFOA model, it was 0.24 s and 0.62 s faster, respectively.
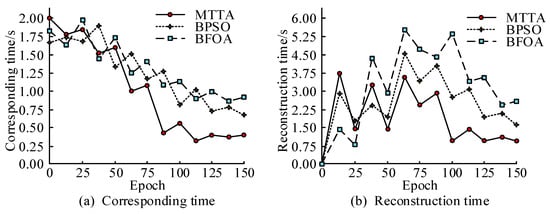
Figure 10.
Reconfiguration time test of three models.
The reconstruction performance of three models was tested. The test content is the transmission loss of the power grid before and after reconstruction. The test results are shown in Figure 11. From Figure 11, the proposed MTTA algorithm could effectively reduce power grid transmission losses, with a reduction range of 16.7–18.6%, far higher than the BPSO model and BFOA model.
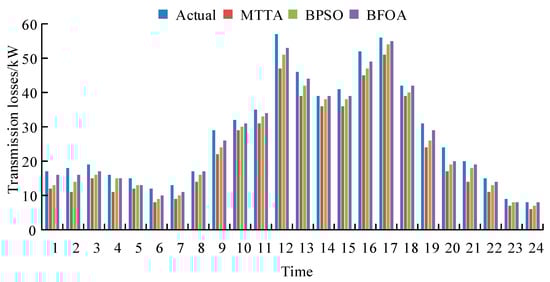
Figure 11.
Test of the influence of the reconstruction of three models on transmission loss.
The charging and discharging loads before and after the reconstruction of the three models were tested. The test results are shown in Figure 12. The charging load indicates the charging load of the power grid, and the discharge load indicates the discharge load of the power grid. From Figure 12, after reconstructing the MTTA model, the charging and discharging loads were effectively reduced. The reduction rate reached 16.2–19.7%.
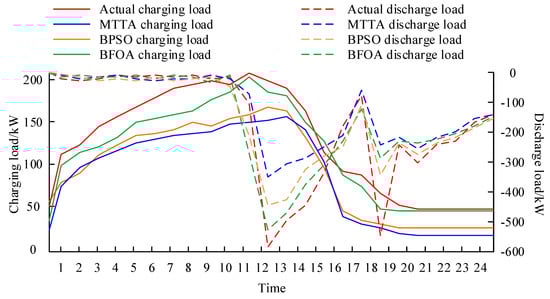
Figure 12.
Test of the influence of the reconstruction of three models on charge and discharge load.
In summary, these results demonstrated that the MTTA model had good optimization performance. This method performed well in solution diversity, quality, and optimization success rate. Moreover, significant results could also be achieved in practical power grid optimization problems. Therefore, the MTTA model had a high application value. It is worth further exploration and application in future research and practical problems.
5. Conclusions
In the context of energy scarcity, to further achieve the intelligence and greening of the power grid, the dynamic reconstruction of the distribution network is of great significance. Therefore, a multi-objective dynamic reconstruction method based on a random probability model and an optimized BAS is proposed in this paper. In MOO problems, the MTTA model exhibited good convergence performance and diversity of types. The number and quality of solution sets obtained were superior to other comparative models. Specifically, the quota MTTA algorithm proposed by the research institute had the best convergence performance, with an average convergence performance of 0.000581, which was 0.00004508 and 0.00040939 ahead of the BPSO model and BFOA model, respectively. The success rate of optimization reached 98.7%. In terms of response time, the MTTA model also showed advantages, with a response time of 0.41s. In terms of results, the MTTA model showed significant advantages in practical applications. It could effectively reduce the transmission loss of the power grid, with a reduction range of 16.7–18.6%. Meanwhile, the charging and discharging loads were effectively reduced, with a reduction range of 16.2–19.7%. The proposed MTTA model provided an effective optimization method for the dynamic reconstruction of distribution networks. The proposed method is more suitable for solving reconstruction problems, and the dynamic reconstruction period division method is more accurate and simpler. These works have certain positive significance for promoting the practical application of distribution network reconstruction. However, the model testing in this study lacks testing in more complex environments, and in the future, efforts should be made to improve the robustness of the model.
Author Contributions
Conceptualization, X.Y., N.T. and X.X.; Formal analysis, Y.L. and P.T., Funding acquisition, X.Y. and N.T., Investigation, Y.L.; Methodology, Y.L.; Project administration, N.T., Software, Y.L.; Supervision, X.Y., N.T., P.T. and X.X., Validation, Y.L.; Visualization, P.T. and X.X.; Writing—original draft, Y.L.; Writing review & editing. Y.L., N.T. and P.T. All authors have read and agreed to the published version of the manuscript.
Funding
The National Natural Science Foundation of China (Grant Numbers: 61601212, 52177047) and the Liaoning Provincial Department of Education Foundation (Grant Numbers: LJ2019JL011, LJ2017QL012).
Institutional Review Board Statement
Not applicable.
Informed Consent Statement
Not applicable.
Data Availability Statement
Data are contained within the article.
Conflicts of Interest
The authors declare no conflict of interest.
References
- Azizi, R.; Noroozian, R. Islanding detection in distributed energy resources based on gradient boosting algorithm. IET Renew. Power Gener. 2021, 15, 436–451. [Google Scholar] [CrossRef]
- Morales Pedraza, J. The Role of Renewable Energy in the Transition to Green, Low-Carbon Power Generation in Asia. Green Low-Carbon Econ. 2023, 1, 68–84. [Google Scholar] [CrossRef]
- Fang, X.; Wang, W. Transmission-and-distribution dynamic co-simulation framework for distributed energy resource frequency response. IEEE Trans. Smart Grid 2021, 13, 482–495. [Google Scholar]
- Jiang, Y.; Yang, Y.; Tan, S.-C.; Hui, S.-Y.R. Distribution power loss mitigation of parallel-connected distributed energy resources in low-voltage DC microgrids using a lagrange multiplier-based adaptive droop control. IEEE Trans. Power Electron. 2021, 36, 9105–9118. [Google Scholar] [CrossRef]
- Li, Z.; Li, S.; Luo, X. Using quadratic interpolated beetle antennae search to enhance robot arm calibration accuracy. IEEE Robot. Autom. Lett. 2022, 7, 12046–12053. [Google Scholar] [CrossRef]
- Ghosh, T.; Martinsen, K. A collaborative beetle antennae search algorithm using memory based adaptive learning. Appl. Artif. Intell. 2021, 35, 440–475. [Google Scholar] [CrossRef]
- Yan, M.; Shahidehpour, M.; Paaso, A.; Zhang, L.; Alabdulwahab, A.; Abusorrah, A. Distribution network-constrained optimization of peer-to-peer transactive energy trading among multi-microgrids. IEEE Trans. Smart Grid 2020, 12, 1033–1047. [Google Scholar] [CrossRef]
- Singh, P.; Meena, N.K.; Slowik, A.; Bishnoi, S.K. Modified african buffalo optimization for strategic integration of battery energy storage in distribution networks. IEEE Access 2020, 8, 14289–14301. [Google Scholar] [CrossRef]
- Zhang, Y.; Wang, X.; Wang, J.; Zhang, Y. Deep reinforcement learning based volt-var optimization in smart distribution systems. IEEE Trans. Smart Grid 2020, 12, 361–371. [Google Scholar] [CrossRef]
- Shaheen, M.A.; Hasanien, H.M.; Alkuhayli, A. A novel hybrid GWO-PSO optimization technique for optimal reactive power dispatch problem solution. Ain Shams Eng. J. 2021, 12, 621–630. [Google Scholar] [CrossRef]
- Javed, M.S.; Ma, T.; Jurasz, J.; Canales, F.A.; Lin, S.; Ahmed, S.; Zhang, Y. Economic analysis and optimization of a renewable energy based power supply system with different energy storages for a remote island. Renew. Energy 2021, 164, 1376–1394. [Google Scholar] [CrossRef]
- Prashant; Sarwar; Siddiqui, A.S.; Ghoneim, S.S.M.; Mahmoud, K.; Darwish, M.M.F. Effective transmission congestion management via optimal DG capacity using hybrid swarm optimization for contemporary power system operations. IEEE Access 2022, 10, 71091–71106. [Google Scholar] [CrossRef]
- Hassan, Q. Evaluation and optimization of off-grid and on-grid photovoltaic power system for typical household electrification. Renew. Energy 2021, 164, 375–390. [Google Scholar] [CrossRef]
- Abdollahzadeh, B.; Gharehchopogh, F.S. A multi-objective optimization algorithm for feature selection problems. Eng. Comput. 2022, 38, 1845–1863. [Google Scholar] [CrossRef]
- Ma, H.; Wei, H.; Tian, Y.; Cheng, R.; Zhang, X. A multi-stage evolutionary algorithm for multi-objective optimization with complex constraints. Inf. Sci. 2021, 560, 68–91. [Google Scholar] [CrossRef]
- Wei, W.; Yang, R.; Gu, H.; Zhao, W.; Chen, C.; Wan, S. Multi-objective optimization for resource allocation in vehicular cloud computing networks. IEEE Trans. Intell. Transp. Syst. 2021, 23, 25536–25545. [Google Scholar] [CrossRef]
- Wang, F.; Liao, F.; Li, Y.; Wang, H. A new prediction strategy for dynamic multi-objective optimization using Gaussian Mixture Model. Inf. Sci. 2021, 580, 331–351. [Google Scholar] [CrossRef]
- Zhang, D.; Zhu, H.; Zhang, H.; Goh, H.H.; Liu, H.; Wu, T. Multi-objective optimization for smart integrated energy system considering demand responses and dynamic prices. IEEE Trans. Smart Grid 2021, 13, 1100–1112. [Google Scholar] [CrossRef]
- Qin, Y.; Li, D.; Wang, H.; Liu, Z.; Wei, X.; Wang, X. Multi-objective optimization design on high pressure side of a pump-turbine runner with high efficiency. Renew. Energy 2022, 190, 103–120. [Google Scholar] [CrossRef]
- Zou, F.; Yen, G.G.; Tang, L.; Wang, C. A reinforcement learning approach for dynamic multi-objective optimization. Inf. Sci. 2021, 546, 815–834. [Google Scholar] [CrossRef]
- Rao, R.V.; Keesari, H.S. Rao algorithms for multi-objective optimization of selected thermodynamic cycles. Eng. Comput. 2021, 37, 3409–3437. [Google Scholar] [CrossRef]
- Zhang, R.; Hredzak, B.; Fletcher, J. Dynamic aggregation of energy storage systems into virtual power plants using distributed real-time clustering algorithm. IEEE Trans. Ind. Electron. 2020, 68, 11002–11013. [Google Scholar] [CrossRef]
- Wang, B.; Zhang, C.; Li, C.; Yang, G.; Dong, Z.Y. Transactive energy sharing in a microgrid via an enhanced distributed adaptive robust optimization approach. IEEE Trans. Smart Grid 2022, 13, 2279–2293. [Google Scholar] [CrossRef]
- Azevedo, L.; Paneiro, G.; Santos, A.; Soares, A. Generative adversarial network as a stochastic subsurface model reconstruction. Comput. Geosci. 2020, 24, 1673–1692. [Google Scholar] [CrossRef]
- Rouillard, V.; Lamb, M.J. Using the Weibull distribution to characterise road transport vibration levels. Packag. Technol. Sci. 2020, 33, 255–266. [Google Scholar] [CrossRef]
- Arab, I.; Oliveira, P.E.; Wiklund, T. Convex transform order of Beta distributions with some consequences. Stat. Neerl. 2021, 75, 238–256. [Google Scholar] [CrossRef]
- Wu, H.; Wang, M.; Xu, Z.; Jia, Y. Graph attention enabled convolutional network for distribution system probabilistic power flow. IEEE Trans. Ind. Appl. 2022, 58, 7068–7078. [Google Scholar] [CrossRef]
- Gupta, N. Probabilistic optimal reactive power planning with onshore and offshore wind generation, EV, and PV uncertainties. IEEE Trans. Ind. Appl. 2020, 56, 4200–4213. [Google Scholar] [CrossRef]
- Bin, L.; Abbas, R.; Shahzad, M.; Safdar, N. Probabilistic Load Flow Analysis Using Nonparametric Distribution. Sustainability 2023, 16, 240. [Google Scholar] [CrossRef]
- Xie, X.; Xie, B.; Cheng, J.; Chu, Q.; Dooling, T. A simple Monte Carlo method for estimating the chance of a cyclone impact. Nat. Hazards 2021, 107, 2573–2582. [Google Scholar] [CrossRef]
- Gao, Z.; Liu, Y.; Li, N.; Ma, K. An enhanced beetle antennae search algorithm based comprehensive water quality index for urban river water quality assessment. Water Resour. Manag. 2022, 36, 2685–2702. [Google Scholar] [CrossRef]
- Wang, P.; Li, G.; Gao, Y. A compensation method for gyroscope random drift based on unscented Kalman filter and support vector regression optimized by adaptive beetle antennae search algorithm. Appl. Intell. 2023, 53, 4350–4365. [Google Scholar] [CrossRef]
- Li, G.; Xue, Y.; Qu, C.; Qiu, D.; Wang, P.; Liu, Q. Intelligent prediction of rockburst in tunnels based on back propagation neural network integrated beetle antennae search algorithm. Environ. Sci. Pollut. Res. 2023, 30, 33960–33973. [Google Scholar] [CrossRef] [PubMed]
- Mo, X.; Ge, W.; Zhao, D.; Shen, Y. Path and function synthesis of multi-bar mechanisms using beetle antennae search algorithm. Filomat 2020, 34, 5215–5233. [Google Scholar] [CrossRef]
- Zhou, J.; Li, S.; Yan, W.; Ji, Y.; Meng, Z.; Zhao, Y.; Liu, X. A Novel method for predicting crosstalk in lossy twisted pair cable based on beetle antennae search and implicit wendroff FDTD algorithm. Electromagnetics 2021, 41, 208–221. [Google Scholar] [CrossRef]
- Jiang, Y.; Wang, S.; Li, Y. Localizing and quantifying structural damage by means of a beetle swarm optimization algorithm. Adv. Struct. Eng. 2021, 24, 370–384. [Google Scholar] [CrossRef]
Disclaimer/Publisher’s Note: The statements, opinions and data contained in all publications are solely those of the individual author(s) and contributor(s) and not of MDPI and/or the editor(s). MDPI and/or the editor(s) disclaim responsibility for any injury to people or property resulting from any ideas, methods, instructions or products referred to in the content. |
© 2024 by the authors. Licensee MDPI, Basel, Switzerland. This article is an open access article distributed under the terms and conditions of the Creative Commons Attribution (CC BY) license (https://creativecommons.org/licenses/by/4.0/).