Article

Gas-Liquid Hydrodynamics during Liquid Displacement by Gas in Up-Hill Pipeline

1
Department of Petroleum, Army Logistics Academy, Chongqing 401331, China
2
China National Aviation Fuel Corporation Ltd., Wenzhou Branch, Wenzhou 325024, China
3
China Petroleum Technology and Development Corporation, Beijing 100029, China
*
Authors to whom correspondence should be addressed.
Processes 2024, 12(2), 394; https://doi.org/10.3390/pr12020394
Submission received: 21 November 2023 / Revised: 24 January 2024 / Accepted: 8 February 2024 / Published: 16 February 2024

Abstract

:
Mobile pipelines are the most efficient and reliable way to transport large quantities of oil over long distances in warfare, rescue and disaster relief. The oil in the pipe must be discharged and recovered when the oil transfer task is completed, usually via gas cap evacuation. Gas cap evacuation is the main method to evacuate mobile pipelines. During evacuation, due to the influence of topography, working conditions and gravitational forces, the oil in an up-hill pipeline is gradually deposited in the low-lying part of the pipeline to form a liquid, resulting in the incomplete emptying of the pipeline which directly affects the recovery efficiency of the pipeline. Focusing on the analysis of the gas carrying oil flow process in an up-hill pipeline during the evacuation of gas displacing oil in the mobile pipeline, the tail and head of the liquid accumulation were analyzed, and the liquid accumulation flow model was established based on the gas–liquid two-phase stratified flow theory. This model was used to analyze the flow law of the accumulated liquid under different pipe inclination angles, initial accumulation thicknesses and pipe diameters. It was found that the stagnant oil in the pipeline is carried by the gas flow into the upward tilting pipeline due to the influence of the axial gravity force of the pipeline. The gas flow can be divided into three phases: the initial discharge stage, the oscillation stage and the final discharge (reflux) stage.

1. Introduction

A mobile pipeline is a combined system consisting of oil pipes, mobile oil pumps, valves, etc., connected by quick couplers [1,2,3,4]. In combat, military training or rescue and disaster relief operations, it is directly laid on the ground in the field as it possesses the characteristics of rapid laying and rapid evacuation. When the mobile pipeline is withdrawn, shut down for an extended period of time, or repaired, the oil in the mobile pipeline must be emptied and recycled into a tank or tanker truck. At present, the evacuation of mobile pipelines mainly uses water cap evacuation and gas cap evacuation. Compared with water cap evacuation, gas cap evacuation has the advantage of not being limited by ambient temperature and a water source, and is especially suitable for use in cold and arid areas [5,6,7]. At the same time, due to the strict requirements of aviation fuel for moisture content, the pipeline transporting aviation fuel is not allowed to use water cap evacuation. Therefore, under field conditions, the use of gas gap evacuation is preferred [8].
The evacuation of gas displacing oil means using air compressors to charge compressed air into the upstream terminal of the pipeline, pushing oil from the downstream terminal until all the oil has been pushed out of the pipeline. Affected by the terrain and other emptying conditions, some of the oil in the up-hill pipe is gradually deposited in the lower portion of the pipeline under the action of gravity to form liquid accumulation [9,10,11]. The creation of liquid accumulation not only results in incomplete emptying of the pipeline which directly affects the recovery efficiency of the pipeline, but it also may form a segmental plug flow and a large quantity of gas–oil vapor mixtures in the recovery vessel at the terminal of the pipeline, increasing the risk of emptying operations and greatly affecting the progress of pipeline withdrawal. Through the establishment of a gas carrying liquid flow model in the upturned pipeline, the flow law of gas carrying liquid under different working conditions is explored to provide a theoretical basis for the determination of pipeline emptying process parameters and to improve the efficiency of emptying [12,13,14].
Taitel et al. [15,16] conducted an experiment to study the gas–liquid transient flow in a pipeline in hilly terrain, and simulated six kinds of different flow conditions for the transient flow characteristics of a low-level liquid plug in an undulating pipeline under a low velocity condition. A simple model for the prediction of the transient characteristics of the two-phase flow was proposed for the six different cases, and compared with the laboratory data. Bissor et al. [10,12] studied the critical gas velocity for averting the liquid accumulation in natural gas pipelines through experiments and simulations. It was observed that the superficial velocity of the critical gas for clearing the accumulating liquid in the pipeline, in the presence of liquid accumulation, is associated with the critical value required to mobilize the trailing end of the liquid film, irrespective of the effects of the pipeline inclination, pipeline diameter, pressure and liquid viscosity, and that the critical value is independent of the volume of the initial accumulating liquid. The critical superficial gas velocity grows with the increase in the pipeline diameter and pressure, and the influence of the liquid viscosity is significant. A novel mechanistic model for forecasting the critical gas flow and driving liquid film velocity is proposed. Pan et al. [17,18] established a critical liquid-carrying flow rate prediction model for the stratified flow of gas and liquid under the condition of low-liquid content in slightly inclined pipelines. Dabirian et al. [19] studied the critical rate at which sand-containing liquids may produce sand accumulation when they are in a stratified flow of gas and liquid within a horizontal pipe.
Some researchers believe that the critical gas speed to prevent liquid accumulation at the bottom of the pipe is related to the critical velocity at which the suspension droplets are carried away. Turner et al. [20] first proposed the liquid-carrying theory in a vertical wellbore, arguing that the liquid accumulation at the bottom of the pipe can be avoided when the axial resistance to the droplet is greater than the opposite’s gravity. Bissor et al. [13] considered the lateral gravity used to predict the minimum gas velocity required for droplets to separate from the liquid membrane and bring them into the gas phase, and that in shallowly inclined pipes, the lateral gravity action of the entrained droplets would cause them to settle on the lower surface of the pipe, forming a stratified flow of gas liquid. Yang et al. [21] established a critical carrier velocity forecasting model considering droplet entrapment for gas–liquid stratified flow in an inclined pipeline with small liquid fraction. The study found that the pipeline inclination, pressure, liquid density and gas composition have a great influence on the critical liquid carrying speed. With the increase in pipeline inclination angle and liquid density, the critical liquid carrying speed continues to increase and the critical liquid carrying capacity decreases gradually. With the increase in pressure, the critical liquid carrying speed continues to decrease, and the critical liquid carrying capacity increases gradually [22,23].
On the basis of analyzing the up-hill pipeline gas-carrying oil flow process within the evacuation process of gas displacing oil in the mobile pipeline, combined with the theory of gas–liquid two-phase stratified flow, the tail and head of the liquid accumulation were investigated, and the liquid accumulation flow model was established. The developed model indicates that the ability of the gas phase to carry the fluid was characterized by the flow rate of the liquid tail. When the tail of accumulated liquid is stationary in the upward inclined pipe, the gas-phase superficial flow rate of the oil phase tail is defined as the critical gas velocity of the gas-carrying liquid. This model was used to analyze the flow law of liquid accumulation under different pipe inclination angles, initial accumulation thicknesses and pipe diameters. It provides an important reference for the study of gas-carrying oil in the process of mobile pipeline evacuation and provides an important theoretical basis for the design and operation of an actual evacuation, which is of practical guiding significance.

2. Mathematical Model

The retained liquid in the pipeline enters the up-hill pipeline under the action of the gas. This occurs when the force direction of the liquid in the pipeline changes due to the change in the pipeline inclination angle. The liquid close to the gas–liquid interface continues to move with the gas along the flow direction in the role of shear, and the liquid near the wall of the pipeline begins to slow down under the action of gravity and has a tendency to move in the opposite direction; the retained liquid layer is gradually elongated and flattened in the up-hill pipeline. When the gas phase velocity is low, due to the inability to completely overcome the countercurrent trend under the action of gravity, the retained liquid entering the up-hill pipeline will gradually flow back to the low-lying portion of the pipeline. When the gas phase velocity is high, with the carrying of gas, the retained liquid can completely overcome the countercurrent trend produced by gravity, and continue to flow upwards with the gas. While under certain gas phase velocity conditions, the retained liquid is spread flat and stationary in the up-hill pipe. The disturbance of the gas to the retained liquid in the up-hill pipe is continuous, and when any slight change happens in the form or force of the retained liquid stationary in the up-hill pipe, its stationary state will be destroyed, causing the retained liquid to advance or flow back, breaking into smaller droplets or polymerizing with other liquids.

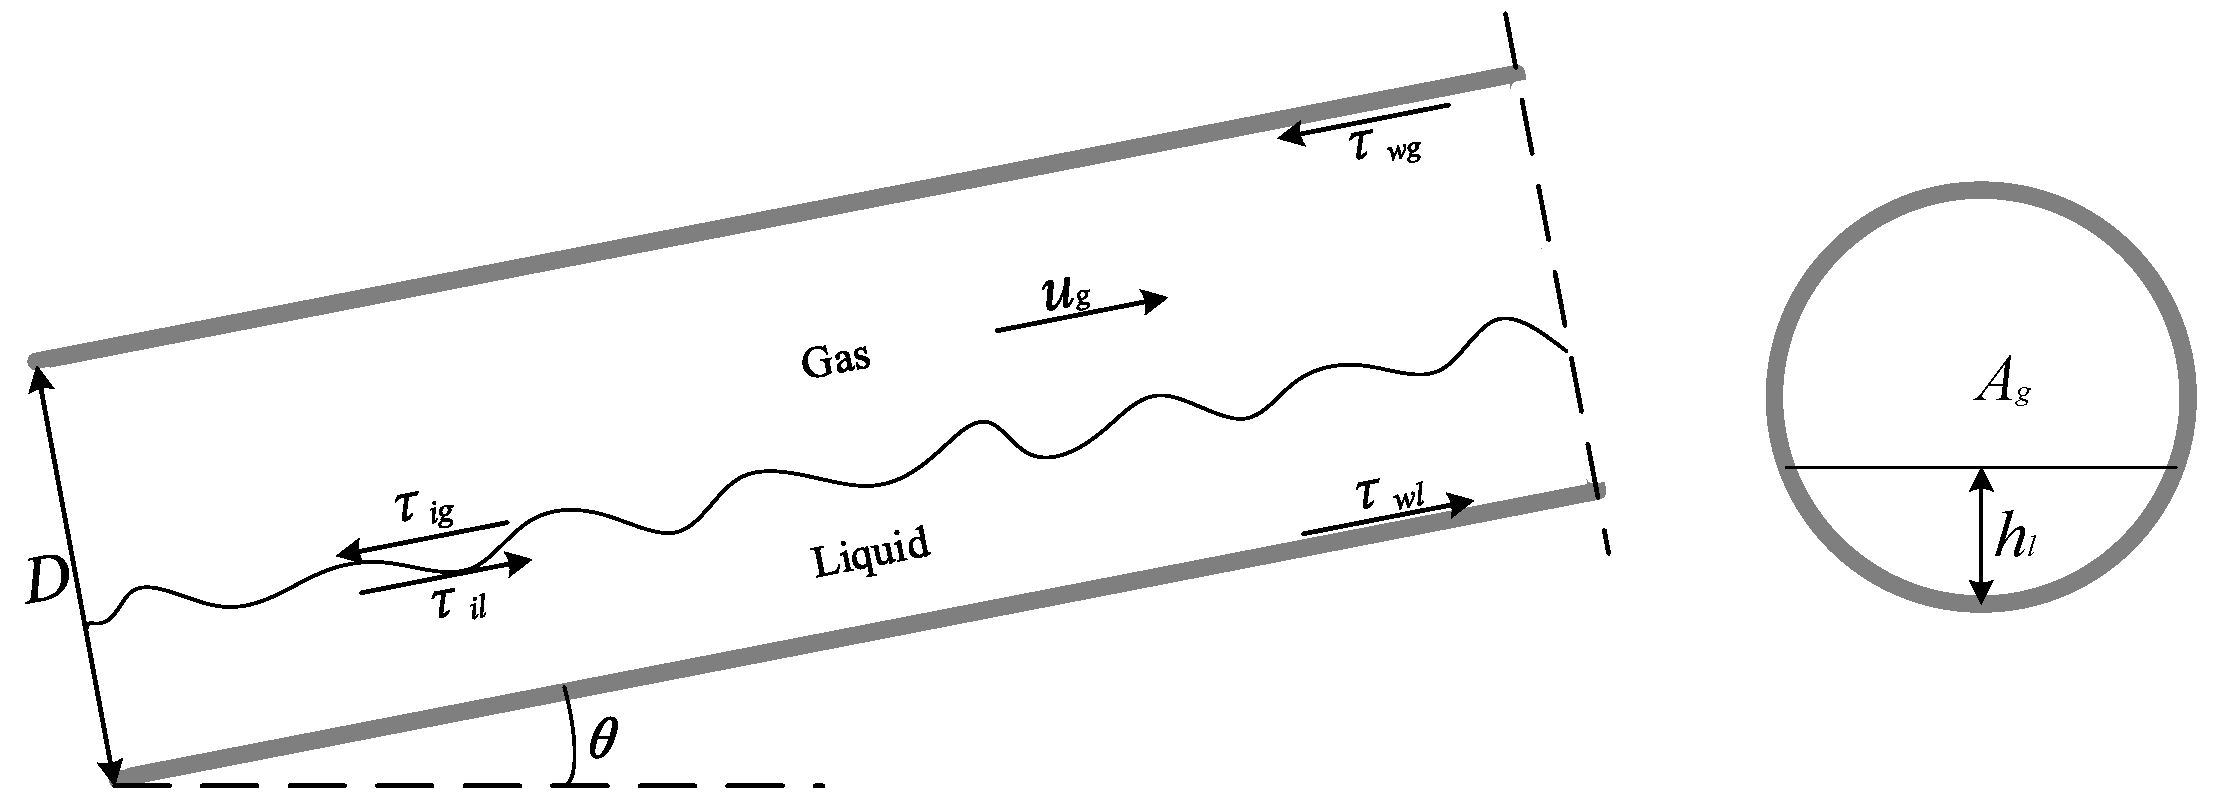
2.1. The Gas–Liquid Overall Stratified Flow

The force distribution when in the liquid phase and the gas phase flow in an overall stratified flow in an upward pipeline is shown in Figure 1. D is the pipe diameter. The pipe is upwardly inclined at an angle θ. hl is the liquid level. τwl and τwg are the liquid and gas wall shear stress, respectively. Ag is the cross sectional area occupied by gas. τig and τil are the interfacial shear stresses of gas and liquid phase, respectively.
According to the balance conditions in the pipeline, the continuity equations of the liquid and gas phases are
ρ l u l = 0
ρ g u g = 0
The respective momentum balance equation of the liquid and gas phases reads
A l d P d L τ w l S l + τ i S i ρ l A l g sin θ = 0
A g d P d L τ w g S g τ i S i ρ g A g g sin θ = 0
where, P is the pressure, Pa; L is the length of the pipe, m; τwl is the shear stress between the liquid phase and the pipe wall, N/m2; τwg is the shear stress between the gas phase and the pipe wall, N/m2; Sl is the wetted perimeter of the liquid phase, m; Sg is the wetted perimeter of the gas phase, m; Al is the cross area of the pipeline taken up by the liquid phase, m2; Ag is the cross area of the pipeline taken up by the gas phase, m2; ρl is the liquid phase density, kg/m3; ρg is the gas density, kg/m3; Si is the length of the gas–liquid boundary line on the cross section of the pipe, m; τi is the shear stress on the gas–liquid interface, N/m2; θ is the pipe inclination, rad.
Since the gas and liquid phases flow within the same pipe, the pressure loss on the same pipe section is equal, i.e.,
d P d L l = d P d L g = d P d L
When Equation (3) is subtracted from Equation (4), the pressure gradient term can be eliminated and the momentum balance equation of the gas and liquid phases is obtained:
τ w l S l A l τ w g S g A g τ i S i 1 A l + 1 A g + ρ l ρ g g sin θ = 0
where, the shear stresses between gas–wall, liquid–wall, and at the interface read:
τ w l = f l ρ l u l   2 2
τ w g = f g ρ g u g   2 2
τ i = f i ρ g u g u l 2 2
where, fl is the hydraulic friction coefficient of the liquid phase, fg is the hydraulic friction coefficient of the gas phase, and fi is the hydraulic friction coefficient between the gas–liquid interface.
The hydraulic diameter of the liquid and gas phases read:
d l = 4 A l S l
d g = 4 A g S g + S i
Liquid holdup is:
h ˜ l = π cos 1 2 h l D 1 + 2 h l D 1 1 2 h l D 1 2 π
When the liquid phase reaches critical flow within the up-hill pipe, it is in balance and remains spread flat and stationary on the pipe wall, at which point the velocity of the liquid phase is zero.
u l = 0
When Equation (13) is substituted into Equation (6), the critical carrying liquid velocity in the up-hill pipe can be obtained:
u g = 2 ρ l ρ g g sin θ ρ g f g + f i 1 A l + 1 A g

2.2. The Flow of Retained Liquid

2.2.1. The Tail Region of Retained Liquid

When a small amount of retained liquid is brought into the up-hill pipe by the gas, a pattern of long liquid film is formed on the wall of the pipe, with a trailing region as illustrated in Figure 2. The gas and liquid within the length of lt in this region are integrally conserved in mass and momentum, and the region moves at an average velocity ul. h ˜ l is the oil thickness, and ul is the moving velocity of oil. β is the contact angle of the oil with the pipe surface. σ is the surface tension coefficients of gas–liquid.
The mass conservation equation for the gas phase reads:
u g + u l 1 h ˜ l = u g u p + u l 1 h ˜ l + u g l o w + u l h ˜ l
where, h ˜ l refers to liquid holdup. When the tail does not move, a gas stagnation zone is formed above the liquid tail. Assuming that ug|low = ul in this region, and ug = ug|up in the equation, the gas volume flow rate ug is actually constant. Thus, the gas in the upper layer and the liquid in the lower layer are conserved in momentum.
τ w g τ i l t + D P | x = 0 1 h ˜ l D P | x = l t 1 h ˜ l + ρ g g sin θ A g u p = 0
1 2 Δ ρ g cos θ h ˜ l 2 D 2 + D P | x = 0 P | x = l t h ˜ l τ i l t + τ w l l t + ρ l A l + ρ g A g l o w g sin θ σ + σ s l + σ s g = m o m l x = 0
where, moml|x represents the momentum of the liquid film surface (moml|x=L = momg|x=L = 0); σ, σsl and σsg represent the surface tension coefficients at the interface between gas–liquid, wall–liquid and wall–gas, respectively (σsgσsl = σcosβ). When Equation (16) is added to Equation (17), the result is
τ w l + τ w g l t D P x l t + 1 2 Δ ρ g cos θ h ˜ l 2 D 2 σ 1 cos β + ρ g A g u p + ρ g A g l o w + ρ l A l g sin θ + m o m l x = 0 = 0
where, τwl and τwg are shear stresses between gas–wall and liquid–wall, respectively, Pa; lt is the calculation area of the liquid film tail, m.
ρ g A g u p + ρ g A g l o w + ρ l A l = Δ ρ A l + ρ g D l t
Δ ρ = ρ l ρ g
The pressure gradient has less effect on the flow in the thin liquid film and can be estimated based on the values obtained from the gas in the dry area of the tail.
D P x = 2 τ w g + ρ g D g sin θ
Equations (19) and (21) are substituted into Equation (18)
τ w l τ w g l t + Δ ρ A ˜ l D 2 sin θ + 1 2 h ˜ l 2 D 2 Δ ρ g cos θ = σ 1 cos β m o m l x = 0
The shear stress between the gas and the wall is:
τ w g = 1 2 ρ g f g u g s 2
where, fg is the wall friction coefficient on a dry surface.
Suppose that the flow in the film at x = 0 in Figure 2 can be considered as a locally fully developed film flow, and the local velocity distribution is the solution of the momentum equation on the liquid film:
μ l 2 u l y 2 = Δ ρ g sin θ P x f
Depending on the no-slip boundary conditions, the solution of the velocity distribution in the thin film and the corresponding average velocity are:
u l y = 1 μ l Δ ρ g sin θ P x f y 2 2 h l y + τ i F μ l y
u l = 1 h l   0 h l u l y d y = τ i F 2 μ l h l 2 3 μ l Δ ρ g sin θ P x f
The corresponding moml|x=0 can be obtained by:
m o m l x = 0 = ρ l 0 h l u l u l y 2 d y
During the upward flow of the air-carrying liquid, the interfacial shear stress should be high enough to drag the liquid film upwards to avoid backflow due to gravity. Due to the disturbance at the gas–liquid interface, it is foreseeable that the shear stress between the gas–liquid interface will be significantly higher than that between the gas–wall. Therefore, when ugul and hl ≪ 1, the interfacial shear stress is represented as:
τ i F = 1 2 ρ g f i u g 2
where, fi is the gas interface friction coefficient.
The length of the caudal region and the caudal region of the liquid membrane can be estimated by assuming that the interface shape is a circular arc:
l ˜ t = h ˜ l sin β 1 cos β
A ˜ l = h ˜ l 1 cos β 2 β 2 h ˜ l l ˜ t 2 cos β 1 cos β
The liquid wall shear stress in the tail is:
τ w l = μ l u l h ˜ l D
When the gas superficial velocity is determined, Equation (22) can be used to predict the liquid tail velocity, utail = ul. In the process of gas-carrying liquid flow, in order to obtain the critical gas superficial velocity of the retained liquid carried out of the pipeline by the gas, it corresponds to ul > 0.

2.2.2. The Front Region of Retained Liquid

The force of retained liquid front is shown in Figure 3. With the liquid front end as the coordinate system, the gas and liquid within the length of lf are integrally conserved in mass and momentum, and the front end moves forward at the average velocity ufront (denoted as C). σsl and σsg are the surface tension coefficients of wall–liquid and wall–gas, separately.
The gas mass conservation equation is given as,
C u s g = C u g 1 h ˜ l
The liquid shedding rate ml in the front region of the retained liquid is consistent with the rate of liquid mass loss and can be represented by,
d m l d t = ρ l d A l d h l d h l d t = ρ l C u l h l
Hence:
d h l d t = C u l h l d A l / d h l
The gas–liquid momentum conservation equation in the front region is given as,
1 2 Δ ρ g cos θ h ˜ l 2 D 2 + l f τ w l τ i F + σ 1 cos β + Δ ρ A l g sin θ = Δ M g + Δ M l + d m l u l d t
where:
Δ M g = M g x = l f M g x = 0
Δ M l = M l x = l f M l x = 0 = m o m l x = l f
Here, the pressure drop in the front region can be estimated by using the pressure drop in the gas approaching the front and can be obtained by:
D 1 h ˜ l P x = τ w g + τ i F + ρ g D 1 h ˜ l g sin θ
Behind the liquid front region is the developing liquid film flow, where the liquid velocity and average velocity are given by:
u l y = 1 μ l Δ ρ g sin θ P x f y 2 2 h l y + τ i F μ l y
u l = τ i F h l 2 μ l h l 2 3 μ l Δ ρ g sin θ P x f
The momentum item ∆Ml of the liquid is:
Δ M l = ρ l 0 h l C u l y 2 d y = ρ l h l C 2 u l C + ρ l 0 h l u l 2 y d y
ρ l 0 h l u l 2 y d y = 2 15 ρ l C 1 2 h l 5 5 12 C 1 ρ l τ i F μ l h l 4 + 1 3 ρ l τ i F 2 μ l 2 h l 3
C 1 = Δ ρ g sin θ P x f / μ l
The momentum item ∆Mg of the gas is:
Δ M g = ρ g C u g 2 1 h ˜ l C u s g 2 D = ρ g h ˜ l D C u s g 2 1 h ˜ l
The rate of change in momentum of the liquid in the front reads:
1 ρ l d m l u l d t = u l 1 ρ l d m l d t + A l d u l d t
d u l d t = d q l / h l d t = 1 h l C k u l d h l d t
where, Ck is the kinematic wave velocity:
C k = q l h l = u l h l h l = h l 2 μ l Δ ρ g sin θ P x + h l τ i F μ l + h l 2 2 μ l d τ i F d h l
The mass conservation correlation is substituted into Equation (33) and is given as
1 ρ l d m l u l d t = C u l u l h l + A l C k u l d A l / d h l
For the velocity at the front of the retained liquid, when the liquid is carried by gas and flows at the interface velocity:
C = u i = u y = h l = h l 2 2 μ l Δ ρ g sin θ P x + τ i F h l μ l
When the liquid moves forward in the form of waves:
C = C k

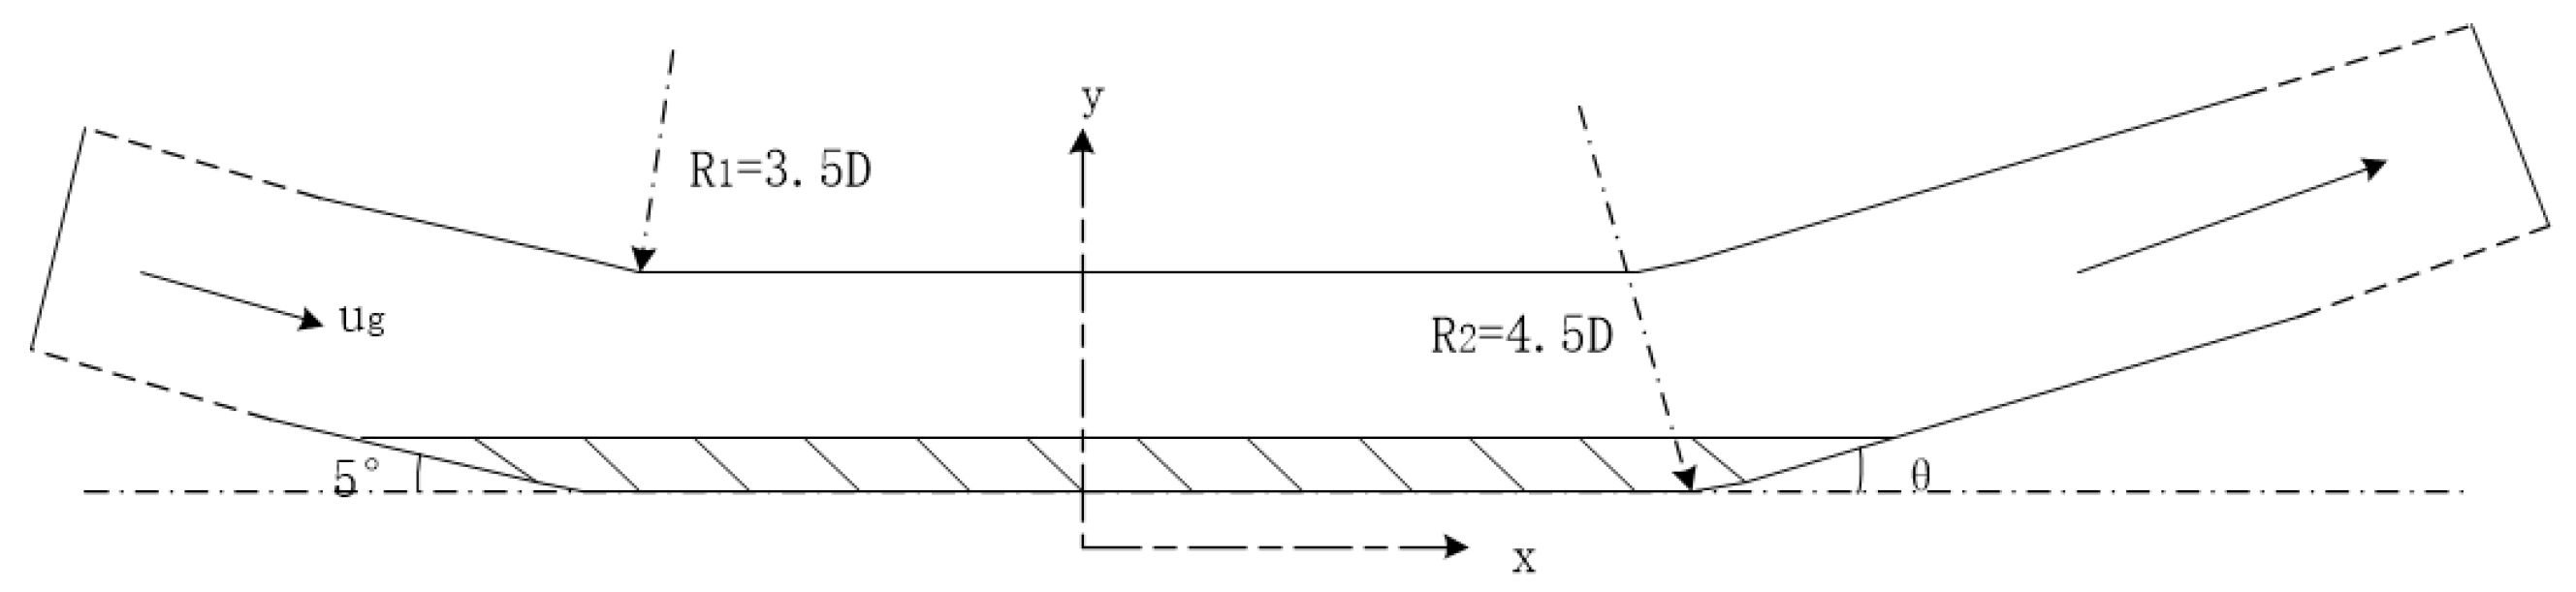
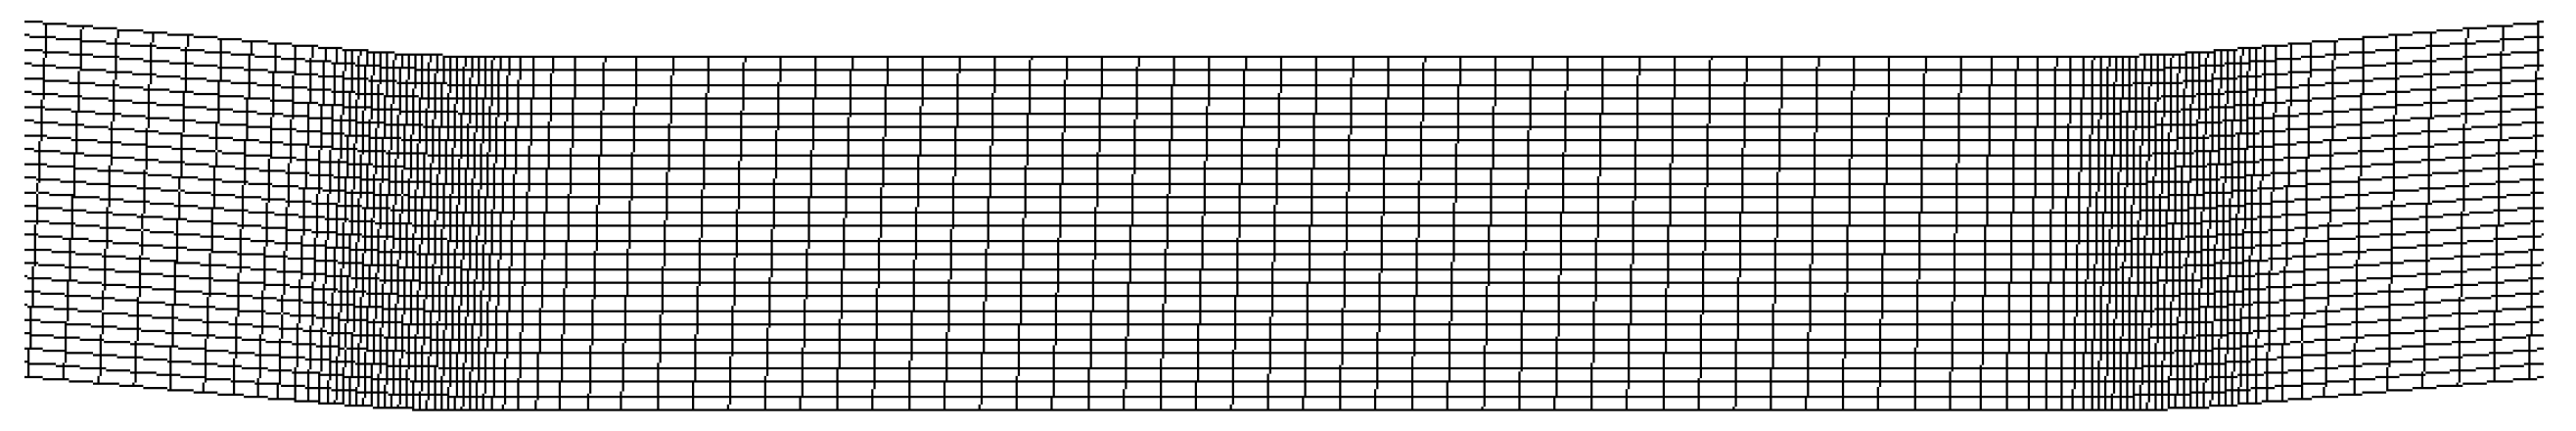
2.3. The Setting of Numerical Simulation Parameters

As illustrated in Figure 3, the simulation pipeline consists of three segments: a 1 m downslope for the import end, a 0.5 m horizontal section and a 3 m upslope for the export end. In Figure 4, the shaded portion of the horizontal tube is the predetermined oil retention position. The gas gets into the pipeline from the inlet, enters the horizontal section through the downcomer and begins to contact the retained oil layer. Due to shear stress, the retained oil layer follows the gas flow along with the gas from the downward horizontal section to the upward section. The lower inclination angle is −5°, and depending on the research needs, the upper inclination angle θ is set to +5°, +10°, +15°, +30° and +45°. Pipe diameters are configured as 50 mm, 100 mm and 150 mm. The radius of curvature at the elbow of the pipe is 3.5D at the top and 4.5D at the bottom.
The pipeline model in this paper is mainly a structural grid and the grid shape is quadrilateral. At the same time, due to the change in the force at the elbow of the undulating pipeline, it has a great influence on the flow of gas-carrying liquid. When dividing the grid, the grid is refined at the elbow of the pipeline according to the needs to ensure the accuracy of the calculation results. The grid division is shown in Figure 5.
In this paper, three aspect ratios were taken for the initial meshing as shown in Table 1. The results of the simulation calculations were compared for the three meshing models.
Taking a 100 mm pipe, an initial stagnant oil thickness of 20 mm, an initial gas-phase flow rate of 6 m/s, and a pipe inclination angle of +5° as an example, the morphological distribution of the oil phase in the pipe at 0.1 s is shown in Figure 6. At this time, the oil phase in the pipeline is carried by the gas into the uptilted pipeline, but the tail region is still at the elbow connecting the horizontal section and the uptilted section, which is typically representative. A comparison can be found between the grids. The Grid 1 oil phase head and tail feature large fluctuations, with careful observation finding that the grid defects are caused by a high degree of oil film deformation. The Grid 2 and Grid 3 oil phase morphology is more stable, as the oil film surface is smooth and the shape of the pipe elbow has a high degree of conformity. After a comprehensive consideration of the calculation accuracy and efficiency, the Grid 2 division strategy was chosen for numerical simulation.
In this paper, the main aim of the simulation is to study the gas–liquid two-phase flow motion in the pipeline, which is a transient non-stationary flow. Therefore, the solver is set as a pressure-based solver, the time type is set as transient, and the gravitational acceleration is set as −9.81 m/s2 in Y direction.
The VOF-based model is chosen to track the interface of the pipeline gas-carrying oil flow, and the RNG k-ε model is chosen for turbulence calculations, with the boundary conditions set as the velocity inlet condition and pressure outlet condition and the wall as the no-slip condition, as needed. For the transient flow and non-stationary calculations, the PISO format was chosen. For the flux calculations, the second-order windward format was selected. The time step was set to 0.005 s and the maximum number of iterative calculations within each time step was 50.

3. Result Analysis

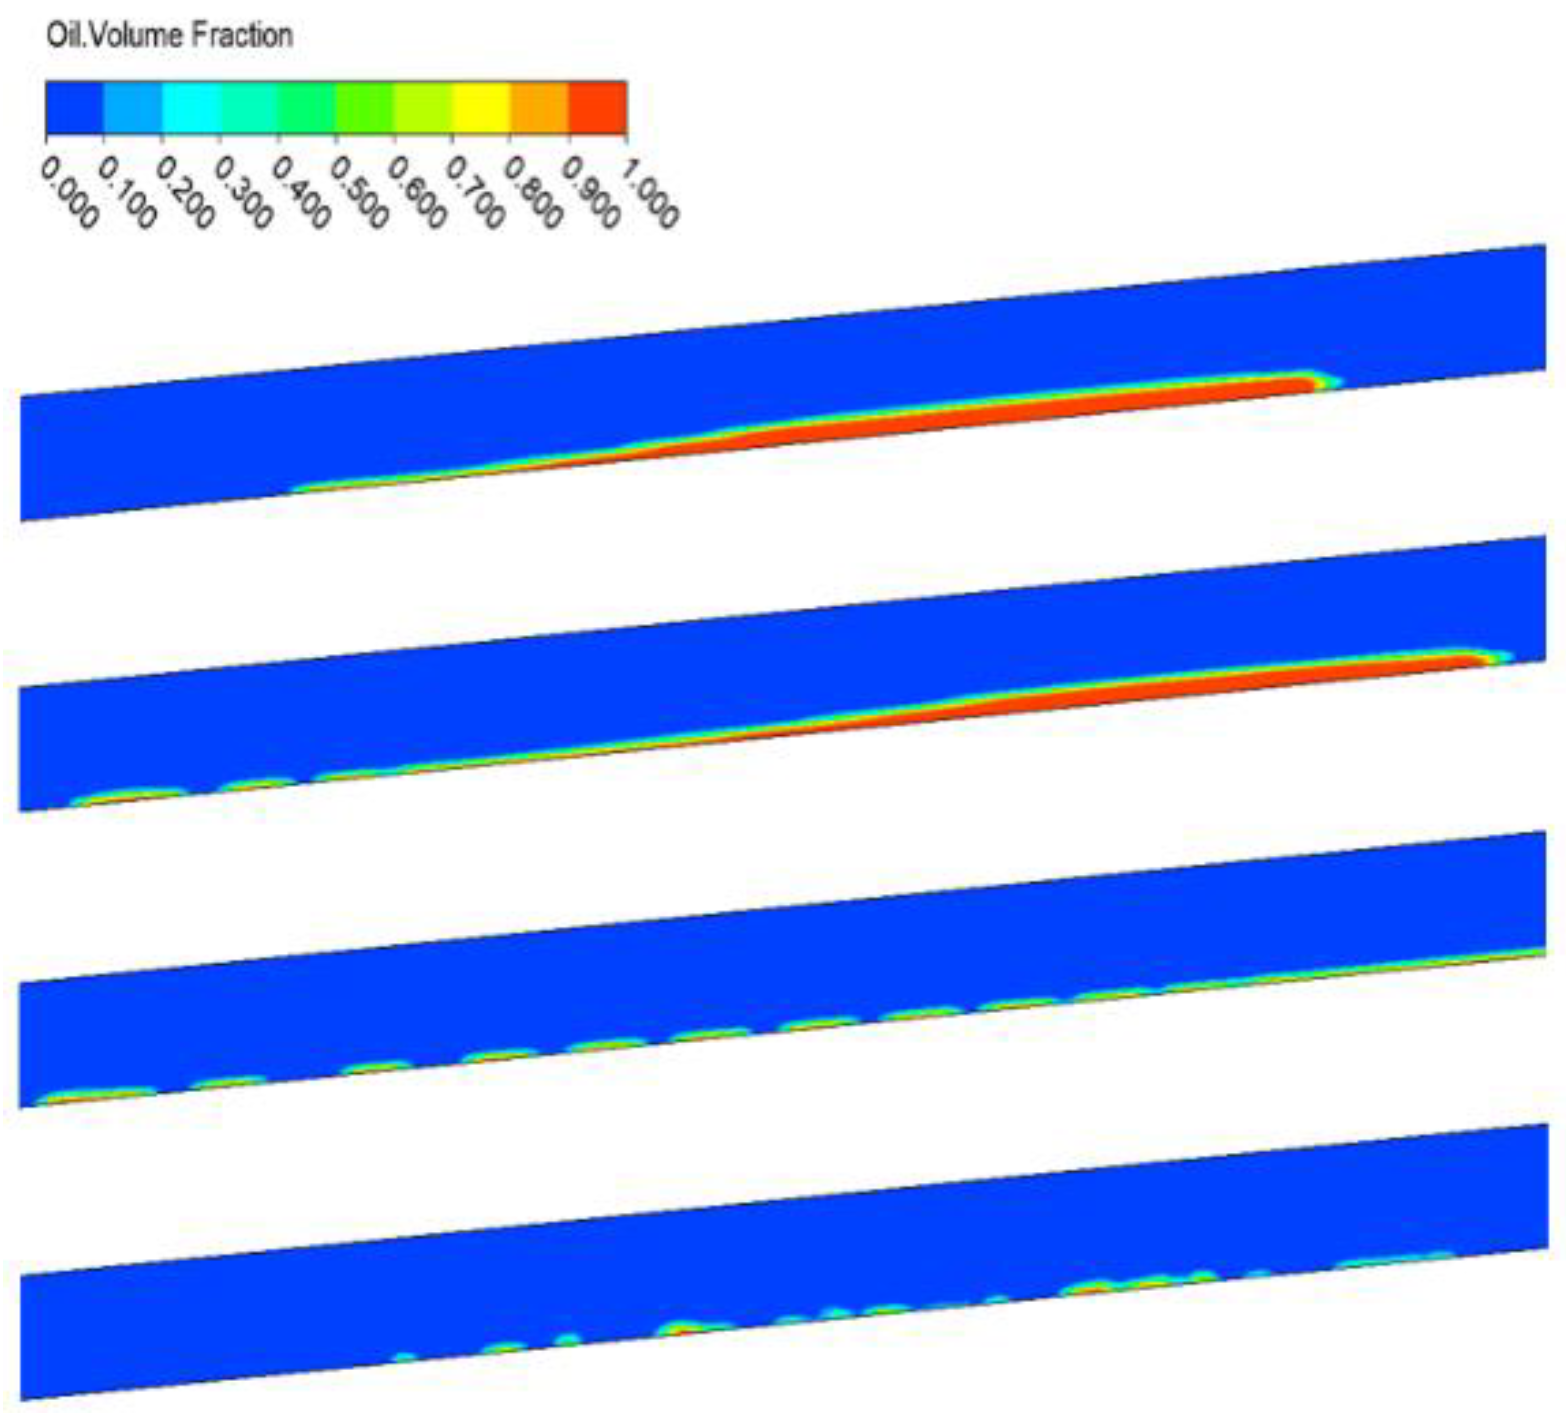
3.1. The Shape of Oil Phase during Flow

The gas-carrying oil movement in the pipeline is a complex dynamic process. After the retained oil layer is carried by the gas phase into the upward pipeline, as a result of the change in force, the oil phase is constantly deformed during the entire flow process. According to the characteristics and state of oil phase shape changes, the flow process of oil in the upward pipeline carried by the gas flow can be divided into three stages: the initial discharge stage, the oscillation stage and the final discharge stage.
After the gas phase enters the pipeline, it carries the oil phase movement under the action of shear stress. After entering the upward pipeline, the retained oil is affected by gravity and begins to move in the opposite direction, because there is no oil flow to replenish. The retained oil as a whole is in an eccentric large droplet shape and gradually becomes elongated forming a gas–liquid smooth stratified flow, as shown in Figure 7. The oil phase thickness in the upward pipe initially decreases linearly, as shown in Figure 8, while under the analog parameters of the pipe diameter of 100 mm, an initial retained oil thickness of 20 mm, and a pipe tilt angle of +5°, when the average oil phase thickness drops to 7 mm, a transient stable period occurs. At this time, the head start of the oil phase has left the pipeline, while the tail gradually breaks down into oil droplets of different sizes with the overall moving direction still travelling upwards along the pipeline; the retained oil in the pipeline is mainly carried out of the pipeline by the gas phase at this stage, which can be called the initial discharge stage.
As shown in Figure 7, the oil phase tail gradually breaks into long and thin oil droplets of different sizes, which is caused by the formation and gradual expansion of the speed difference between the oil phase front end and the tail. The increasing distance between dispersed droplets is the reason that the oil phase velocity in the upward pipe gradually becomes larger in the oil phase moving path. The surface area of the oil droplets formed by the rupture is reduced by the shear stress of the gas phase, and when the liquid carrying capacity of the gas phase is not enough to overcome gravity, the oil droplets slow down under the action of gravity, with oil droplets in the tail beginning to flow back. In the process of flowing back, due to the different sizes and positions of oil droplets, the shear stress and gravitational potential energy on them are not the same, so the rupture and merger of the oil droplets happens in the dynamic process. When they break into small oil droplets, so that the shear stress provided by the gas phase is sufficient to overcome gravity, the oil droplets move upward with the gas phase; when they merge into larger oil droplets, making the gas phase unable to carry on moving, the reflux continues. It can be seen from Table 2 that in 1.95 s~2.25 s and 2.85 s~3.15 s, the length of the oil phase in the pipe has a short increase in the reverse trend, indicating that the retained oil in the upward pipeline at this time has an intermittent backflow phenomenon; the oscillation fluctuation of the average oil phase thickness reflects the rupture and merger of oil droplets in the pipeline at this stage, as shown in in Figure 7. This is when the flow state of the retained oil in the pipeline is in dynamic change, which can be called the oscillation stage.
After 15 s of oscillatory movement, oil droplets in the tail are finally carried out of the pipeline by the gas phase or return to the bottom of the pipeline, forming a new retained oil layer which can be called the final discharge (reflux) stage.
In the flow process of oil carried by gas in the upward pipeline, due to the difference in the speed between the front and the tail of the oil phase, the fracture of the oil phase in the flow process is a common phenomenon under different parameters, but the oscillation motion of the oil droplets formed after the fracture is closely related to the gas phase velocity in the pipeline. When the gas phase velocity in the pipeline is high, the gas phase can directly carry the retained oil out of the pipeline. When the gas phase velocity is low, the retained oil can also directly return to the bottom of the pipe under the action of gravity.

3.1.1. Effects of the Inclination Angle on the Flow of the Oil Phase

In the actual laying process of the field oil pipeline, due to the influence of the local topography the actual pipeline may have a variety of different undulating states. Different locations have different inclination angles, especially in the southwest of China where the mountains are densely forested and the terrain conditions are more complex. In order to make the study closer to the actual situation, this paper considers the impact of different inclination angles on the flow of gas-carrying oil by selecting the five inclination angles of +5°, +10°, +15°, +30° and +45° for numerical simulation.
After the retained oil layer is carried into the upward pipeline by the gas phase, when affected by the inclination angle the force of the retained oil layer changes. As can be seen from Figure 9a, under the same inlet gas phase velocity, the front speed of the oil phase entering the initial stage of the upward pipeline decreases with the increase in the pipeline inclination angle. This is because the greater the inclination of the pipeline, the greater the gravity component of the oil phase is along the axial direction of the pipeline; the speed of the oil phase decreases rapidly after it enters the upward pipeline. The higher front-end oil phase speed and the lower deceleration means that the retained oil can be discharged from the pipeline fast. At 0.5 s, the oil phase front-end speed in the +5° and +10° inclination pipes is rapidly reduced because under the conditions of this simulation’s parameters, the initial oil phase front end has been taken out of the pipeline by the gas phase. Also, the middle of the initially retained oil has become the front end of the oil phase, which is still retained in the pipeline. Over time, most of the retained oil in the pipeline with different inclination angles is discharged from the pipeline, at which time the oil flow carried by the gas enters the oscillation stage and the front-end velocity of the oil phase in the pipeline fluctuates around the extremely low value. The initial oil phase tail velocity in the upward pipe is not particularly affected by the inclination angle of the pipe, but the larger the inclination angle, the higher the possibility of return flow in the oil phase tail. As shown in Figure 9b, at a +15°, +30° and +45° inclination, negative flow rates occur at the oil phase tail, i.e., there is a backflow phenomenon. In the +15° pipeline, the oil phase tail drops to a negative value of 1.6 s, while in the +30° and +45° pipe, the oil phase tail drops to the negative values of 1.1 s and 0.7 s. As the inclination of the pipe increases, the earlier the retained oil tail in the pipeline returns, and the faster the return rate.
At a low inclination, because the speed of the oil phase front end is close to the gas phase velocity or even higher than the velocity of the gas phase near the boundary layer, the oil phase front end is violently disturbed with the gas phase at the pipe wall, forming bubbles in the oil phase and even causing the front end’s oil droplets to fall off. As shown in Figure 10a–e, with the increase in the inclination angle, this disturbance decreases gradually. As shown in Figure 9c, the smaller the inclination of the pipeline at the beginning of the gas-carrying oil flow, the greater the speed difference between the front and tail of the oil phase. The large speed difference makes the retained oil elongated after entering the upward pipeline, and when comparing the state of the retained oil at 0.4 s in Figure 10a–e, it can be seen that the smaller the inclination angle, the longer the length of the retained oil layer in the upward pipeline is at the beginning of the flow. With the development of the gas-carrying oil flow, after 0.5 s, the front-end speed of the oil phase under all inclination angles has tended to the critical value. The oil phase tail in the large inclination pipeline begins to backflow gradually, making the oil phase front-to-tail speed difference under the large inclination angle condition greater than that under the condition of the small inclination. Rapid backflow also makes the disturbance of the gas on the retained oil tail greater, as can be seen in Figure 10a–e. At +5°, +10° and +15° inclination angles, the tail is mostly a large, irregular oil droplet, and at +30° and +45° inclination angles, the tail has a large number of irregular small oil droplets, and even some small oil droplets leave the bottom of the pipeline, carried by the gas phase moving upward along the pipeline again, forming a dispersed flow.

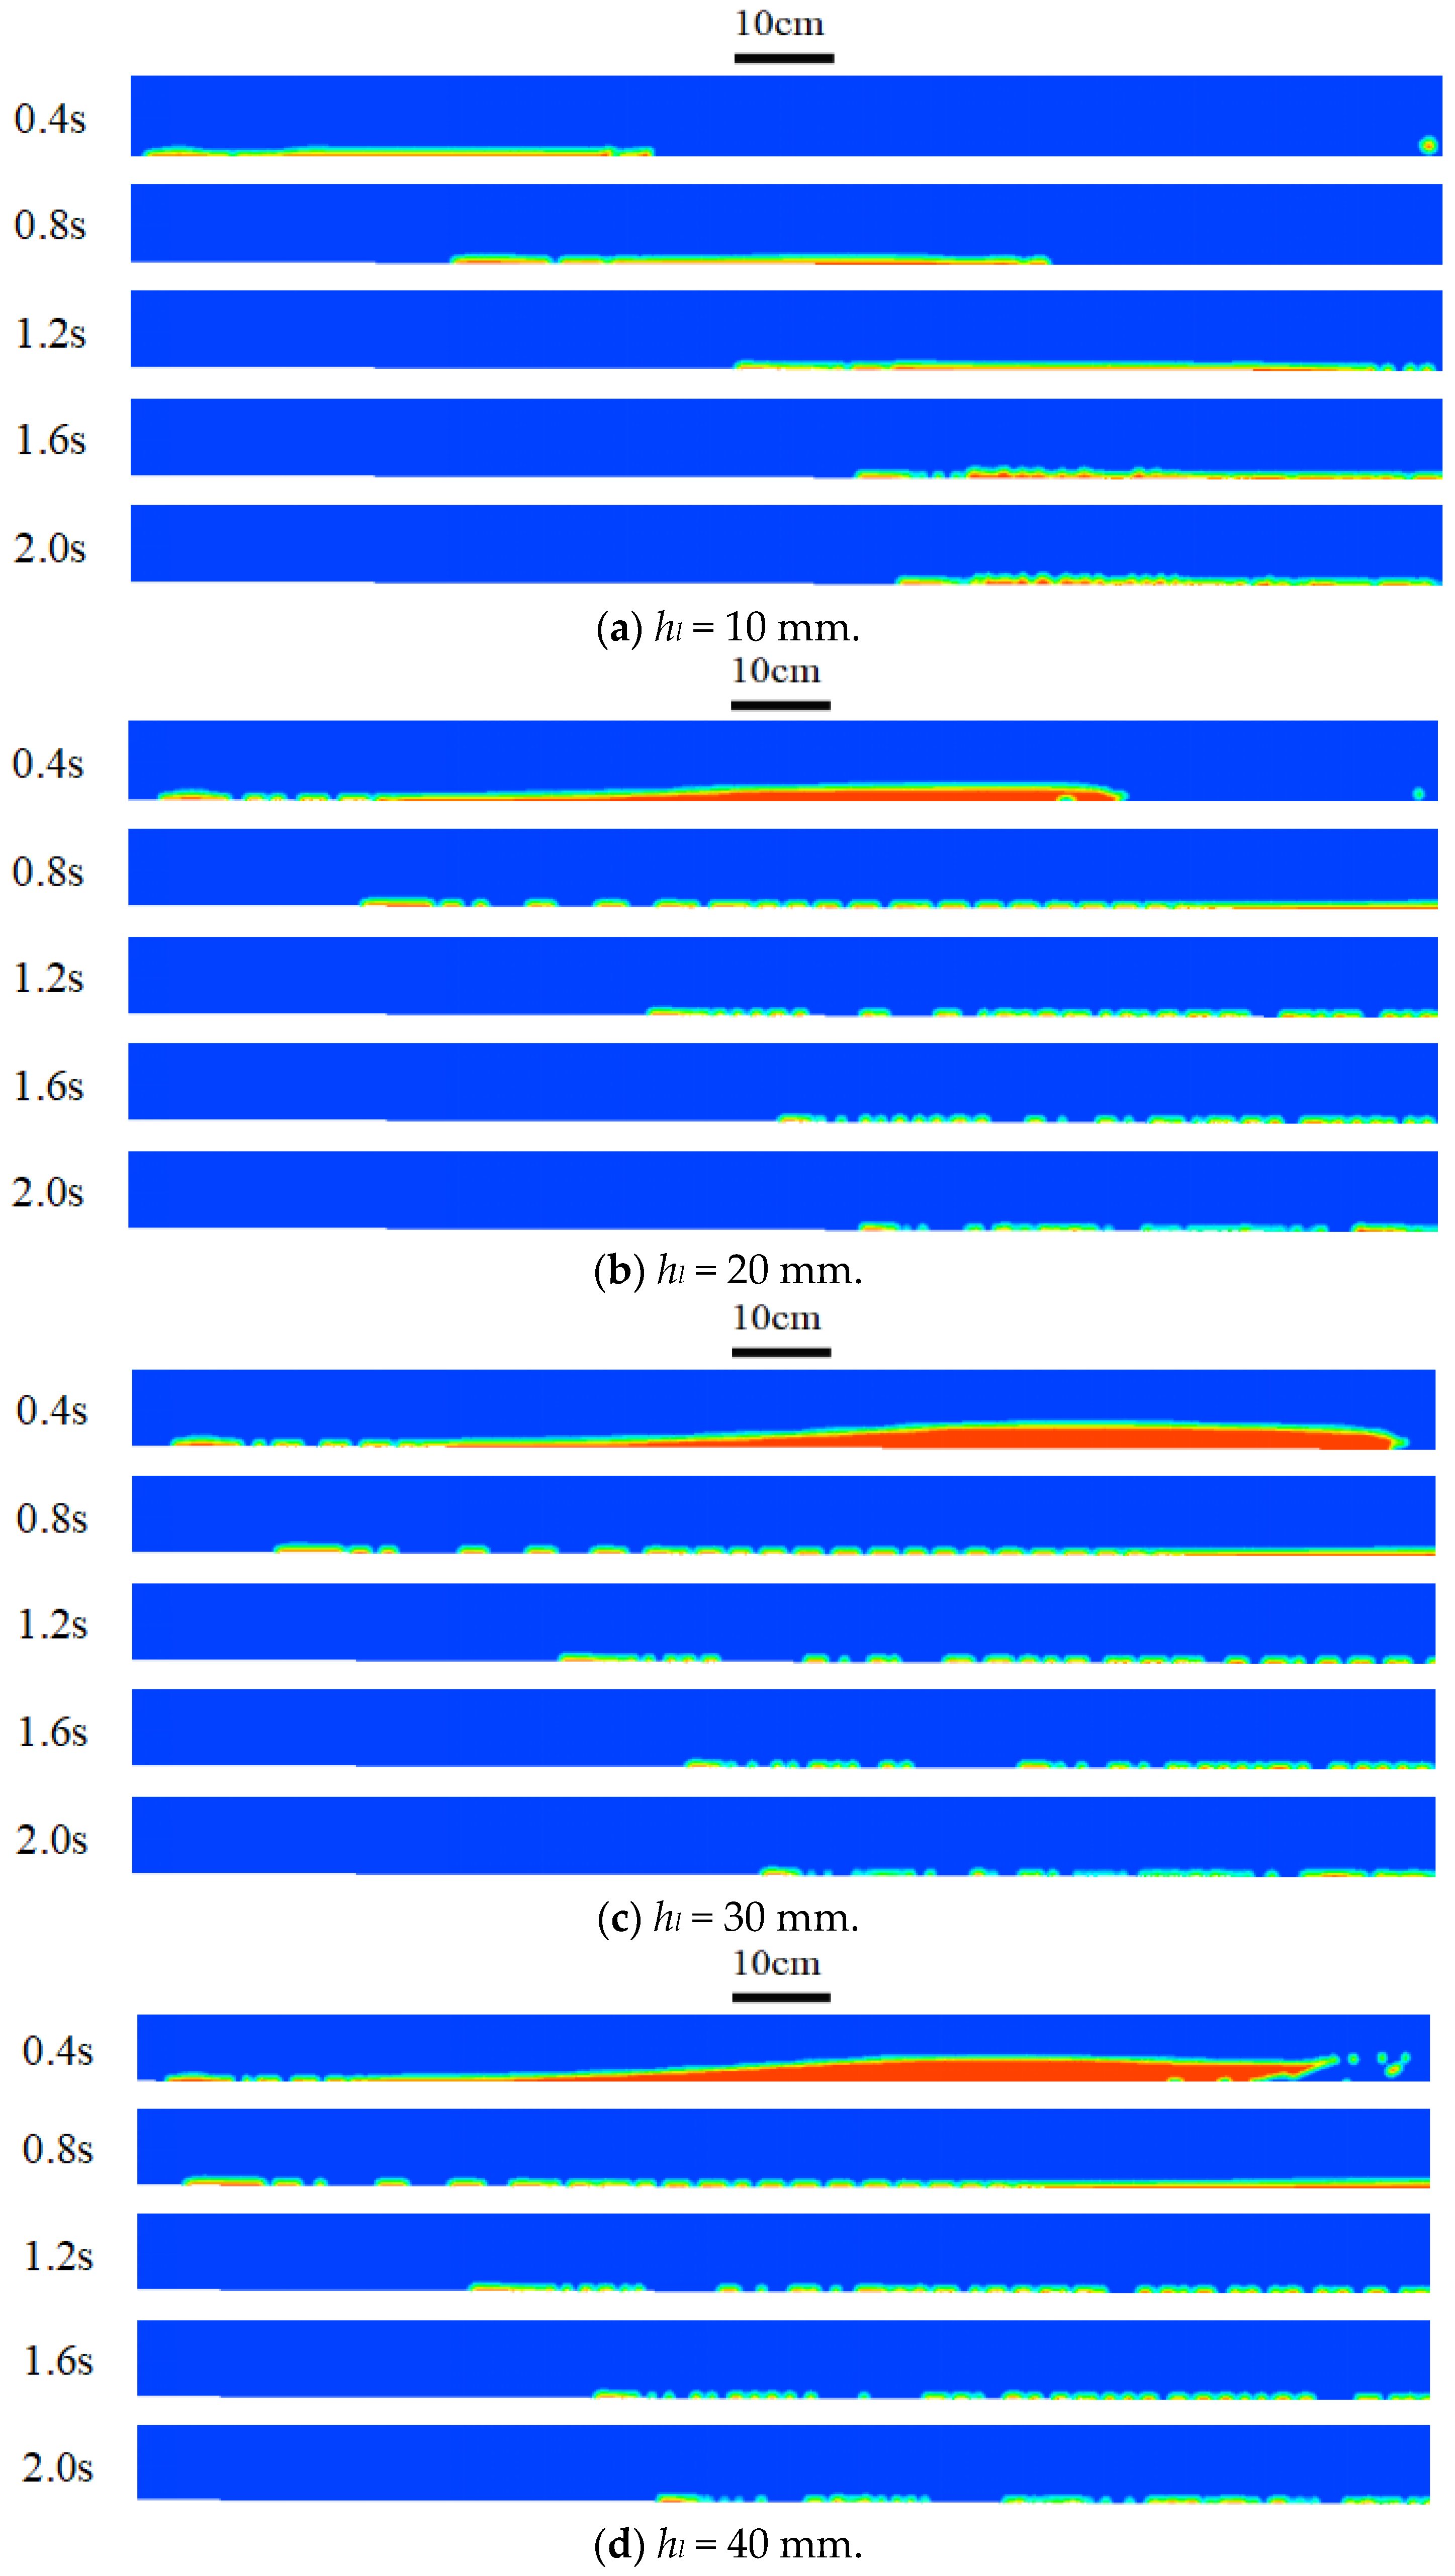
3.1.2. Effects of Initial Retained Oil Thickness on the Flow of Oil Phase

Under different circumstances, different volumes of retained oil may exist in the pipeline, and in this paper, the four cases of the retained oil thickness hl of 10 mm, 20 mm, 30 mm and 40 mm are selected and numerically simulated to study the influence of different initial retention oil depths on the oil flow carried by the gas in the pipeline.
As can be seen from Figure 11a, in the case of different initial retained oil thicknesses, there is a large gap in the speed of the oil phase front end when the oil phase is carried by gas into the upward pipeline in the early stage, and the larger the thickness of the initial retained oil, the faster the speed of the oil phase front end is when entering the upward pipeline. The larger the thickness of the initial retained oil, the higher the liquid holdup at the front end of the oil phase in the initial stage, and the oil phase is closer to the top of the middle line of the pipeline. On the cross-section of the pipeline, the gas phase velocity is distributed in a trapezoidal distribution along the pipe wall to the middle line of the pipeline; the closer to the middle position, the faster the speed, and the faster the speed of the oil flow carried by the gas at this time. At the same time, because of the high liquid content, the flow region of the gas phase is reduced at the front end of the oil phase and the winding effect causes the front end of the oil phase to be lifted rapidly and ruptured by the gas phase to form cracked small oil droplets. As shown in Figure 12a, the initial retained oil thickness is hl = 40 mm, so the oil phase front end has large fluctuations and produces more cracked oil droplets at 0.4 s, but in the case of several other initial retained oil thicknesses this phenomenon was not observed. Since the initial retained oil thickness does not change the liquid holdup in the tail of the oil phase, the speed of the oil phase tail in the upward pipeline has no relationship with the initial retained oil thickness and the tail speed during the entire gas-carrying oil flow process maintains a similar change in rules and values in all simulated initial retained oil thickness conditions.
Different front speeds in the early stage of flow and similar oil phase tail speeds create a huge speed difference between the front and the tail in the early stage of flow under different retained oil thicknesses conditions. As shown in Figure 11c, the larger the thickness of the initial retained oil, the greater the speed difference, making the length of the oil phase entering the initial stage of the upward pipeline longer. Comparing Figure 12a–d, it can be observed that with the development of gas-carrying oil flow, after the oil phase in the front is discharged, the tail oil phase shapes at different initial retained oil thicknesses do not differ much.

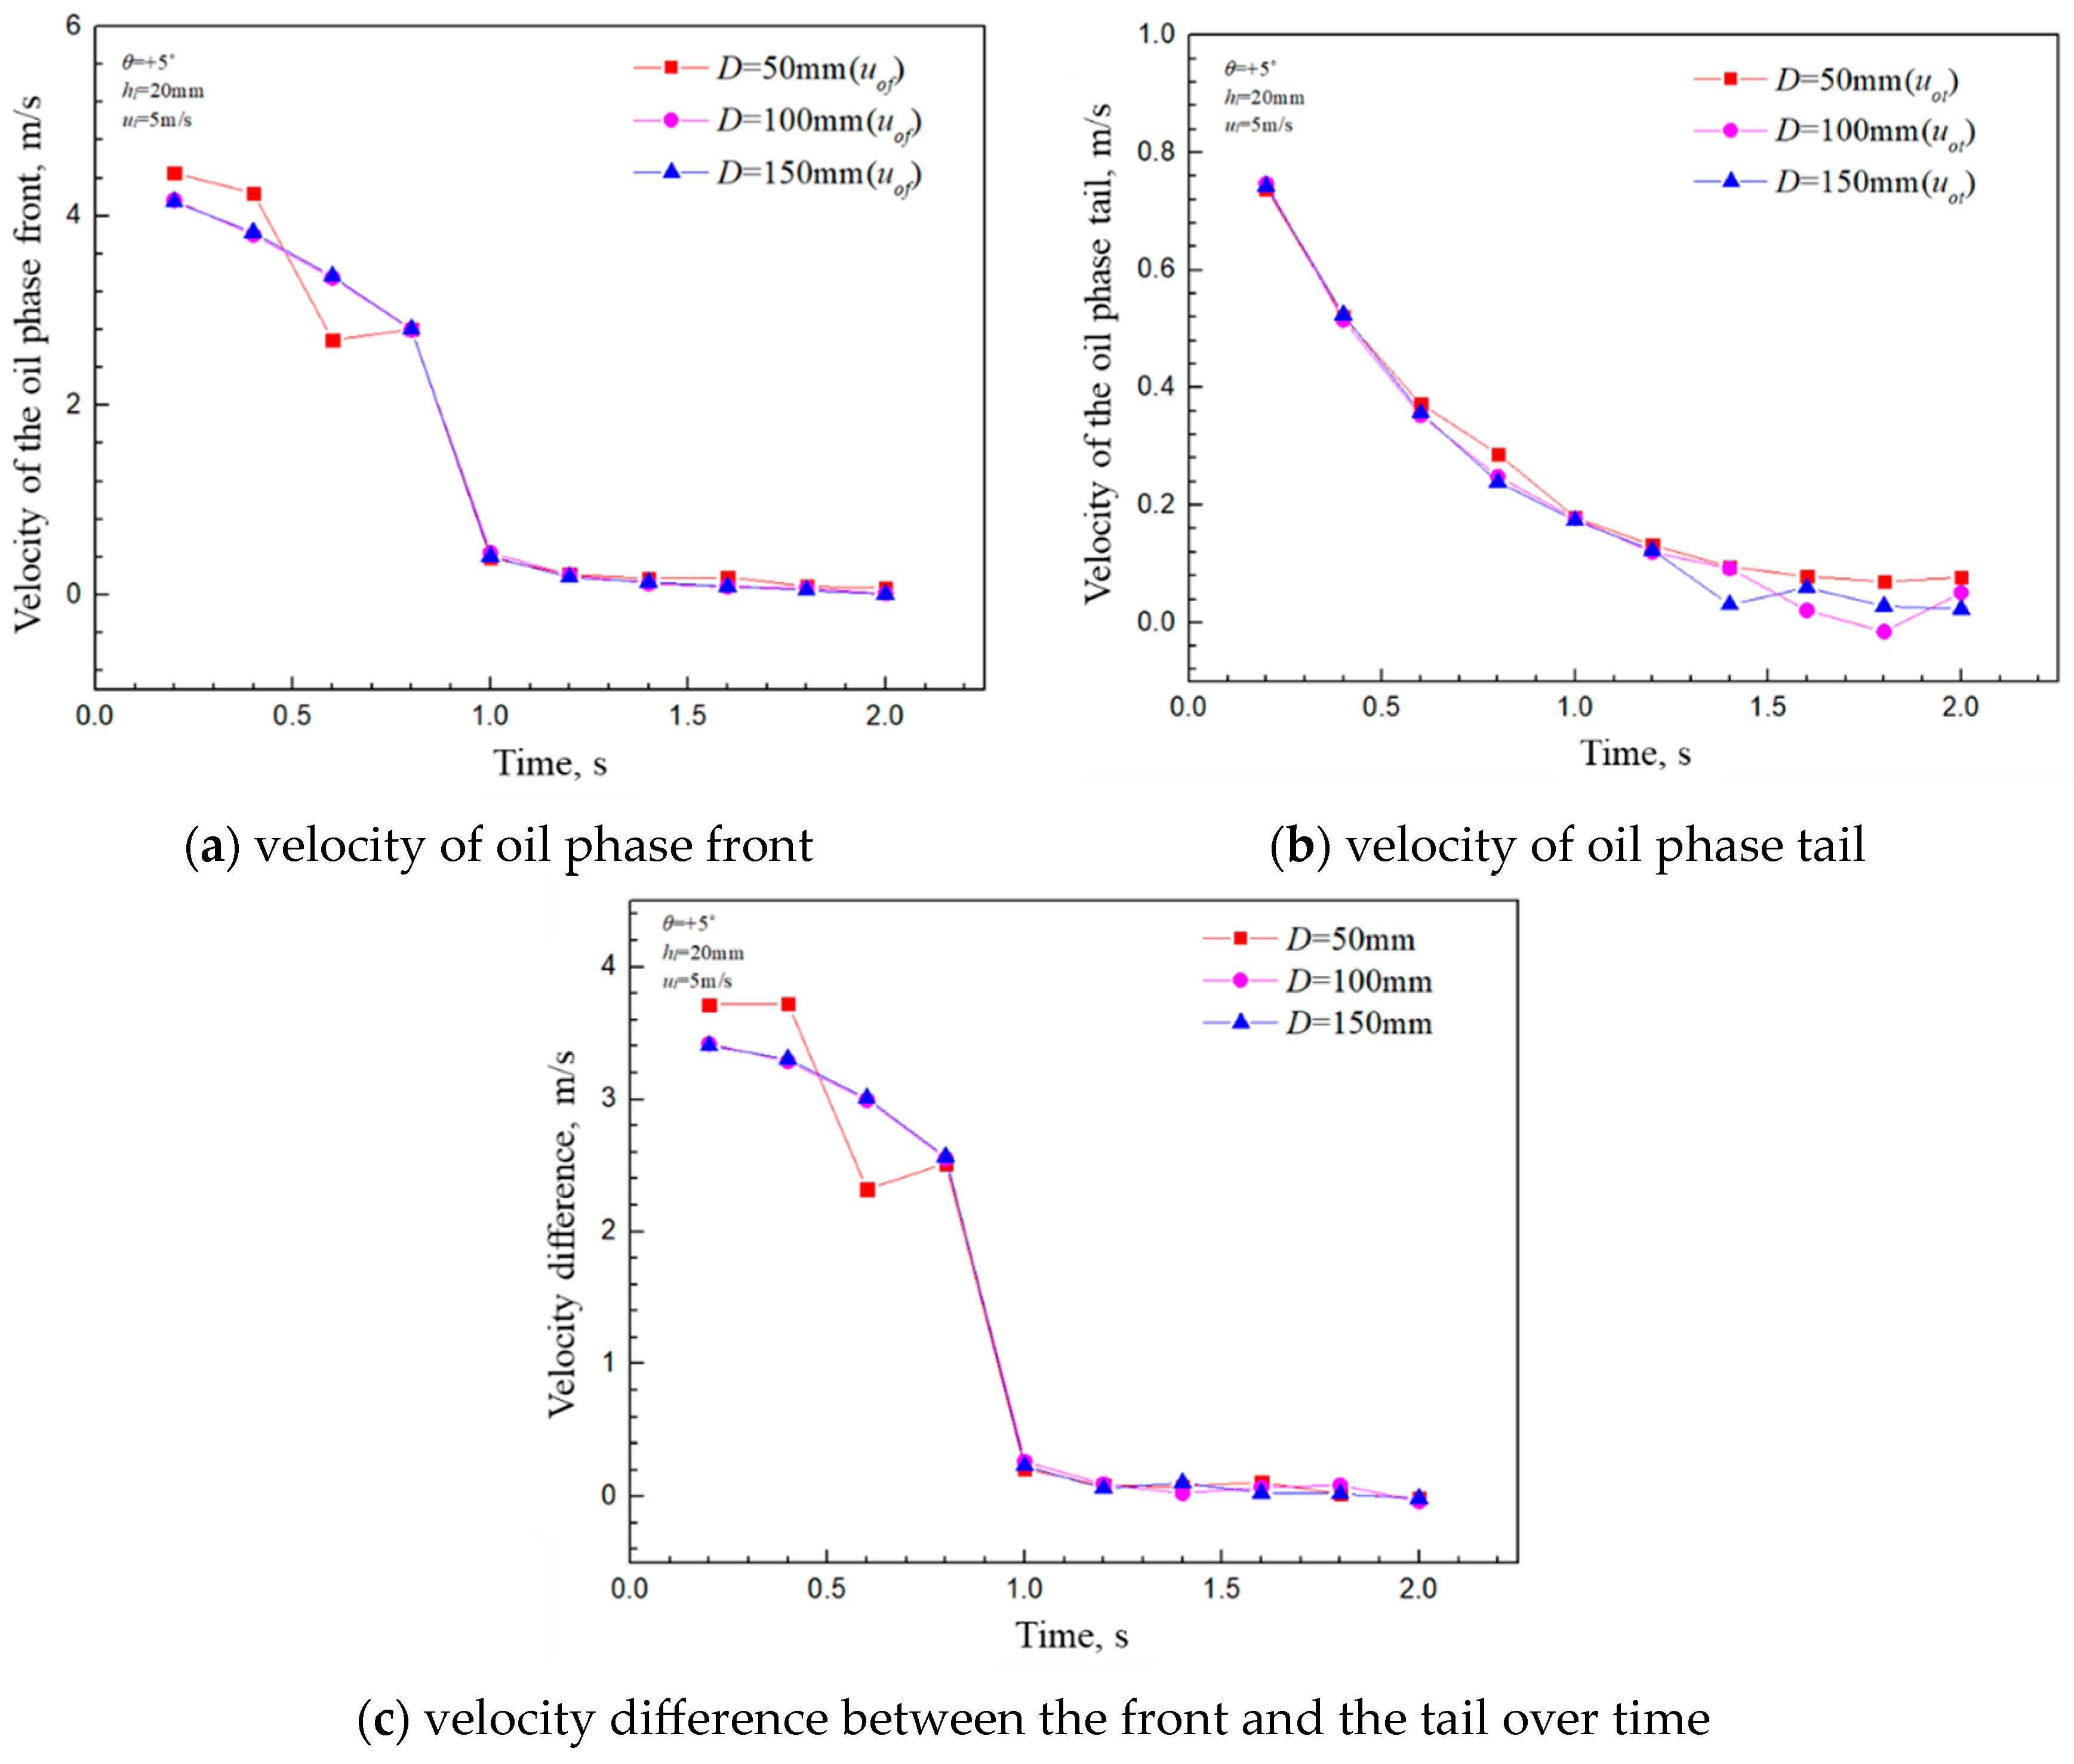
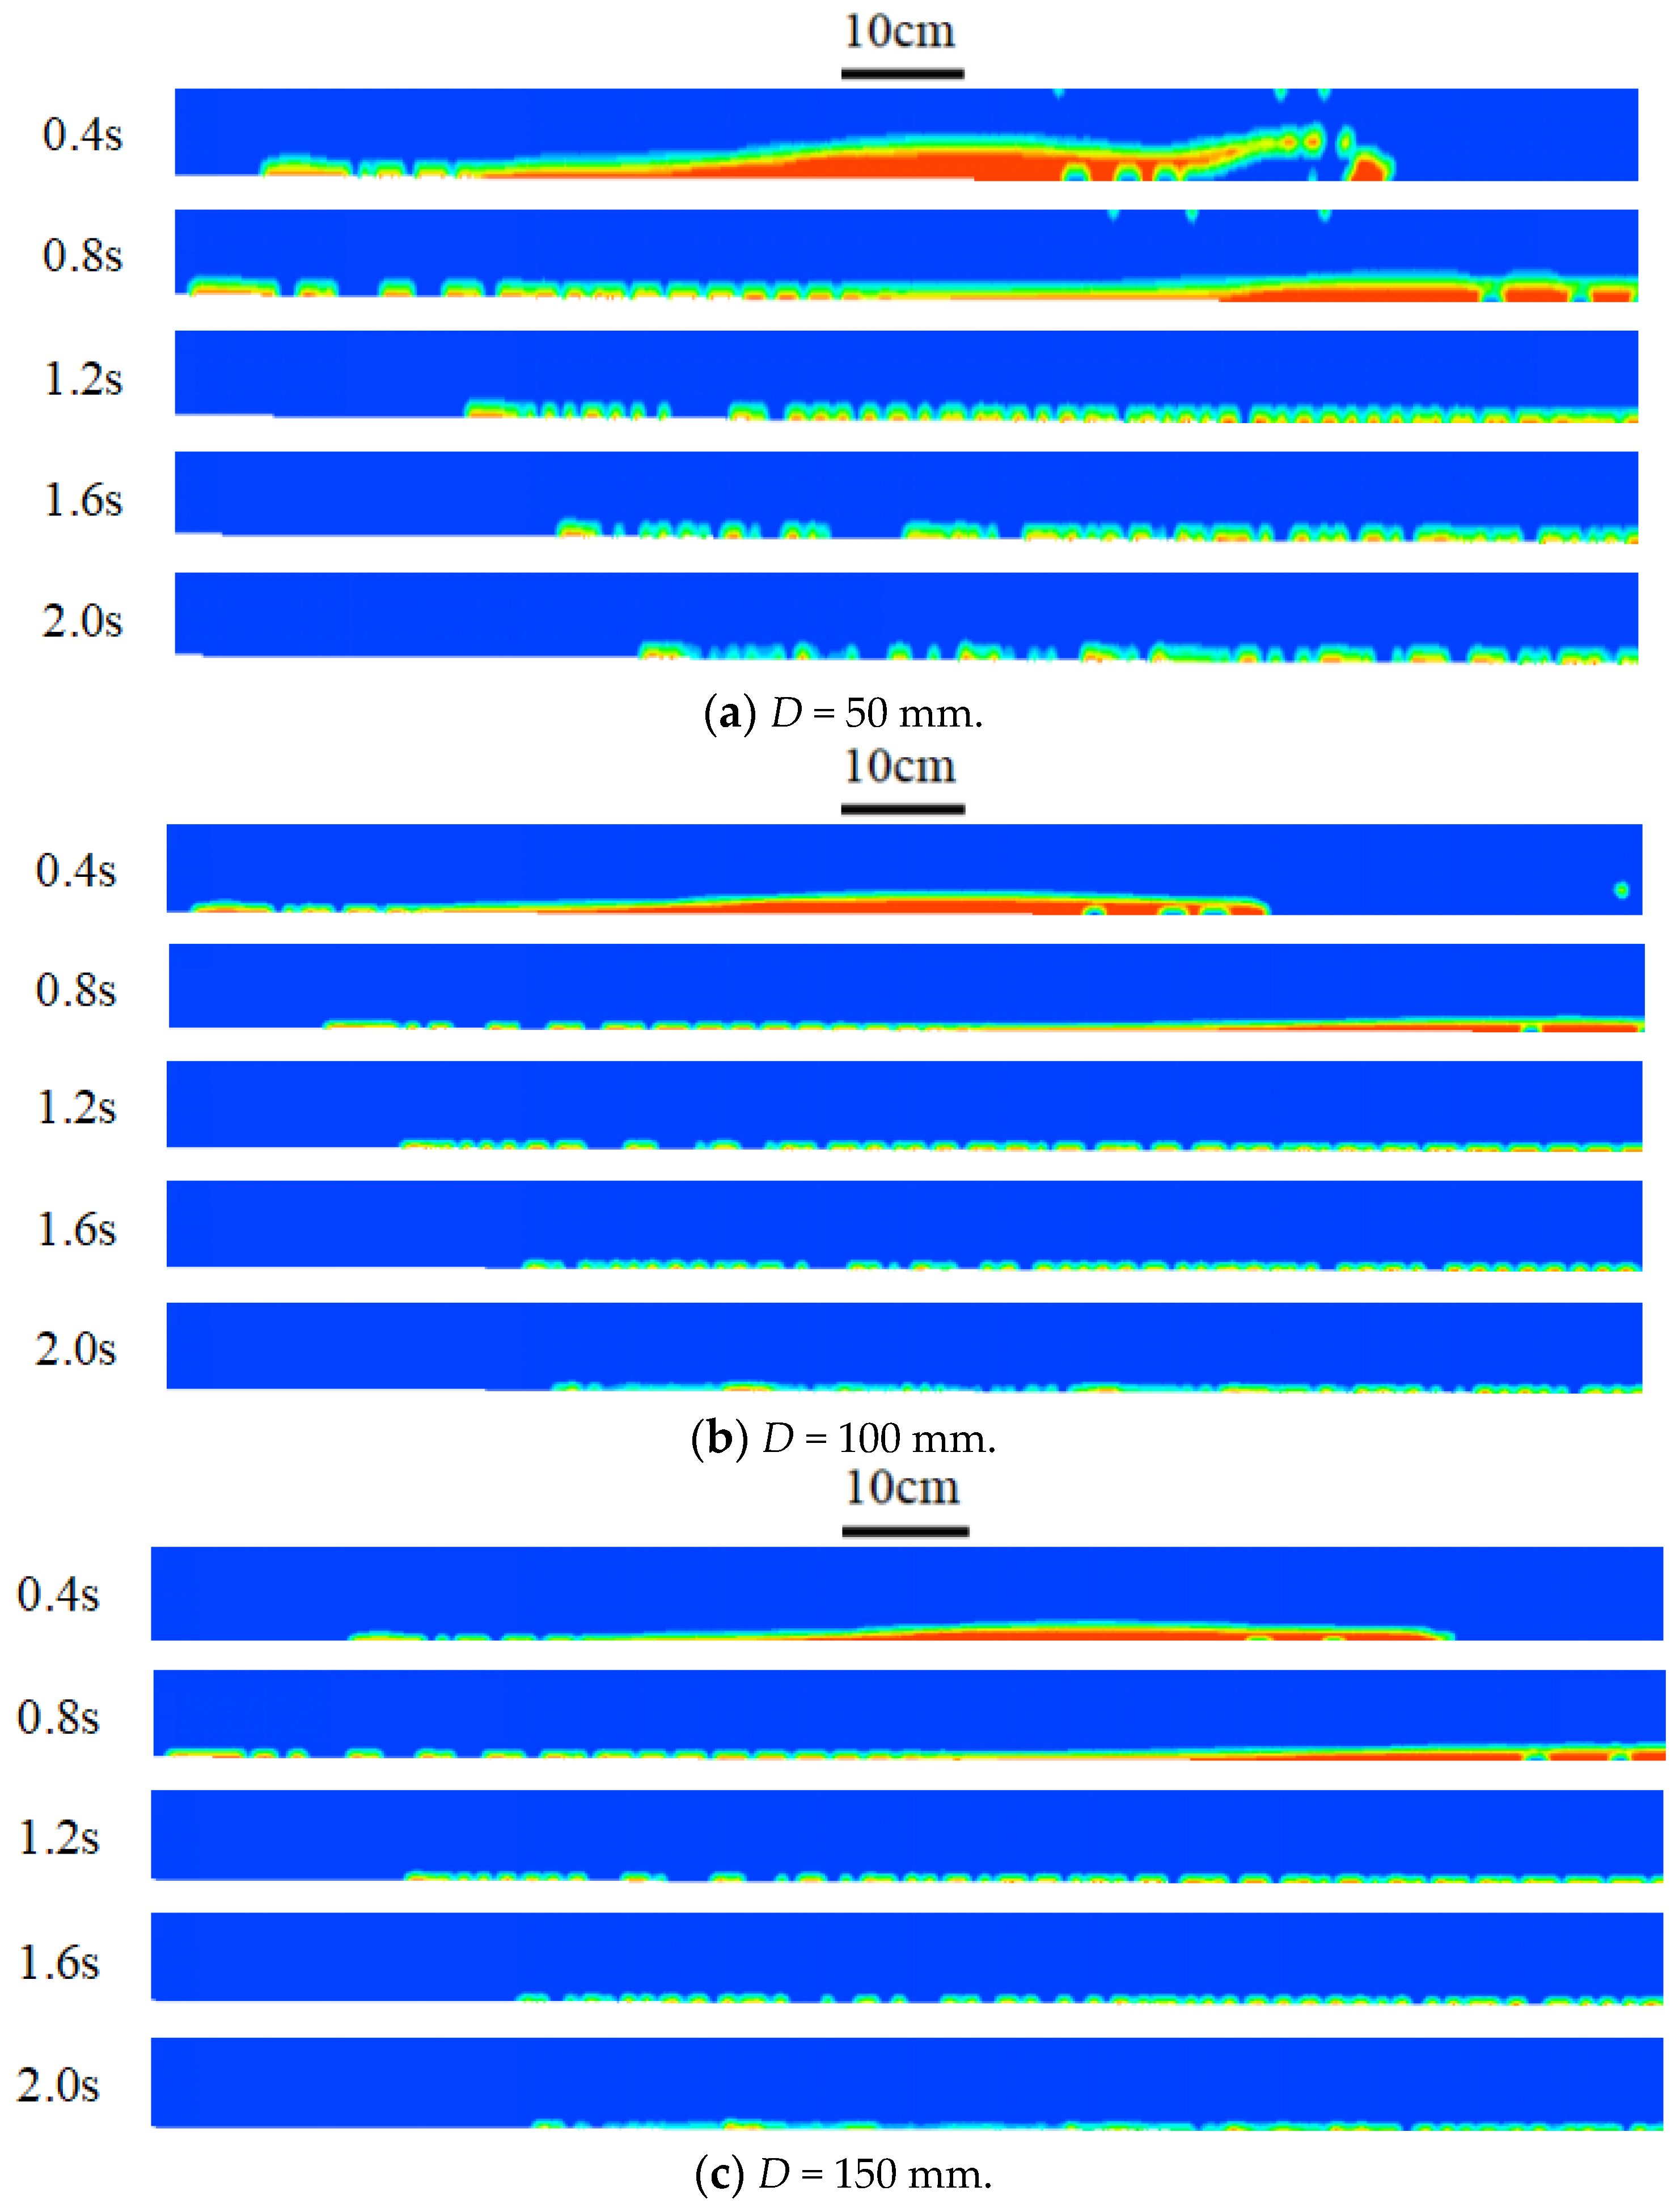
3.1.3. Effects of Pipe Diameter on the Flow of Oil Phase

At present, there are mainly two types of field oil pipeline system in our army: DN100 and DN150, and the gas-carrying oil flow may be different in different pipeline systems. Using numerical simulation, the gas-carrying oil flow was studied under three conditions of pipe diameters of 50 mm, 100 mm and 150 mm.
Figure 13 shows how the speed of the oil phase in the upward pipe is changed over time under different pipe diameter conditions. At the initial stage when the oil phase is carried by gas into the upward pipeline, the front end speed of the oil phase in the 100 mm and 150 mm pipelines is basically the same, but the front speed of the oil phase in the 50 mm pipeline is significantly higher than those of the other two conditions. This is due to the fact that the reduction in the pipeline diameter increases the liquid holdup of the oil retained in the pipeline, and under the same inlet gas phase velocity, the higher the liquid holdup, the faster the speed of the oil phase front end. At the same time, in the 50 mm pipeline, the high liquid holdup in the oil phase front end makes the disturbance of the gas to the oil phase increase. After the oil head is near to the middle line of the pipeline, it is blown away by the high-speed gas phase, forming a large number of broken oil droplets, and the gas phase near the pipe wall is swept into the oil phase front end to form small bubbles, as shown in Figure 14a. After 0.8 s, as the oil head is discharged from the pipeline by the gas, the speed change law of the oil phase front end in the pipeline tends to be consistent under the conditions of different pipeline diameters. Under different pipe diameter conditions, the oil phase tail has the same speed after entering the upward pipeline, and in the late stage of the oil flow carried by gas, the smaller the pipe diameter, the more cracked small oil drops form at the end of the oil phase, making the tail speed slightly higher, as shown in Figure 13b. Comparing Figure 14a–c, it can be found that since the front speed of the oil phase in the 50 mm pipeline is higher than those in the 100 mm and 150 mm pipelines in the initial stage, the length of the oil phase in the upward pipe is also greater than those in the other two pipe diameter conditions in the initial stage. However, in the later stage of the gas-carrying oil flow, due to the slightly faster speed of the oil phase tail under the condition of small pipe diameter, the difference in the length of the retained oil in the pipeline is gradually reduced.

3.2. The Change Law of Pipe Pressure Drop

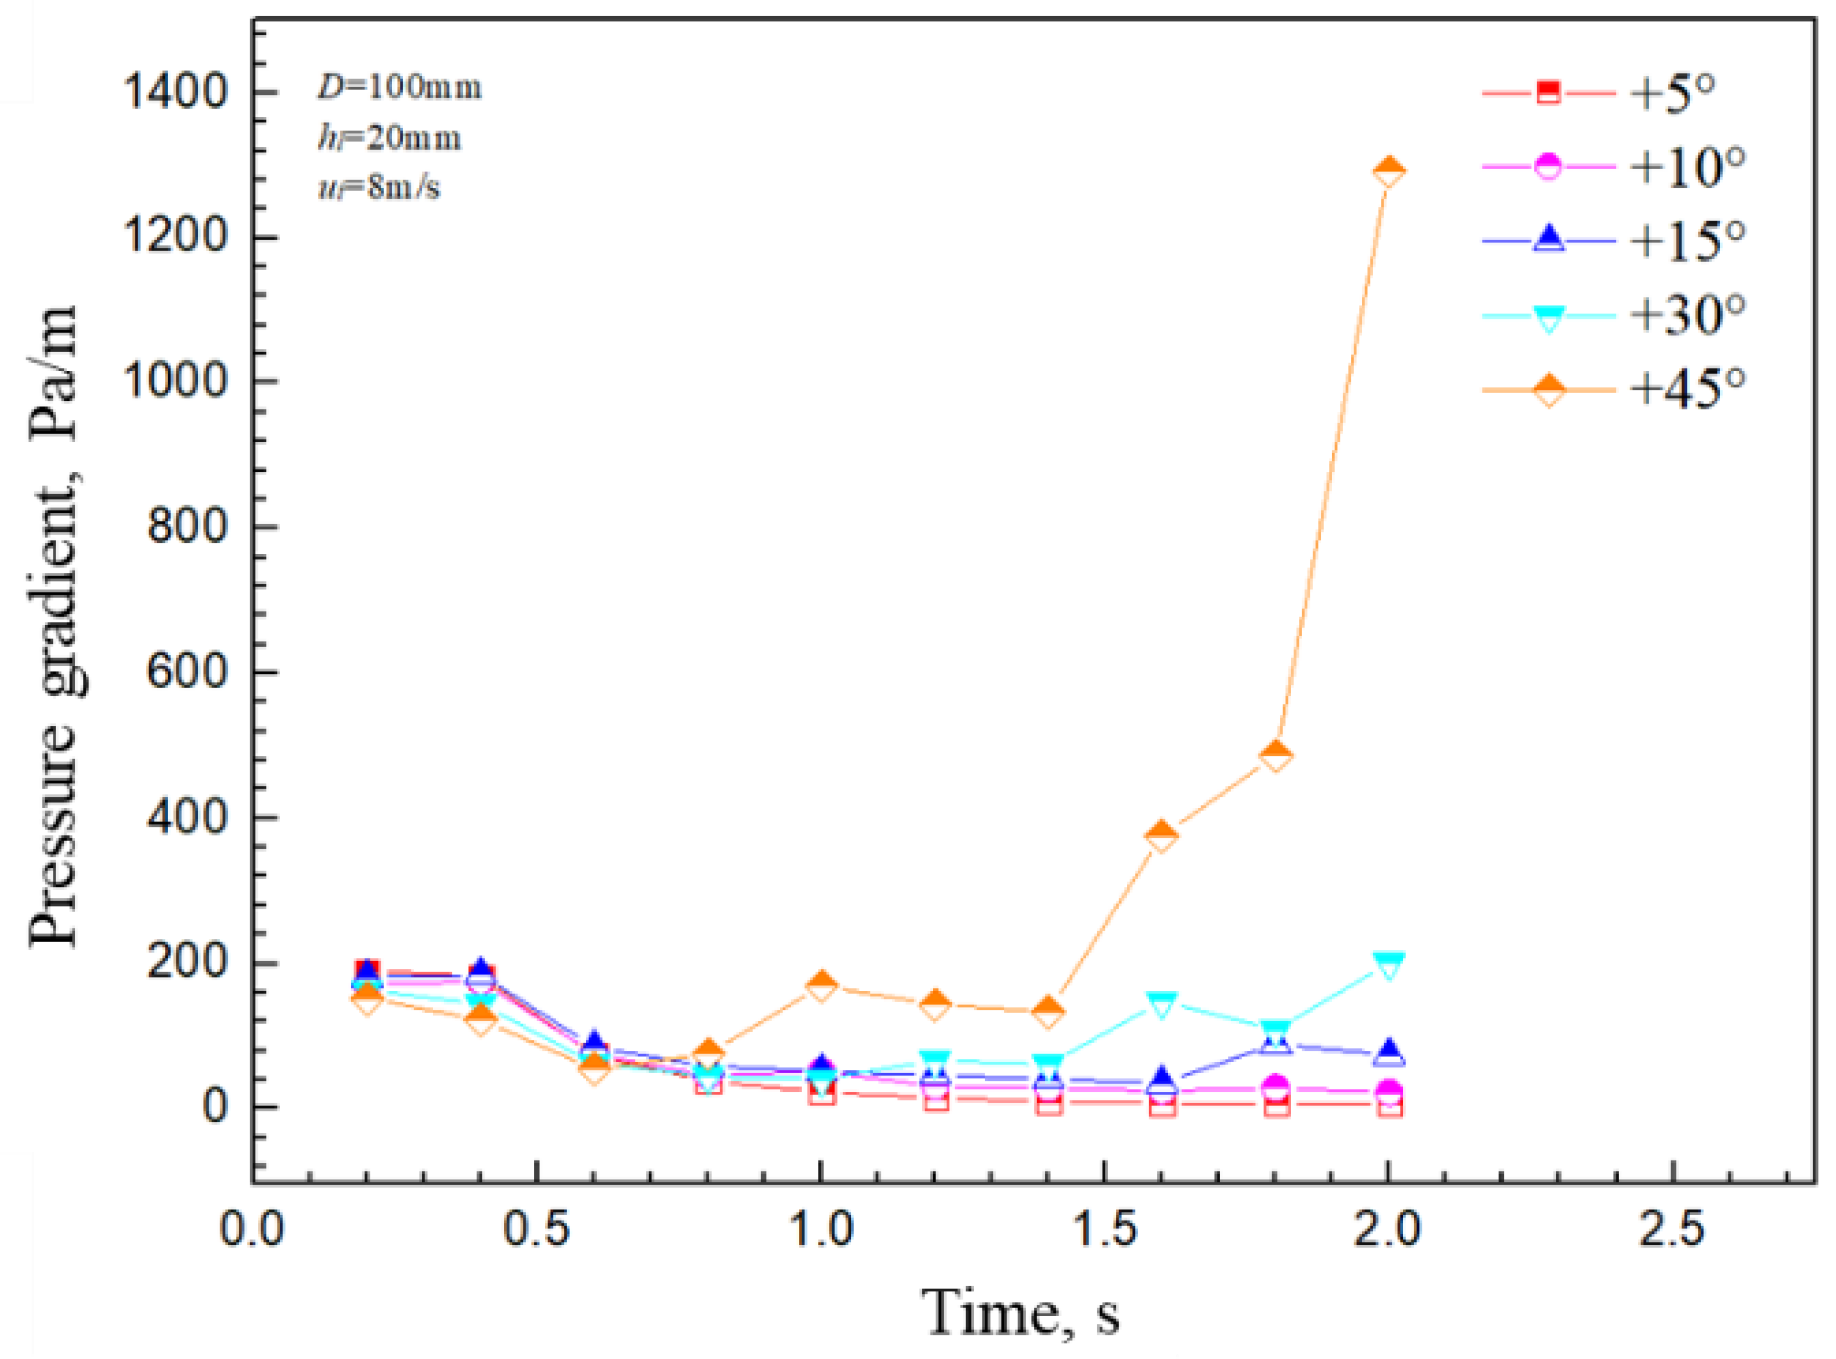
3.2.1. Effects of Inclination Angle on Pipe Pressure Drop

In the actual laying process of the mobile oil pipeline, due to the influence of the local topography, the actual pipeline may be in a variety of different undulating states. Different positions have different tilt angles, especially in the southwest of China where the mountains are densely forested and the terrain conditions are more complex. In order to make the study closer to the actual situation and to find the impact of different inclination angles on the gas-carrying oil flow, this paper selects the five tilt angles of +5°, +10°, +15°, +30° and +45° for numerical simulation.
The simulation results are shown in Figure 15 for the change in pressure drop in the upward pipeline when the gas-carrying oil flows at different inclination angles. In the initial stage of the retained oil being carried by the gas into the upward pipeline, the average pressure drop in the upward pipe is relatively reduced as the inclination angle increases. This is due to the fact that in the initial stage, as the angle of inclination grows, the oil retention length of the up-hill pipe decreases. At this point, the variation range in the pressure drop caused by the change in the oil phase shape is also reduced, and the average pressure drop in the uphill pipeline becomes lower. At 0.7 s, due to the return of oil droplets in the tail in the +45° inclination angle pipeline, the overall length of the oil phase is elongated. The gas phase disturbance makes the shapes of oil droplets constantly change as the oil droplets continue to rupture, coalesce and form new oil droplets in the entire uphill pipeline, and the average pressure drop in the uphill pipeline begins to rise. At the +15° and +30° inclination angles, backflow in the tail occurs late, and the average pressure drop in the upward pipe begins to rise at 1.0 s and 1.6 s, respectively. At the +5° and +10° inclination angles, due to the absence of backflow during the entire gas-carrying oil flow process, the average pressure drop in the upward pipe gradually decreases with time, and there is no recurrence. At 1.4 s, the return oil droplet velocity in the tail in the +45° inclination pipe reaches the maximum, and a small number of ruptured oil droplets in the pipeline enter the gas phase and are carried by the gas phase to start moving up the pipeline again. It is at this point when the average pressure drop in the up-hill pipe rises sharply.
In summary, when the gas-carrying oil flow in the pipeline does not return, the inclination angle has little effect on the average pressure drop in the upward pipeline, and the pressure drop is gradually reduced with the gradual discharge of the retained oil out of the pipeline by the gas-carrying. When the flow returns, the pressure drop in the pipeline rises again, and the average pressure drop increases with the increase in the inclination angle.

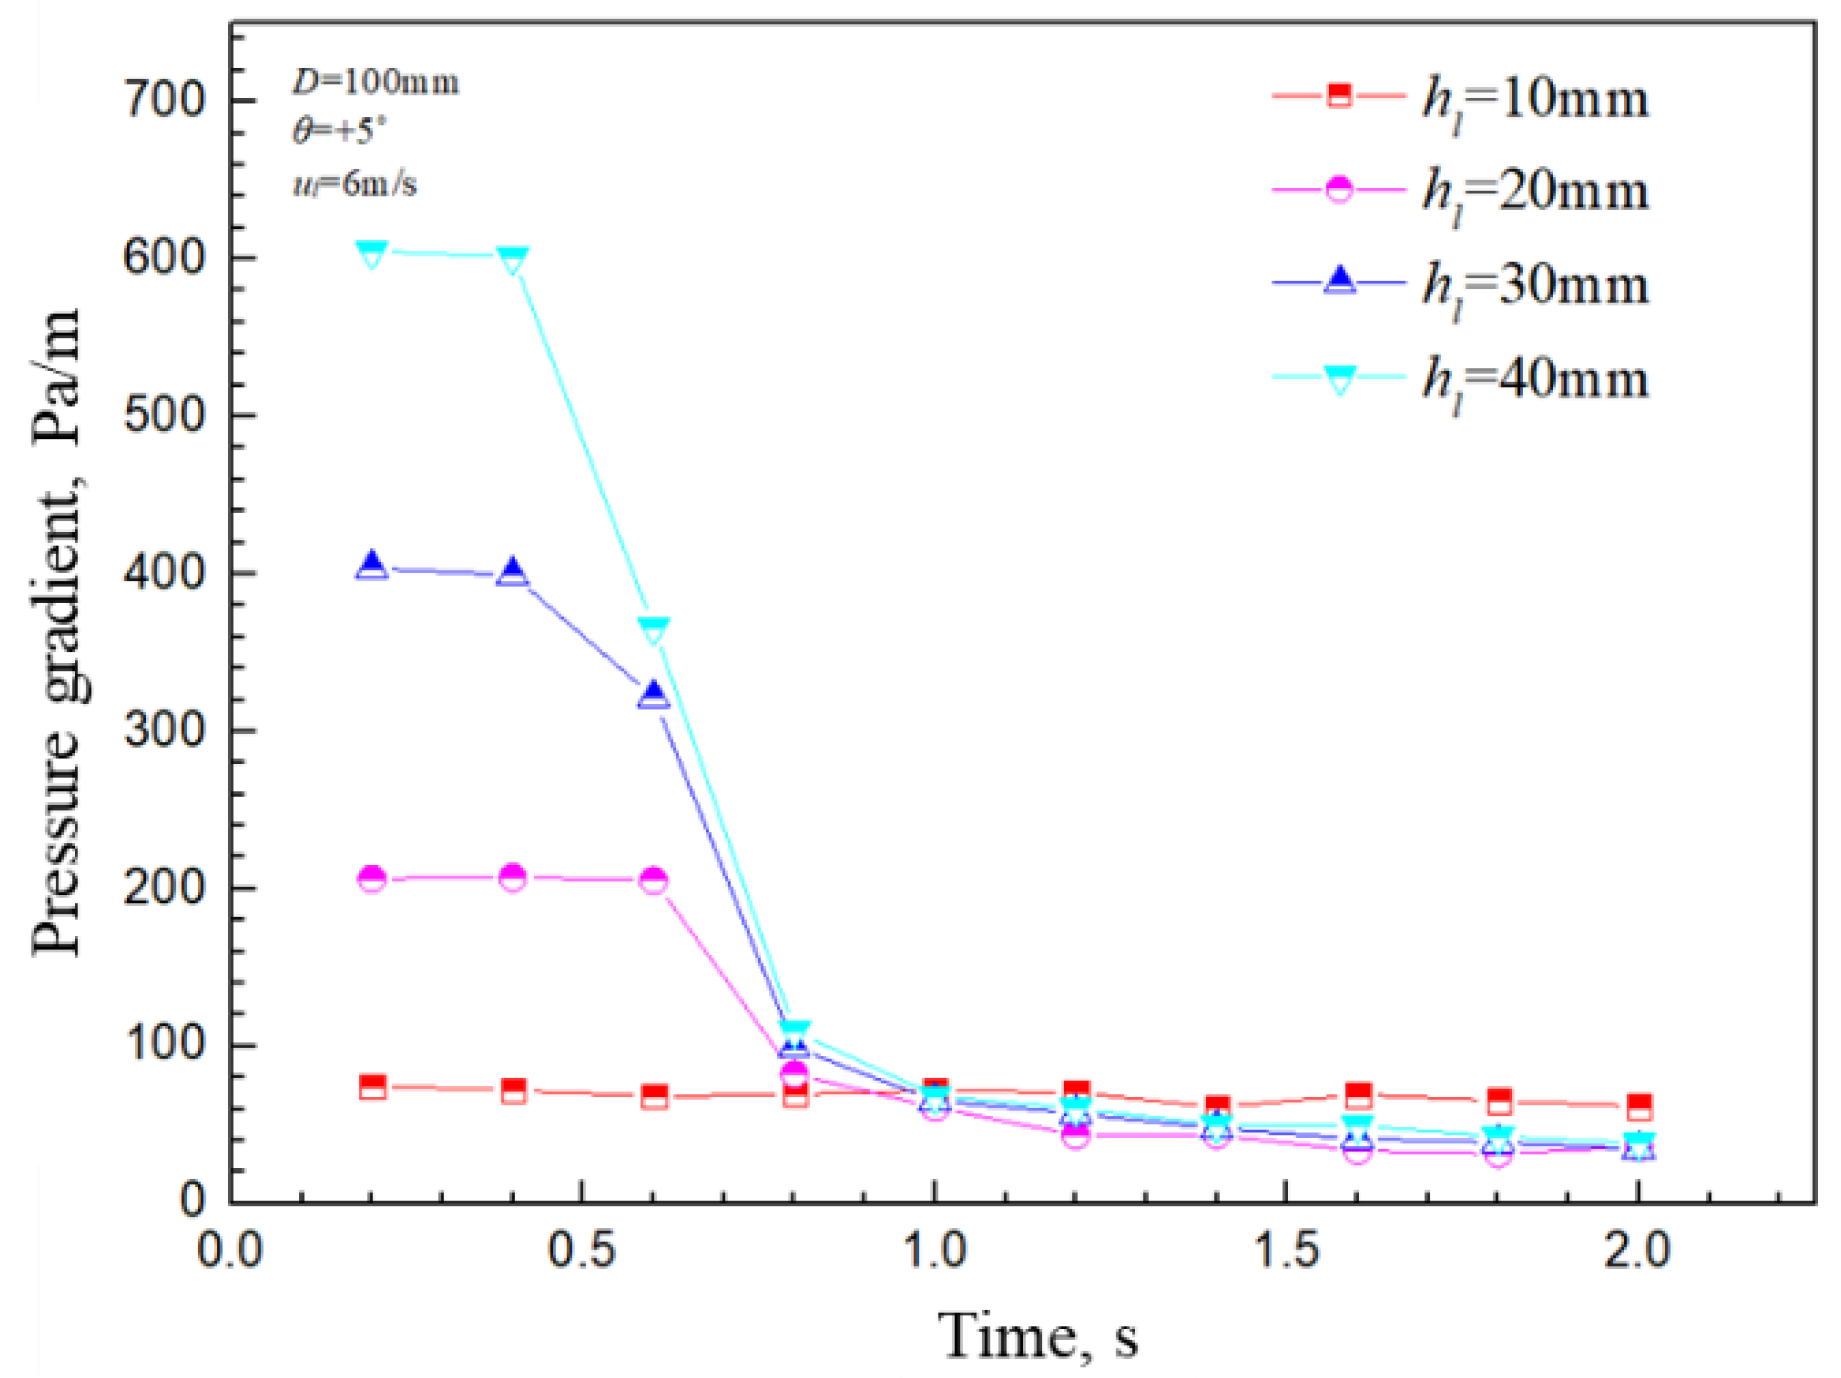
3.2.2. Effects of Initial Retained Oil Thickness on Pipeline Pressure Drop

Figure 16 shows the variation in the average pressure drop in the upward pipeline with time at different initial retained oil thicknesses. It can be seen that at the initial stage when the oil phase is carried into the upward pipeline by gas, the greater the thickness of the initial retained oil, the higher the average pressure drop in the pipeline. The greater the thickness of the initial retained oil, the longer the length of the oil phase in the initial stage when it enters the upward pipeline; the greater the thickness of the initial retained oil, the greater the thickness of the front end of the oil phase, and with the flow area of the gas phase being reduced, this makes the pressure drop increasingly high in the pipeline. With the rapid discharge of the front end of the retained oil, the pressure drop in the pipeline shows a downward trend and gradually becomes stable. The velocity, length and shape of the remaining oil phase tail in the pipeline are not affected by the thickness of the initial retained oil. Therefore, after 1.0 s, the average pressure drop in the upward pipe is almost the same and remains stable at different initial retained oil thicknesses.
Under the condition of the initial retained oil thickness hl = 10 mm, the average pressure drop in the upward pipe remains almost unchanged during the entire gas-carrying oil flow process and is maintained at a low state. This is due to the fact that when the initial oil retention threshold is low, the front end of the oil phase can not form a large bullet-shaped oil head. After the retained oil enters the upward pipeline, the whole is flattened and uniformly slender, and the thickness of the oil phase is almost the same everywhere from head to tail. When the thickness of the initial retained oil is hl = 10 mm, the change trends of the velocity at the front and at the tail of the oil phase are basically the same, while the change trend of the velocity difference between the front and the tail and the length of the oil retention in the upward pipeline does not change much during the entire gas-carrying oil flow process, as shown in Figure 16.

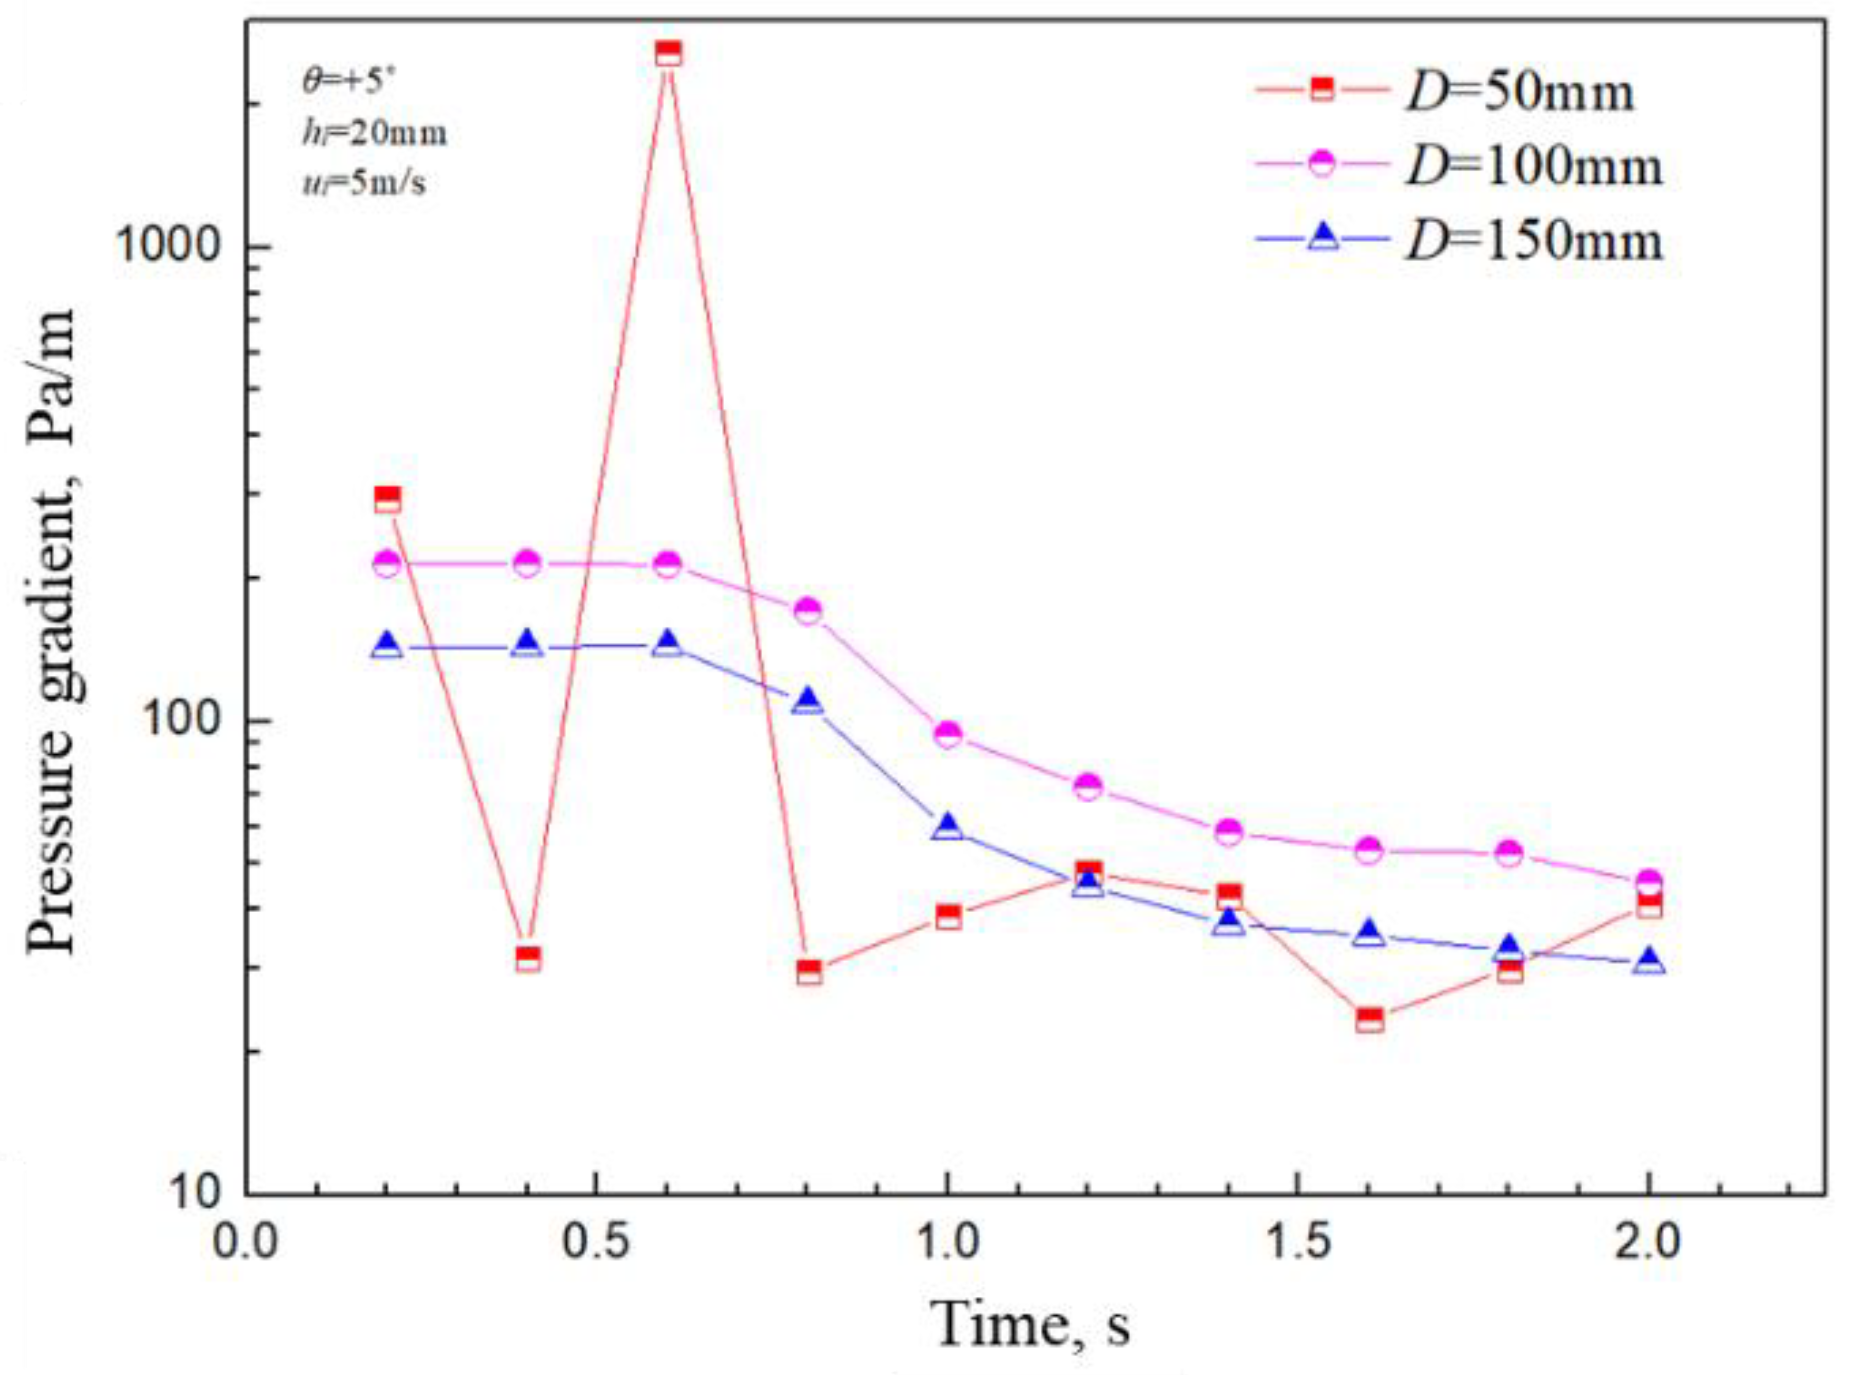
3.2.3. Effects of Pipe Diameter on Pipeline Pressure Drop

Figure 17 shows the variation in average pressure drop in an upward pipe over time in different pipe diameters. In 100 mm and 150 mm pipelines, the change trend of pressure drop is the same, and with the flow of gas-carrying oil, the pressure drop change in the pipeline gradually decreases. The smaller the pipe diameter, the higher the liquid holdup, so on the whole the average pressure drop in the 100 mm pipeline is higher than that in the 150 mm pipeline. In the 50 mm pipeline, at the beginning of the gas-carrying oil flow, the oil phase front end is lifted up and blown apart by the gas phase to form a large number of oil droplets, and the broken oil droplets are carried by the gas phase in the pipeline to flow dispersedly resulting in a huge fluctuation of the average pressure drop in the upward pipeline. After 0.8 s, as the oil phase front end is discharged from the pipeline, the pressure drop in the pipeline gradually stabilizes. The smaller the pipeline diameter, the smaller the oil droplets that form at the tail of the oil phase. In the oscillation stage of the gas-carrying oil flow, a large number of small oil droplets mean that the rupture and merger of oil droplets will occur frequently during the flow process, making the average pressure drop in the upward pipeline fluctuate again.

4. Conclusions

Based on the analysis of the process of oil flow carried by gas in the upturned pipeline and the theory of gas–liquid two-phase stratified flow, a critical gas phase velocity model is established when the gas in the upward pipeline drives the overall flow of the oil. Aiming at the evacuation process of the retained oil by gas, the flow models of the retained oil in the tail and in the head were established, respectively, and the variation in the gas-carrying oil in the upward pipe was analyzed under the conditions of the five inclination angles of +5°, +10°, +15°, +30° and +45°, four initial oil retention thicknesses of 10 mm, 20 mm, 30 mm and 40 mm, and three pipeline diameters of 50 mm, 100 mm and 150 mm.
After the retained oil in the pipeline is carried by the gas into the upward pipe, the oil phase is in the form of a slender eccentric large water droplet. Because the retained oil is in the upward pipe, affected by the axial component of gravity of the pipeline, its flow can be divided into three stages: the initial discharge stage, the oscillation stage and the final discharge (reflux) stage. Most of the stagnant oil is initially drained from the pipeline, and the remaining small amount of ruptured oil droplets at the tail oscillate and flow in the pipeline. When the gas phase velocity at the tail oil droplets stops the retained oil entering the upward pipe from returning to the bottom of the pipeline, the apparent velocity of the gas phase at this time is defined as the critical gas-carrying liquid velocity.
The study discovered that the inclination angle had the biggest effect on the process of oil flow carried by gas in the upward pipe, while the initial oil retention thickness had lower impact on the process of oil flow carried by gas in the upward pipe. When the pipe size was small, the oil flow carried by gas in the upward pipe was greatly affected by it, but when the pipe size was large, its impact on the gas-carrying oil flow in the upward pipe gradually reduced. The critical influential factors to decide whether the stagnant oil in the upward pipeline can be totally emptied are the pipeline inclination angle and the critical oil content rate. The amount of initial stagnant oil in the pipeline has no influence on the ultimate emptying, but in the same working situation, the more the stagnant oil is, the quicker speed of the oil phase in the initial period; therefore, more stagnant oil can be drained out from the pipeline at this stage and the oscillation time of the remaining stagnant oil in the pipeline can be reduced.

Author Contributions

Conceptualization, H.L., J.D.; data curation, H.L., and J.C., J.T.; formal analysis, N.L. and Y.C.; investigation, H.L.; methodology, J.D., H.L. and J.T.; validation, J.C. and J.T. All authors have read and agreed to the published version of the manuscript.

Funding

This research was funded Natural Science Foundation of China (52302422 and 52272338), Major Project of Science and Technology Research Program of Chongqing Education Commission of China (KJZD-M202212901, KJZD-M202212903), Young Elite Scientists Sponsorship Program (2020-JCJQ-QT-005).

Data Availability Statement

Data are contained within the article.

Conflicts of Interest

Author Jianhui Chen was employed by the company China National Aviation Fuel Corporation Ltd. Wenzhou Branch. Na Li was employed by the company China Petroleum Technology and Development Corporation. The remaining authors declare that the research was conducted in the absence of any commercial or financial relationships that could be construed as a potential conflict of interest.

Nomenclature

PpressurePa
Llength of the pipem
τwlshear stress between the liquid phase and the pipe wallN/m2
τwgshear stress between the gas phase and the pipe wallN/m2
Slwetted perimeter of the liquid phasem
Sgwetted perimeter of the gas phasem
Alcross area of the pipeline taken up by the liquid phasem2
Agcross area of the pipeline taken up by the gas phasem2
ρlliquid phase densitykg/m3
ρggas densitykg/m3
Silength of the gas-liquid boundary line on the cross section of the pipem
τithe shear stress on the gas–liquid interfaceN/m2
θthe pipe inclinationrad
flthe hydraulic friction coefficient of the liquid phase
fgthe hydraulic friction coefficient of the gas phase
fithe hydraulic friction coefficient between the gas–liquid interface
ul.the region moves at an average velocitym/s
ltthe calculation area of the liquid film tailm
h ˜ l liquid holdup
moml|xthe momentum of the liquid film surface
σthe surface tension coefficients at the interface between gas–liquid
σslthe surface tension coefficients at the interface between wall–liquid
σsgthe surface tension coefficients at the interface between wall–gas
ufrontthe front end moves forward at the average velocitym/s
mlThe liquid shedding rate
Ckthe kinematic wave velocitym/s

References

  1. Jiang, J.; Zhang, Z.; Li, J.; Chen, Y.; Chen, M.; Jiang, W. Resistance Characteristics of Oil-gas Two-phase Flow for Mobile Pipeline Evacuation Operation. Acta Armamentarii 2021, 42, 888–896. [Google Scholar]
  2. Rodrigues, H.-T.; Pereyra, E.; Sarica, C. Pressure Effects on Low-Liquid-Loading Oil/Gas Flow in Slightly Upward Inclined Pipes: Flow Pattern, Pressure Gradient, and Liquid Holdup. SPE J. 2019, 24, 2221–2238. [Google Scholar] [CrossRef]
  3. Guo, R.; Zhang, W.; Jiang, J.; Li, J.; Zhang, Y. Gas-liquid two-phase flow characteristics in pump-assisted evacuation process for pipeline. Int. J. Heat Technol. 2017, 35, 1045–1050. [Google Scholar] [CrossRef]
  4. Zheng, J.; Zhang, W.; Jiang, J.; Rui, G. Oil residual layers in water-Oil displacement flow. Chem. Eng. Trans. 2017, 62, 295–300. [Google Scholar]
  5. Banafi, A.; Talaie, M.-R. A new mechanistic model to predict gas-liquid interface shape of gas-liquid flow through pipes with low liquid loading. AIChE J. 2015, 61, 1043–1053. [Google Scholar] [CrossRef]
  6. Jiang, J.; Zhang, W.; Yong, Q.; Jiang, M. Analysis of the Influencing Factors and Mechanism of Gas Draining Rate of Mobile Pipeline. Acta Armamentarii 2017, 38, 585–592. [Google Scholar]
  7. Guo, R.; Zhang, W.; Jiang, J.; Li, J.; Zhang, Y. Gas-liquid flow characteristics in evacuation process for ascending pipelines. J. China Univ. Pet. 2017, 41, 146–152. [Google Scholar]
  8. Guo, R.; Zhang, W.-M.; Jiang, J.-Z.; Liu, Z.-J. Numerical Simulation of Mobile Pipeline Gas-Gap Emptying Based on OLGA. J. Chem. Eng. Chin. Univ. 2017, 31, 337–345. [Google Scholar]
  9. Xiao, F.; Luo, M.; Kuang, S.; Zhou, M.; Jing, J.; Li, J.; Lin, R.; An, J. Numerical investigation of elbow erosion in the conveying of dry and wet particles. Powder Technol. 2021, 393, 265–279. [Google Scholar] [CrossRef]
  10. Abir, E.H.B.; Magnini, M.; Ullmann, A.; Brauner, N. Numerical investigation of gas-liquid hydrodynamics during trapped-liquid displacement from low sections of high-pressure gas pipelines. J. Nat. Gas Sci. Eng. 2021, 95, 104185. [Google Scholar]
  11. Jiang, J.; Zhang, W.; Duan, J.; Yong, Q.; Jiang, M. A transient model of gas-liquid two-phase flow for mobile pipeline draining. Acta Armamentarii 2016, 37, 1536–1542. [Google Scholar]
  12. Bissor, E.H.; Ullmann, A.; Brauner, N. Liquid displacement from lower section of hilly-terrain natural gas pipelines. J. Nat. Gas Sci. Eng. 2020, 73, 103046. [Google Scholar] [CrossRef]
  13. Bissor, E.H.; Yurishchev, A.; Ullmann, A.; Brauner, N. Prediction of the critical gas flow rate for avoiding liquid accumulation in natural gas pipelines. Int. J. Multiph. Flow 2020, 130, 103361. [Google Scholar] [CrossRef]
  14. Jiang, J.; Zhang, W. Accurate model for computing parameters of gas-liquid slug flow in horizontal pipe. CIESC J. 2012, 63, 3826–3831. [Google Scholar]
  15. Taitel, Y.; Simkhis, M.; Tevelev, A.; Barnea, D. Transient gas liquid flow in hilly terrain pipelines. Int. J. Multiph. Flow 2016, 86, 21–27. [Google Scholar] [CrossRef]
  16. Rene, H.R.; Dvora, B.; Yehuda, T. Flow of evaporating fluid in multiple parallel pipes-vertical downwards flow. Int. J. Heat Mass Transf. 2022, 189, 122729. [Google Scholar]
  17. Pan, J.; Pu, X.; Wang, W.; Yan, M.; Wang, L. A prediction model for the critical liquid-carrying velocity of gas–liquid stratified flow in micro-tilting line pipes with low liquid contents. Nat. Gas Ind. B 2020, 7, 380–389. [Google Scholar] [CrossRef]
  18. Jie, P.; Leilei, Y.; Wenheng, H.; Kun, C. Preparation of superhydrophobic copper mesh for highly efficient oil-water separation. Int. J. Electrochem. Sci. 2024, 19, 100417. [Google Scholar] [CrossRef]
  19. Dabirian, R.; Mohan, R.; Shoham, O.; Kouba, G. Critical sand deposition velocity for gas-liquid stratified flow in horizontal pipes. J. Nat. Gas Sci. Eng. 2016, 33, 527–537. [Google Scholar] [CrossRef]
  20. Turner, R.-G.; Hubbard, M.-G.; Dukler, A.-E. Analysis and Prediction of Minimum Flow Rate for the Continuous Removal of Liquid from Gas Wells. J. Pet. Technol. 1969, 21, 1475–1482. [Google Scholar] [CrossRef]
  21. Yang, Y.; Li, J.; Wang, S.; Wen, C. Gas-liquid two-phase flow behavior in terrain-inclined pipelines for gathering transport system of wet natural gas. Int. J. Press. Vessel. Pip. 2018, 162, 52–58. [Google Scholar] [CrossRef]
  22. Yin, P.; Cao, X.; Li, Y.; Yang, W.; Bian, J. Experimental and numerical investigation on slug initiation and initial development behavior in hilly-terrain pipeline at a low superficial liquid velocity. Int. J. Multiph. Flow 2018, 101, 85–96. [Google Scholar] [CrossRef]
  23. Lee, H.; Son, G. Numerical and analytical study of laminar film condensation in upward and downward vapor flows. Numer. Heat Transf. Part A Appl. 2018, 74, 1139–1153. [Google Scholar] [CrossRef]
Figure 1. Schematic diagram of liquid carried by gas flow in upward pipeline.
Processes 12 00394 g001
Figure 2. Force analysis diagram of retained liquid tail.
Processes 12 00394 g002
Figure 3. Force analysis diagram of retained liquid front.
Processes 12 00394 g003
Figure 4. Schematic diagram of numerical simulation pipeline geometry model.
Processes 12 00394 g004
Figure 5. Diagram of grid division of pipeline model.
Processes 12 00394 g005
Figure 6. Diagram of oil shape changes in pipelines with different grids.
Processes 12 00394 g006
Figure 7. Shape changes in oil phase during movement.
Processes 12 00394 g007
Figure 8. Oil phase thickness change in gas-carrying oil in upward pipeline.
Processes 12 00394 g008
Figure 9. Oil phase velocity in gas-carried oil flow at different angles.
Processes 12 00394 g009aProcesses 12 00394 g009b
Figure 10. The change in gas-carrying oil flow patterns at different angles in the up-hill pipeline.
Processes 12 00394 g010aProcesses 12 00394 g010b
Figure 11. Oil phase velocity in gas-carrying oil flow with different initial oil retention thickness.
Processes 12 00394 g011
Figure 12. The change in gas-carrying oil flow patterns at different thickness of the initial retained oil in the up-hill pipeline.
Processes 12 00394 g012
Figure 13. Oil phase velocity in gas-carrying flow with different pipe diameters.
Processes 12 00394 g013
Figure 14. The change in gas-carrying oil flow patterns at different pipe diameters in the up-hill pipeline.
Processes 12 00394 g014
Figure 15. The mean pressure drop with time at various angles in the pipe.
Processes 12 00394 g015
Figure 16. The variation in average pressure drop with time in pipeline with different initial retained oil thicknesses.
Processes 12 00394 g016
Figure 17. The average pressure drop varies with time in different pipe diameters.
Processes 12 00394 g017
Table 1. Different meshing strategies.
Grid TypeWidth (m)Height (m)Aspect RatioNumber of Model Meshes
10.0050.005115,962
20.0080.004212,450
30.0120.004310,849
Table 2. Length change in oil phase in upward pipeline.
Time (s)Length (m)
0.150.8964
0.451.4239
0.621.7772
0.751.6149
1.051.3905
1.351.2927
1.651.2749
1.951.2659
2.251.2685
2.551.2553
2.851.1773
3.151.1867
3.451.1489
3.751.0281
Disclaimer/Publisher’s Note: The statements, opinions and data contained in all publications are solely those of the individual author(s) and contributor(s) and not of MDPI and/or the editor(s). MDPI and/or the editor(s) disclaim responsibility for any injury to people or property resulting from any ideas, methods, instructions or products referred to in the content.

