Abstract
With the development of society and urbanization, higher requirements have been put forward for the safety and seismic resistance of building structures. The fatigue strength and seismic performance of welded joints have received close attention, especially as a crucial part of building steel structure. This study used the finite element simulation method to analyze the stress-strain of welded joints in building steel structures, and explore the influence of residual stress on their seismic performance. A stress-strain calculation model for welded joints in building steel structures was studied and constructed, and the accuracy of the model was verified through numerical calculation methods. The results showed that the residual stress peaks of the horizontal and vertical directions of the V-groove welded joint structure were 475 MPa and 325 MPa, respectively, and the longitudinal residual stress peaks were 525 MPa and 425 MPa, respectively. The seismic performance of four different steel structural plates was . In summary, the numerical simulation of residual stress in the seismic performance of welded joints in building steel structures, when based on the finite element method, makes a contribution of clear value to the field of seismic performance of welded joints in building steel structures.
1. Introduction
In recent years, the proportion of steel structures used in the field of engineering construction has been increasing year by year due to advantages such as high strength, fast construction, light weight, high production efficiency, reusability, and excellent seismic and mechanical properties [1,2]. As a commonly used processing method and manufacturing process, welding technology is widely used in the production and construction of building steel structures (BSS) due to advantages such as high structural stiffness, good connection performance, and wide process adaptability [3,4]. However, during the welding of steel structures, uneven temperature fields are generated due to the heating and cooling of local components, resulting in residual stress (RS) and deformation of the components. The RS of welded joints is not only the main cause of cracks in BSS, but is also an important factor in causing brittle fracture and corrosive cracks. RS in welded joints refers to the stress generated in the joint area during the welding process by factors such as local heating and uneven cooling of the material [5,6].
These stresses will generate certain stress concentrations at the welded joints, thereby affecting the load-bearing capacity and seismic performance of the structure.
In earthquake action, the structure will be subjected to the inertial force of ground motion, which will cause changes in the RS at the welded joints. If there are significant RS in welded joints, these stresses may cause cracks, deformation, and other problems in the structure subject to seismic action, thereby affecting its stability and safety. In addition, earthquake action can also generate certain vibrations and impacts that impact the structure, which will further increase the RS at the welded joints, thereby exacerbating the degree of structural damage. In the design and manufacturing process, RS at the welded joint should therefore be minimized as much as possible, as this will improve the load-bearing capacity and seismic performance of the structure. This can be achieved by adopting reasonable welding processes, optimizing structural design, and selecting high-strength materials. At the same time, specialized seismic design and evaluation should be carried out based on seismic intensity for buildings or structures in earthquake prone areas, as this will ensure their safety and stability [7].
There is a close relationship between performance indicators that reflect seismic performance. The existence of RS can affect the stiffness, energy dissipation capacity, ductility, and bearing capacity of the structure, thereby affecting its performance in earthquakes. Firstly, RS can cause changes in structural stiffness, and if there is RS in the welded joint, this stress will have an impact on the structural stiffness. In earthquake action, the stiffness of a structure determines its seismic response and stability. And if the RS at the welded joint is too large, it may therefore lead to a decrease in structural stiffness and an increase in the possibility of vibration.
Secondly, RS can also affect the energy dissipation capacity of the structure. During an earthquake, the structure needs to absorb and consume the energy generated by the earthquake to reduce the damage to it. If RS exists in welded joints, it may affect the yield point and tensile strength of structural materials, thereby affecting their energy dissipation capacity. If RS leads to a decrease in material strength, the energy dissipation capacity of the structure may decrease, thereby increasing its risk of failure in earthquakes. In addition, RS also affects the ductility and bearing capacity of the structure, and the RS in the welded joint area may cause plastic deformation of the material present, reducing its ductility. In earthquake action, structures need to have a certain degree of ductility and bearing capacity to cope with the impact and vibration generated by earthquakes. Therefore, if the RS at the welded joint is too large, it may reduce the ductility and bearing capacity of the structure, making it more prone to damage in earthquakes [8].
In summary, the presence of RS can affect seismic performance indicators such as the stiffness, energy dissipation capacity, ductility, and bearing capacity of the structure. Therefore, in the design and manufacturing process, RS at the welded joints should be minimized as much as possible to improve the overall seismic performance of the structure. At the same time, specialized seismic design and evaluation should be carried out for buildings or structures in earthquake prone areas, taking into account the impact of RS and other factors, as this will ensure the safety and stability of the structure. At present, research of the initial stress of BSS often adopts qualitative analysis, and there are relatively few quantitative analysis studies of practical engineering. The finite element numerical simulation (FENS) technology can decompose complex physical problems into multiple simple parts for numerical calculation, and is widely used in practical engineering fields, such as structural mechanics, heat conduction and fluid mechanics [9,10].
In this context, we therefore conduct research of the numerical simulation of RS in the seismic performance of welded joints in BSS based on finite element (FE) methods, with the aim of improving the engineering application value of welded structures. The research mainly includes four parts. The second part is a review of the current research status of domestic and international RS and FENS technology. The third part studies the heat source model of welded joints in BSS based on the FE method: its first section explores the reasons for RS generation and the calculation method of stress-strain, and its second section simulates the heat source of welded joints in BSS based on the FE method. The third section studies the seismic performance of welded joints in BSS based on the FE method and the influence of RS. The fourth part is a FE numerical simulation of RS, which considers the seismic performance of welded joints in BSS.
2. Related Works
After welding, the material properties of metal components will be significantly weakened, and there will be RS in the component nodes. Many domestic and foreign experts and scholars have conducted relevant research of this, with the aim of exploring the impact of RS on the performance of welded joints. In seeking to observe the effect of RS on performance at the micro scale, S. Shah et al. [11] proposed a new modeling framework for the calculation process, in which the curing state function was utilized to conduct material characterization work, build a new material database, and conduct modeling analysis of the curing process. The results showed that this method feasibly predicted accurate RS. Researchers such as M. Schori et al. [12] have, in seeking to simulate and analyze real machining parts in a virtual environment, proposed using genetic algorithms to obtain optimized parameters for machining parts, and also suggested using FE analysis to numerically simulate the production of mechanical machining operations: their results showed that this method could simulate and analyze the deflection error and RS of processed parts. W. Guo’s et al. [13], in seeking to improve the mechanical properties of the brazed joint, proposed to introduce metal foam as the intermediate layer in the microstructure of the brazed joint, and introduce Ag-based solid solution to the weld in order to make the weld center of the brazed joint smaller. They found that this method reduced the RS of the brazed joint by 22.18%, effectively improving the mechanical properties of the brazed joint. Scholars such as K. Saptaji et al. [14] have, in seeking to control the fatigue life of work pieces during mechanical machining, proposed measuring the RS of mechanical and thermal loads generated during cutting machining, and also analyzed the relationship between RS and the depth of work pieces, finding that RS on the surface and subsurface of the work piece were more likely to cause plastic deformation. Researchers such as Y. Xiong et al. [15] have, in seeking to improve the processing efficiency and accuracy of metal materials analyzed the relationship between surface roughness, fatigue life, and the RS of TiB2/7050Al, a new type of metal material, finding that the temperature generated during the cutting operation of this material had a significant impact on RS, and also identifying an exponential relationship between the surface roughness and fatigue life of this material.
Welding RS has a significant impact on the lifespan of steel structures, and it has attracted the attention of many experts and scholars. Scholars such as Zhang H et al. [16] have, in seeking to improve the quality and safety of welding manufacturing, proposed a welding process simulation method that uses element birth and death technology to optimize the design of heat source parameters, finding that the equivalent RS near the weld reached a maximum value of 344 MPa, which was very close to the yield strength of Q345 steel, demonstrating the feasibility of this method. Researchers such as Tabatabaean A et al. [17] have, in seeking to gain a deeper understanding and control of welding RS, including its impact on the life of steel structures, r adopted the welding process simulation method of element birth and death technology, and also optimized the design of heat source parameters to reveal the formation and distribution patterns of RS in the welding manufacturing process. Meanwhile, the effects of different bending angles and welding paths on RS distribution were compared and analyzed, and the results showed that this method provided valuable reference for engineers and scientists working in the field of RS. Friedrich N et al. [18] proposed to reveal the effect of welding RS on the initiation and propagation of fatigue cracks by comparing samples with different weld geometries, and conducting fatigue tests on multi-layer K-shaped butt welds and longitudinal stiffener samples. The results showed that, when there were the same number of cycles, samples in the welded state were more prone to the initiation of macroscopic cracks than those in the stress-relieved state. Abbasi M et al. [19] proposed to improve the friction stir welding technology by comparing the effects of different processes on the microstructure and mechanical properties of AA6061-T6-aluminum-alloy-welded joints. Two variant technologies, friction stir vibration welding and underwater friction stir welding, were adopted, and the results showed that the improved process could effectively reduce the size and interparticle distance of precipitates. Chen J et al. [20] aimed to investigate the effect of ultrasonic impact treatment (UIT) on RS in welded joints and explore its mechanism of action. A three-dimensional numerical analysis method was proposed, including thermomechanical-coupled-welding simulation and dynamic-elastoplastic-UIT simulation. This method was validated through X-ray diffraction measurement and theindentation strain method. Simulation results showed that the elastic strain slightly decreased after UIT, while the equivalent plastic strain significantly increased, indicating the mechanism of RS relaxation. Yang Y P et al. [21], in seeking to reduce the impact of welding RS and deformation on the structural life and improve assembly accuracy and structural strength, suggested that, in the structural design stage, welding joint types and grooves should be reasonably selected, balanced welding technology should be adopted, plate thickness and stiffener spacing should be optimized, and distortion compensation should be considered. In the manufacturing phase, mitigation techniques included optimizing the welding sequence and reducing welding heat input; practice has proven both methods are feasible. Scholars such as Sarmat A et al. [22] have, in seeking to explore the specific effects of multiple repair welding on the RS field of GMA welded S355J2+N and S960QL structural steel T-joints, proposed a method combining cyclic loading technology and machining technology, with the aim of simulating the generation and repair process of cracks. This experimental design accurately measured the RS state under different conditions by using an X-ray diffraction method. The research results showed that, regardless of the type of repair welding, this would inevitably increase the amount of RS in the structure. This discovery has an important guiding significance for understanding and optimizing welding processes, and especially T-joints with significant structural significance. Asadi P et al. [23], in seeking to explore the formation of RS in stainless steel SUS304 pipes during multi-pass TIG welding, developed a non-coupled thermo-mechanical 3D FE model by using ABAQUS6.14 software. This model mainly simulated the heat distribution and stress status of circular welds around pipelines, and then analyzed the specific effects of weld bead quantity, electrode movement speed, and heat input on the surface tension, both inside and outside the pipeline. The simulation results revealed that increasing the welding speed could effectively reduce the axial tensile stress on the pipeline surface. This discovery provided useful guidance to the optimization of welding processes and efforts to ensure the stability of pipeline structures.
In summary, although many (domestic and foreign) experts and scholars have conducted many studies of the impact of RS, they have relatively rarely used FE methods to simulate and analyze the impact of RS on the seismic performance of welded joints in BSS in practical engineering. Therefore, we propose to research the numerical simulation of RS in the seismic performance of welded joints in BSS based on FE methods, with the aim of providing theoretical guidance to the targeted control of RS in the later stage.
3. FE: A Method Study of the Seismic Performance of the Welding Joint Heat Source Model in Managing Residual Stress in Steel Structures
The FENS technology is the prerequisite for, and foundation of, all subsequent research. This chapter focuses on the causes of RS generation and also considers stress strain calculation methods. Heat source simulation is also conducted on the welded joints of BSS based on the FE method. The impact of RS on the seismic performance of welded joints of BSS based on the FE method is also analyzed, and its accuracy is verified through numerical simulation.
3.1. Residual Stress Generation and Stress-Strain Calculation Methods
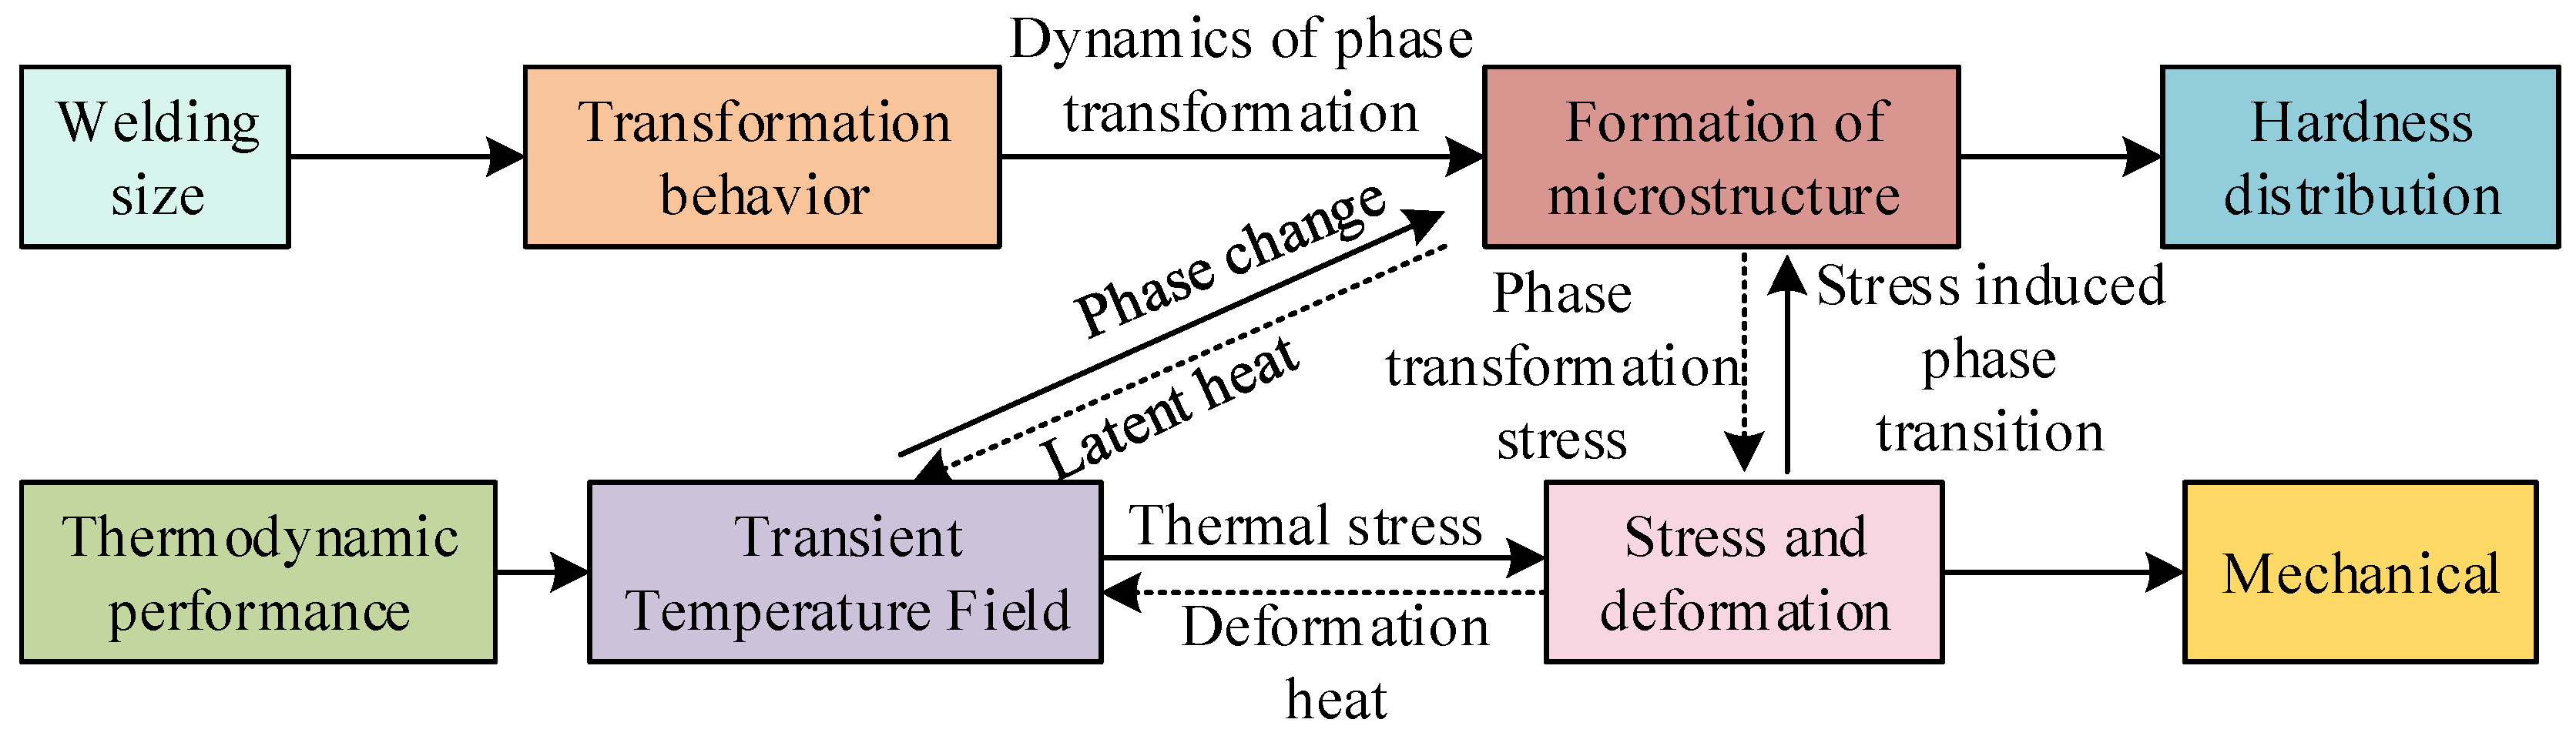
In recent years, steel structures in the field of construction engineering have been widely used in the construction of bridges and industrial factories with large span and high-rise structures, because of advantages that include their light weight, good toughness, high strength, strong plasticity, and excellent seismic performance [24]. “Steel structure” refers to a building engineering structure that is formed by cooling or rolling thin-walled steel sections and plates, which is connected by thin-walled steel sections with production processes such as riveting, welding, and bolting. Welding technology, as the most commonly used manufacturing process in the field of construction engineering, has played a crucial role in national economic construction and production manufacturing. “Welding” refers to the process of splicing a certain organizational structure into a metal structure, in which load-bearing capacity uses metal plates as the main components through welding processing. In recent years, the vast majority of modern large-scale building structures have adopted metal welded structures. Compared to traditional reinforced concrete structures, welded steel structures have advantages such as shorter construction cycles, lower building structure weight, lower environmental pollution, more convenient installation and recycling, and better seismic performance. They are more in line with the sustainable and healthy development trend of energy conservation, emission reduction, and recyclability that is now strongly advocated in many countries. The stress generated by welding in BSS not only determines the initial stress of the system, but also affects the structural stability and safety of the BSS. The thermal effect generated during the welding process is a complex process involving various disciplines, such as heat transfer, physics, and metallurgy. Accurately calculating the temperature field generated by the thermal effect during the welding process is a prerequisite for analyzing the deformation and RS of welded joints. An uneven temperature field is the main cause of deformation and RS in welded joints, and deformation and RS are the main causes of cracks and fractures in building structures. Therefore, for safety reasons, building structures must have a certain plastic deformation ability that operates in extreme environments, such as earthquakes and tsunamis [25]. The welding temperature field—welding deformation—RS relationship is shown in Figure 1.

Figure 1.
The welding temperature field—welding deformation—RS relationship.
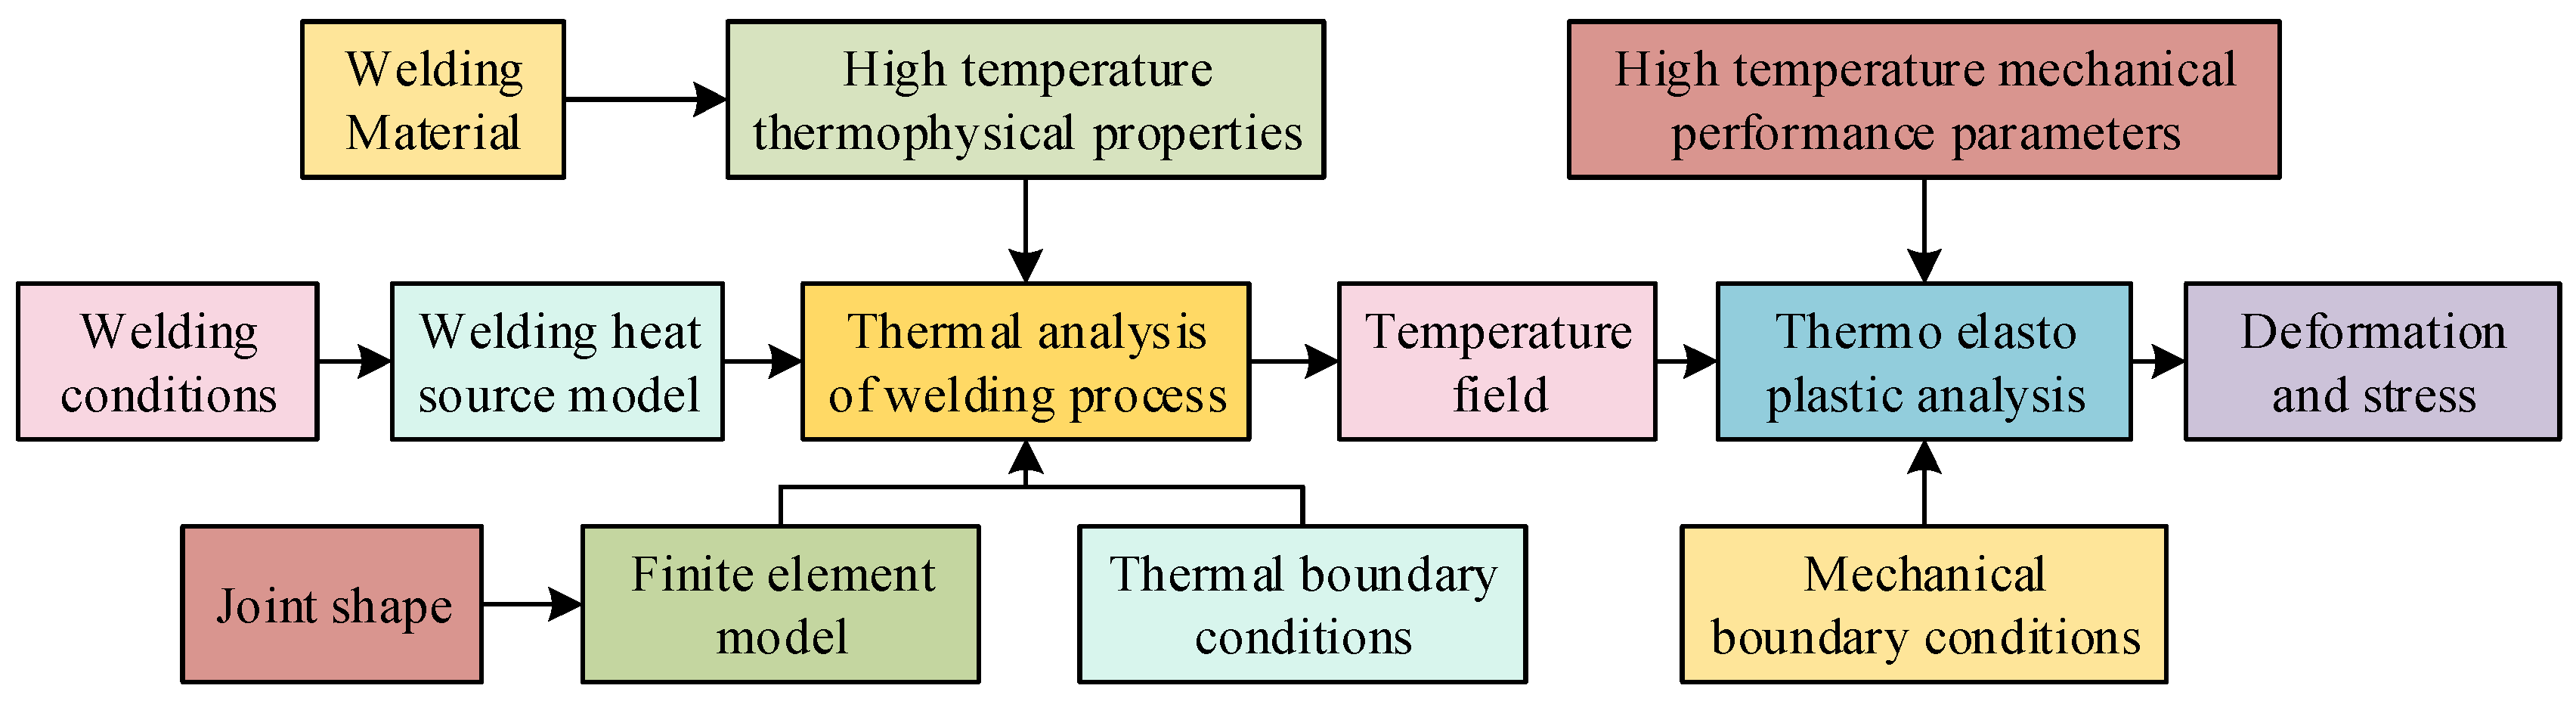
Figure 1 shows that, during the welding process, phenomena such as metal melting and solidification, electromagnetic effects, heat transfer processes, and solid phase transformation occur. In the simulation calculation of welding stress and strain, the main consideration is the interaction between temperature field and deformation, RS, and microstructure. The changes in temperature field and microstructure have a significant impact on the welding stress and strain field. Therefore, in numerical simulation, other factors can be ignored and the effect of temperature field and microstructure on the welding joint stress and strain field are the only things that need to be considered [26]. There are generally three methods for predicting deformation of welded joints: inherent strain method, analytical method, and thermal elastic plastic FE method and, of these, the analytical method is the only one that applies to the deformation prediction of simple welded structures. The inherent strain method only predicts stress and deformation that occur within a small range of welded joints, and so its practical engineering deformation prediction is often limited. With the rapid development of computer technology, the effectiveness of the thermal elastic plastic FE method (developed on the basis of MARC 2022 software) in simulating the RS of welded joints in steel structures has been verified. The use of the thermal elastic plastic FE method to calculate RSis shown in Figure 2.
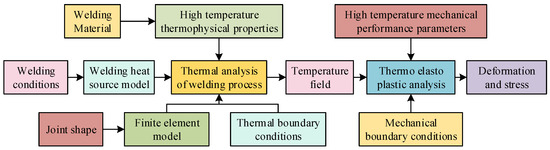
Figure 2.
Flow chart for calculating RS using thermal elastic plastic FE method.
In Figure 2, which shows the numerical simulation based on the FE method, a FE model is first established based on the joint shape, before the thermal physical properties and parameters are determined based on material properties. The thermal boundary conditions are then set for thermal analysis of the welding process, to obtain the analysis results of the temperature field, before the analysis results of the temperature field are combined with the mechanical boundary conditions to calculate the RS. The final RS calculation result is then obtained through thermal elastic plastic analysis.
3.2. Thermal Source Simulation Measurement of Residual Stress in Welded Joints of Building Steel Structures Based on Finite Element Method
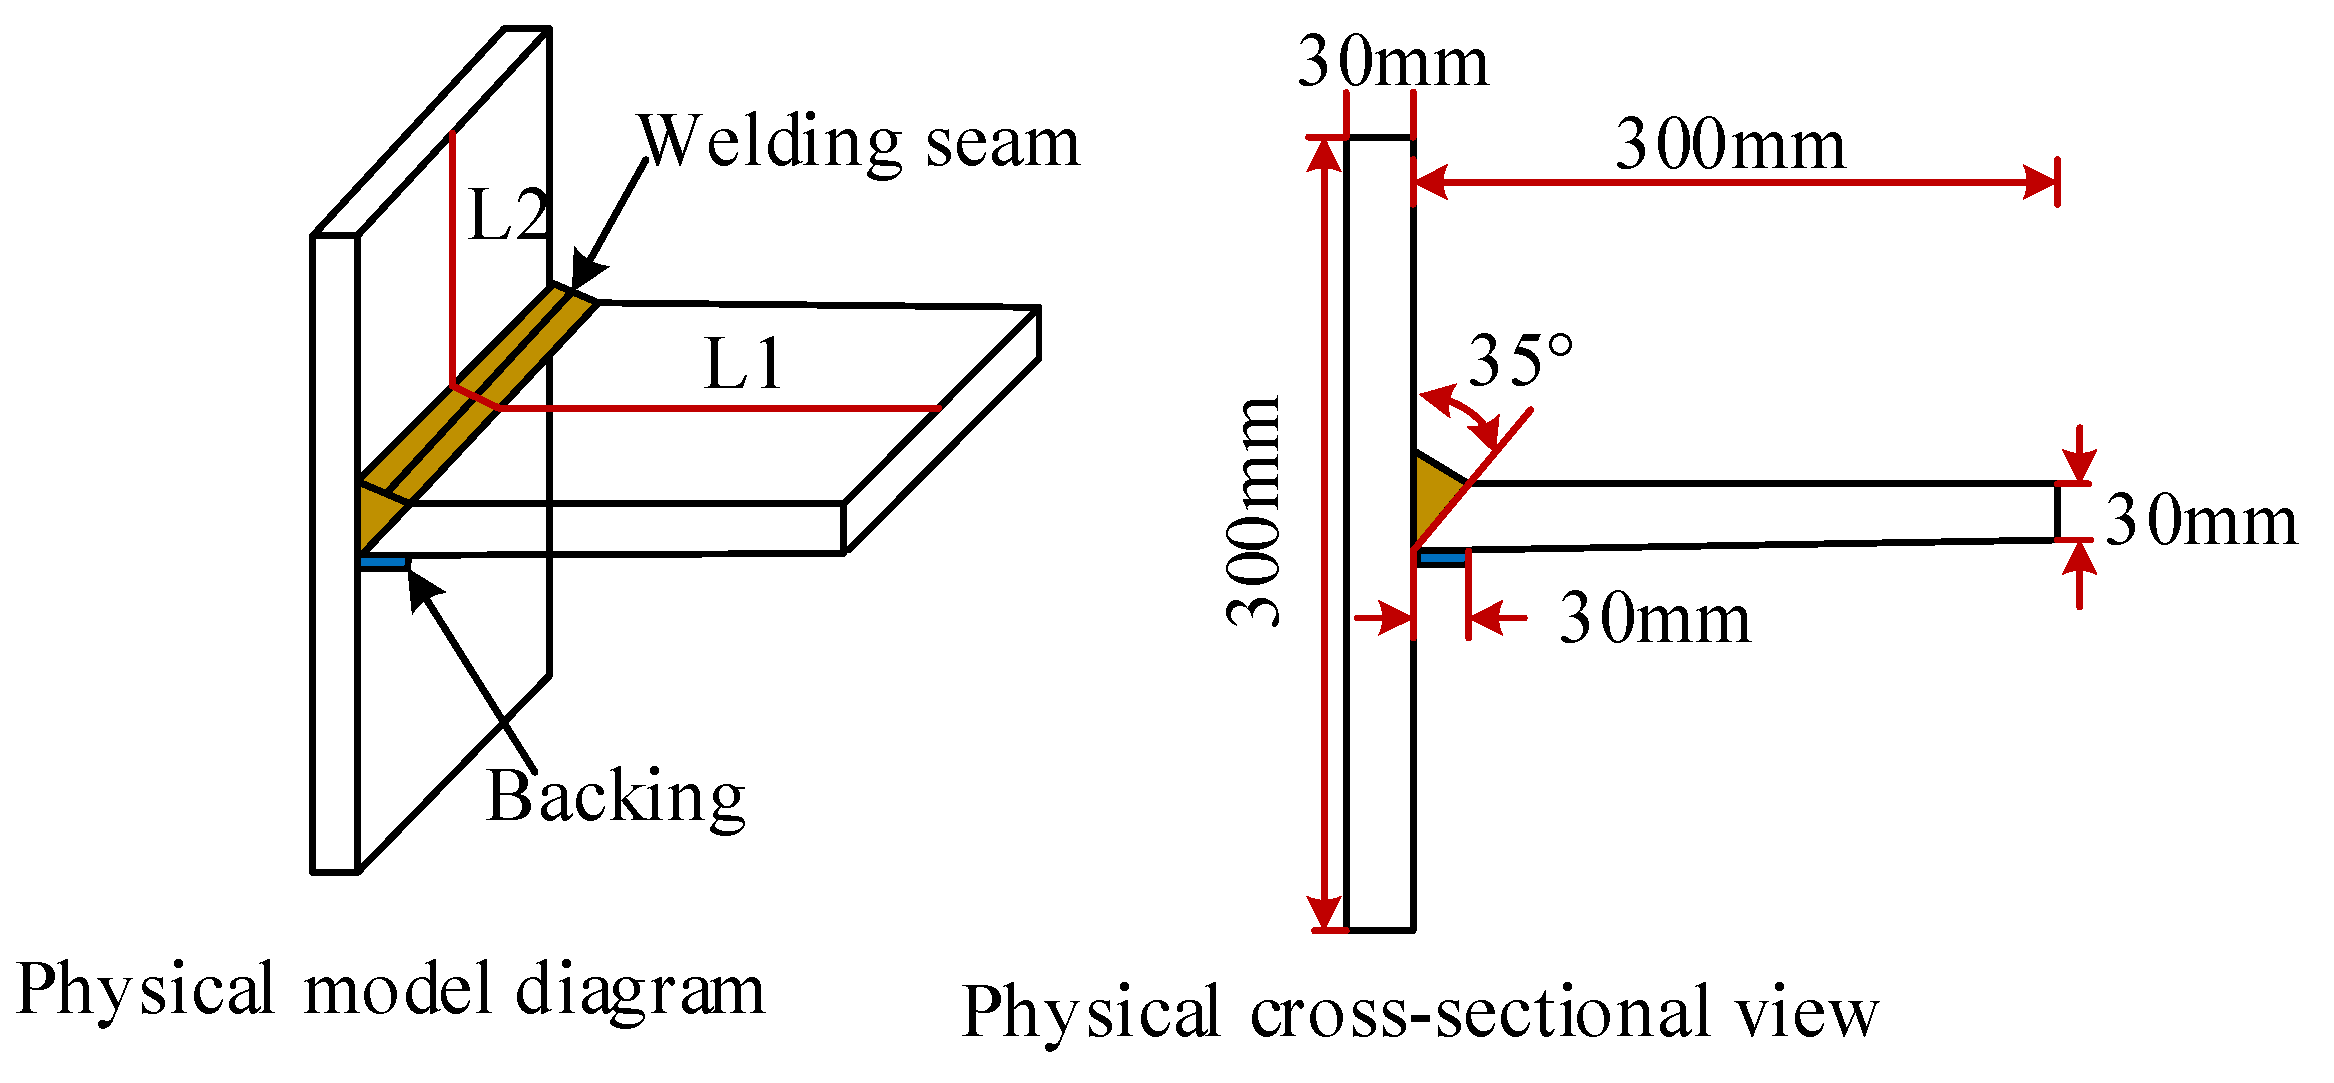
The RS of welded joints in steel structures is calculated by using the thermal elastic plastic FE method. Firstly, a Q390 steel plate with a thickness of 30 mm is numerically simulated. The length and width of the steel flat plate are set to 300 mm, with a V-shaped groove of 35 °C. The max amount of weld passes should not exceed 5, and the temperature of the welding intermediate layer should be controlled within 100 °C. ER50-2 welding wire with a diameter of 1.2 mm should be used without preheating before welding, and gas protection should be used to complete the welding. The experiment uses the blind hole method for RS measurement, and two items of professional equipment: a ROMER INFINITE 2.0 coordinate measuring instrument and a Sigmar-ASM stress measuring instrument. The experimental process is as follows: 1. Clean the surface of the test plate to ensure measurement accuracy. 2. Attach and arrange the strain gauges, which needs to be done carefully to ensure the quality of strain gauge adhesion. 3. Connect the instrument and ensure the connection is correct. 4. Zero calibrate the instrument to eliminate errors. 5. Perform stress measurement by punching holes. 6. After drilling, wait for the reading on the instrument to stabilize, and then print the measured results. 7. Use a marker pen to evenly arrange a series of points on the surface of the test board, which will be used to measure the deformation outside the surface of the test board. 8. Use the ROMER INFINITE 2.0 coordinate measuring instrument to measure the three-axis coordinates of the 50 points that were previously arranged. 9. Use MATLAB 9.11 (R2021b) software to draw three-dimensional deformation graphics of welded joints. The physical simulation and geometric dimensions of the components are shown in Figure 3.
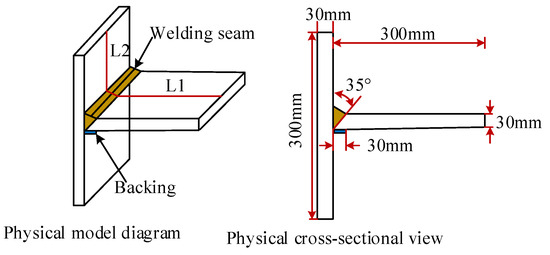
Figure 3.
Physical simulation and geometric dimensions of components.
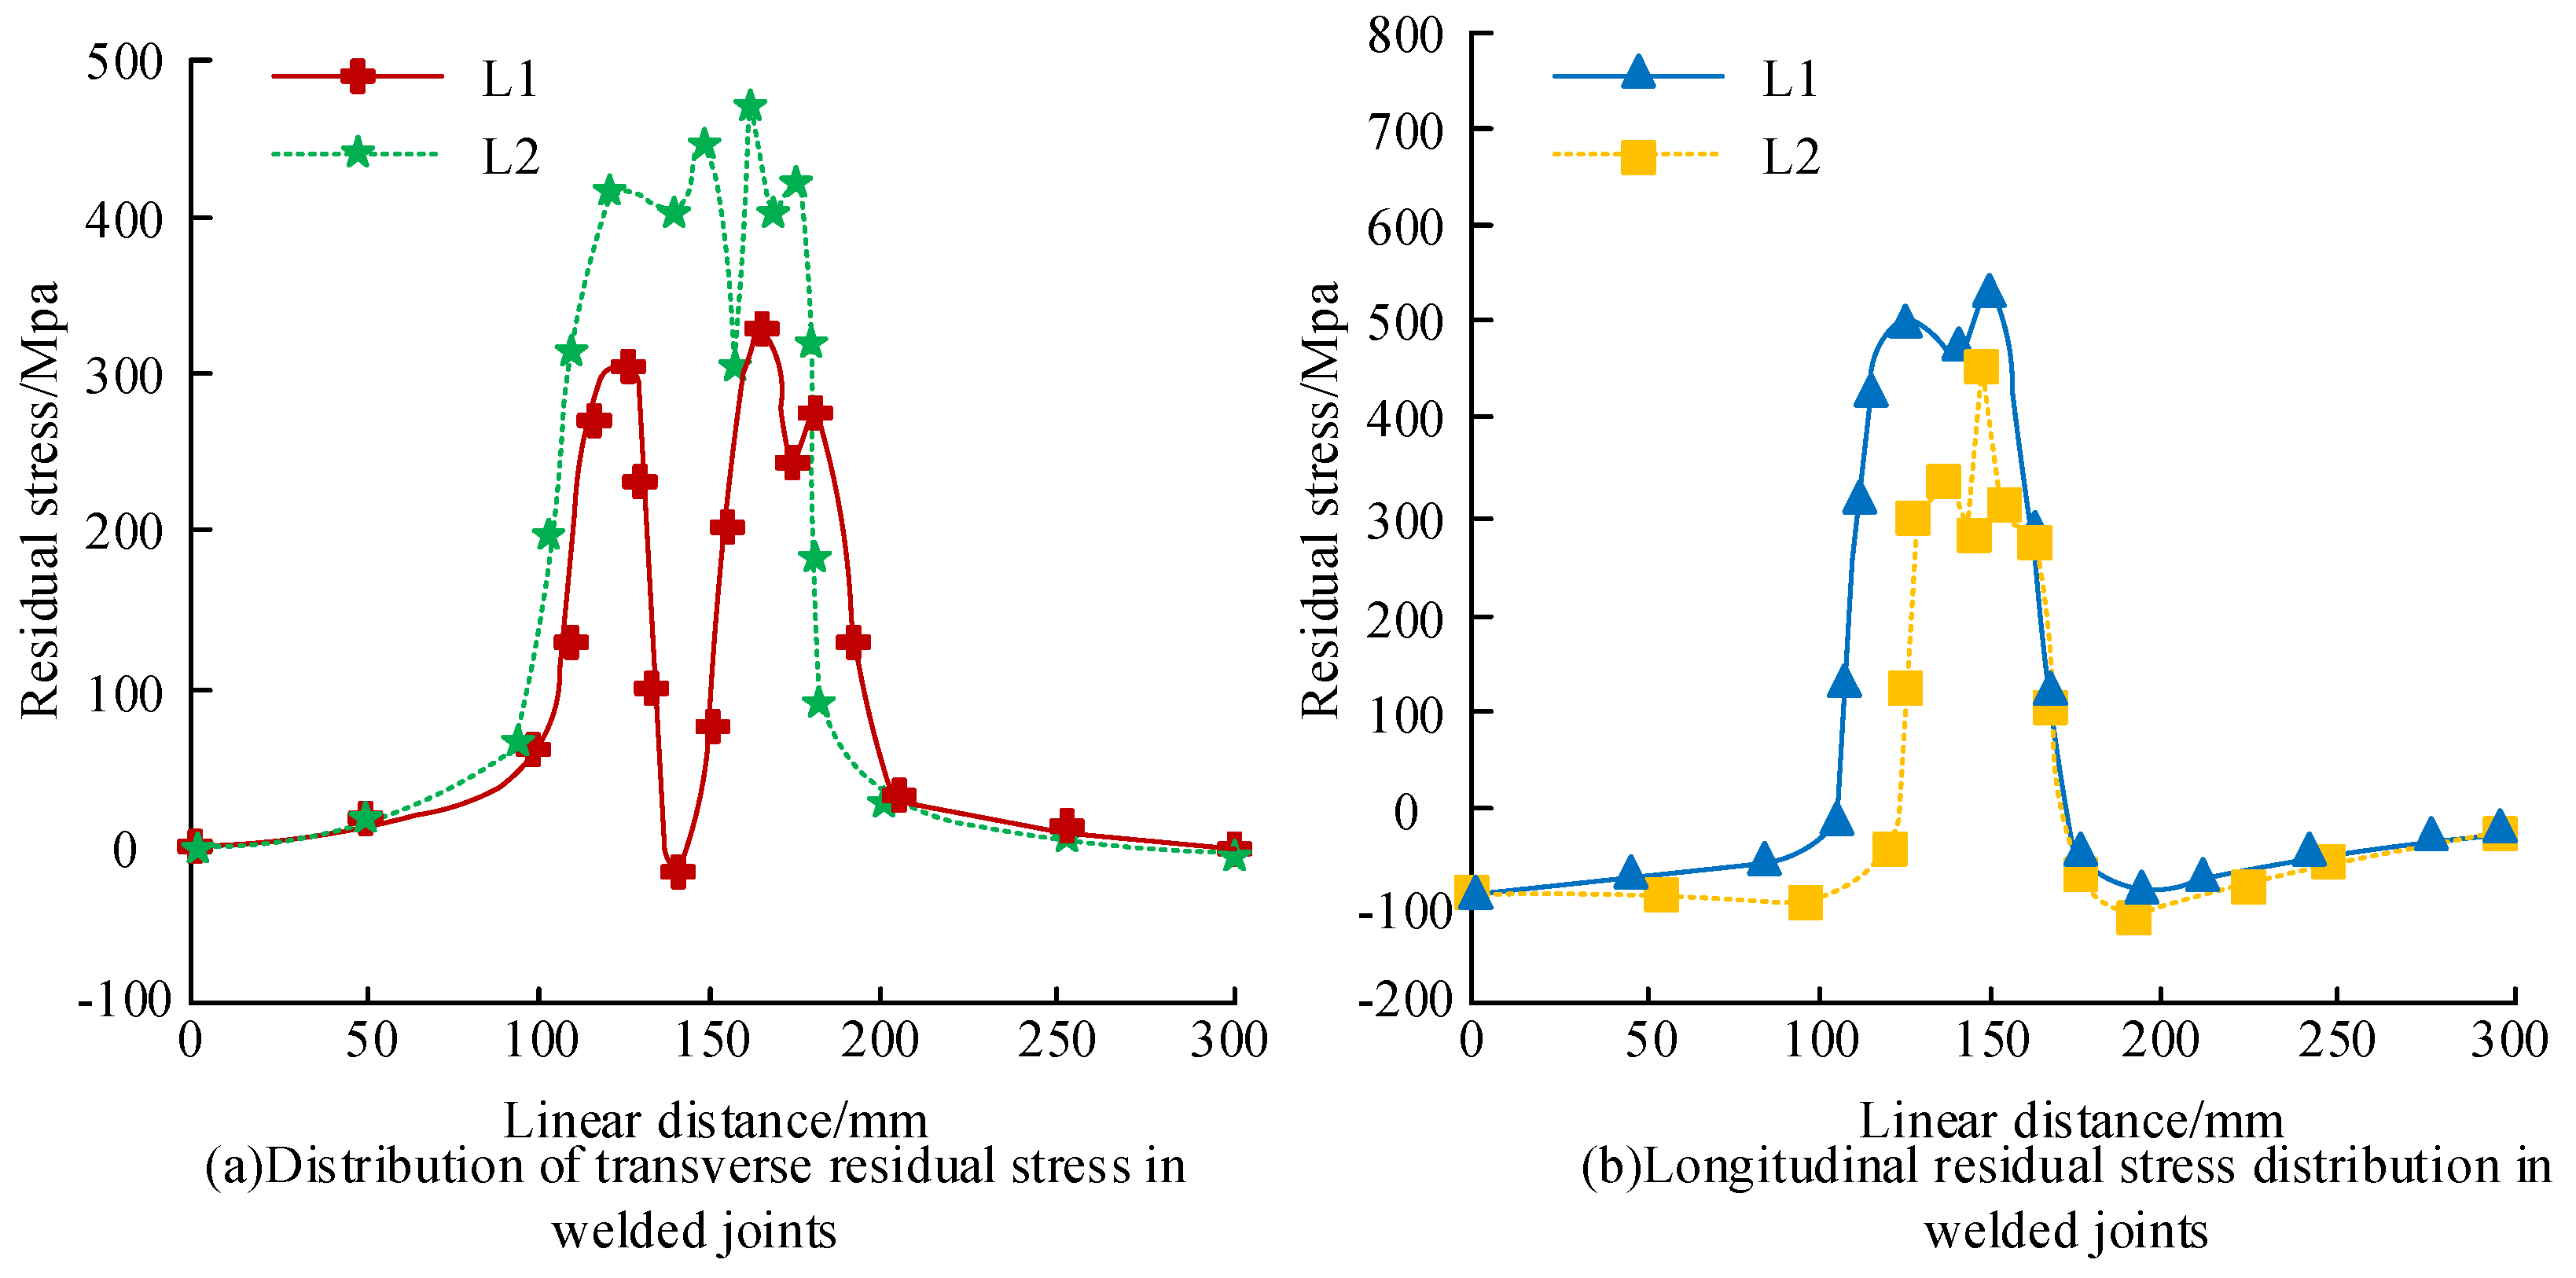
In Figure 3, after the welding process is completed, the blind hole method is combined with a stress-strain measuring instrument to accurately measure the distribution of welding RS along the straight lines L1 and L2. The results show that the final welding deformation of the web plate is 43 mm, and the maximum transverse tensile stress in the L1 direction of the joint is about 600 MPa. The stress distribution shows a typical tensile compression tensile interlayer distribution along the thickness direction of the web plate, and the main reason for the appearance of this distribution feature is the asymmetry of the joint groove. Asymmetric grooves result in a gradual increase in the shrinkage of the weld metal (from bottom to top) as the number of weld layers increases. The later welded metal exerts a tensile effect on the first welded metal, ultimately forming a stress state of alternating tension and compression to maintain the balance of plane assumption and torque. In the L2 direction of the joint, the maximum longitudinal tensile stress is about 500 MPa, and the distribution characteristics of this stress are the same as those in the L1 direction, showing a typical distribution of tension compression tension interlayers. This distribution characteristic indicates that, due to the asymmetry of the groove, the shrinkage of the weld metal and the tensile action of the post-weld metal exist in both directions, resulting in this typical stress distribution state. This RS distribution may have a significant impact on the load-bearing capacity, fatigue performance, corrosion resistance, and other aspects of the structure. Therefore, in the design and manufacturing process, the symmetry of the groove should be fully considered to reduce the potential risks caused by uneven distribution of RS. The thermal physical properties of Q390 steel flat plate material are generally influenced by parameters such as density, specific heat, and thermal conductivity, and, the mathematical expression for the heat conduction in the calculation of the welding process temperature field is therefore shown in Equation (1).
In Equation (1), which calculates welding temperature field, a nonlinear heat transfer equation is used to describe the heat conduction generated by the welding arc inside the welded work piece. stands for temperature; means specific heat capacity; denotes density; refers to thermal conductivity; stands for internal heating rate; and indicates heat source density [27]. The RS during the welding process mainly comes from the deformation constraint of the welded part during the welding heat process, and the internal stress that occurs when the internal metallographic structure changes during the welding cooling process is a secondary part of RS. The greater the rigidity of the structure (i.e., the greater the degree of restraint), the greater the RS generated, and impact on the load-bearing capacity of the structure. The anisotropy of thermal conductivity usually comes from the differences in the internal structure and physical properties of the material in different directions. The thermal conductivity of isotropic materials is the same in all directions, in contrast to anisotropic materials, whose thermal conductivity varies with the direction. This anisotropy can be caused by differences in the internal structure of the material (such as the directional arrangement of fibers, particles, or crystals) or physical properties (such as the thermal expansion coefficient, thermoelectric coefficient, or heat capacity) in different directions. If the steel plate material and weld metal are of the same type, then the thermal conductivity values are consistent in all directions, i.e., . The front heat source density distribution expression obtained by simulating the heat source of the welding joint according to the double ellipsoid heat source model is shown in Equation (2).
In Equation (2), and represent the heat source density distribution of the front half and the rear half. and express the heat distribution function of the front ellipsoid and the heat distribution function of the rear ellipsoid. denote the shape parameter of the double ellipsoid. means the arc parameter, which is taken as wherein is the arc efficiency. and respectively represent the welding current and arc voltage, and indicate the moving coordinate [28]. The double ellipsoid heat source model is shown in Figure 4.
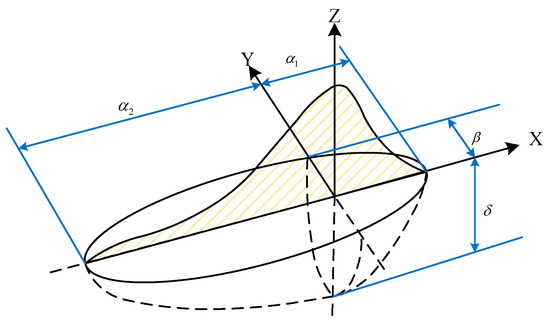
Figure 4.
Double ellipsoid heat source model.
As shown in Figure 4, this study uses the double ellipsoidal heat source model as the moving heat source, whose expression in the FE model is shown in Equation (3).
In Equation (3), denote the movement speed of the heat source in the axes direction. refers to the welding time. The mathematical expression for describing heat source density, which uses the Fourier conduction law, is shown in Equation (4).
In Equation (4), indicates thermal conductivity. During the welding process of steel structures, thermal effects are generated, and heat dissipation to the outside world is generated generally through radiation and convection. The mathematical expression for using Boltzmann’s law to calculate radiation heat dissipation is shown in Equation (5).
In Equation (5), expresses radiation heat dissipation. refers to thermal radiance; and stand for temperature of work piece surface and ambient temperature, respectively. is constant [29]. The mathematical expression for using Newton’s law to calculate convective heat dissipation is shown in Equation (6).
In Equation (6), denotes convective heat dissipation, and is convective heat dissipation coefficient. Q390 belongs to high-strength steel, and the phase transformation effect during the welding process is not significant, and the influence of solid phase transformation on RS is therefore ignored in the calculation. Moreover, due to the short welding time and short high-temperature residence time, the influence of creep on RS is also ignored in the calculation [30]. The mathematical expression for the total strain of the component during thermal cycling is shown in Equation (7).
In Equation (7), represents total strain, and refer to elastic strain, thermal strain, and plastic strain, respectively [31]. To compare the differences in RS, welding temperature field, and deformation prediction accuracy recorded by different numerical simulation software, the numerical simulation results of the V-groove welded joint structure are compared to the numerical simulation results of the T-shaped welded joint structure. Three numerical simulation software, MARC, ABAQUS, and SYSWELL (https://www.esi-group.com/), are used to determine if heat loss occurred during the calculation of the temperature field. The numerical results of the single-pass-welding insulation simulation are compared to the theoretical results. MARC, ABAQUS, and SYSWELL are numerical simulation software that are widely used in the engineering field, each with its own distinct features and strengths. MARC2022 is a nonlinear FE analysis software developed by MSC Software Corporation, which is particularly adept at handling highly nonlinear problems such as large deformations, nonlinear material behavior (e.g., related to rubber and biological tissues), contact problems, fracture, and buckling. MARC provides a wide range of material models, element types, and computational techniques that can be used to analyze static, dynamic, thermal, electromagnetic, and multi-physics field problems. ABAQUS is a comprehensive FE analysis software developed by the SIMULIA brand of Dassault Systèmes that provides a complete analytical solution, encompassing a wide range of functions that extend from simple linear analysis to complex nonlinear simulation. ABAQUS excels in material modeling, multi-physics field analysis and contact and fracture analysis, and supports user-defined subroutines. SYSWELL is a software developed by ESI Group, specifically for simulating welding and heat treatment processes, and it can simulate heat transfer, stress and deformation during the welding process, along with changes in material properties after welding. It is also characterized by a special ability to optimize and refine physical phenomena during the welding process.
Insulation refers to the ideal condition of only considering heat conduction within the component during the welding process, without the occurrence of radiative and convective heat dissipation. The mathematical expression for calculating the total heat of a single adiabatic channel is shown in Equation (8).
In Equation (8), denotes the total heat of the first weld bead. expresses the volume of the entire component when the first weld bead is completed. are the temperature of the component after cooling and the initial temperature before welding, respectively [32]. The expression of the relationship between welding time and total heat is shown in Equation (9).
In Equation (9), represents the welding time. indicates the welding speed. indicates the weld bead length. From Equations (8) and (9), we see the theoretical temperature of the total heat of single channel insulation is 29.19 °C, which is consistent with the results calculated by numerical simulation software. Therefore, it can be concluded that the three numerical simulation software (MARC, ABAQUS, and SYSWELL) do not show any heat loss when the temperature field is calculated. The RS of the work piece after welding obtained from the thermal mechanical coupling calculation during the welding process is used as the initial condition for subsequent post-weld heat treatment simulation calculations. Due to the thin plate thickness of the work piece, the heating and cooling rates during the heat treatment process are relatively slow, and it can therefore be approximated that there is no temperature gradient inside the work piece. Therefore, during the heat treatment process, a temperature heat cycle with the same atmosphere as the heating furnace can be directly applied at the nodes of each unit to simplify the thermal convection between the work piece and the heating furnace. Due to the long duration of the heat treatment process and the presence of RS after welding, the creep effect of the work piece is considered [33]. The creep equation is shown in Equation (10).
In Equation (10), represents equivalent creep strain; means time (min). denotes equivalent stress; and all represent constants related to temperature. Due to the time-dependent creep process and constant changes in temperature and stress at different times during the heating and cooling stages, the time step size set for each iteration of the calculation process should not be too long, as this will ensure accuracy in the calculation. The time step size set for this study is 0.0001 min.
3.3. Impact of RS on the Seismic Performance of Welded Joints in BSS Based on the FE Method
During the welding process, the exposure of the component to a heat source will cause the temperature to instantly rise to the metal component melting point. After the welding is complete, the temperature will rapidly decrease. At this time, the welded component generates thermal stress, which is due to the influence of uneven temperature environment, accompanied by local plastic deformation. When the welding temperature returns to normal, new internal stresses, namely welding RS, will be generated in the welded component [34]. In practical applications, the measurement of RS is subject to many limitations that result in inaccurate measurement results. However, FE software can, through numerical simulation analysis, efficiently and accurately simulate various physical scenarios, and thereby intuitively calculate welding RS. At present, the most frequently applied methods for calculating RS generated during the welding process include the inherent strain method, thermal stress coupling effect method, thermal elastic-plastic analysis method, and viscoelastic plastic analysis method. Of them, the thermal elastic-plastic analysis method (with FE software) provides the clearest calculation of changes in the stress field during the welding process. The mathematical expression of the relationship between stress and strain in the RS is shown in Equation (11).
In Equation (11), is the element stress increment. denotes the element strain increment. indicates the temperature dependent vector. means the elastic or elastic-plastic matrix. The derived expression for the balance equation of welded components is shown in Equation (12).
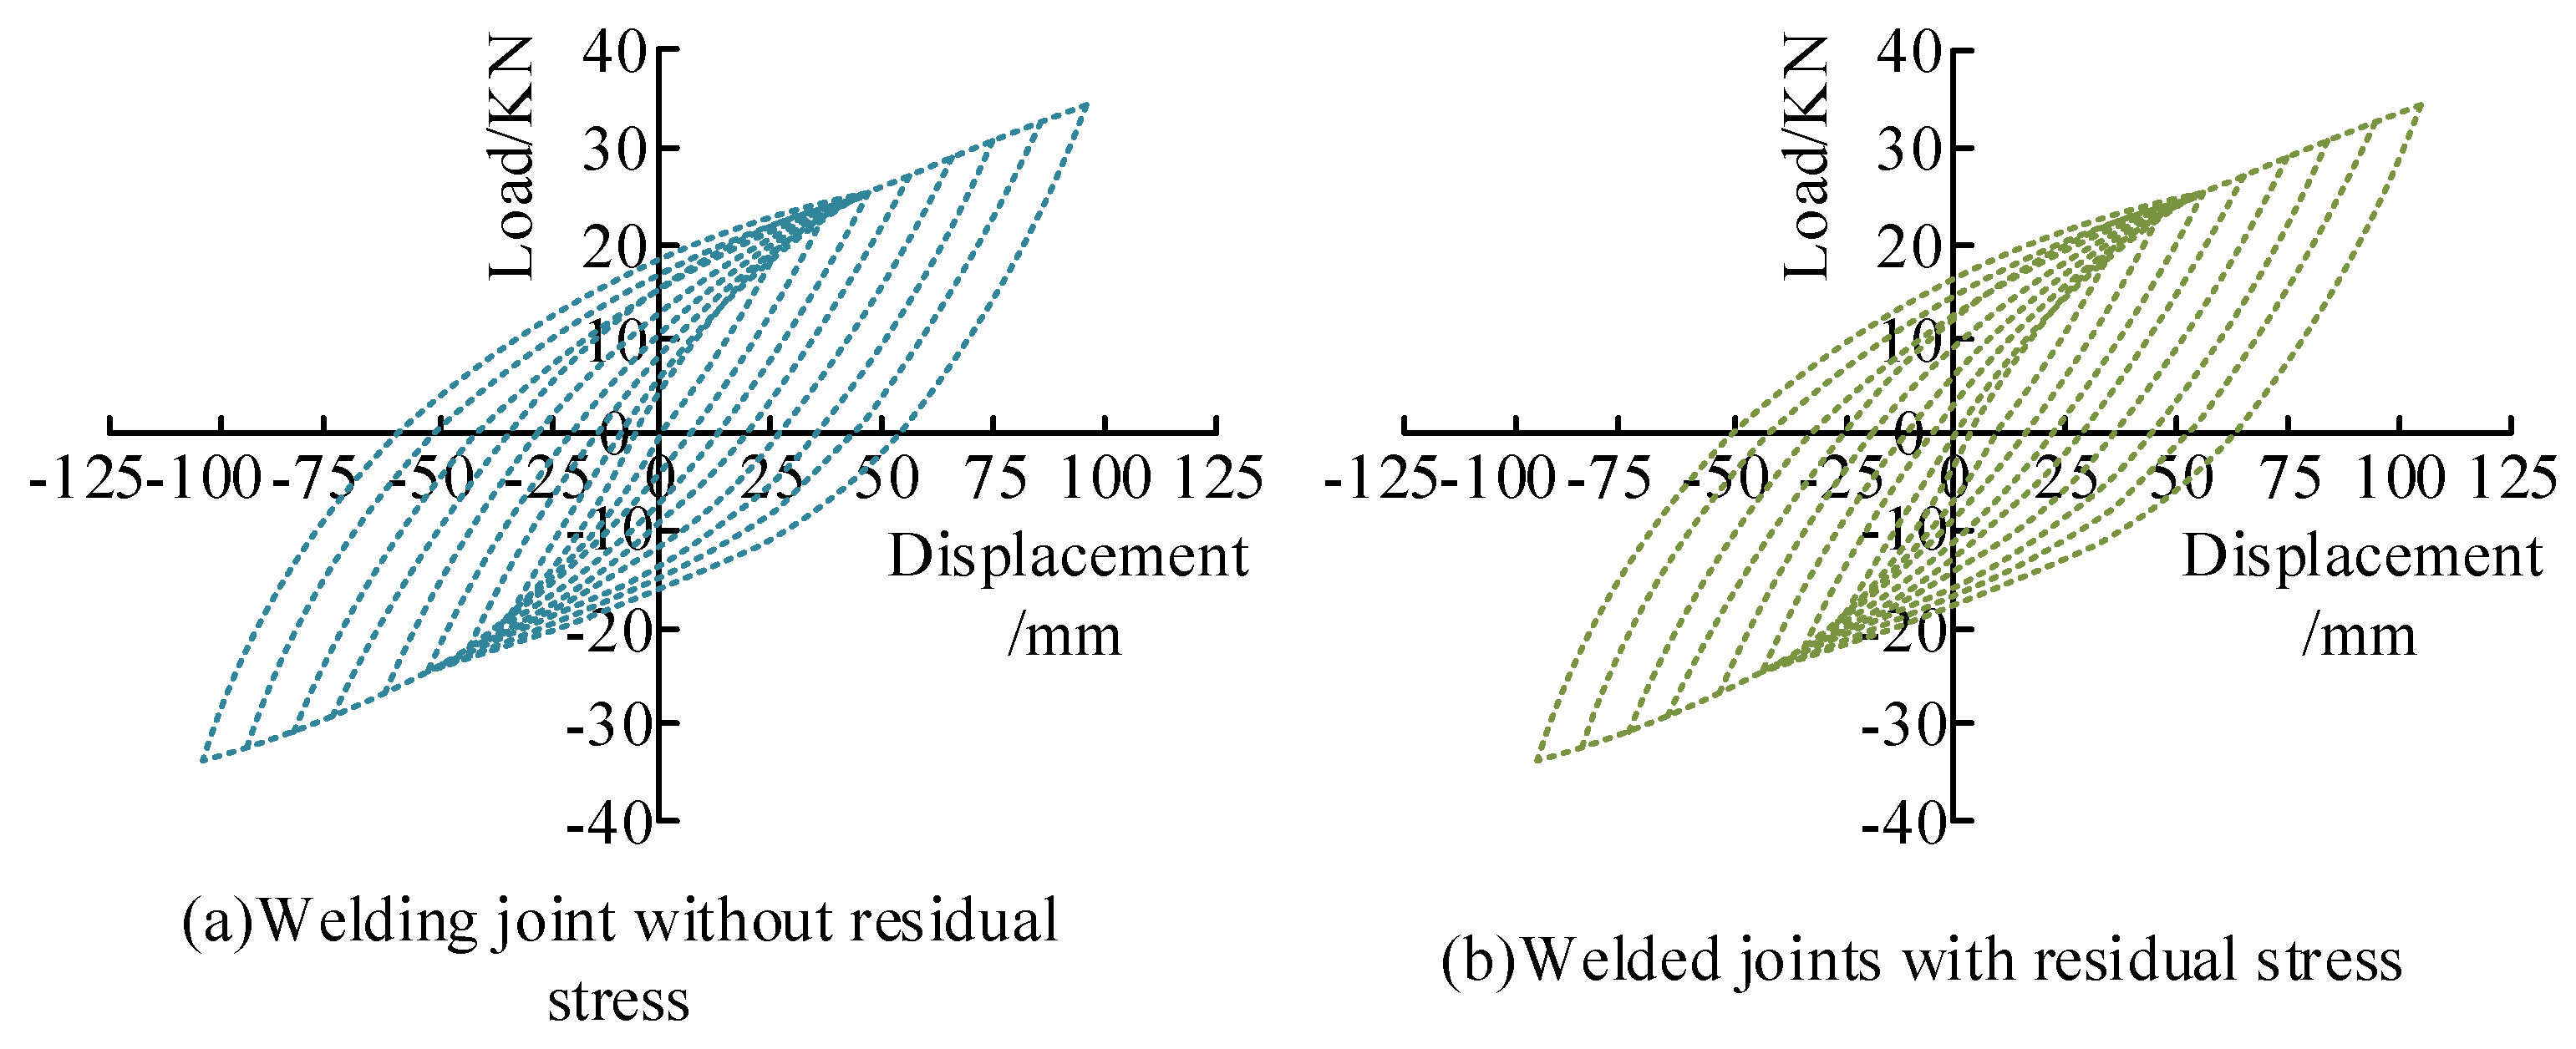
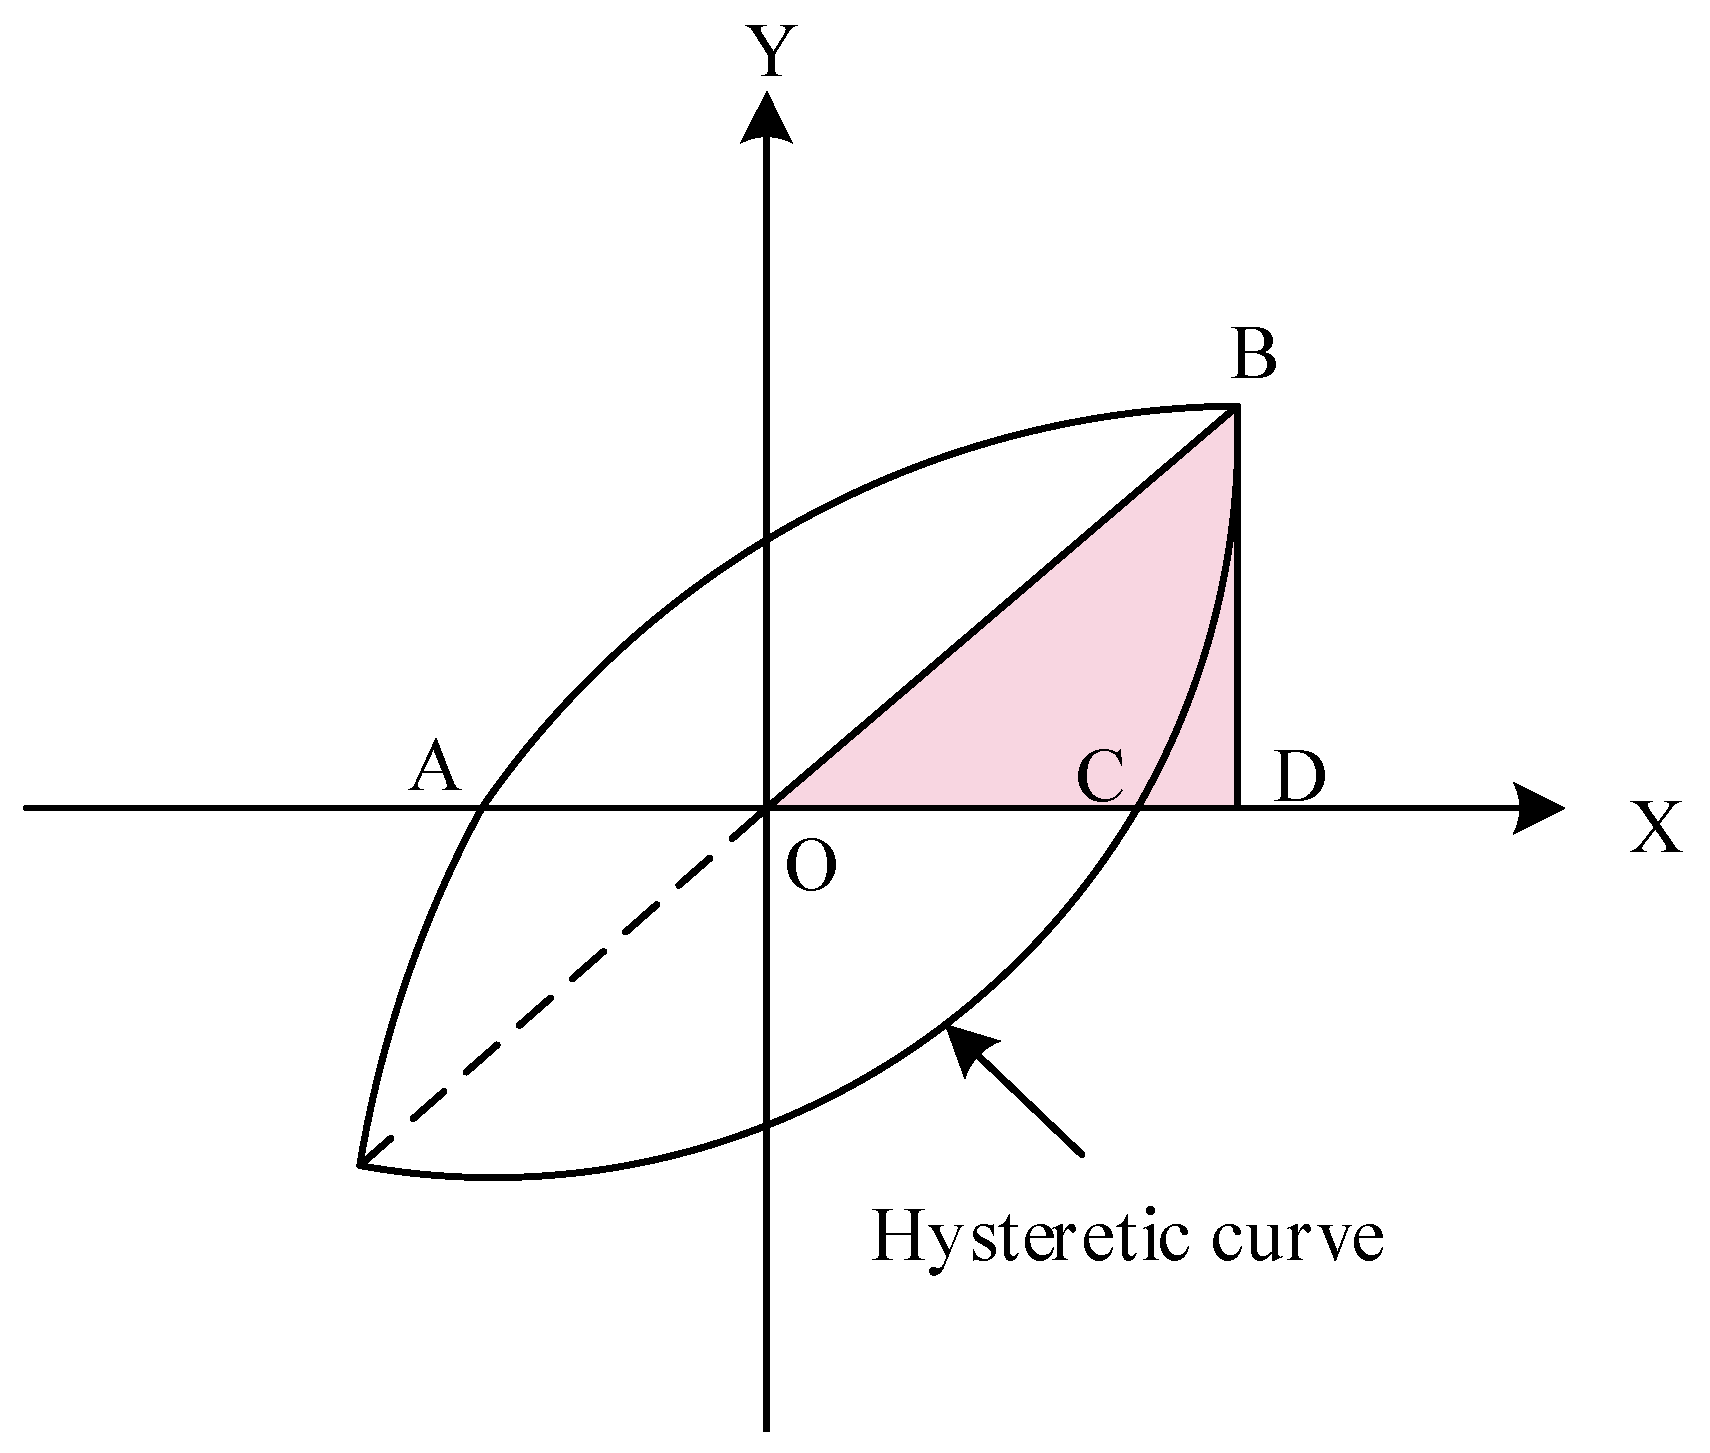
In Equation (12), refers to the integrated Stiffness matrix. expresses the element displacement increment. indicates the sum of the increment of stress field element nodes and the increment of temperature field element nodes. The occurrence of RS is often accompanied by residual deformation, which is a small change in the node. To study the impact of RS in welded joints of BSS on the reversed cyclic lateral loading response of component nodes, FE software is used to simulate and compare the hysteresis curve of joint nodes, both in the presence and absence of RS. In the action of low cycle reciprocating loads, the deformation of the structure increases during loading, and there is residual deformation after unloading. After one cycle, the load displacement curve forms a hysteresis loop, which is formed by multiple cycles under different loads [35]. This curve mainly reflects the seismic performance of the structure, such as stiffness, energy dissipation, ductility, and bearing capacity [36]. The performance of hysteresis loops can generally be divided into four types: bow, shuttle, Z-shaped, and anti S-shaped. The shuttle shape indicates that the structure has strong energy dissipation, ductility capabilities, and seismic resistance. The hysteresis curve of the welded joint, both with and without RS, is shown in Figure 5.
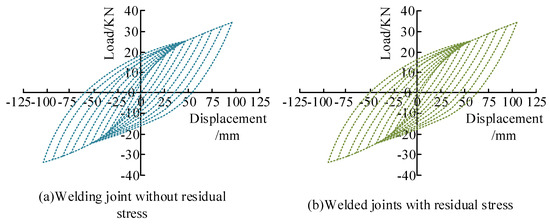
Figure 5.
Hysteresis curve of welded joints with or without RS.
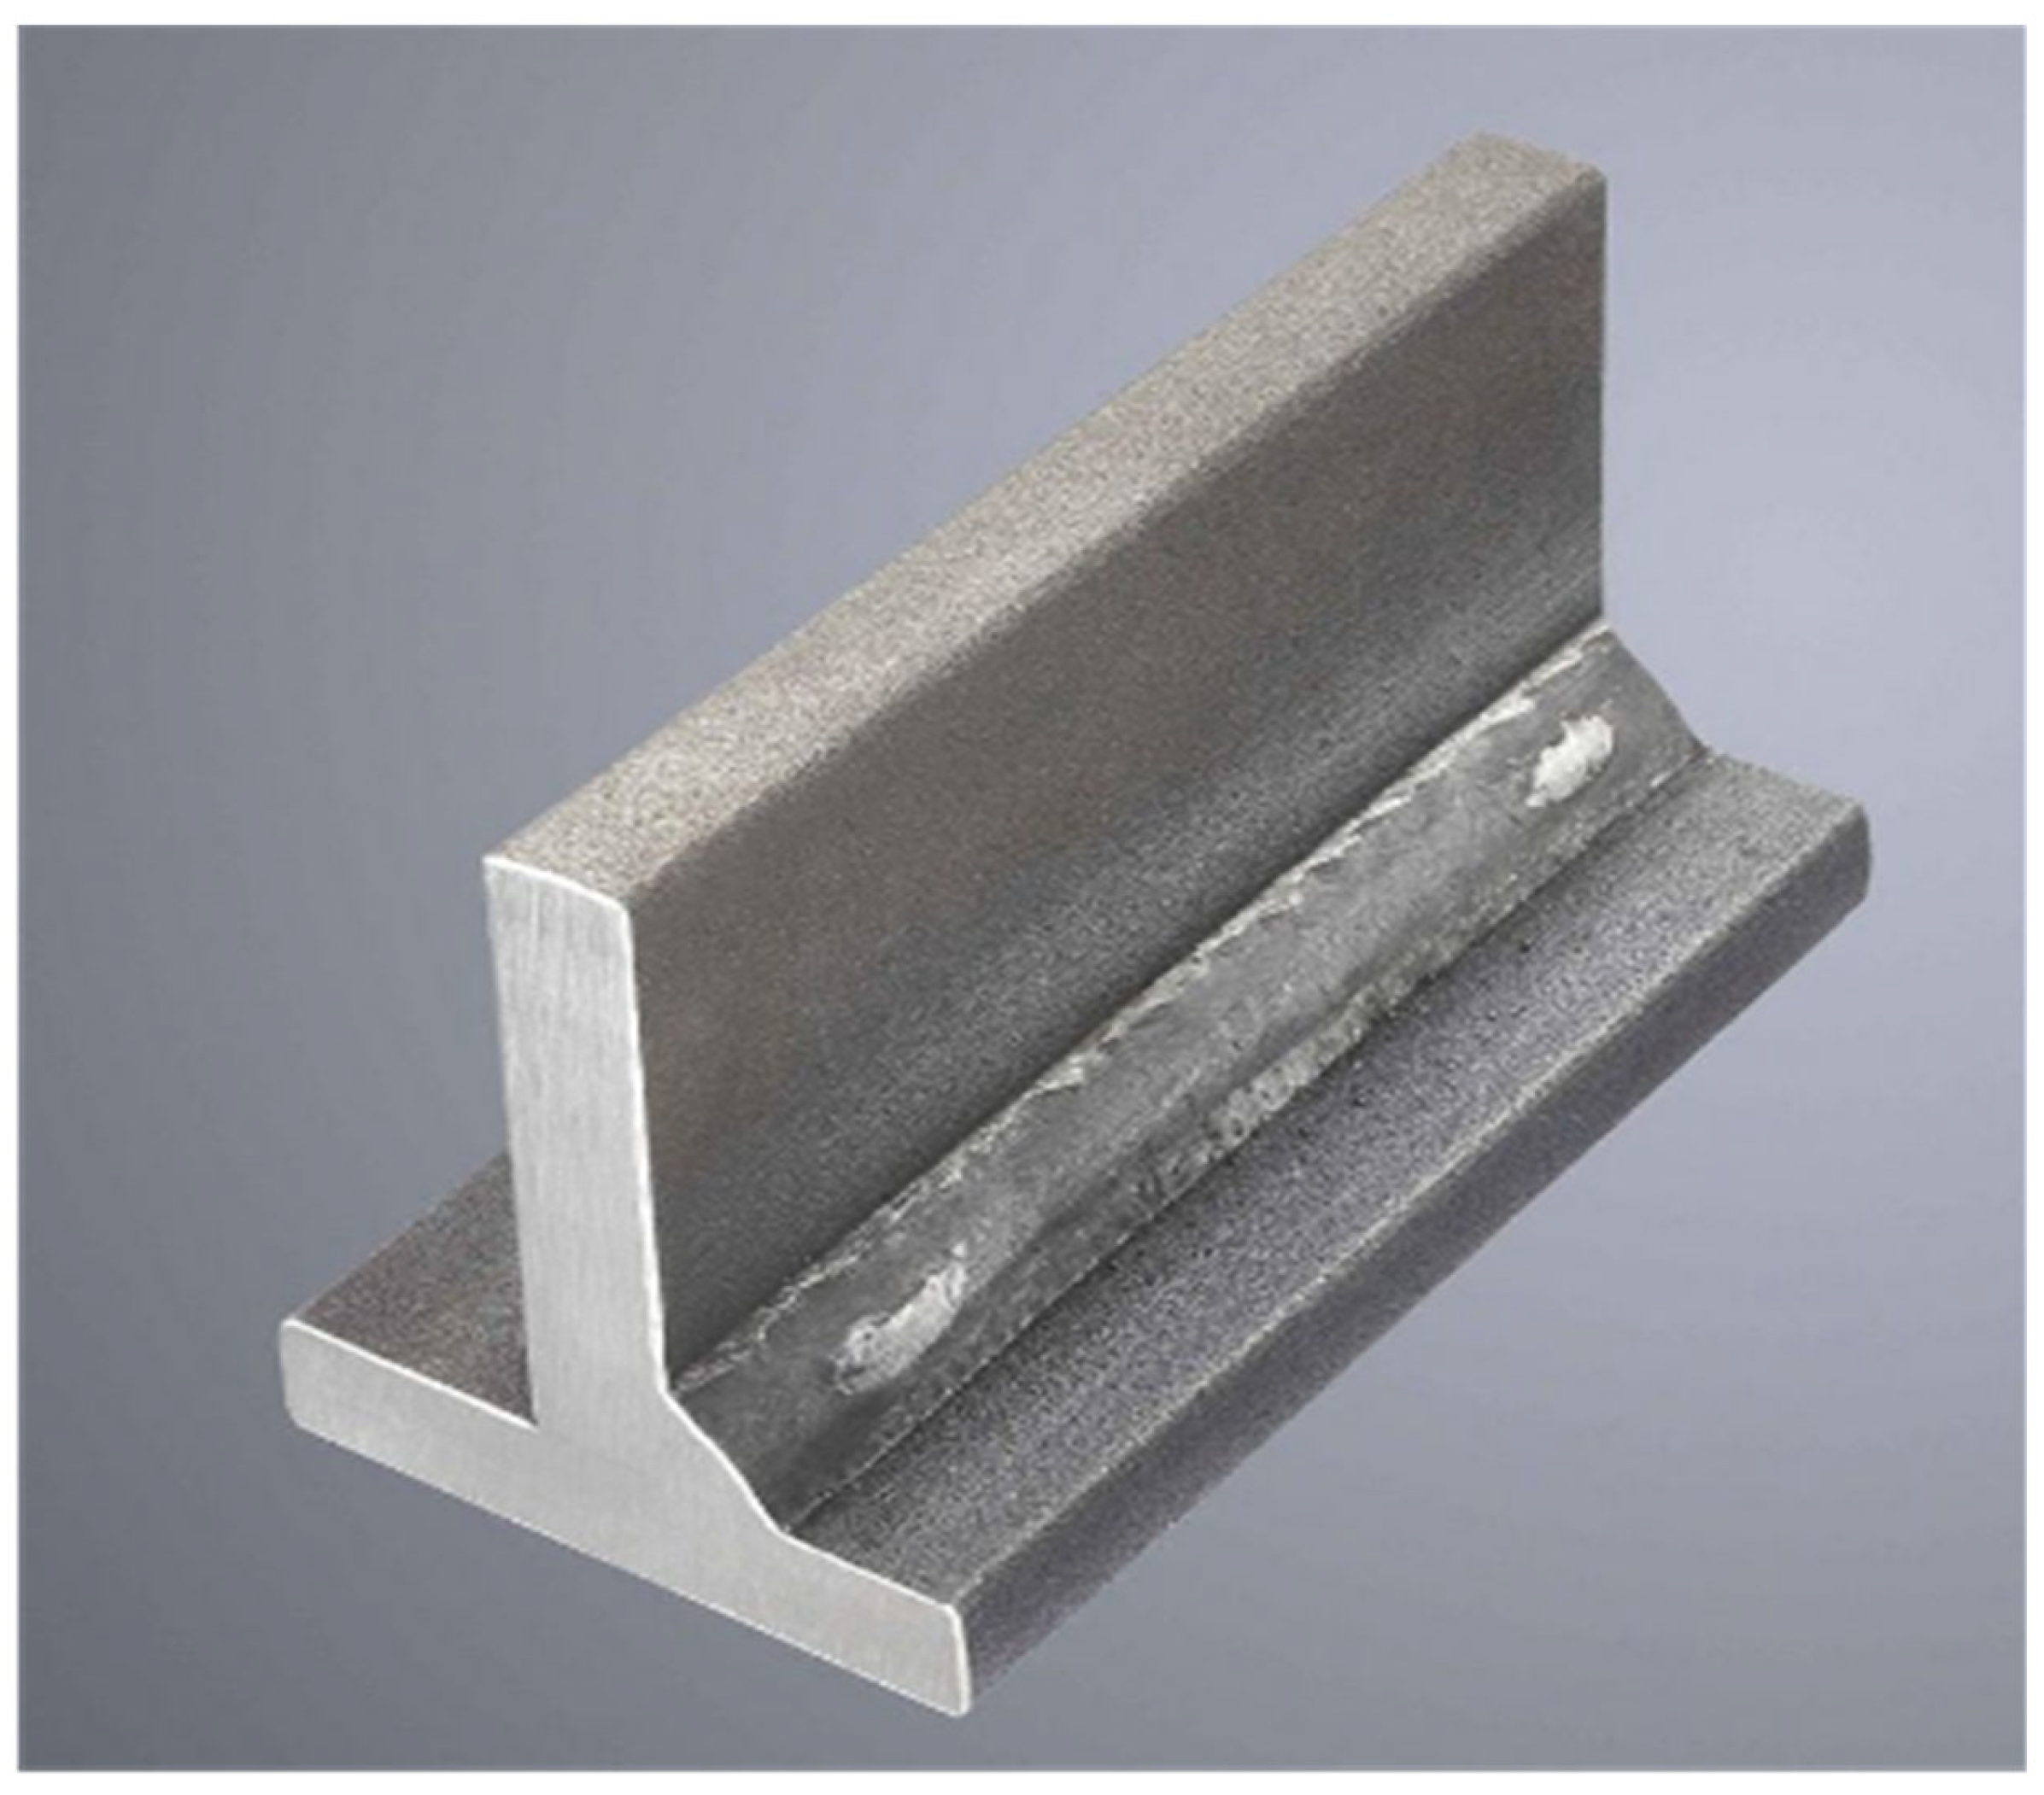
As shown in Figure 5, the hysteresis curves with and without RS were almost identical, indicating that welding RS had minimal impact on the hysteresis performance of welded joint nodes. The shape of the hysteresis curve shows a trend of developing towards an inverse S-shape, indicating that the seismic performance of welded joint nodes was average. After the beam node entered the yield stage and displacement increased, the load increased again, which was because the node was not equipped with a column transverse partition, resulting in poor stiffness of the node. After the beam flange buckled, the box column gradually began to share more load and deformation at the node. In this case, the hysteresis curve might rise after entering the elastic-plastic stage. Comparison of the hysteresis curves of two nodes showed they almost completely coincided, indicating that the impact of welding RS on the energy dissipation of welded joint nodes was minimal and could be ignored. The demonstration diagram of steel bar welding joints is shown in Figure 6.
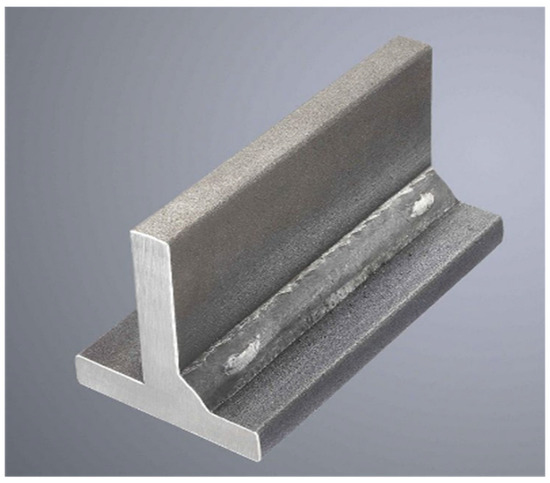
Figure 6.
Demonstration diagram of steel bar welding joints.
To improve the seismic performance of welded joints, a cover plate was installed for strengthening during welding. The cover plate was set in the form of fillet welds, and the width of the weld root opening was set to 6 mm. The hysteresis curve of the reinforced welded joint of the cover plate, both with and without RS, is shown in Figure 7.
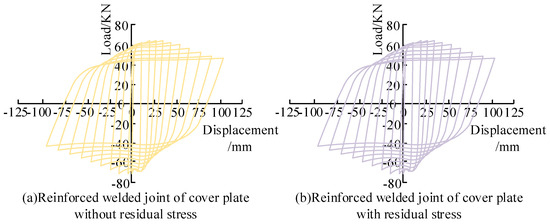
Figure 7.
Hysteresis curve of reinforced welded joints with or without RS on the cover plate.
In Figure 7, the welded joint was strengthened by adding a cover plate that exhibited a full shuttle shape, indicating that the welded joint had strong bearing capacity and seismic performance. Therefore, adding a cover plate during welding could effectively improve the seismic performance of the joint. Comparing and analyzing the hysteresis curve and considering RS with the hysteresis curve that does not consider RS shows that the development trends of the two hysteresis curves were very similar, and so it was suggested that the RS had no effect on the cyclic response of welded joints. The main reason for the cracking of metal components caused by triaxial stress and plastic deformation of components was that when a node in the component was subjected to high levels of triaxial stress, the component was prone to brittle fracture. The comparative analysis of node hysteresis curves showed that welding RS had a negative impact on the hysteresis performance of nodes, with a slight decrease in bearing capacity. The hysteresis curve was not as full as without welding RS. In the hysteresis performance of ordinary nodes, the node form dominated, meaning the influence of welding RS was not very obvious and the curves almost completely coincided. In the case of welded joint nodes with added cover plates for reinforcement, the impact of welding RS gradually manifested, and reinforced nodes were slightly more affected than ordinary nodes. However, overall, the impact of welding RS on the hysteresis performance of nodes was not found to be significant. The analysis of node types shows the improvement of node form enhanced hysteresis performance, significantly improved bearing capacity, and resulted in better seismic performance. The mathematical expression for calculating stress triaxiality is shown in Equation (13).
In Equation (13), stands for the value of stress triaxiality, and represent the three principal stresses at the initiation point, respectively. The nodes with concentrated stress on the component will develop from plastic deformation into cracks when subjected to stress yielding. Therefore, the equivalent plastic strain index can effectively describe the development status of cracks, with a larger index value indicating a higher probability of cracking [37]. The mathematical expression for the equivalent plastic strain index is shown in Equation (14).
In Equation (14), refers to the equivalent plastic strain index. denotes the equivalent plastic strain of the node. express the three plastic principal strains. indicates the yield strain [38]. The cracking index can describe the ability of a component to transition from ductile cracking to brittle cracking, and is an important indicator in the measurement of the fracture performance of a component structure: the higher the cracking index, the greater the likelihood of brittle fracture occurring. The mathematical expression for the cracking index is shown in Equation (15).
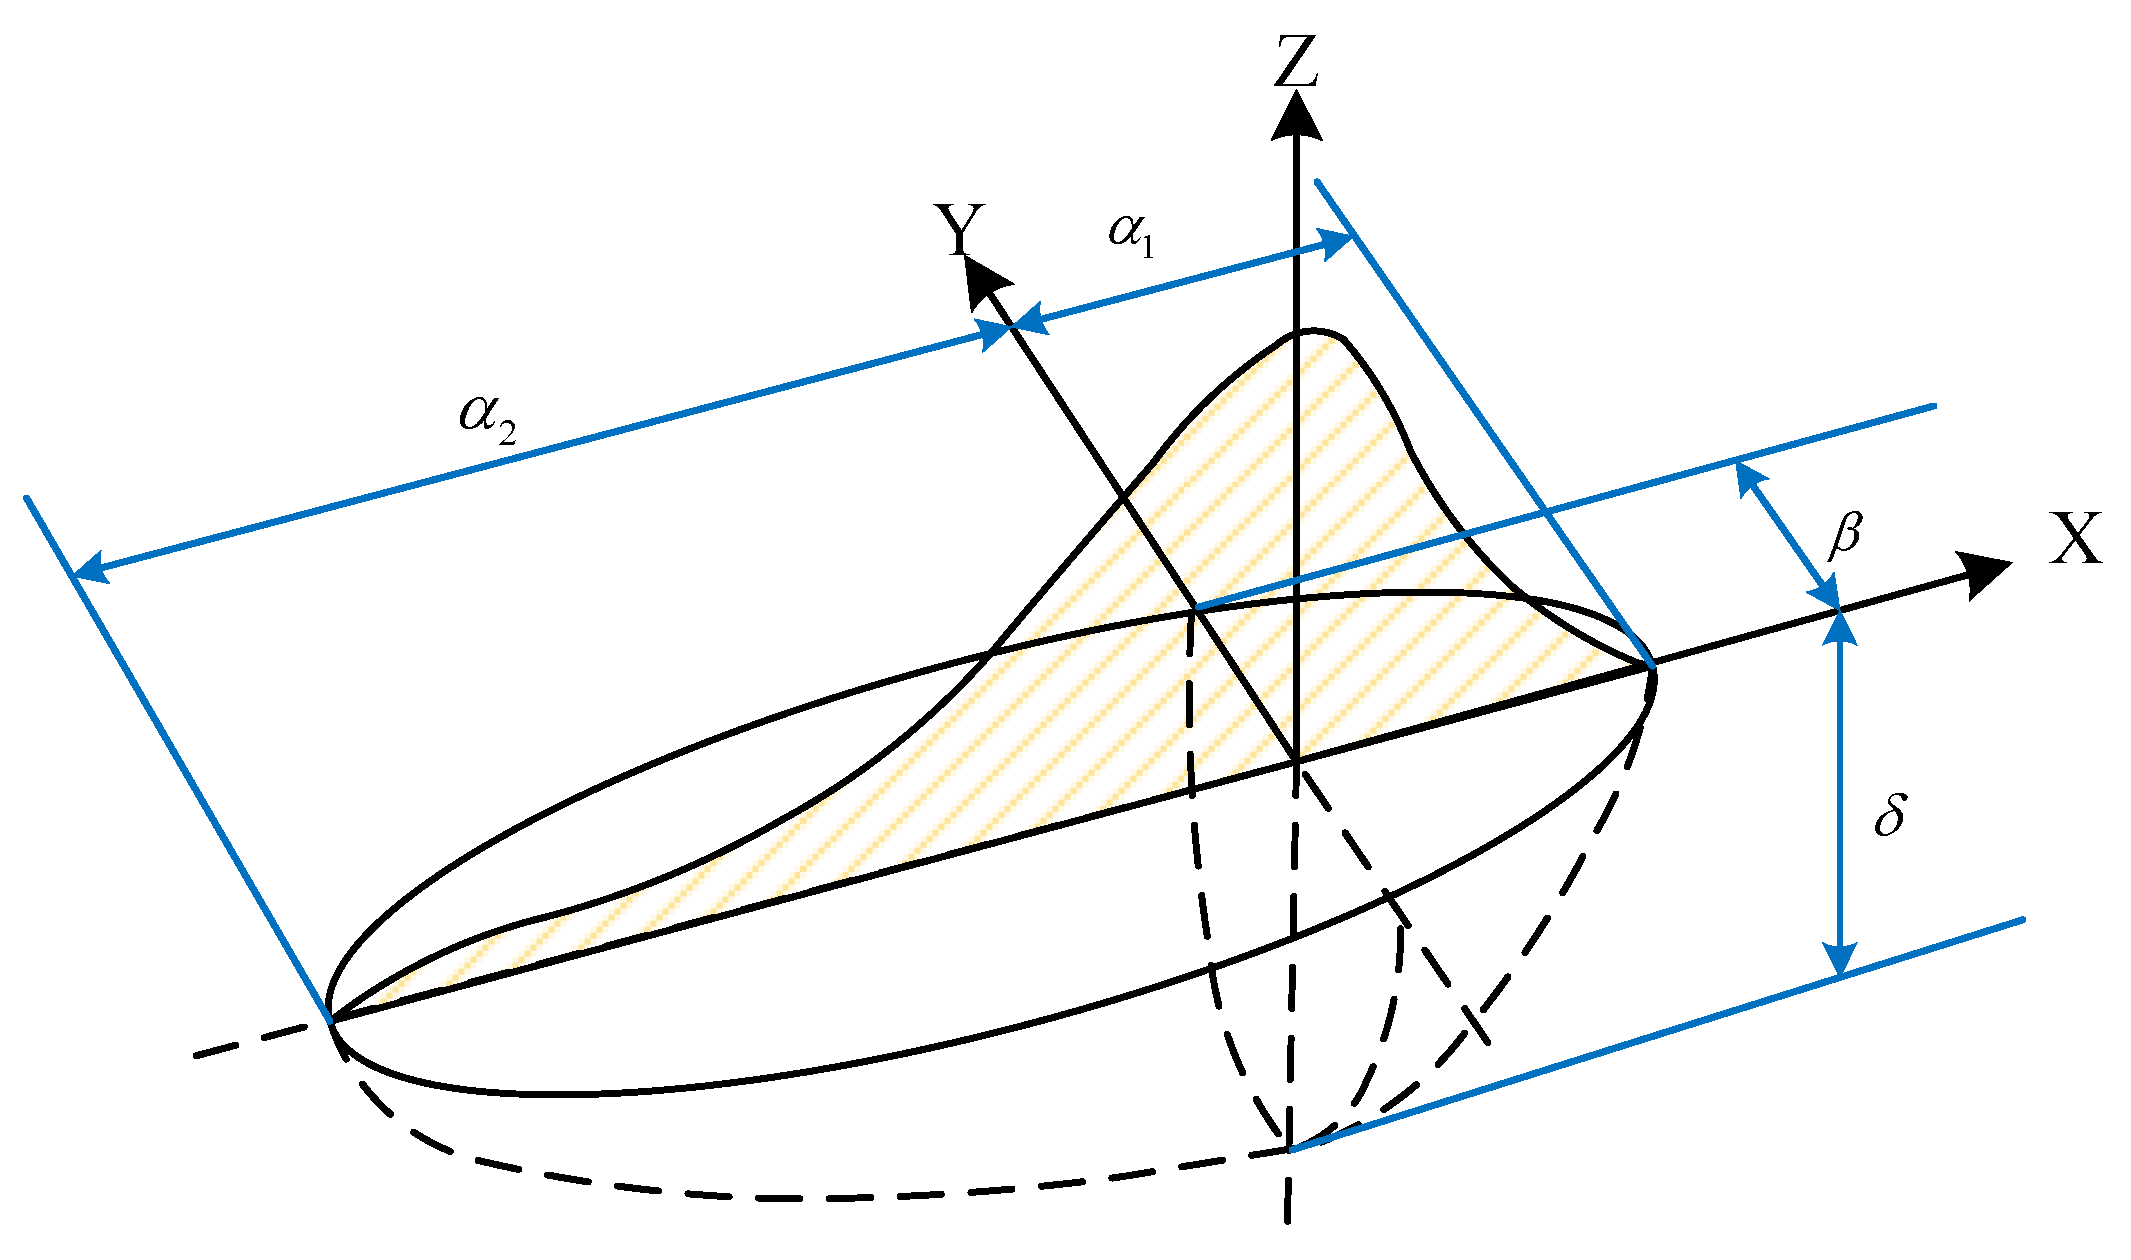
In Equation (15), is the cracking index. refers to the hydrostatic pressure. represents the equivalent stress [39]. The envelope area of the hysteresis loop curve can reflect the energy dissipation capacity of the structure well, and when the value of the equivalent viscous damping coefficient, which is a quantitative indicator of energy dissipation capacity, is larger, the energy dissipation of the component (e.g., seismic performance in earthquakes) is higher. Therefore, calculating the equivalent viscous damping coefficient of the hysteresis loop curve of welded joints can help us to analyze the seismic performance of welded joints. The schematic diagram for calculating the equivalent viscous damping coefficient is shown in Figure 8.

Figure 8.
Schematic diagram for calculating the equivalent viscous damping coefficient.
In Figure 8, the equivalent viscous damping coefficient is calculated from the area enclosed by the ABC segment, the horizontal axis of the hysteresis curve, and the area enclosed by the BOD. The calculation method for the equivalent viscous damping coefficient is shown in Equation (16).
In Equation (16), is the damping coefficient. The comparison of the equivalent viscous damping coefficient values calculated based on FENS, both with and without RS, is shown in Table 1 [40].

Table 1.
Comparison of equivalent viscous damping coefficient values.
As shown in Table 1, the reinforced welded joint of the cover plate without RS had the best energy consumption capacity, and the ordinary welded joint with RS had the worst. The equivalent viscous damping coefficient of ordinary welded joints with RS was reduced by 0.8% compared to ordinary welded joints without RS. The equivalent viscous damping coefficient of cover plate-reinforced welded joints with RS was reduced by 2.4%, compared to cover plate-reinforced welded joints without RS. The above indicated that RS can reduce the seismic performance of welded joints in BSS. Placing a cover plate to strengthen during welding could improve the seismic performance of welded joints. RS had a smaller impact on ordinary welded joints, and a greater impact on reinforced welded joints.
4. Numerical Simulations of Seismic Performance and the RS of Welded Joints in BSS Based on FE Method
To verify the seismic performance of welded joints in BSS under RS conditions, numerical simulations were conducted on the seismic performance and RS of welded joints in BSS based on FE methods. We used the Sentinel-1A radar satellite dataset from NASA, which can reconstruct the coseismic deformation field of earthquakes. On this basis, the impact of stress on seismic performance could be analyzed by referring to changes in stress [41]. Firstly, the RS in the transverse and longitudinal directions of the V-groove welded joint structure were verified, as shown in Figure 9. In Figure 9a, the abscissa represents the length distance between L1 and L2, while the ordinate represents the transverse RS. The distribution trend of transverse RS in L1 and L2 was found to be consistent, and both L1 and L2 achieved peak transverse RS at a length distance of 160 mm. The peak transverse RS in L1 and L2 was 475 MPa and 325 MPa, respectively, and in L2 reduced by 31.58%, when compared to L1.
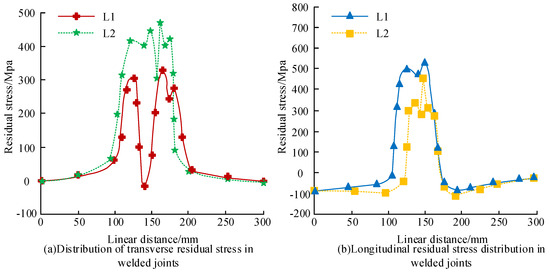
Figure 9.
RS in the transverse and longitudinal directions of V-groove-welded joint structures.
In Figure 9b, the horizontal axis represents the length distance between L1 and L2, while the vertical axis represents the longitudinal RS. The distribution trend and magnitude of the longitudinal RS in L1 and L2 had good consistency. At a length distance of 150 mm, the longitudinal RS peaks obtained in L1 and L2 were 525 MPa and 425 MPa, respectively. The longitudinal RS peak in L2 decreased by 19.05%, compared to L1. Overall, the RS in the vicinity of the weld seam was tensile stress, and the distribution trend of RS in the long and wide directions of the FE model was consistent. The above results confirm the transverse and longitudinal RS distribution of the V-shaped-groove-welded joint structure exhibited a certain regularity. In the lateral direction, the RS distribution trends of L1 and L2 were consistent, both peaking at a length distance of 160 mm. However, the peak RS in L2 decreased by 31.58%, compared to L1, indicating that, in the case of the transverse direction, the RS gradually decreased as the distance from the center of the weld increased. In the longitudinal direction, the RS distribution trend and magnitude of L1 and L2 also showed good consistency, peaking at a length distance of 150 mm. However, the longitudinal RS peak of L2 also decreased by 19.05%, when compared to L1, indicating that, in the longitudinal direction, the RS gradually decreased as the distance from the center of the weld increased. Overall, the RS in the vicinity of the weld seam was tensile stress, and the distribution trend of RS in the length and width directions of the FE model was consistent, which indicated that the RS distribution in the transverse and longitudinal directions of V-groove welded joints was influenced by various factors, such as the welding process, material properties and joint form, etc.
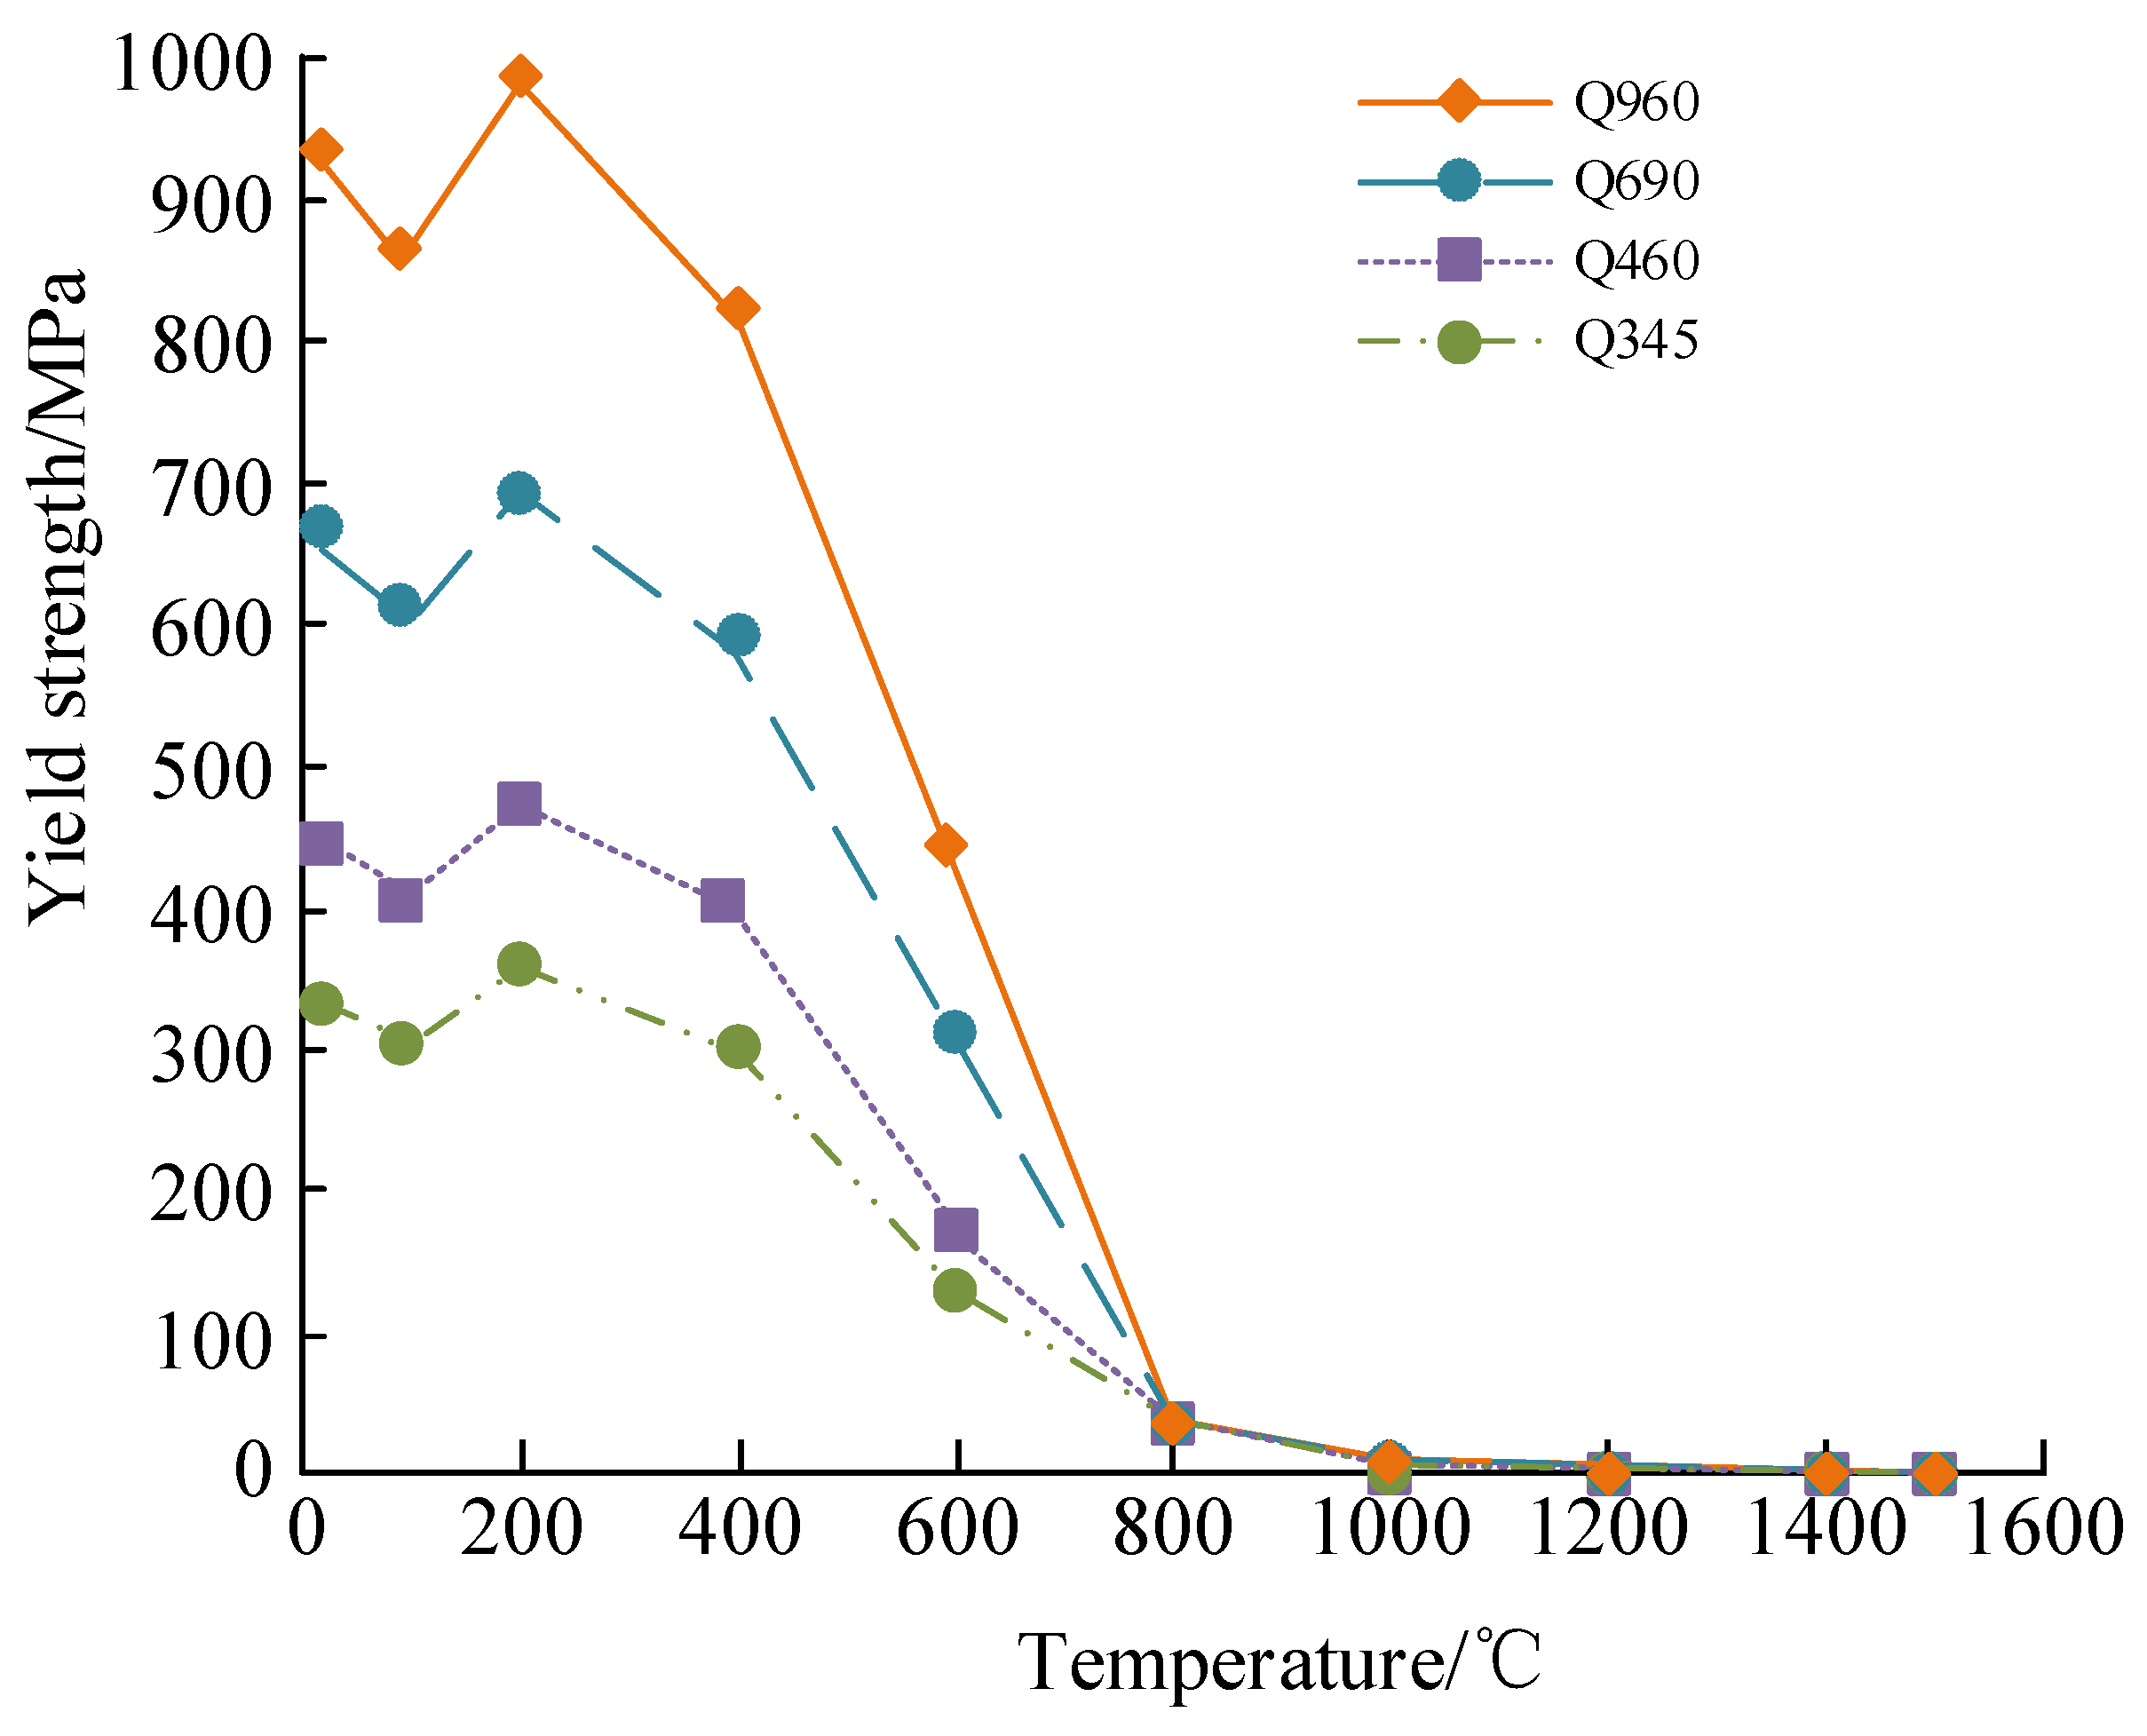
To verify and analyze the impact of RS on seismic performance, butt-welded joints with different steel structure plates were constructed, and four different steel structure plates (Q345, Q460, Q690, and Q960) were subjected to numerical simulation (conducted with ABAQUS FE software) and comparative analysis. The joints were all flat butt joints, and instantaneous heat sources were used during the welding process. The dimensions of the four types of steel structural plates were all , and five weld passes were set. The coefficient of radiation heat dissipation was 0.25, and the coefficient of convective heat dissipation was . The comparison of the yield strength of four different steel structural plates is shown in Figure 10. When the temperature reached 800 °C, the yield strength of all four types of steel structural plates decreased to 50 MPa; when it exceeded 800 °C, the yield strength decreased to 0; and when the temperature reached 200 °C, the maximum yield strength of all four types of steel structural plates was achieved, and the maximum yield strength of the Q345, Q460, Q690, and Q960 steel structural plates was 345 MPa, 460 MPa, 690 MPa, and 960 MPa, respectively. The greater the yield strength, the better the ductility and toughness, and therefore the seismic performance of four different steel structural plates was . Overall, the processing temperature of the four types of steel structural plates could not exceed 800 °C, and Q960 showed the best seismic performance of the four types of steel structural plates. In referring to the above results, we see the yield strength of four different steel structural plates decreased to 50 MPa when the temperature reached 800 °C, meaning that, when at this temperature, the structural strength of these materials was already very low, which could cause structural failure or damage. After exceeding 800 °C, the yield strength further decreased to 0, indicating these materials lose their load-bearing capacity at high temperatures. When the temperature reached 200 °C, all four types of steel structural plates reached their respective peak yield strength. Of them, the maximum yield strengths of Q345, Q460, Q690, and Q960 were 345 MPa, 460 MPa, 690 MPa, and 960 MPa, respectively. Yield strength was the minimum stress value at which a material undergoes plastic deformation, reflecting the material’s ability to resist plastic deformation: the higher the yield strength, the greater the force that the material needs to withstand during plastic deformation, resulting in better ductility and toughness. In referring to the obtained data, we draw the following conclusions: first, the processing temperature of the four different steel structural plates cannot exceed 800 °C, as this will lead to a significant decrease in material strength and affect structural safety. Second, at this temperature, Q960 has the highest yield strength of up to 960 MPa, indicating it is most strongly resistant during plastic deformation, and therefore has the best seismic performance.
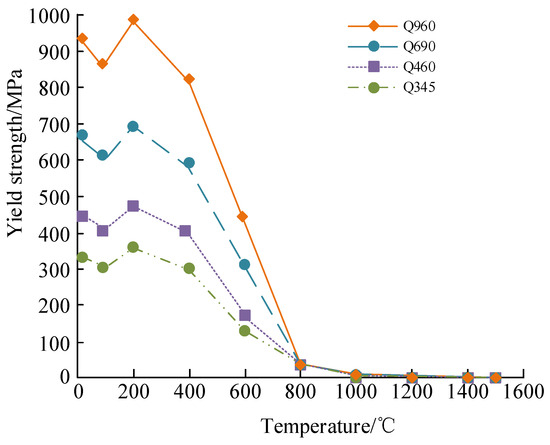
Figure 10.
Comparison of the yield strength of four different steel structural plates.
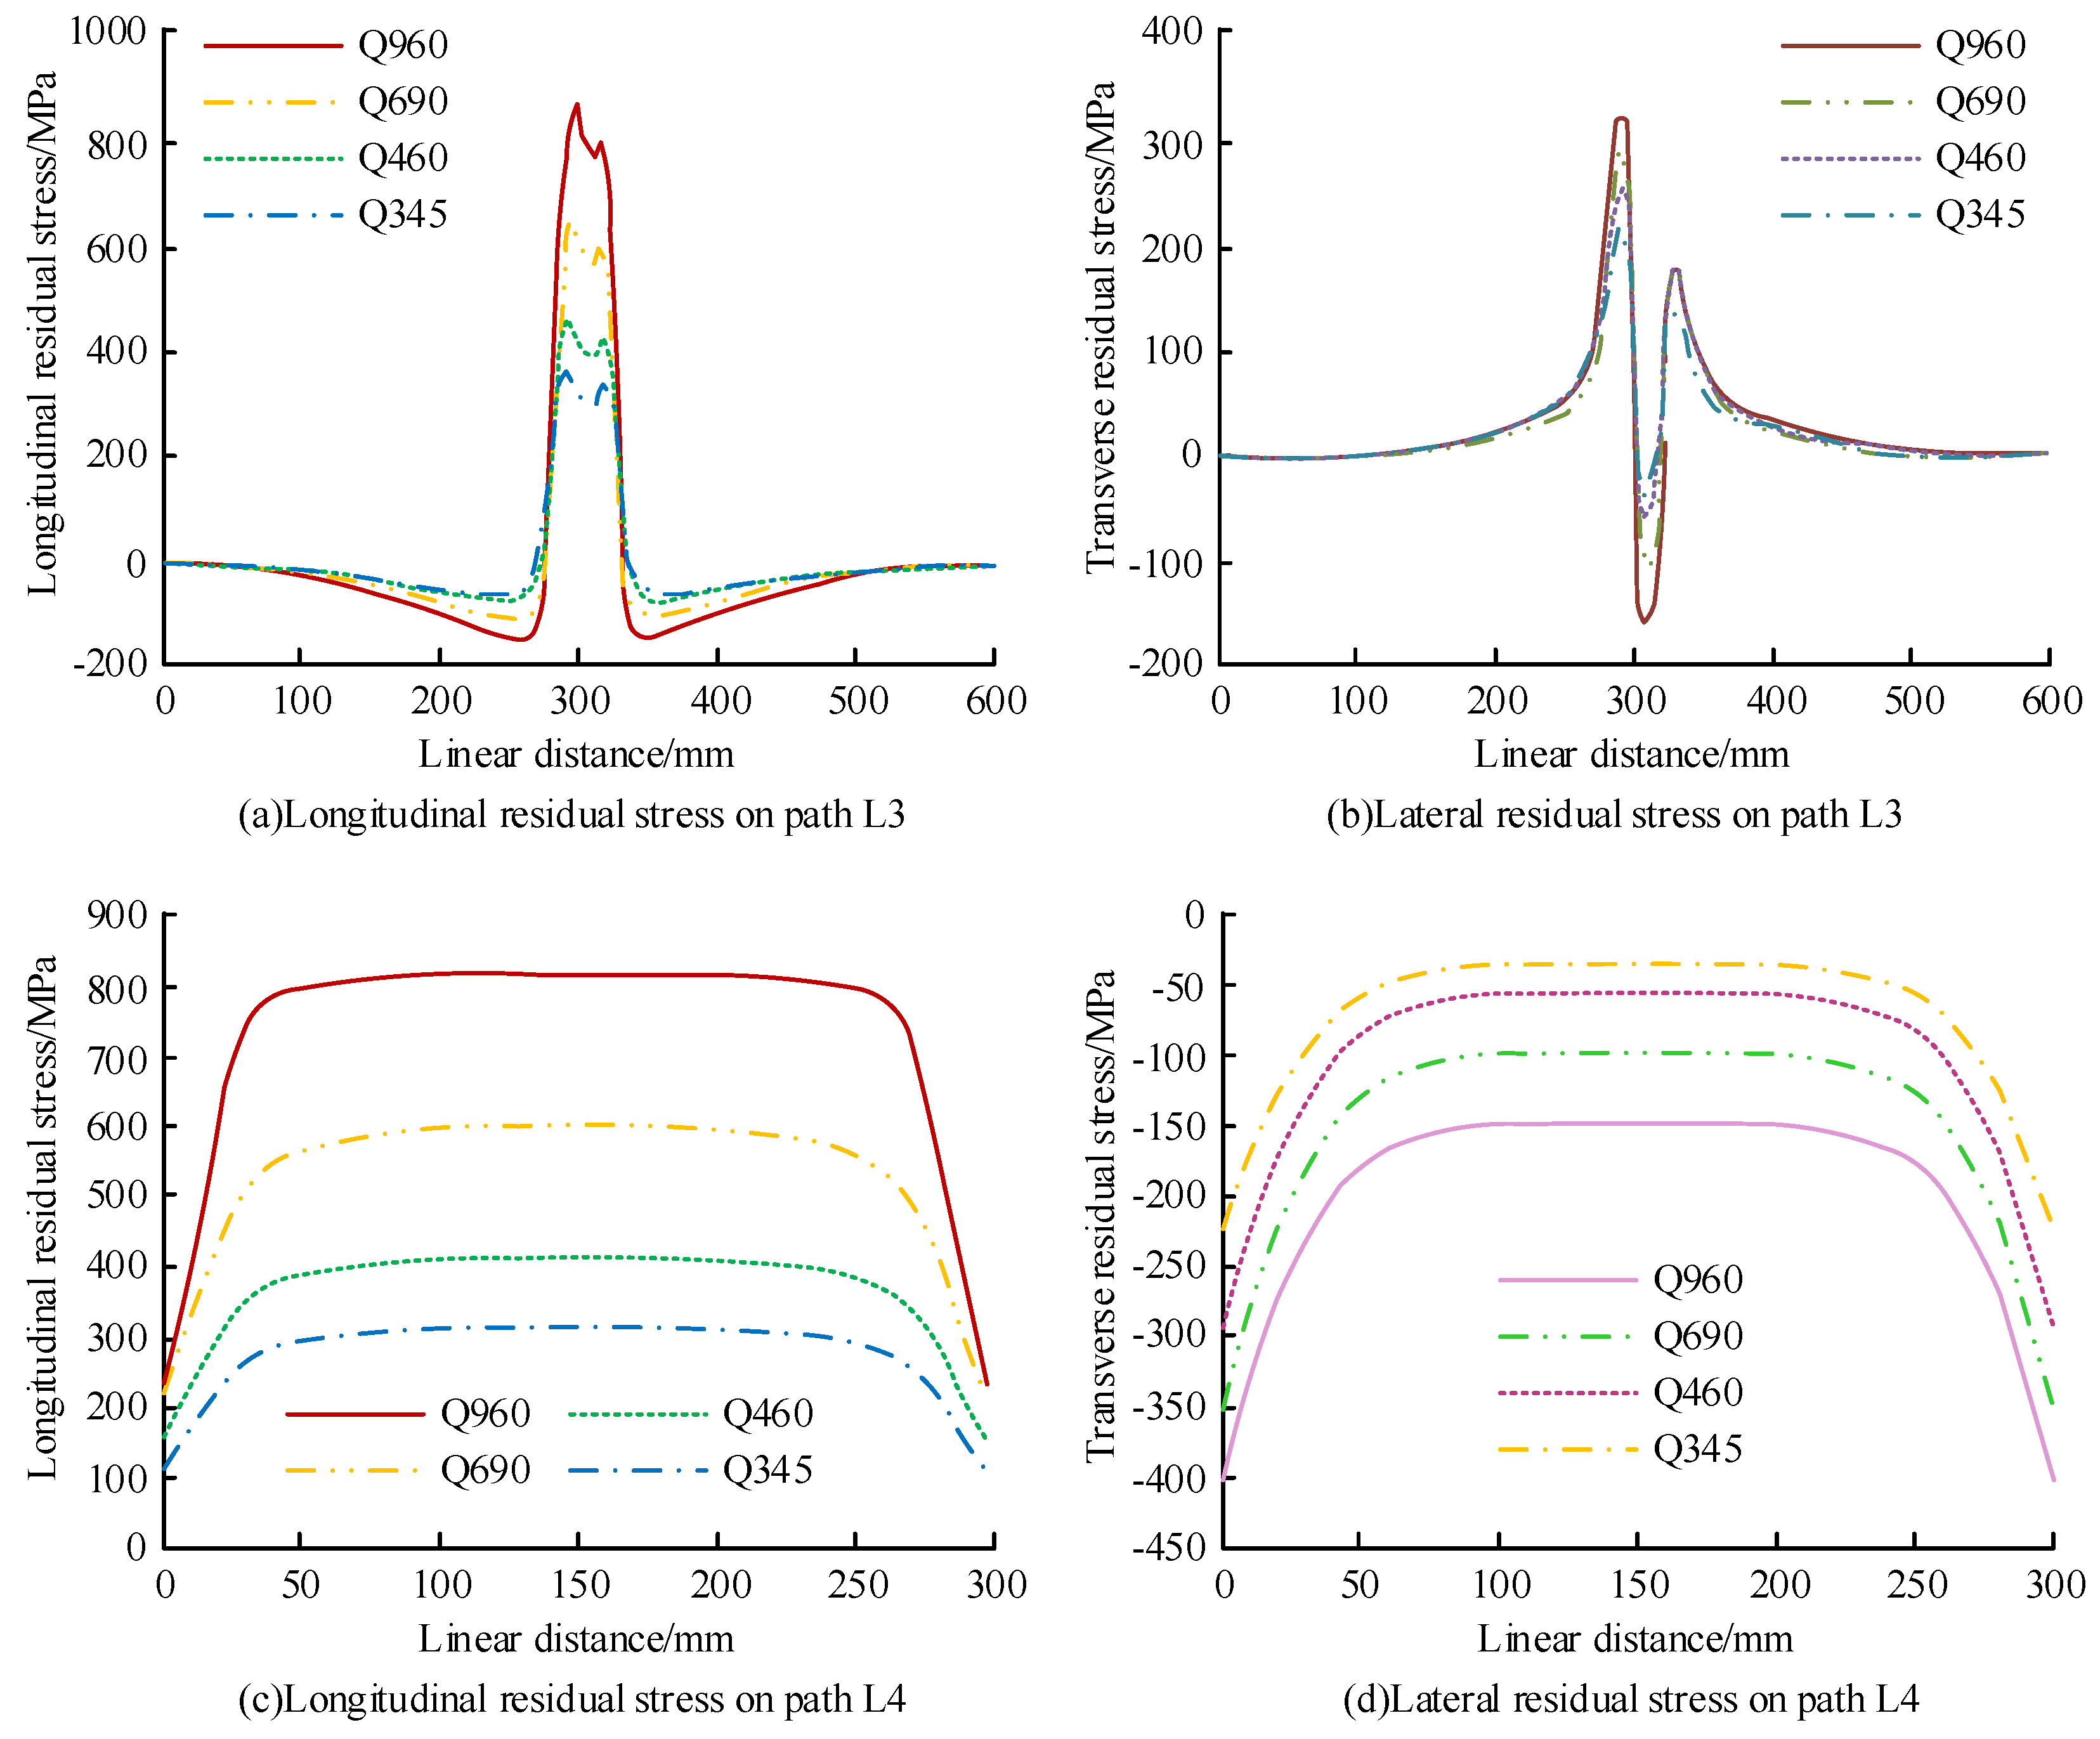
As shown in Figure 3, L1 and L2 represent the RS distribution along the horizontal and vertical directions of the welded web, respectively. To verify the RS distribution of four different steel structural plates, the distance perpendicular to the central section of the weld seam in the flat-butt-joint-weld structure was set to L3, and the center-line path of the weld seam was set to L4. The RS distribution curves on paths L3 and L4 are shown in Figure 11. In Figure 11a, the longitudinal RS distribution trends of the four types of steel structural plates are very similar, and only the peaks differ. When the distance of L3 was 300 mm, the longitudinal RS peaks obtained for Q345, Q460, Q690, and Q960 were 350 MPa, 475 MPa, 650 MPa, and 875 MPa, respectively. In Figure 11b, the L3 distance of the four types of steel structural plates obtain transverse RS peaks and valleys at both ends near to the center-line of the weld. The transverse RS peaks obtained for Q345, Q460, Q690, and Q960 were 225 MPa, 250 MPa, 275 MPa, and 325 MPa, respectively. The transverse RS valleys obtained for Q345, Q460, Q690, and Q960 were −25 MPa, −50 MPa, −100 MPa, and −150 MPa, respectively. In Figure 11c, the RS of Q960 is significantly greater than other steel structural plates. When the distance of L4 was between 0 to 30 mm, the longitudinal RS of the four steel structural plates increased as the distance increased. When the distance was from 30 mm to 270 mm, the longitudinal RS of the four steel structural plates remained unchanged. When the distance of L4 was from 270 mm to 300 mm, the longitudinal RS of the four steel structural plates decreased when the distance increased. In Figure 11d, the distribution trend of lateral RS in L4 is consistent with the trend of longitudinal RS. Overall, when the yield strength was greater, so was the value of RS generated by welding steel structural plates.
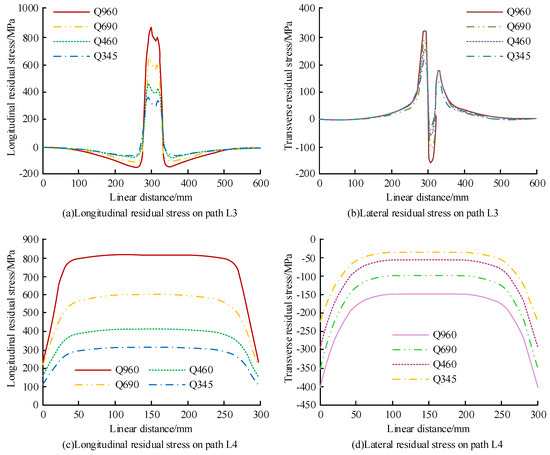
Figure 11.
RS distribution curves on paths L3 and L4.
In order to observe the relationship between RS and the yield strength of four types of steel structural plates more clearly, the relationship was plotted, as shown in Figure 12, which shows the overall RS increased linearly with the increase of yield strength. At the same yield strength, the value of longitudinal RS was significantly greater than transverse RS. When the yield strength was 345 MPa, the value of longitudinal RS increased by 27.78%, compared to transverse RS. When the yield strength was 960 MPa, the value of longitudinal RS increased by 88%, compared to transverse RS. These results demonstrated a linear relationship between RS and yield strength that indicated that when the yield strength increased, the overall RS also increased accordingly. This may be because materials with high yield strength are often stiffer and stronger, resulting in greater RS during the welding process. In addition, the difference between longitudinal RS and transverse RS shows that, when yield strength was the same, the value of longitudinal RS was significantly greater than transverse RS, which could be attributed to the shrinkage and thermal expansion characteristics of the material during the welding process, as well as the geometric shape and constraint conditions of the welded joint. The effect of solid-state phase transition on longitudinal RS was more significant, and its effect on transverse RS was relatively small, indicating that solid-state phase transition mainly affected the material’s longitudinal properties. As the yield strength increased, the effect of solid-state phase transformation on longitudinal RS also increased accordingly.
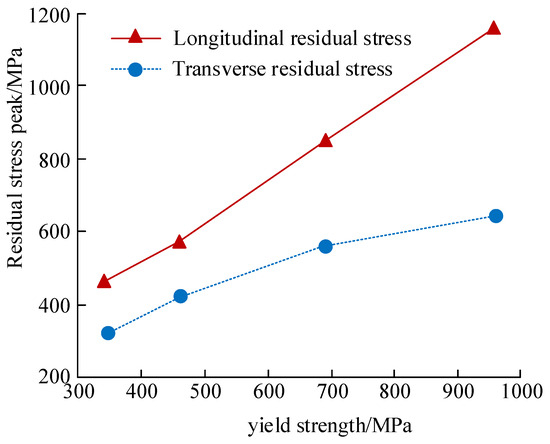
Figure 12.
Relationship between the RS and yield strength of four types of steel structural plates.
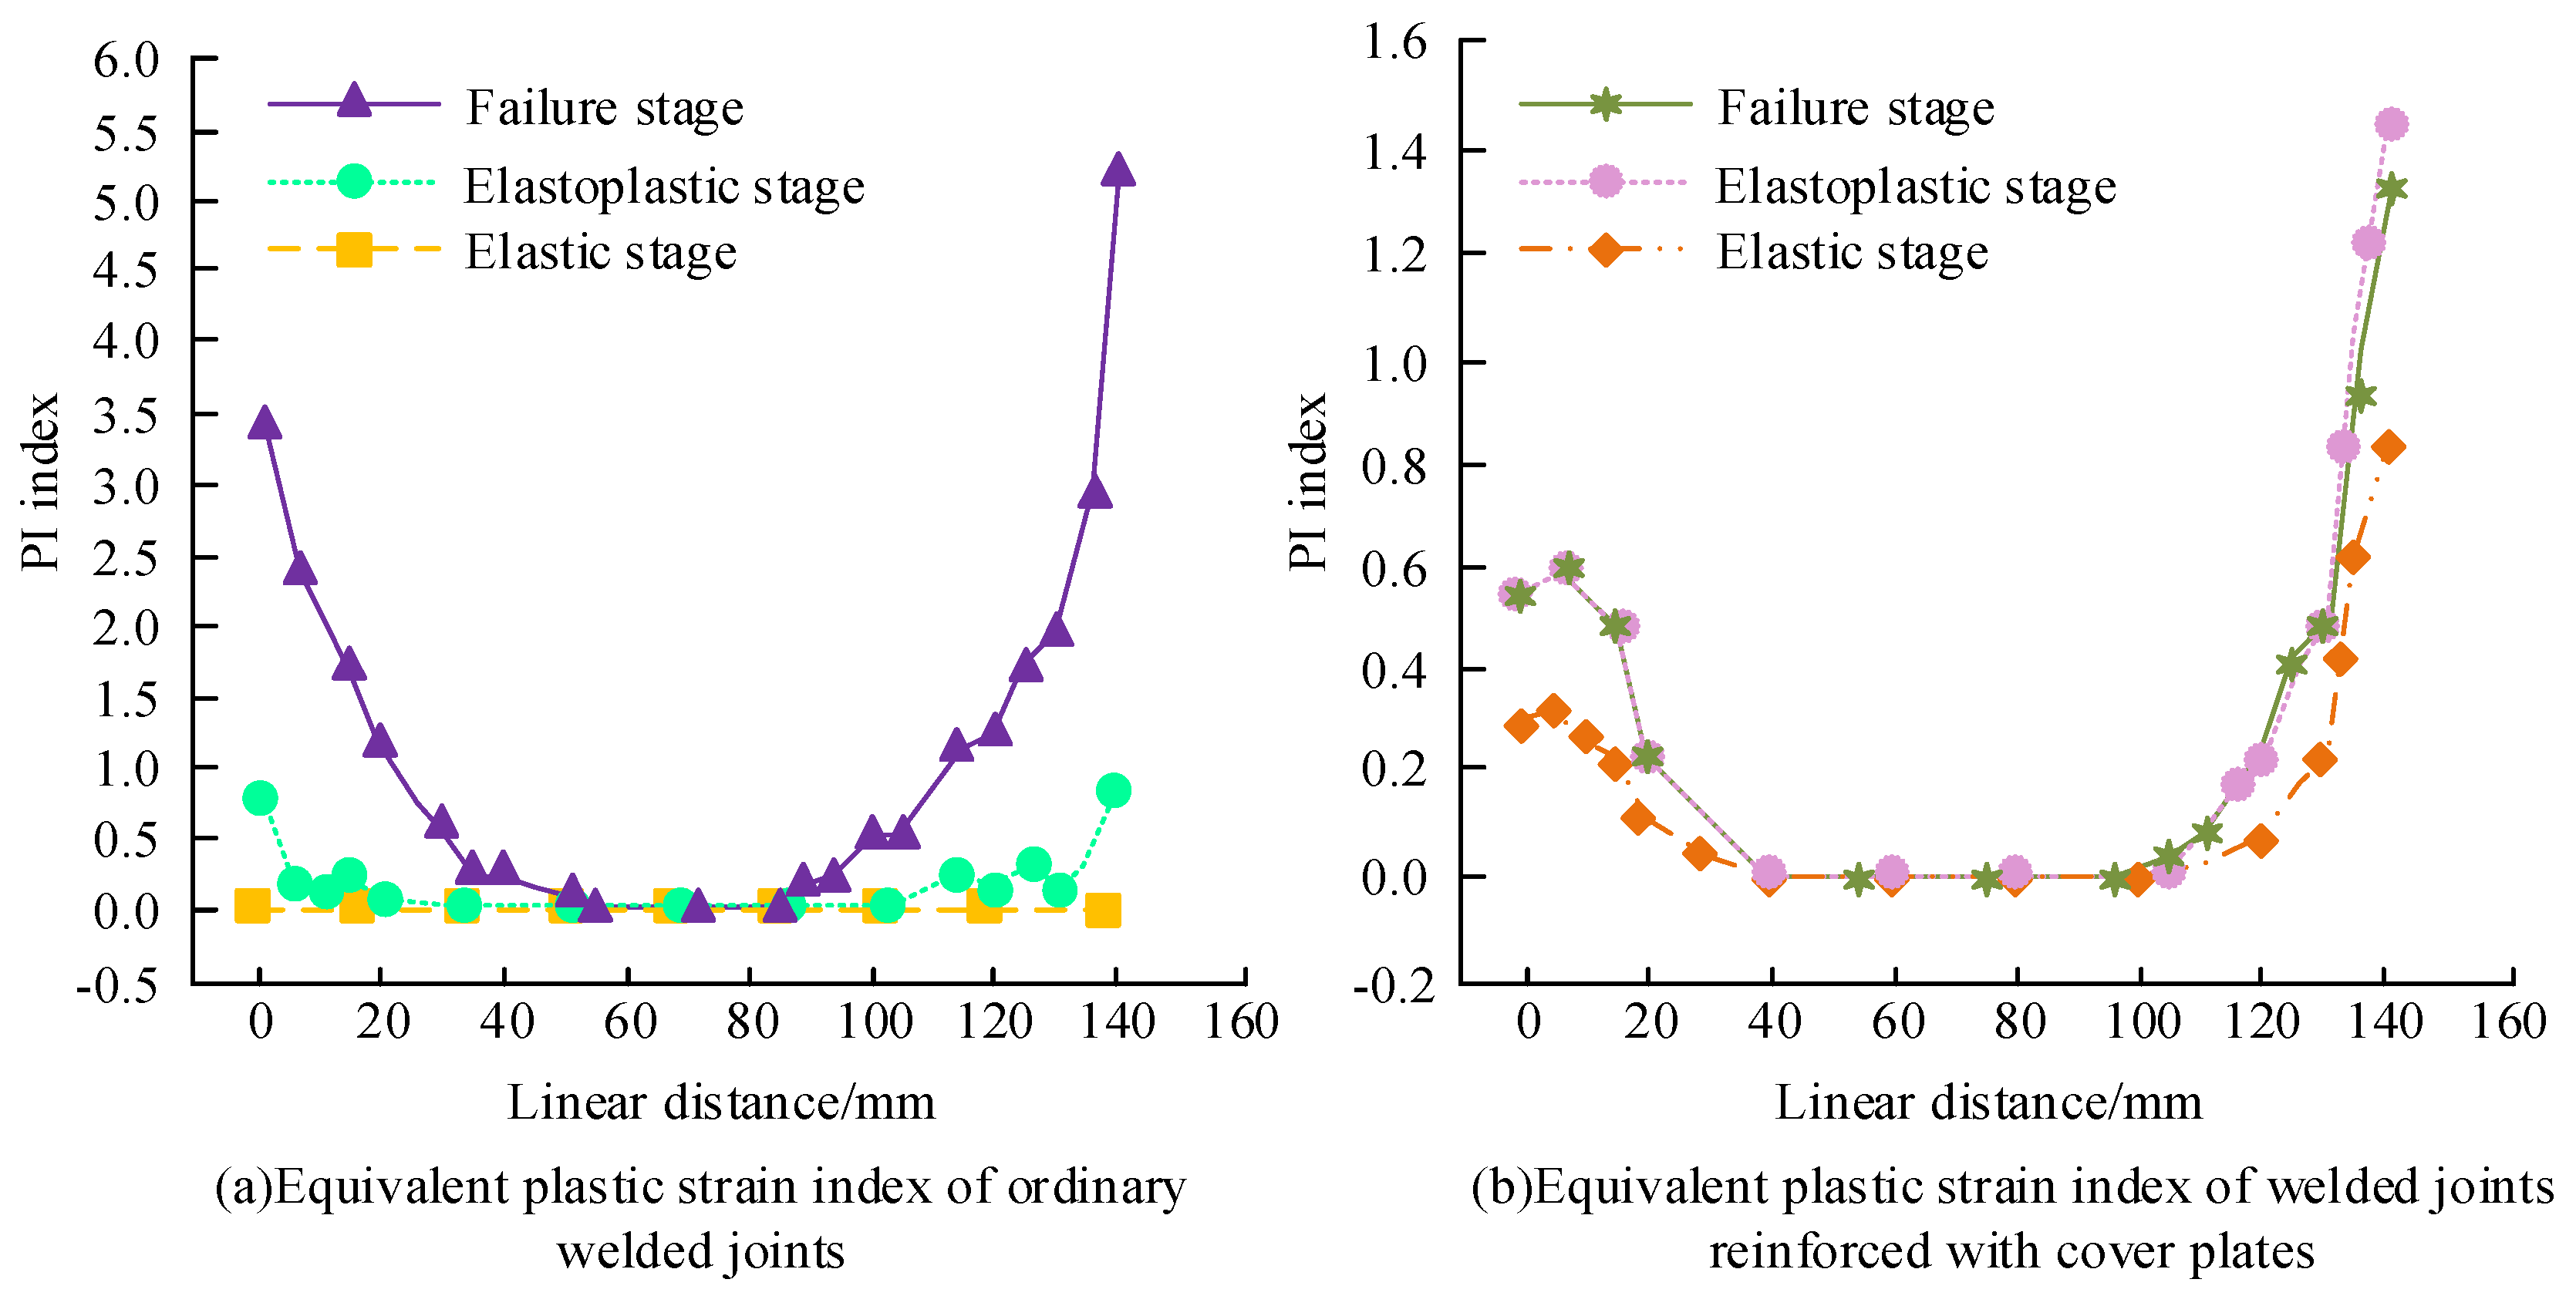
In order to verify the fracture performance of each node of the welded joint, numerical simulation was conducted on the ordinary welded joint and the cover plate reinforced welded joint, before the equivalent plastic strain index of each node at different stages was plotted, as shown in Figure 13. In Figure 13a, when the ordinary welded joint was at the elastic stage, the equivalent plastic strain index of each node was 0. When the ordinary welded joint was at the elastic-plastic stage, the equivalent plastic strain index of each node showed a trend of being large at both ends and stable in the middle. At this time, the equivalent plastic strain index was 0.60 and 0.63 when the distance between the two ends was 0 mm and 140 mm, respectively. When the ordinary welded joint was at the failure stage, the equivalent plastic strain index of each node showed a significant growth trend at both ends; at this time, the equivalent plastic strain index was 3.50 and 5.25 at distances of 0 mm and 140 mm, respectively. In Figure 13b, when the reinforced welded joint of the cover plate was at the elastic stage, the equivalent plastic strain indices were, at distances of 0 mm and 140 mm, 0.28 and 0.81, respectively. The trend of the elastic-plastic and the trend of the failure stages of the welded joint reinforced by the cover plate were almost the same. The equivalent plastic strain indices of both stages at a distance of 0 mm were 0.53, while the equivalent plastic strain indices of the elastic-plastic and failure stages at 140 mm were 1.46 and 1.34, respectively. Overall, the probability that each node of ordinary welded joints would fracture during the failure stage was relatively high.
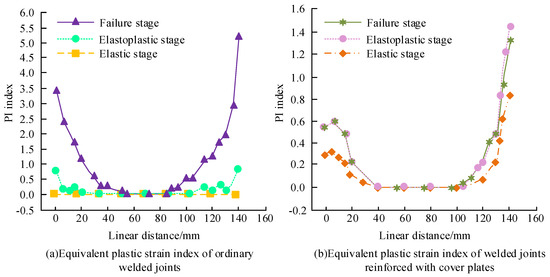
Figure 13.
Equivalent plastic strain index of each node at different stages.
In order to comprehensively verify the fracture performance of each node of the welded joint, a comparative analysis was conducted of the cracking index of ordinary welded joints and cover plate-reinforced welded joints. The cracking index of each node at different stages is shown in Figure 14. In Figure 14a, the cracking index of ordinary welded joint nodes in the elastic stage is 0. When the distance was 0 mm, the maximum cracking index in the elastic-plastic stage and the failure stage was 0.78 and 3.82, respectively. In Figure 14b, the cracking index trend of each node in the reinforced welded joint of the cover plate is consistent in the three stages. When the distance was 140 mm, the cracking index in the elastic stage, elastic-plastic stage, and failure stage were 1.83, 7.52, and 5.04, respectively. Overall, there was a high possibility that each node of the reinforced welded joint of the cover plate would crack during the elastic-plastic stage.
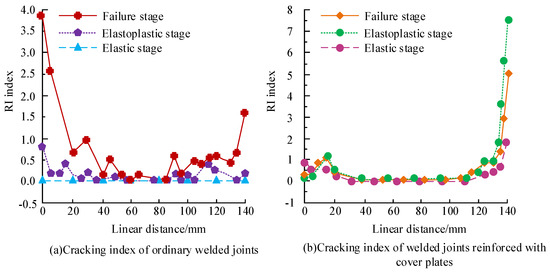
Figure 14.
The cracking index of each node at different stages.
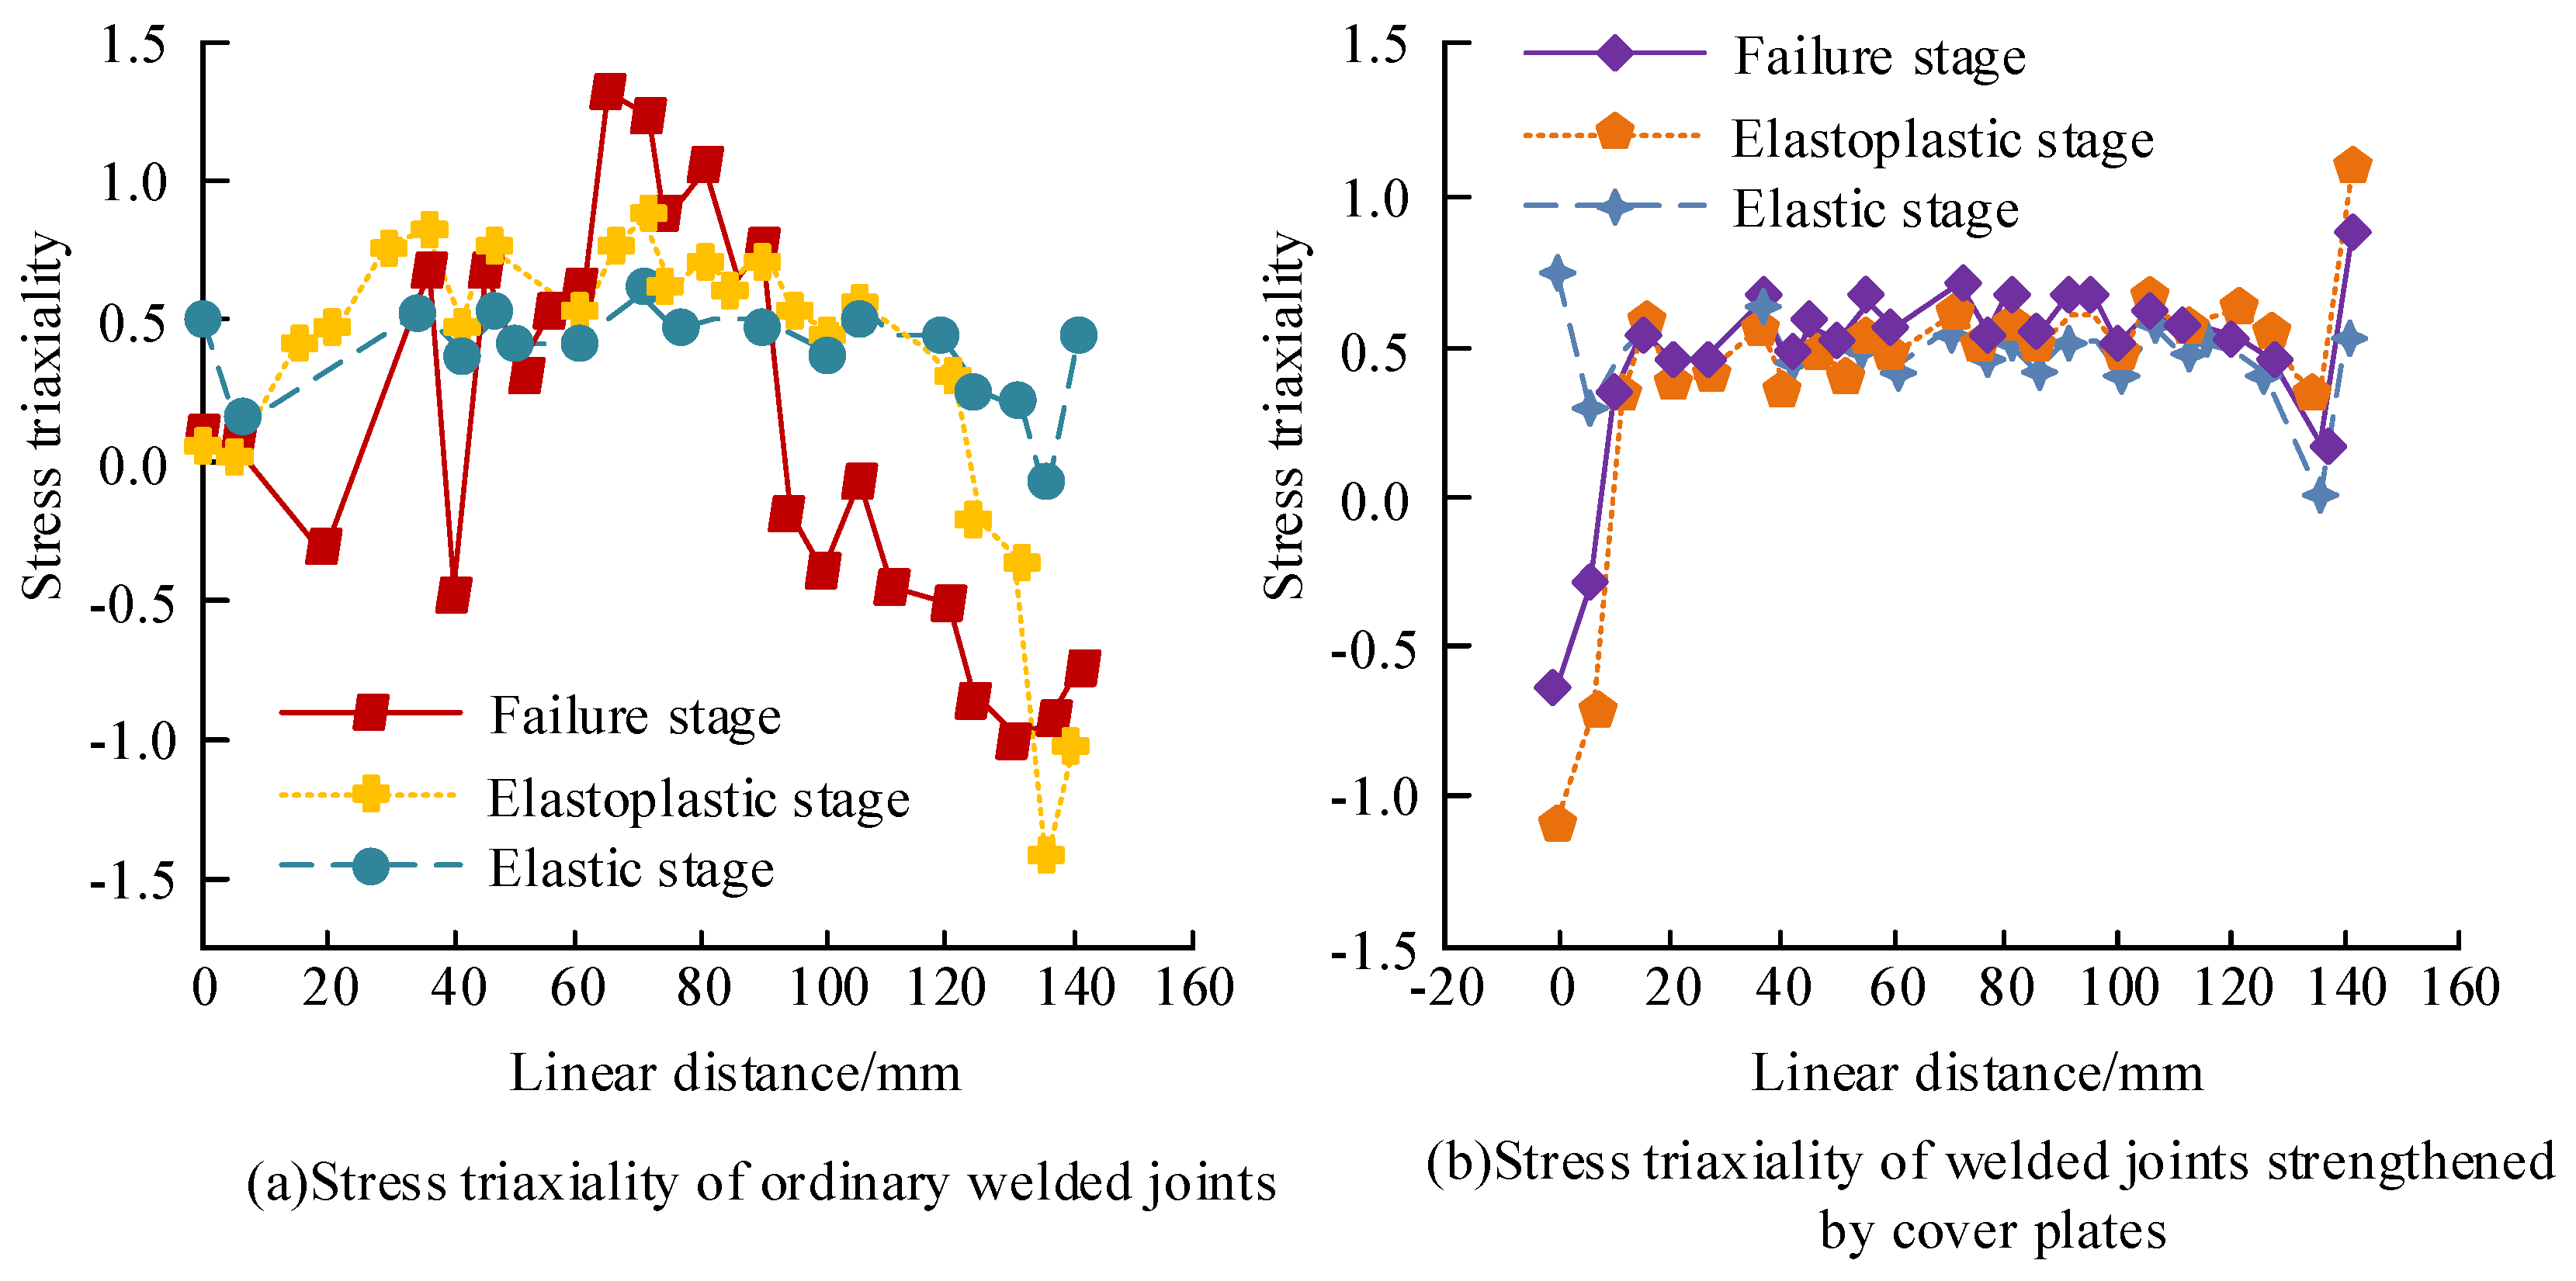
In order to verify the possibility of brittle fracture in welded joint nodes, a comparative analysis was conducted, which considered the stress triaxiality of ordinary welded joints and cover plate-reinforced welded joint nodes, as shown in Figure 15. In Figure 15a, the stress triaxiality of ordinary welded joints in the elastic stage fluctuated within the range of 0.5, and the overall distribution was relatively stable. At a distance of nearly 140 mm in the elastic-plastic stage, a peak value of −1.5 appeared, indicating a higher possibility of brittle fracture at this time. At a distance of 70 mm during the failure stage, a peak of 1.5 appeared, indicating that the middle part of the ordinary welded joint weld was prone to brittle fracture during the failure stage. In Figure 15b, the trends in the three stages of strengthening the welded joint of the cover plate are similar. The stress triaxiality of the three nodes at the middle distance was stable at around 0.5, and a peak stress triaxiality was generated at both ends of the distance. When the distance was 0 mm, the stress triaxiality peaks at the elastic stage, elastic-plastic stage, and failure stage were 0.75, −1.15, and −0.62, respectively. When the distance was 140, they were 0.55, 1.12, and 0.87, respectively. Overall, there was a high possibility that brittle fracture would occur in the middle of ordinary welded joints during the failure stage. In the elastic stage, the stress triaxiality of both types of welded joint nodes was around 0.5, and the overall distribution was relatively stable, showing a three-dimensional tensile state, in which (not severe) fracture was possible. When entering the elastic-plastic and failure stages, the web welds of ordinary welded joint nodes were compressed at both ends and there was tension in the middle. The peak value in the middle of ordinary welded joint nodes was close to 1.5, indicating a high possibility of brittle fracture in this area. However, the equivalent plastic strain index and cracking index were generally of a lower level. Comparison of the stress triaxial analysis of two types of nodes showed the possibility of fracture in the beam-web-weld seam of ordinary nodes was relatively small in the three stages, and the two ends were in a state of three-dimensional compression state at the elastic-plastic and failure stages, when ductile cracking was highly likely to occur.

Figure 15.
Stress triaxiality of each node at different stages.
In order to evaluate the seismic performance of welded joints in BSS, El Centro waves and Tarzana waves, two typical real seismic records, were selected along with one artificially simulated seismic wave were selected for dynamic time history analysis. Dynamic time-history analysis is a widely used seismic performance evaluation method, which can effectively simulate and analyze the dynamic response of building structures under specific seismic waves. When conducting dynamic time-history analysis, the elastic-plastic analysis method was adopted, which involved appropriate amplitude modulation and performing nonlinear analysis, and then inputting seismic waves into the model. In the elastic-plastic analysis stage, the stiffness matrix and damping matrix of the structure exhibited nonlinear characteristics, making this method particularly suitable for simulating and analyzing rare seismic events. The peak acceleration in earthquakes is a key indicator of seismic intensity, and so China’s “Code for Seismic Design of Buildings” sets different peak accelerations for time history analysis, which are based on different seismic intensities and fortification levels. In a condition of fortification intensity of 7 degrees (equivalent to 0.1 g ground acceleration), the maximum acceleration of the model was set to 35 cm/s2. The current “Code for Seismic Design of Buildings” specifies that the limit value of inter-story displacement angle of steel structures in the elastic stage should be at 1/250. In this study, the elastic displacement of welded joint BSS under seismic wave action was compared with the limit values of domestic regulations. In Table 2, the seismic performance of BSS is compared to current relevant regulations. In this table, which shows the action of three different waveforms, the limit values of inter-story displacement angles vary and are all lower than the upper limit of 1/250 required by the specifications. This indicates that the seismic performance of the welded joints in the building steel structure met or even exceeded the requirements of the current Code for Seismic Design of Buildings.
Table 2.
A comparison of the seismic performance of building steel structures and current relevant specifications.
In order to verify the calculation results obtained through FE analysis in this study, FE software was used for simulation and to construct the hysteresis curve of BSS, before a series of control experiments were conducted. In these experiments, two groups were set up: group one, the control group, an unwelded reinforced building steel structure; the second group, the experimental group, was a building steel structure reinforced with welding treatment through cover plates. The hysteresis curves of the experimental group and the control group obtained through simulation are shown in Figure 16. In Figure 16a, the hysteresis curve of the control group shows a typical anti-S shape, which indicates that, after repeated loading, both energy dissipation capacity and seismic resistance were limited. In contrast, the hysteresis curve of the experimental group in Figure 16b resembles a substantial shuttle shape, which attests to better energy dissipation and seismic performance, and indicates the seismic performance of the reinforced welded building steel structure showed a significant improvement, which is consistent with previous calculation results obtained through the FE method by this study, and further verifies the accuracy of the calculation result. The FE analysis method used in this study and the conclusions it provided were reliable, and will be an important point of reference that will add considerable value to efforts to guide the actual seismic reinforcement design of BSS.
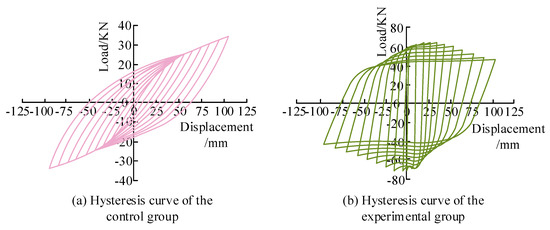
Figure 16.
Comparison of hysteresis curves for the experimental group and control group.
5. Conclusions
In order to analyze the seismic performance of BSS, a FE method was used to construct a stress-strain calculation model for welded joints in BSS. The influence of RS on welded joints in seismic performance was analyzed by using numerical calculation methods, and a numerical simulation of RS in welded joints of BSS based on FE method was studied. The results denoted that the transverse RS peaks of L1 and L2 were 475 MPa and 325 MPa, respectively, and the longitudinal RS peaks were 525 MPa and 425 MPa, respectively. The seismic performance of four different steel structural plates was , and the processing temperature of the four steel structural plates could not exceed 800 °C. Of the four steel structural plates, Q960 had the best seismic performance. When the yield strength was 345 MPa and 960 MPa, the longitudinal RS value increased by 27.78% and 88%, respectively, compared to the transverse RS. When the ordinary welded joint was at the failure stage, the equivalent plastic strain indices of each node at both ends were 3.50 and 5.25, respectively. At a distance of 140 mm, the cracking indices of the reinforced welded joint of the cover plate at the elastic, elastic-plastic, and failure stages were 1.83, 7.52, and 5.04, respectively. The stress triaxiality of ordinary welded joints peaked at −1.5 when the distance was close to 140 mm in the elastic-plastic stage, and peaked at 1.5 when the distance was 70 mm in the failure stage. In summary, the numerical simulation of RS in the seismic performance of welded joints in BSS based on the FE method analyzed the seismic performance indicators of various welded joints. However, the experiment only compared ordinary welded joints and cover plate-reinforced welded joint structures, so the experimental results were not comprehensive enough, and this needs to be addressed by future studies.
Author Contributions
Conceptualization, J.P.; Methodology, J.P.; Software, X.L.; Investigation, J.P.; Data curation, X.L.; Writing—original draft, J.P.; Writing—review & editing, X.L. All authors have read and agreed to the published version of the manuscript.
Funding
This work was partially supported by the National Natural Science Foundation of China (No. 52268047), and was also part of a Yulin High-tech Zone science and technology plan project (No. CXY-2021-27), a Yulin Science and Technology Bureau Industry university research project (No. 2019-101-4), and a Shaanxi Provincial Department of Education special scientific research plan project (No. 17JK0899).
Data Availability Statement
The data presented in this study are available on request from the corresponding author.
Conflicts of Interest
The authors declare no conflict of interest.
References
- Yang, L.; Ye, M.; Huang, Y.; Dong, J. Study on Mechanical Properties of Displacement-Amplified Mild Steel Bar Joint Damper. Iran. J. Sci. Technol. Trans. Civ. Eng. 2023, 1–14. [Google Scholar] [CrossRef]
- Liang, F.; Wang, R.; Pang, Q.; Hu, Z. Design and optimization of press slider with steel-aluminum composite bionic sandwich structure for energy saving. J. Clean. Prod. 2023, 428, 139341. [Google Scholar] [CrossRef]
- Fang, J.X.; Dong, S.Y.; Li, S.B.; Wang, Y.J.; Xu, B.S.; Li, J.; Liu, B.; Jiang, Y.L. Direct laser deposition as repair technology for a low transformation temperature alloy: Microstructure, residual stress, and properties. Mater. Sci. Eng. A 2019, 748, 119–127. [Google Scholar] [CrossRef]
- Zhang, S.; Zhang, S.; Zhou, H.; Paik, K.; Ding, T.; Long, W.; Zhong, S.; He, P. Preparation and characterization of Sn-3.0Ag-0.5Cu nano-solder paste and assessment of the reliability of joints fabricated by microwave hybrid heating. Mater. Charact. 2024, 207, 113512. [Google Scholar] [CrossRef]
- Liu, J.; Xu, J.; Paik, K.; He, P.; Zhang, S. In-situ isothermal aging TEM analysis of a micro Cu/ENIG/Sn solder joint for flexible interconnects. J. Mater. Sci. Technol. 2024, 169, 42–52. [Google Scholar] [CrossRef]
- Jiang, G.; Haiyang, F.; Bo, P.; Renke, K. Recent progress of residual stress measurement methods: A review. Chin. J. Aeronaut. 2021, 34, 54–78. [Google Scholar] [CrossRef]
- Hou, W.; Zhang, D.; Wei, Y.; Guo, J.; Zhang, X. Review on computer aided weld defect detection from radiography images. Appl. Sci. 2020, 10, 1878. [Google Scholar] [CrossRef]
- Zhu, H.; Ge, W.; Liu, Z. Deep learning-based classification of weld surface defects. Appl. Sci. 2019, 9, 3312. [Google Scholar] [CrossRef]
- Shin, S.; Jin, C.; Yu, J.; Rhee, S. Real-time detection of weld defects for automated welding process base on deep neural network. Metals 2020, 10, 389. [Google Scholar] [CrossRef]
- Adin, Ş.; Okumuş, M. Investigation of microstructural and mechanical properties of dissimilar metal weld between AISI 420 and AISI 1018 STEELS. Arab. J. Sci. Eng. 2022, 47, 8341–8350. [Google Scholar] [CrossRef]
- Shah, S.; Patil, S.; Hansen, C.; Odegard, G.; Maiarù, M. Process modeling and characterization of thermoset composites for residual stress prediction. Mech. Adv. Mater. Struct. 2023, 30, 486–497. [Google Scholar] [CrossRef]
- Soori, M.; Asmael, M. Virtual Minimization of Residual Stress and Deflection Error in the Five-Axis Milling of Turbine Blades. J. Mech. Eng. 2021, 67, 235–244. [Google Scholar] [CrossRef]
- Guo, W.; Li, K.; Zhang, H.; Zhu, Y.; Shen, X.; Zhang, L.; Long, W. Low residual stress C/C composite-titanium alloy joints brazed by foam interlayer. Ceram. Int. 2022, 48, 5260–5266. [Google Scholar] [CrossRef]
- Saptaji, K.; Afiqah, S.; Ramdan, R. A review on measurement methods for machining induced residual stress. Indones. J. Comput. Eng. Des. 2019, 1, 106–120. [Google Scholar] [CrossRef]
- Xiong, Y.; Wenhu, W.; Yaoyao, S.; Jiang, R.; Chenwei, S.; Xiaofen, H.; Kunyang, L. Investigation on surface roughness, residual stress and fatigue property of milling in-situ TiB2/7050Al metal matrix composites. Chin. J. Aeronaut. 2021, 34, 451–464. [Google Scholar] [CrossRef]
- Zhang, H.; Ouyang, Z.; Li, L.; Ma, W.; Liu, Y.; Chen, F. Numerical study on welding residual stress distribution of corrugated steel webs. Metals 2022, 12, 1831. [Google Scholar] [CrossRef]
- Tabatabaeian, A.; Ghasemi, A.R.; Shokrieh, M.M.; Marzbanrad, B.; Baraheni, M.; Fotouhi, M. Residual stress in engineering materials: A review. Adv. Eng. Mater. 2022, 24, 2100786. [Google Scholar] [CrossRef]
- Friedrich, N. Experimental investigation on the influence of welding residual stresses on fatigue for two different weld geometries. Fatigue Fract. Eng. Mater. Struct. 2020, 43, 2715–2730. [Google Scholar] [CrossRef]
- Abbasi, M.; Abdollahzadeh, A.; Bagheri, B.; Ostovari Moghaddam, A.; Sharifi, F.; Dadaei, M. Study on the effect of the welding environment on the dynamic recrystallization phenomenon and residual stresses during the friction stir welding process of aluminum alloy. Proc. Inst. Mech. Eng. Part L J. Mater. Des. Appl. 2021, 235, 1809–1826. [Google Scholar] [CrossRef]
- Chen, J.; Chu, J.; Jiang, W.; Yao, B.; Zhou, F.; Wang, Z.; Zhao, P. Experimental and numerical simulation to study the reduction of welding residual stress by ultrasonic impact treatment. Materials 2020, 13, 837. [Google Scholar] [CrossRef]
- Yang, Y.P. Recent advances in the prediction of weld residual stress and distortion—Part 2. Weld. J. 2021, 100, 193–205. [Google Scholar] [CrossRef]
- Sarmast, A.; Schubnell, J.; Farajian, M. Finite element simulation of multi-layer repair welding and experimental investigation of the residual stress fields in steel welded components. Weld. World 2022, 66, 1275–1290. [Google Scholar] [CrossRef]
- Asadi, P.; Alimohammadi, S.; Kohantorabi OSoleymani, A.; Fazli, A. Numerical investigation on the effect of welding speed and heat input on the residual stress of multi-pass TIG welded stainless steel pipe. Proc. Inst. Mech. Eng. Part B J. Eng. Manuf. 2021, 235, 1007–1021. [Google Scholar] [CrossRef]
- Barma, M.; Modibbo, U. Multiobjective mathematical optimization model for municipal solid waste management with economic analysis of reuse/recycling recovered waste materials. J. Comput. Cogn. Eng. 2022, 1, 122–137. [Google Scholar] [CrossRef]
- Maihulla, A.; Yusuf, I.; Bala, S. Reliability and performance analysis of a series-parallel system using Gumbel-Hougaard family copula. J. Comput. Cogn. Eng. 2022, 1, 74–82. [Google Scholar] [CrossRef]
- Pandya, D.; Badgujar, A.; Ghetiya, N. A novel perception toward welding of stainless steel by activated TIG welding: A review. Mater. Manuf. Process. 2021, 36, 877–903. [Google Scholar] [CrossRef]
- Aboueregal, A.E.; Sedighi, H.M. The effect of variable properties and rotation in a visco-thermoelastic orthotropic annular cylinder under the Moore–Gibson–Thompson heat conduction model. Proc. Inst. Mech. Eng. Part L J. Mater. Des. Appl. 2021, 235, 1004–1020. [Google Scholar] [CrossRef]
- Kiran, A.; Li, Y.; Hodek, J.; Brázda, M.; Urbánek, M.; Džugan, J. Heat source modeling and residual stress analysis for metal directed energy deposition additive manufacturing. Materials 2022, 15, 2545. [Google Scholar] [CrossRef]
- Latella, I.; Biehs, S.A.; Ben-Abdallah, P. Smart thermal management with near-field thermal radiation. Opt. Express 2021, 29, 24816–24833. [Google Scholar] [CrossRef] [PubMed]
- Ahmed, F.; Iqbal, M.; Akbar, N.S. Viscous dissipation and Joule heating effects on forced convection power law fluid flow through annular duct. Proc. Inst. Mech. Eng. Part C J. Mech. Eng. Sci. 2021, 235, 5858–5865. [Google Scholar] [CrossRef]
- Lekakh, S.N.; Athavale, V.A.; Bartlett, L.; Godlewski, L.; Li, M. Effect of micro-structural dispersity of SiMo ductile iron on thermal cycling performance. Int. J. Met. 2023, 17, 1451–1466. [Google Scholar] [CrossRef]
- Park, S.; Choi, K.; Lee, C.; Kim, S.; Yoo, Y.; Chang, D. Techno-economic analysis of adiabatic four-stage CO2 methanation process for optimization and evaluation of power-to-gas technology. Int. J. Hydrogen Energy 2021, 46, 21303–21317. [Google Scholar] [CrossRef]
- Ramadan, K.M.; Qisieh, O.; Tlili, I. Thermal creep effects on fluid flow and heat transfer in a microchannel gas cooling. Proc. Inst. Mech. Eng. Part C J. Mech. Eng. Sci. 2022, 236, 5033–5047. [Google Scholar] [CrossRef]
- Li, Y.; Li, Y.; Zhang, C.; Lei, M.; Luo, J.; Guo, X.; Deng, D. Effect of structural restraint caused by the stiffener on welding residual stress and deformation in thick-plate T-joints. J. Mater. Res. Technol. 2022, 21, 3397–3411. [Google Scholar] [CrossRef]
- Sun, Y.; Cheng, Y. Hydrogen permeation and distribution at a high-strength X80 steel weld under stressing conditions and the implication on pipeline failure. Int. J. Hydrogen Energy 2021, 46, 23100–23112. [Google Scholar] [CrossRef]
- Kumar, D.; Idapalapati, S.; Wang, W. Influence of residual stress distribution and microstructural characteristics on fatigue failure mechanism in Ni-based Superalloy. Fatigue Fract. Eng. Mater. Struct. 2021, 44, 1583–1601. [Google Scholar] [CrossRef]
- Zhang, K.; Badreddine, H.; Hfaiedh, N.; Saanouni, K.; Liu, J. Enhanced CDM model accounting of stress triaxiality and Lode angle for ductile damage prediction in metal forming. Int. J. Damage Mech. 2021, 30, 260–282. [Google Scholar] [CrossRef]
- Abdelmoety, A.K.; Kainat, M.; Yoosef-Ghodsi, N.; Li, Y.; Adeeb, S. Strain-based reliability analysis of dented pipelines using a response surface method. J. Pipeline Sci. Eng. 2022, 2, 29–38. [Google Scholar] [CrossRef]
- Seitllari, A.; Boz, I.; Habbouche, J.; Diefenderfer, S.D. Assessment of cracking performance indices of asphalt mixtures at intermediate temperatures. Int. J. Pavement Eng. 2022, 23, 70–79. [Google Scholar] [CrossRef]
- Zhang, C.; Sun, J.; Li, Y.; Deng, D. Numerical simulation of residual stress of butt-welded joint involved in complex column-beam welded structure. J. Manuf. Process. 2022, 83, 458–470. [Google Scholar] [CrossRef]
- Shuyuan, Y.; Xianliang, H.; Haigang, Z.; Lingli, L.; Jiaji, L.; Juan, D.; Xiaoran, F. Coseismic rupture model and stress study of the 2022 Menyuan MW6.7 earthquake. Seism. Geol. 2023, 45, 286–303. [Google Scholar] [CrossRef]


Disclaimer/Publisher’s Note: The statements, opinions and data contained in all publications are solely those of the individual author(s) and contributor(s) and not of MDPI and/or the editor(s). MDPI and/or the editor(s) disclaim responsibility for any injury to people or property resulting from any ideas, methods, instructions or products referred to in the content. |
© 2024 by the authors. Licensee MDPI, Basel, Switzerland. This article is an open access article distributed under the terms and conditions of the Creative Commons Attribution (CC BY) license (https://creativecommons.org/licenses/by/4.0/).