Article

High-Precision Recognition Algorithm for Equipment Defects Based on Mask R-CNN Algorithm Framework in Power System

1
Electric Power Research Institute of Guizhou Power Grid Co., Ltd., Guiyang 550002, China
2
School of Electrical Engineering, Wuhan University, Wuhan 430072, China
*
Authors to whom correspondence should be addressed.
Processes 2024, 12(12), 2940; https://doi.org/10.3390/pr12122940
Submission received: 4 December 2024 / Revised: 17 December 2024 / Accepted: 17 December 2024 / Published: 23 December 2024
(This article belongs to the Section Process Control and Monitoring)

Abstract

:
In current engineering applications, target detection based on power vision neural networks has problems with low accuracy and difficult defect recognition. Thus, this paper proposes a high-precision substation equipment defect recognition algorithm based on the Mask R-CNN algorithm framework to achieve high-precision substation equipment defect monitoring. The effectiveness of the Mask R-CNN algorithm is compared and analyzed in substation equipment defect recognition and the applicability of the Mask R-CNN algorithm in edge computing. According to different types of substation equipment defect characteristics, substation equipment defect recognition guidelines were developed. The guideline helps to calibrate the existing training set and build defect recognition models for substation equipment based on different algorithms. In the end, the system based on a power edge vision neural network was built. The feasibility and accuracy of the algorithm was verified by model training and actual target detection results.

1. Introduction

The stability of substation equipment is crucial for the reliable operation of the power system [1,2]. Traditional inspection methods, which rely on manual observations and engineering experience, suffer from low defect detection efficiency and difficulty in observing certain parts of the equipment [
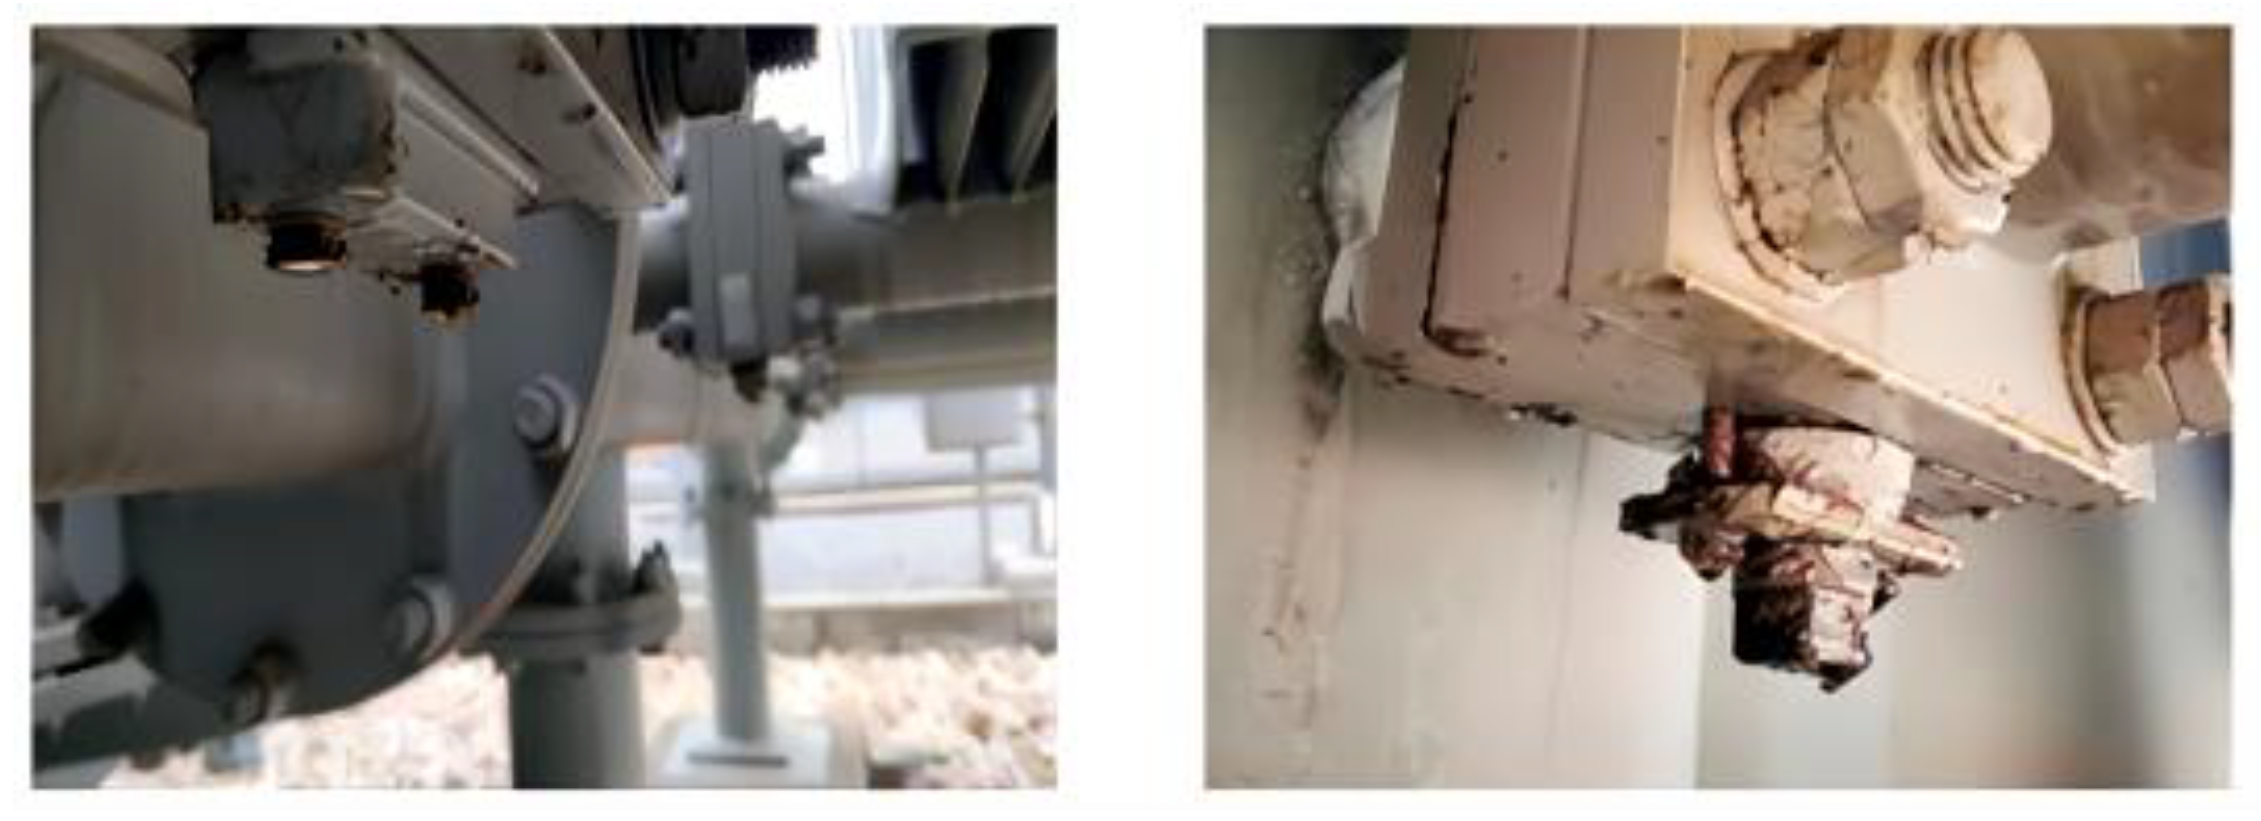
3], such as the transformer oil pillow and the SF6 indicator part of the top fixture. While recent advances in deep learning have led to improved target detection in power system vision neural networks, these methods still struggle with low accuracy and weak anti-interference capabilities [4]. Our research addresses these limitations by proposing a high-precision substation equipment defect recognition algorithm based on the Mask R-CNN algorithm framework. This algorithm incorporates the GFPN network and CBAM attention mechanism module to enhance feature fusion and target recognition, leading to significant improvements in accuracy and robustness over existing methods. The effectiveness of our approach is demonstrated through comprehensive experiments and comparisons with other state-of-the-art object detection algorithms.
A substation is usually equipped with multiple cameras that serve as image-sensing sensors to collect equipment image information and upload it to the cloud [5,6,7]. However, the large number of substation equipment and the requirement for high-resolution images for defect identification often cause the cloud server to be overloaded. Due to the limitation of CPU and GPU computing power [8,9,10], the image recognition algorithm of substation equipment defects needs to be completed by power system edge computing. The method is called power system edge vision and can complete defect recognition of multiple substation images of multiple substation equipment [11]. To meet the requirements of substation equipment defect management and inspection, reference [12] developed an inspection system with dual subsystems. JI Yanping [13] summarizes the shortcomings of substation equipment inspection and proposes an automatic recognition method of substation equipment defects using RFID technology. In reference [14], a PTZ (Pan Tilt Zoom) vision system for substation inspection robots was established. By comparing SIFT, SURF, and ORB features, a vision localization algorithm system with high accuracy is constructed. The authors used the Davidson–Cole model to extract feature parameters to determine the degree of frequency domain aging of transformer oil–paper insulation. To study the application of edge computing in substation systems, ZHAO Yi et al. [15] used edge computing to improve the existing substation monitoring system. The EC-SCADA system established by this method has a fast response time and enhances the intelligent control of substations. Based on the safety control requirements of the components related to substation equipment, Hamze Hajian-Hoseinabadi proposed a system for evaluating the operational reliability of substation equipment. The proposed method selects Birnbaum’s measure to determine substation equipment defects [16]. In the context of the development of smart grids, Matta, N., Rahim-Amoud et al. embed autonomous agents in substation equipment information sensors and use WSAN methods to improve substation monitoring efficiency and safe grid operation [17]. In reference [18], a wireless sensor network is embedded in the smart grid to complete the detection and control of substation equipment, and a multi-agent system is introduced to improve the sending and receiving of information regarding the detection of defects in substation equipment. The method controls substation equipment defects by building an analog substation monitoring laboratory based on SEL751A relay support [19].
For the problems of low edge detection accuracy and the weak anti-interference ability of image recognition, an optimized image recognition method based on a convolutional neural network is proposed in reference [20]. The method uses the SOM network for image information to pre-learn, calculates the learning method with the best accuracy in advance, communicates the results to the initialization layer of the convolutional neural net, and uses the best model for image recognition to improve accuracy. Kang Jie and Yang Gang simulate the edge recognition of images with better precision and denoising capability using the image edge value-weighted, summation, and binary methods [21]. Convolutional neural network image recognition is derived from graph data modeling, but few studies have involved deep learning models [22].
A convolutional neural network with excellent image target recognition performance is essential. Currently, the research focuses on deep learning, convolutional neural network model migration, and modeling of graph convolutional neural networks [23]. The work of image target detection with convolutional neural networks is concentrated on building convolutional operators and pooling operators in the image [24]. With the continuous development of convolutional neural networks, a variety of image detection datasets were generated, and the detection accuracy of computer vision for major targets in images is gradually improving [25]. In 2015, the image classification error rate of the ResNet algorithm was only 3.6%, which is lower than the manual image classification error rate of 5.1% [26,27]. At present, computer image recognition has a variety of semantic segmentation algorithms based on convolutional neural networks, which are important tools that can meet practical production needs.
The substation equipment has a fixed location, a single background, and is a relatively easy-to-train device in the power system visual neural network. However, factors such as substation equipment status, environmental background, acquisition time, and angle will affect the recognition accuracy. Therefore, the algorithm for substation equipment defect recognition should have a high-depth model to complete target equipment feature extraction, image classification, and semantic segmentation in a complex environment. Accurate semantic segmentation and feature fusion capability can accurately identify hidden and small defects in substation equipment. At the same time, the algorithm can filter irrelevant region proposals to improve the overall recognition accuracy of the algorithm. Most of the equipment for collecting image data in substations is fixed cameras.
There is the problem of unbalanced algorithmic features in computer vision detection. The improved GFPN network was obtained in reference [28] by improving the FPN network for global information fusion. This method improves the feature imbalance problem in the Mask R-CNN algorithm and increases the detection accuracy of the algorithm. Compared with semantic segmentation, the precision of instance segmentation is more accurate. Mask R-CNN algorithm is proposed for instance segregation. Instance segmentation not only segments each pixel of the detected target but also segments the pixels of different targets. The Mask R-CNN algorithm classifies the target and anchors the frame with a layer of Mask branches to segment the specific contours of the target into instances. In practical engineering applications, the classification of Mask R-CNN can be changed to the actual required classification to complete the detection of the target in the image. Currently, Mask R-CNN has was applied to 6D modules for stereoscopic recognition of targets [29].
Edge computing is a new computing model that handles downlink data from cloud computing centers and uplink data from edge terminals. The Mask R-CNN algorithm based on improved FPN network architecture should be simplified and compressed for the training model to be engineered in edge terminal devices that can be used for edge computing. The Mask R-CNN algorithm based on the GFPN framework for edge computing should accomplish the compression and acceleration of the model on its basis. For edge smart terminals with relatively poor computing power, lightweight deep learning models are better able to cope with the production needs required for engineering realities.
In the Mask R-CNN algorithm for substation equipment defect detection, the feature map can be simplified in the convolution kernel part by first performing 1 × 1 convolution for the feature layer generated by convolution to better compress the model. Then, the corresponding convolution operation is performed to return the feature values. In this way, the number of operations in the convolution process can be significantly reduced. Zhong Chunrong [30] proposed an algorithmic model-related compression method for edge-oriented computing.
In summary, considering the limitations of traditional substation equipment inspection methods and the deficiencies in target detection of existing power system vision neural networks, this study proposes a high-precision substation equipment defect recognition algorithm based on the Mask R-CNN algorithm framework. By integrating the Global Feature Pyramid Network (GFPN) and the Convolutional Block Attention Module (CBAM), the algorithm significantly enhances the accuracy and robustness of feature fusion and target recognition, offering a distinct advantage over existing methods. Furthermore, in response to the complexity of substation equipment defect recognition, we have optimized the algorithm for edge computing environments and validated its effectiveness through experiments. This paper provides a detailed analysis of the types and characteristics of defects in substation equipment and selects the most suitable algorithm for edge vision. Using the existing image defect dataset, we trained a substation equipment defect recognition model suitable for power system edge vision, enhancing algorithm performance and expanding its application scope in smart grids. This provides new technical means for the intelligent monitoring and management of substation equipment, contributing to the improvement of power grid operational efficiency and safety.

2. Fundamentals and Advanced Concepts

2.1. Generative Adversarial Networks (GANs)

Generative Adversarial Networks (GANs) are powerful generative models designed for generating new data samples that have a similar distribution to the training data. GANs consist of a generator network that creates fake data and a discriminator network that evaluates whether the data comes from the training set or is created by the generator. This adversarial training process pushes both networks to continuously improve thereby generating higher quality data samples.

2.2. Improved FPN (GFPN) Network

The improved FPN (GFPN) network is an advanced feature fusion network used to enhance the feature extraction capabilities within deep learning models. GFPN introduces a global information fusion strategy to mitigate the information flow issues in traditional FPNs. This improvement allows the network to more effectively utilize global contextual information thereby improving performance in object detection and segmentation tasks.

2.3. Mask R-CNN in Edge Computing for Power Systems

Edge computing is a distributed computing paradigm that brings computation, storage, and network services closer to the data sources or users. In power system monitoring, edge computing reduces latency by processing data locally, which is crucial for real-time monitoring and defect recognition. The application of Mask R-CNN in edge computing involves simplifying and compressing the model to enable it to run on resource-constrained edge devices while maintaining high-precision. This approach not only optimizes computational efficiency but also expands the application scope of Mask R-CNN in smart grids and substation automation.

3. Mask R-CNN Algorithm Improvement

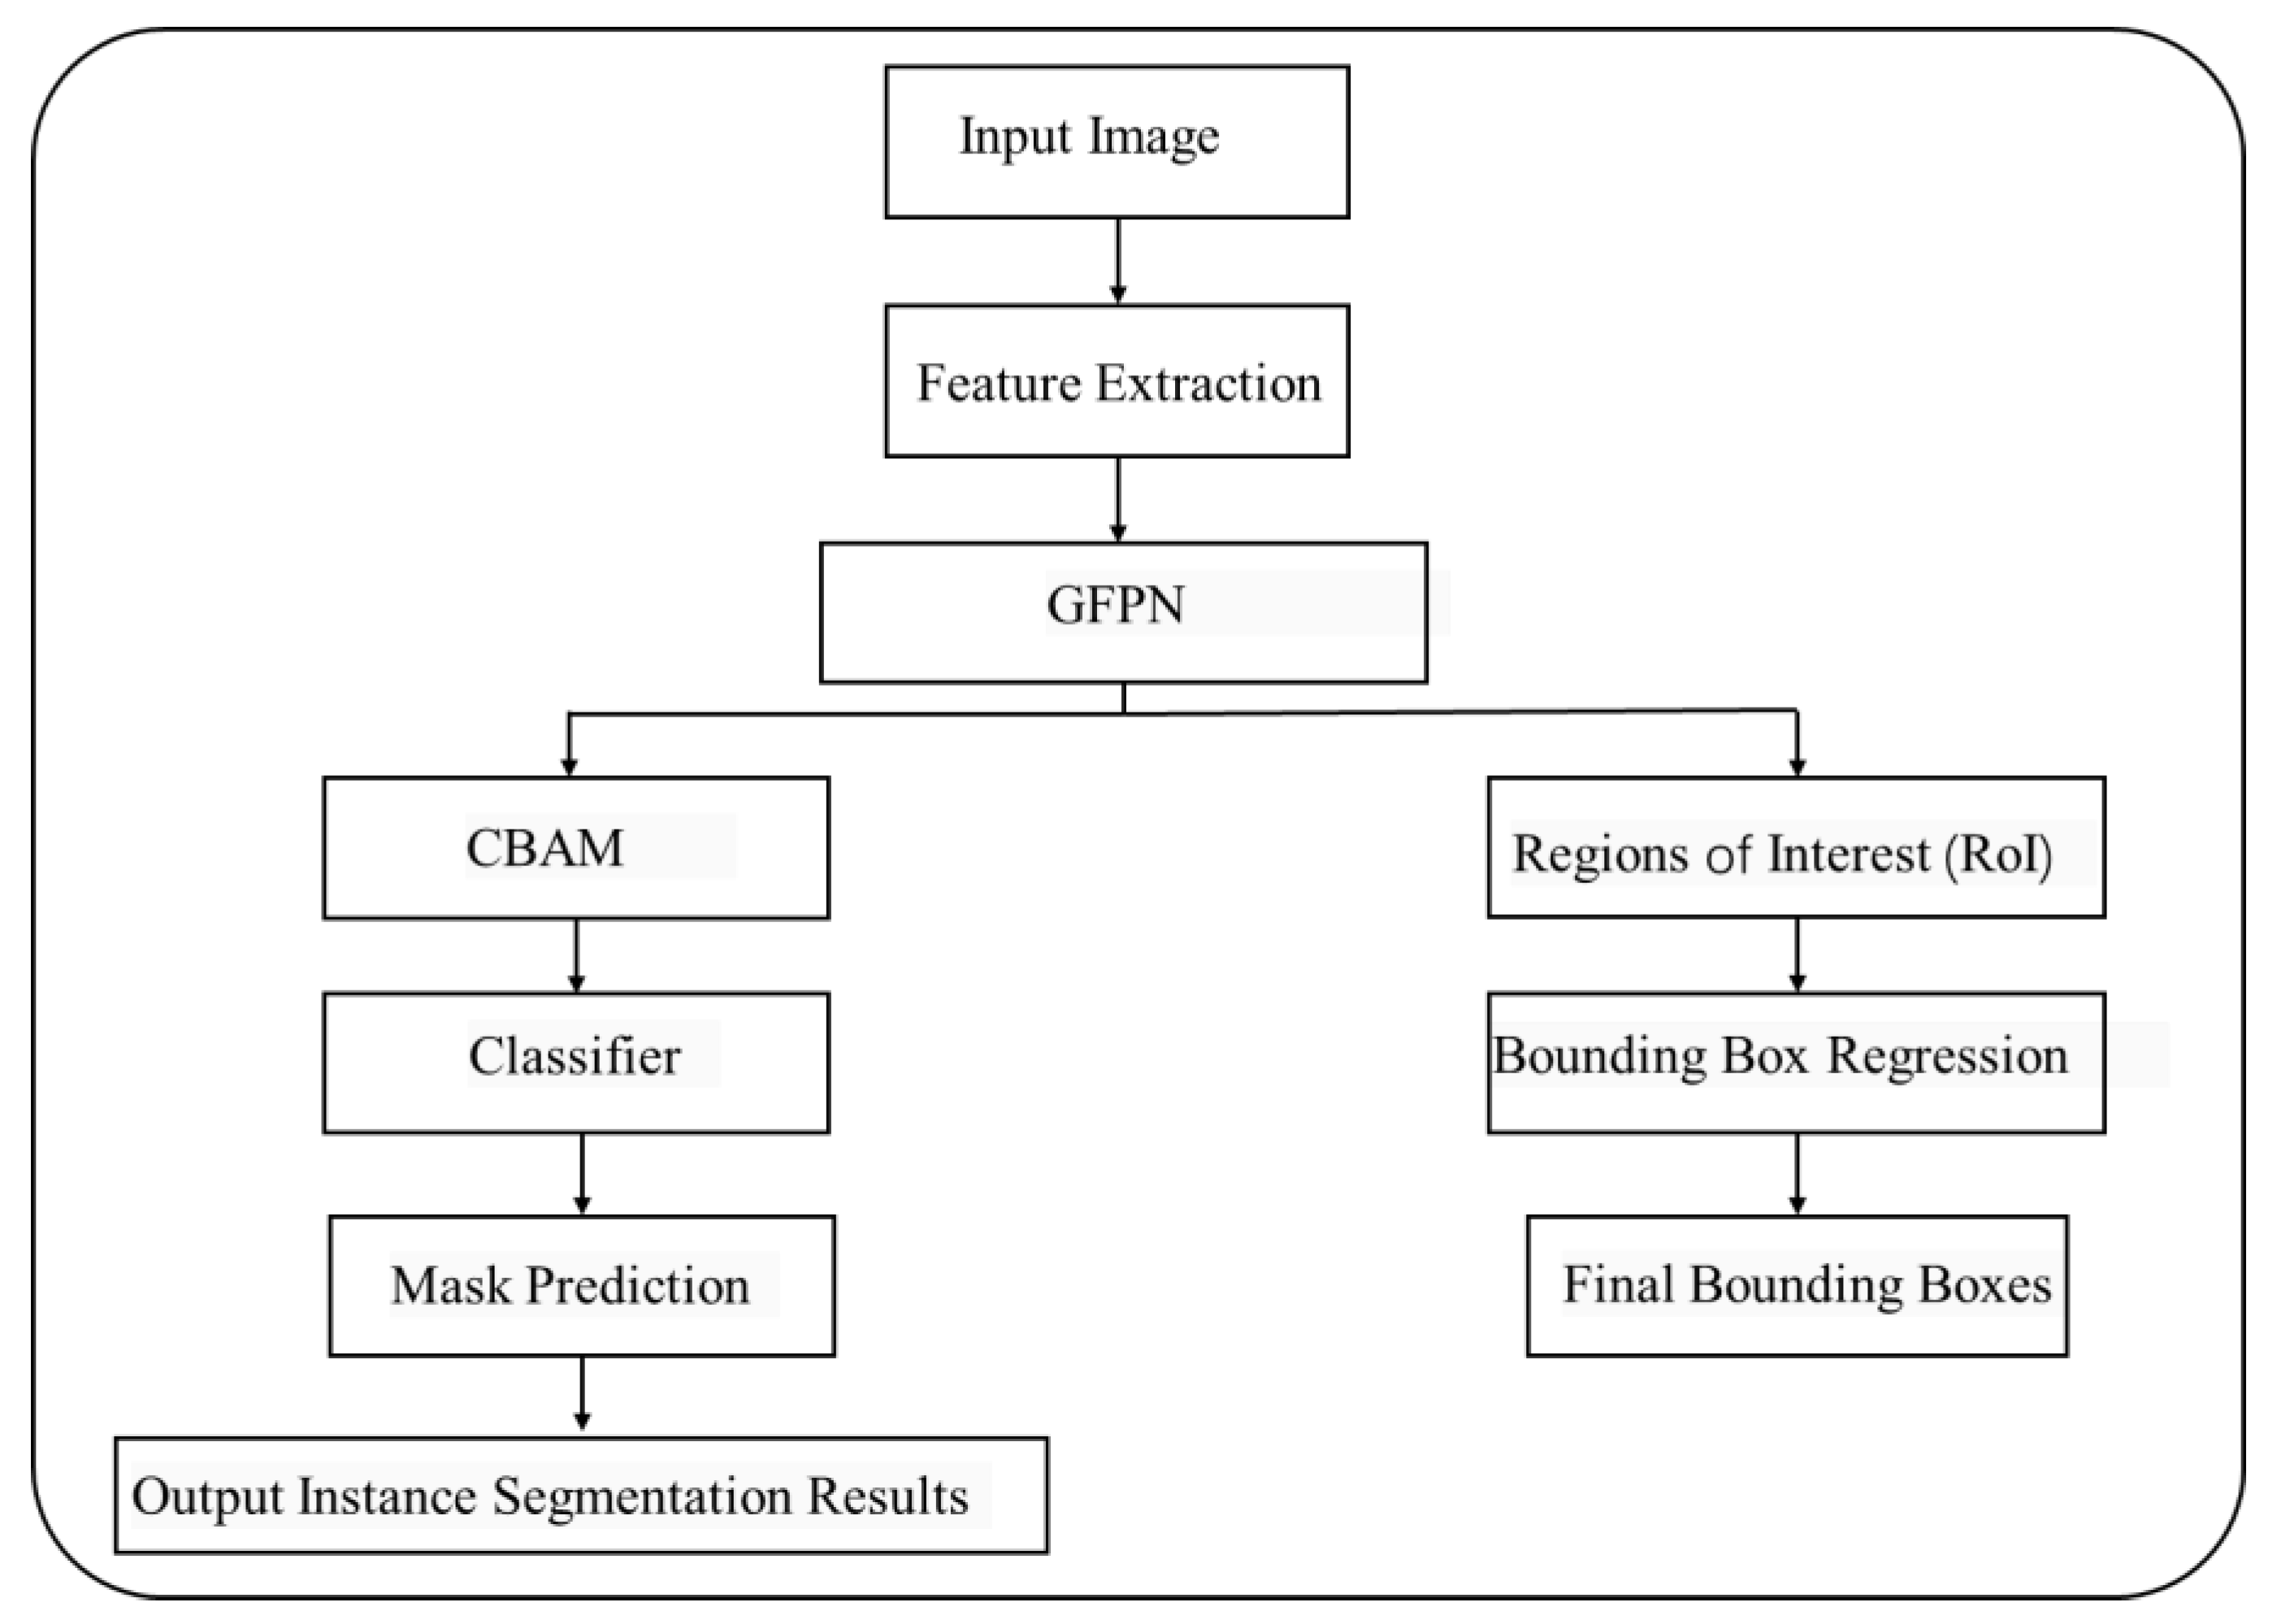
This section offers a comprehensive dissection of the algorithmic architecture for substation equipment defect recognition as proposed in this study. Tailored to accurately detect defects in substation equipment from imagery, the algorithm is introduced through a flowchart illustrating the procedural steps from the ingestion of substation equipment images to the delivery of defect segmentation outcomes. The flowchart elucidates the algorithm’s logical framework, with particular emphasis on GFPN and CBAM, two integral components critical for bolstering the model’s feature integration and robustness within intricate scenarios (Figure 1).
The flowchart outlines the sequential operations of the algorithm, beginning with the input of substation equipment images, proceeding through a feature extraction phase to capture the image’s essential features. The GFPN network then augments these features, refining the representation of features for defects across various scales. The CBAM further refines the feature maps, enhancing the representation of pivotal features while mitigating the impact of less significant ones thus improving the model’s recognition accuracy. Through the stages of classification, bounding box regression, and mask prediction, the algorithm adeptly produces instance segmentation results for each defect area. The architecture of this process not only enhances the algorithm’s precision in defect recognition but also amplifies its practical utility in the maintenance of substation equipment.

3.1. Algorithm Combination Selection

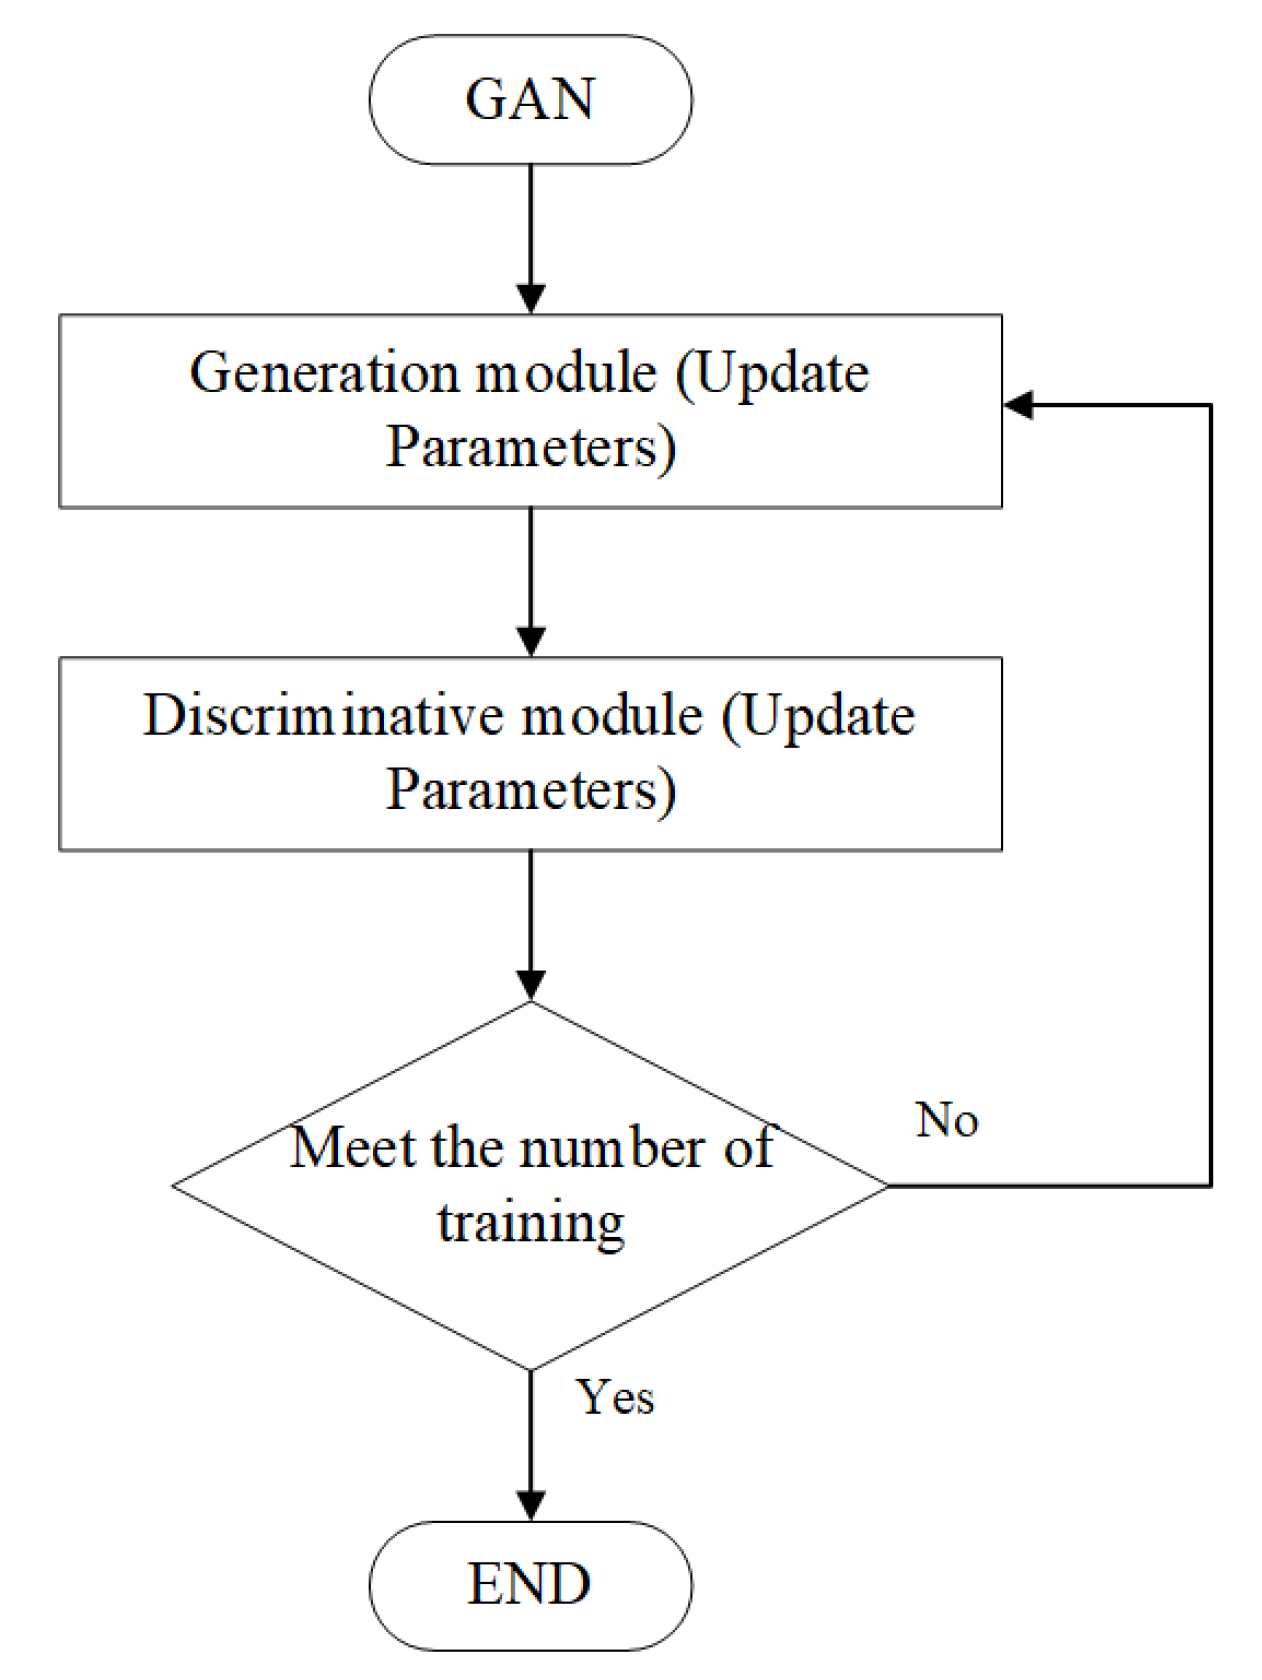
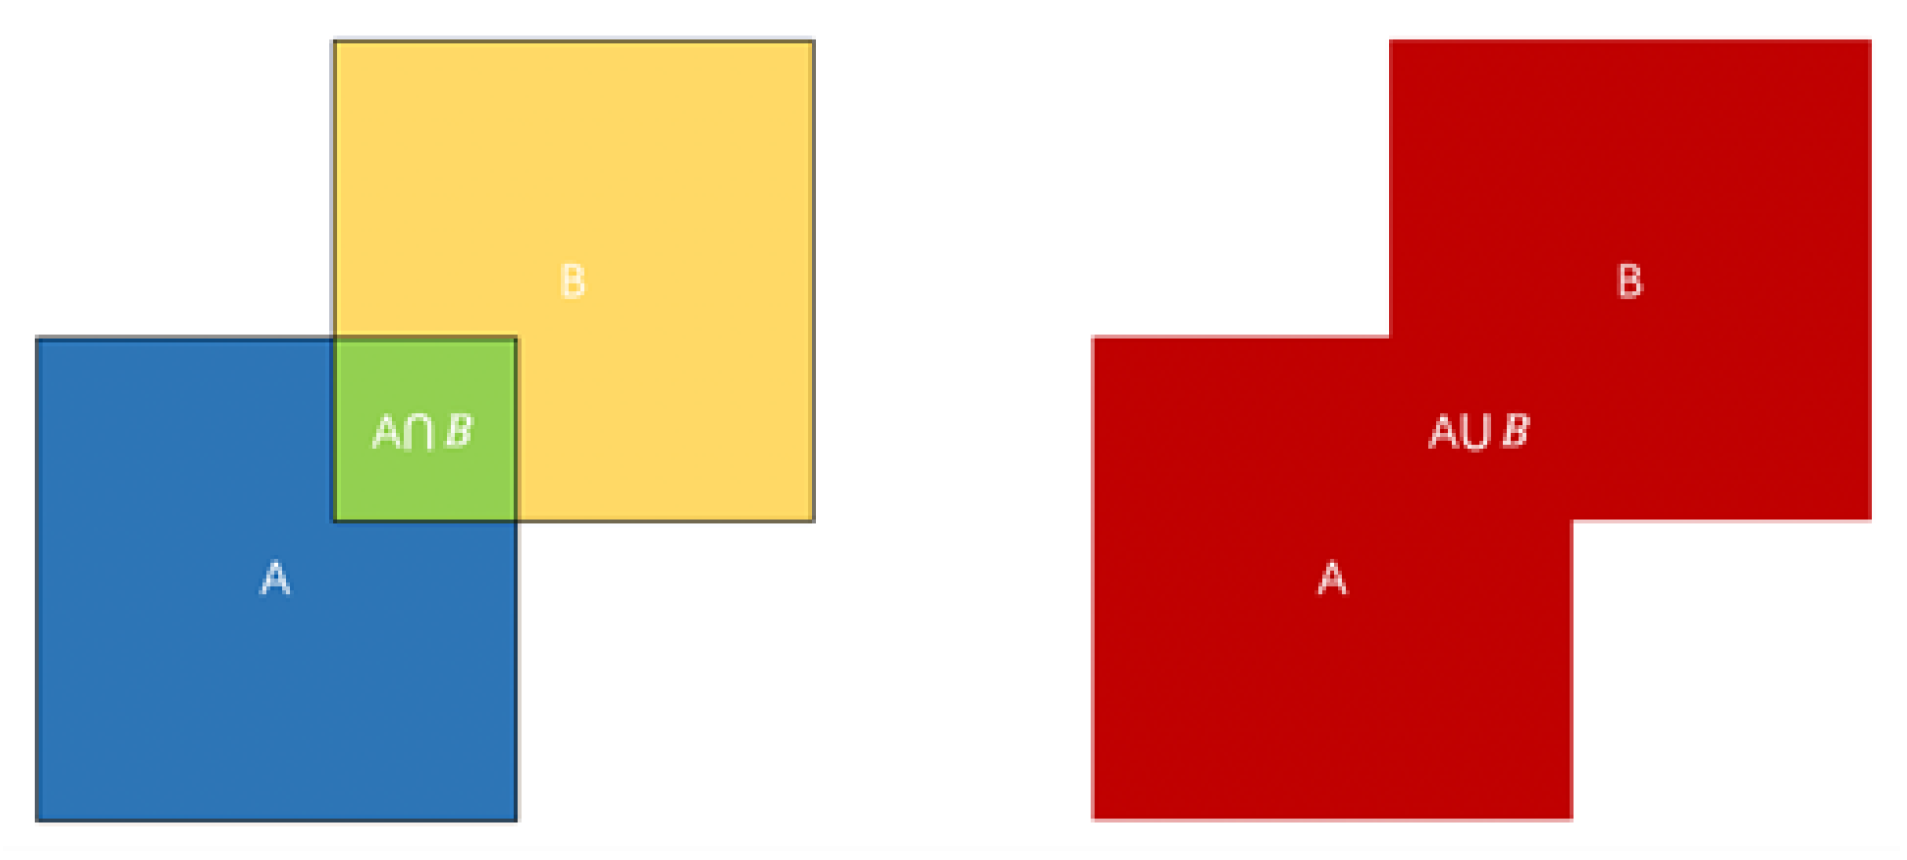
In this study, we have adopted a combination of Mask R-CNN and GAN to enhance the accuracy and robustness of substation equipment defect recognition. The reason for choosing this combination is based on an in-depth understanding of the characteristics of these two algorithms and their complementary advantages in object detection and image generation. Mask R-CNN is an advanced instance segmentation model that generates candidate regions by applying a Region Proposal Network (RPN) on feature maps, followed by precise pixel-level segmentation using ROI Align. This method can provide accurate bounding boxes and masks when dealing with substation equipment defect recognition, effectively identifying and locating defects.
However, the performance of Mask R-CNN largely depends on high-quality annotated data. In practical applications, obtaining sufficient defect samples is challenging because defect events are relatively rare. To address this issue, we introduced GAN to generate a more diverse range of defect samples. GAN consists of a generator and a discriminator, with the generator responsible for producing realistic defect images, and the discriminator assessing the authenticity of these images. Through this adversarial training, the generator can produce high-quality synthetic defect images, which increase the diversity and quantity of the dataset during training thereby enhancing the model’s generalization capabilities.

3.2. GPN Network

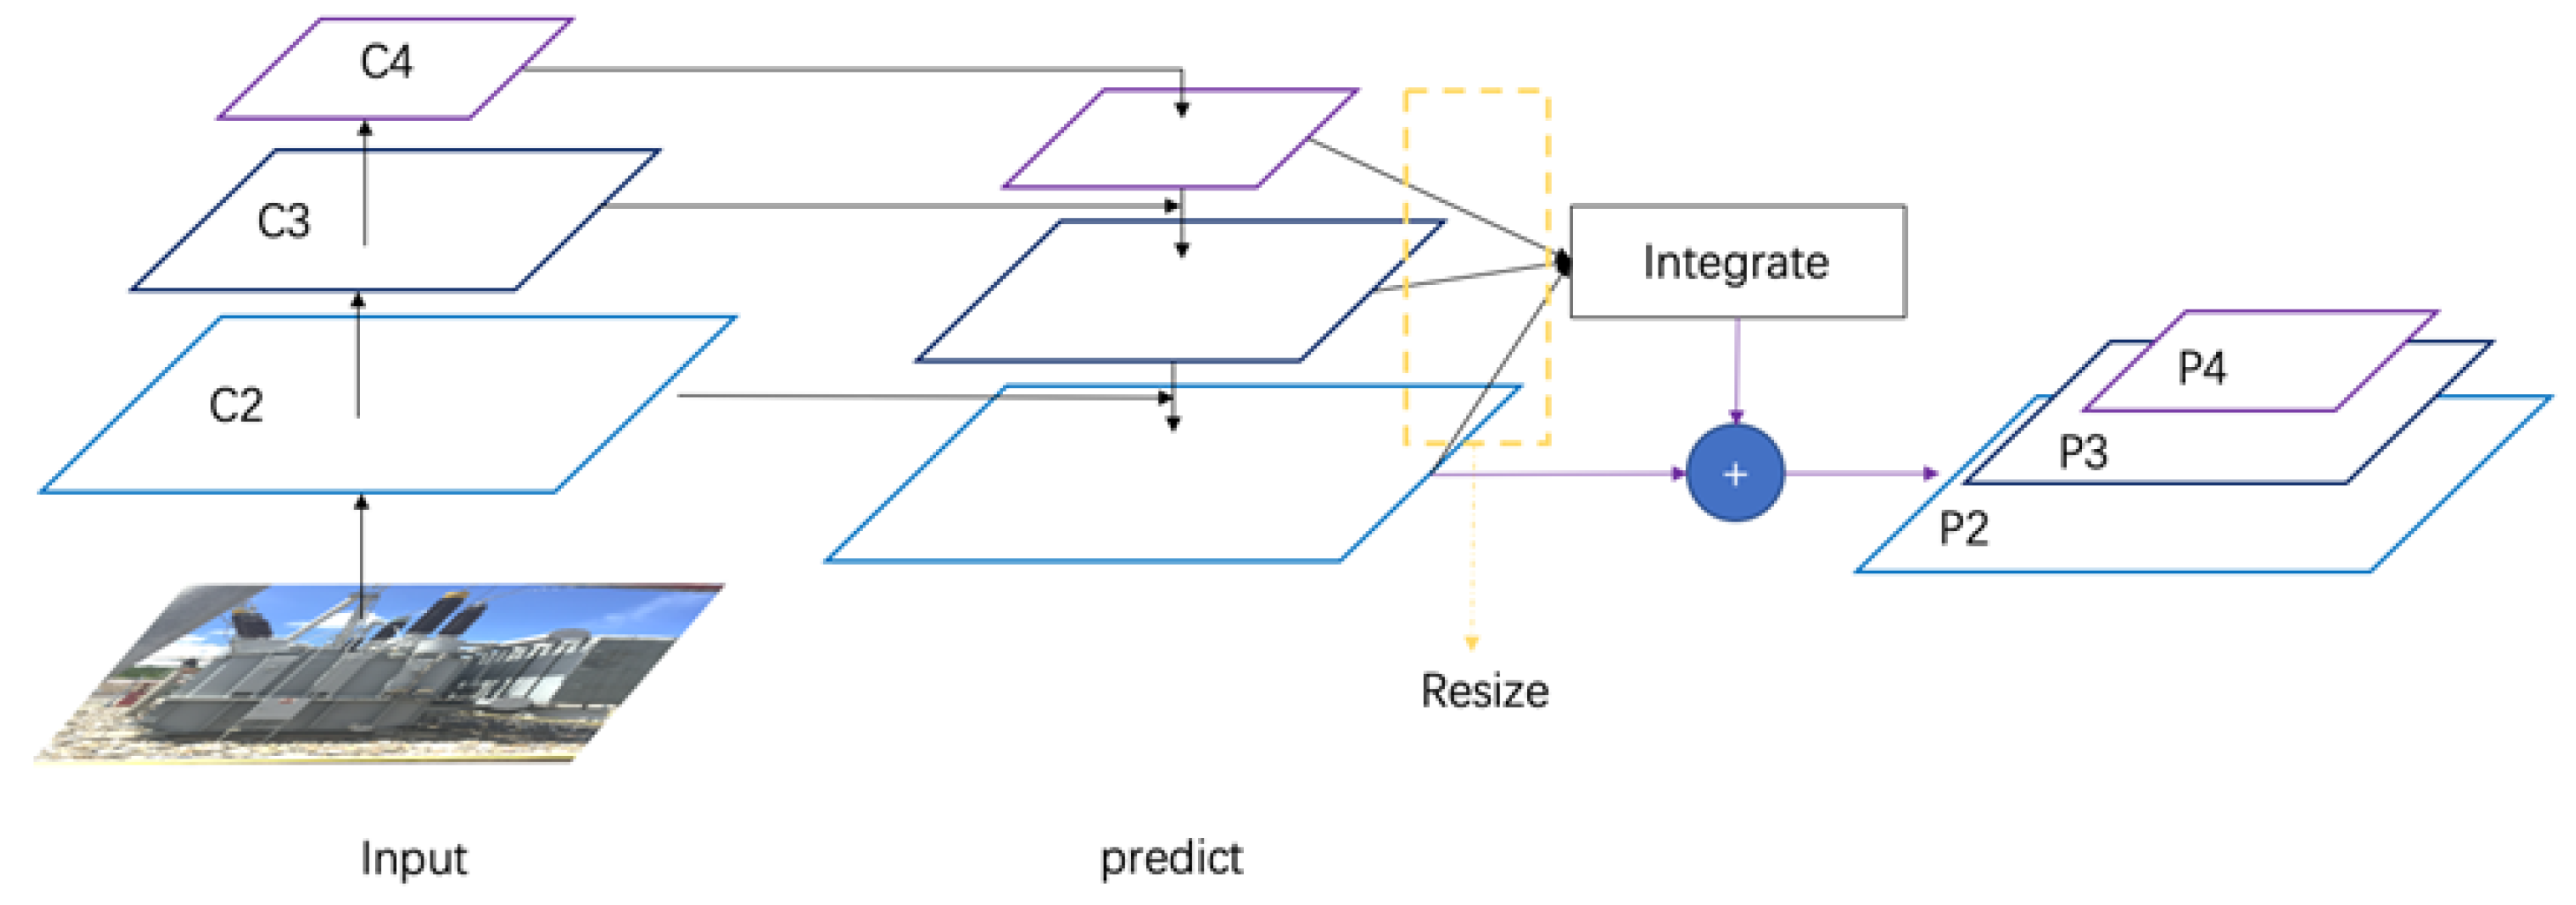
The classification capability of the Mask R-CNN algorithm is based on Mask Prediction. Unlike the Fast R-CNN algorithm and the Faster R-CNN algorithm, which use the RoI Pooling operation, the RoI Align method in the Mask R-CNN algorithm involves a bilinear interpolation problem. The FPN network uses a lateral connection approach in which only a single layer is connected between the P-layer and C-layer in the network and the information of adjacent layers cannot be effectively fused. For the improved FPN network, the image is rescaled after the upsampling operation is completed, and the rescaled image is placed into the upsampled image for fusion. The improved FPN network (GFPN) architecture is shown in Figure 2.
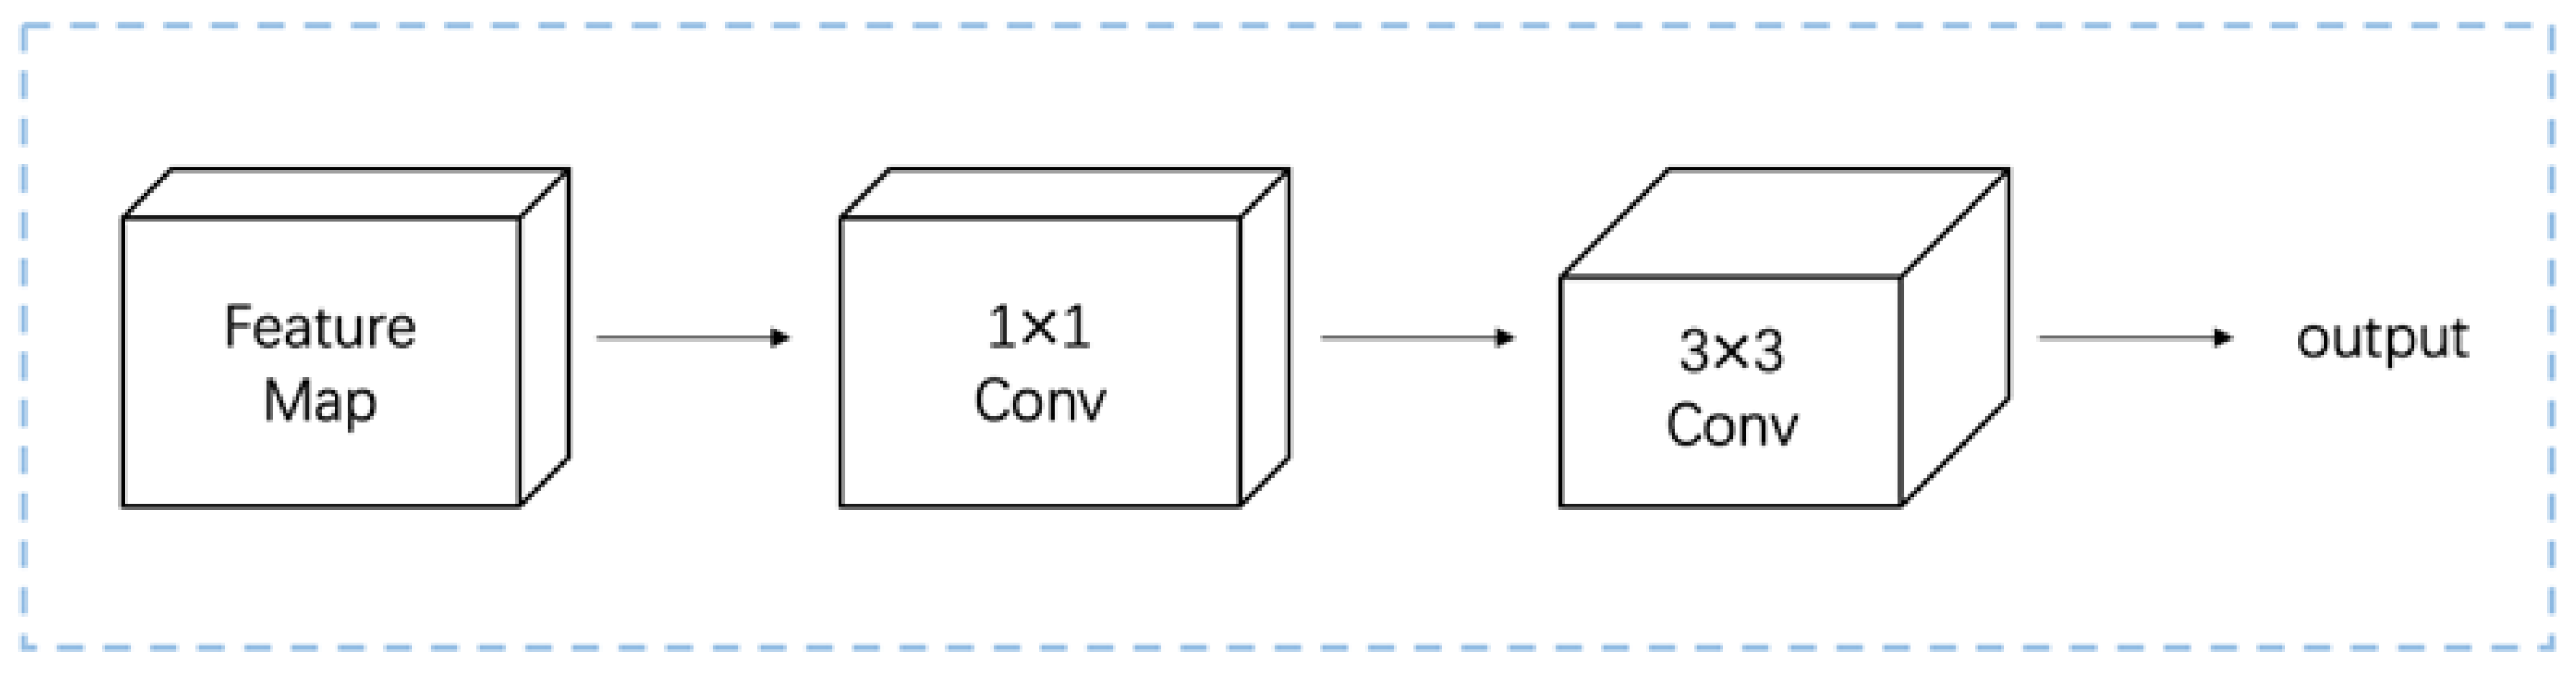
The fusion module is simply a 1 × 1 convolution followed by a 3 × 3 convolution operation. The main function of 1 × 1 convolution is to reduce the image channels for dimensionality reduction output. In addition, the main role of 3 × 3 convolution is to preserve the original target feature information and prevent the problem of feature mixing in high dimensions. The fusion module is shown in Figure 3. The algorithm in the GFPN network rescales the feature map after module fusion to complete the retention of semantic information.

3.3. CBAM Attention Mechanism Module

The Convolutional Block Attention Module (CBAM) was integrated into the feature processing phase of the Mask R-CNN to enhance the activation of channel and spatial attention mechanisms for different regions within the imagery thereby reinforcing the learning of target features. The CBAM is a hybrid attention architecture that combines the benefits of both channel and spatial attention, designed to bolster the network’s sensitivity to salient features while concurrently reducing computational complexity. This leads to a marked enhancement in the performance of the neural network. As depicted in Figure 4, the CBAM bifurcates the input feature map into two distinct pathways, each dedicated to processing either channel or spatial attention, before merging these processed outputs with the original feature map. The CBAM’s modular design allows for its flexible integration at any point within the network without altering the dimensionality of the feature maps. This “plug-and-play” capability renders the CBAM an effective tool for network performance augmentation, particularly suited for high-dimensional data and complex tasks. Through its comprehensive attention mechanism, the CBAM not only elevates the model’s capacity to discern critical features but also streamlines computational efficiency and bolsters the model’s robustness.
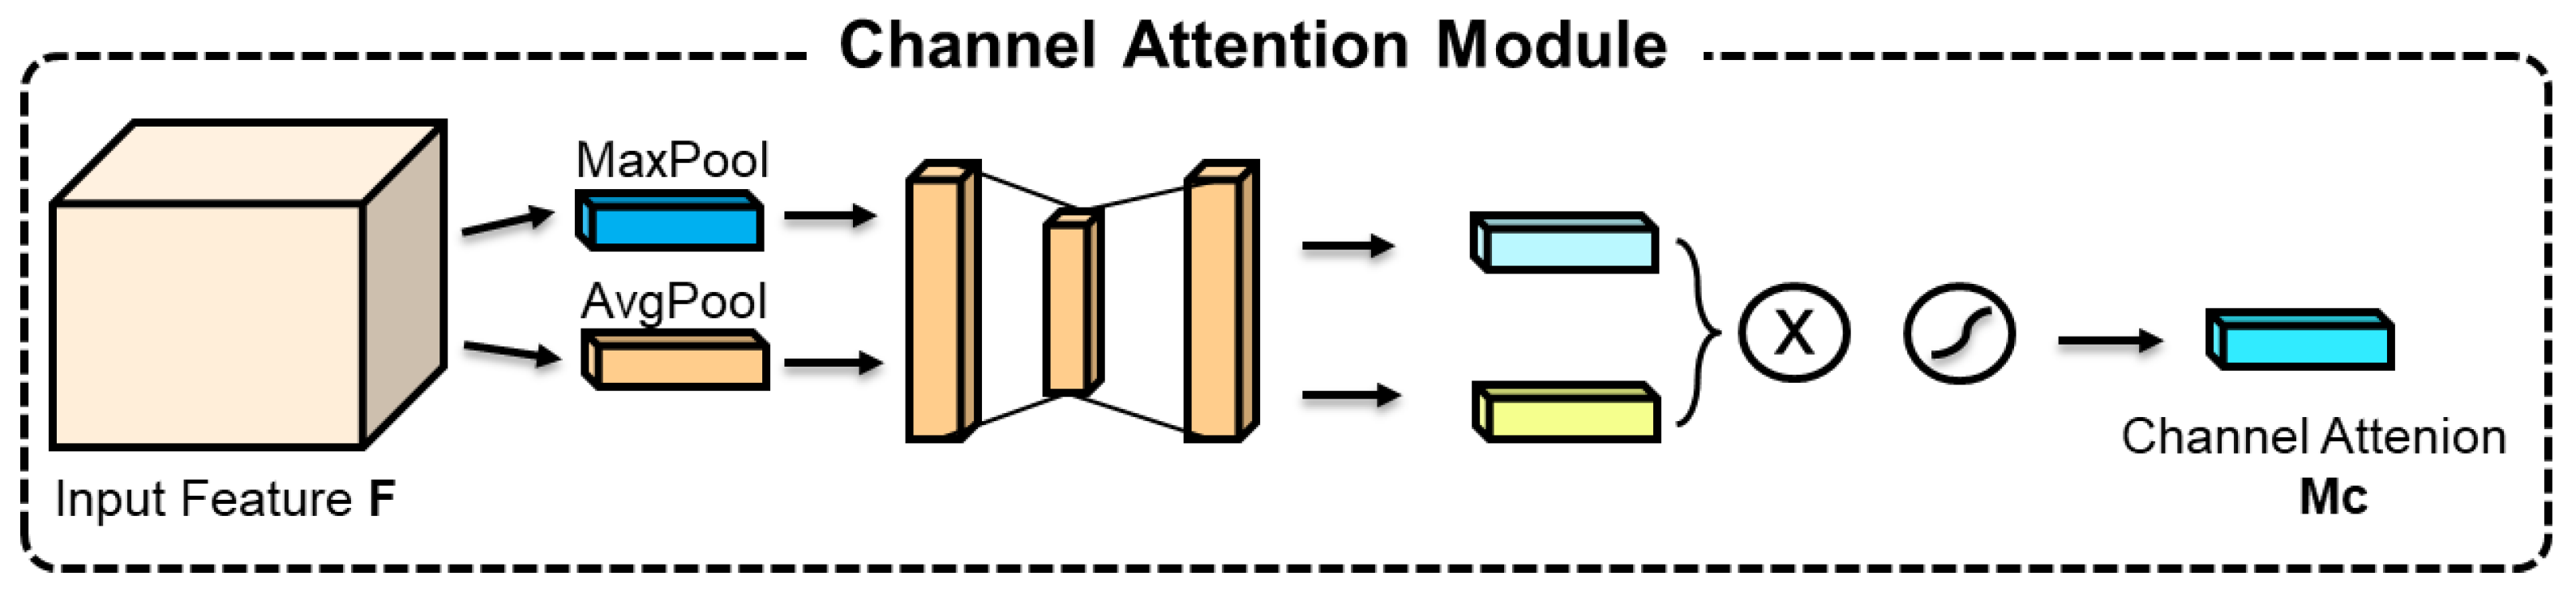
As illustrated in Figure 5, the channel attention sub-module employs parallel max-pooling and average-pooling operations to extract both key and holistic information from the feature maps. These pooled results are subsequently processed by a multi-layer perceptron (MLP) to generate channel attention weights, which are then compressed to a range between 0 and 1 using a sigmoid function. These weights are applied to the input feature map’s channels, enabling the network to focus more intently on pertinent features thereby increasing the utilization rate of valuable information and providing a more refined feature representation for subsequent tasks.
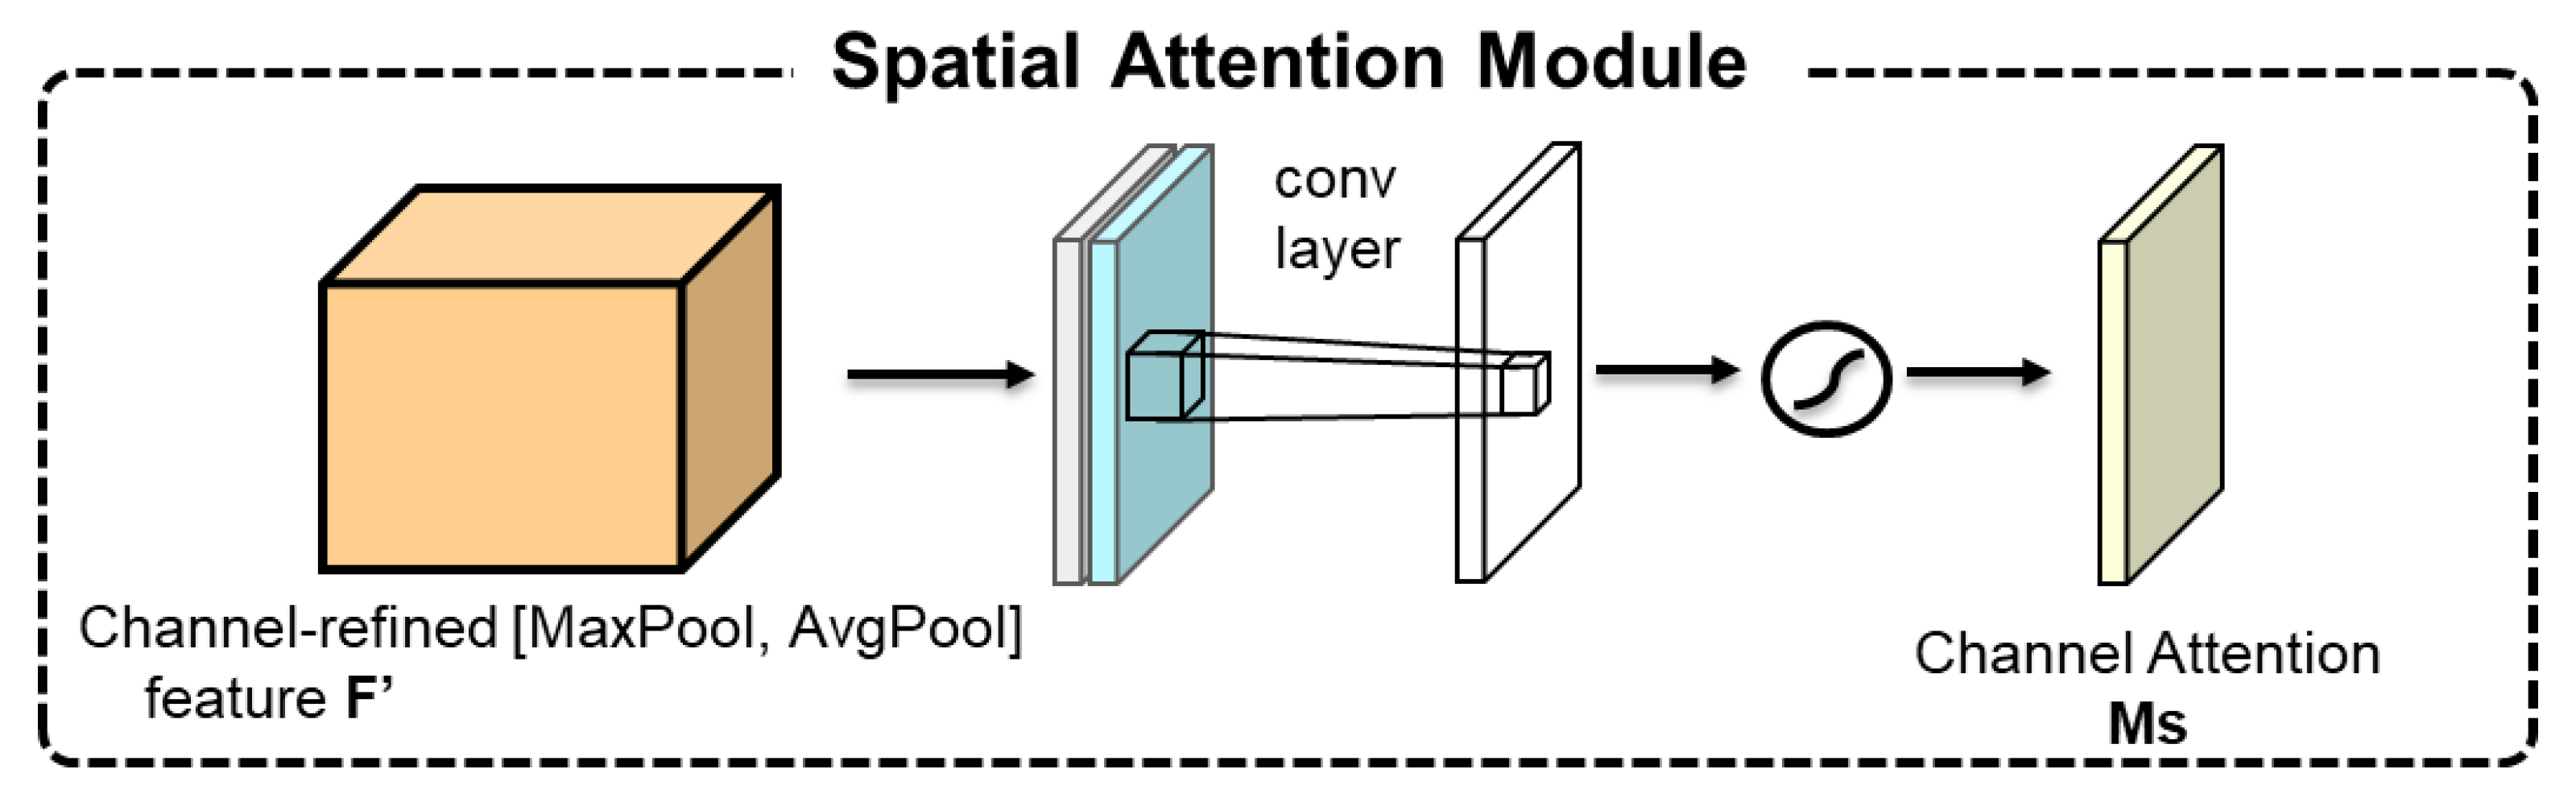
The spatial attention sub-module, as shown in Figure 6, initiates by conducting channel-wise max-pooling and average-pooling on the input feature map to capture both local and global information. After concatenating these pooled results, a convolutional operation reduces the dimensionality to a single channel, creating a compact feature representation. A sigmoid function is then applied to produce an attention weight map that ranges from 0 to 1, signifying the spatial importance of each pixel. This design emphasizes the regions of interest to the network while suppressing less relevant areas thereby enhancing the model’s responsiveness to critical areas and strengthening the spatial information representation within the feature maps, enabling the model to more effectively process complex scenes.

3.4. Mask R-CNN for Edge Computing

3.4.1. CNN Layer Weight Pruning

In the process of the Mask R-CNN algorithm based on the GFPN framework, compression should mainly focus on the CNN part. The simplification of the convolutional neural network should be pruned according to the network features, and the parts of the network whose weights are more redundant or relatively unimportant should be selected for pruning. The whole CNN is pruned, as shown in Figure 7.
In order to avoid the loss of algorithmic network accuracy due to weight pruning, the pruning process should satisfy Equation (1).
m i n Δ = m i n W ρ E D | f , W ρ E D | f , W
where W is the fully connected layer weight; D is the deep learning training set; E denotes the loss function; Wρ is the pruned weight, and is the loss function distance. The simplified model is obtained by filtering the pruned weight neurons by Equation (1) to improve the computational speed with guaranteed accuracy and efficiency. This method can ensure the capability of the Mask R-CNN algorithm in target detection while reducing the redundancy of the fully connected layer.

3.4.2. Weight Parameter Sharing

The fully connected layers are divided into two cases: an equal and unequal number of neurons in the input and output layers. In the case of an equal number of neurons, the usual approach is to construct a circulant matrix. The construction of a circulant matrix of weights requires a phase shift in the weights connected between neurons. The circulant matrix of the weights is an important way of sharing weight parameters. The number of neurons in the output layer of the fully connected layer in the Mask R-CNN algorithm is usually different from the number of neurons in the input layer. Therefore, the sharing of the weight parameters needs to take the Toeplitz matrix to plan the weights. The Toeplitz matrix is planned by taking the same value of the weights from the top left to the bottom right, and then recursively completing the matrix planning with adjacent rows.
The convolutional kernel operation of convolutional neural networks in the convolution process can also be weight-sharing. For a convolution kernel of dimension m × n × h × w (where m is the number of input feature layers, n is the number of output layers, h is the height of the convolution kernel, and w is the width of the convolution kernel), the convolution kernel is cyclically shifted along the w direction from the input section, and its compression multiplier satisfies Equation (2).
M = m × n × h × w + m m × h × w + m
This method of reducing the number of network parameters by the cyclic shifting of convolution kernels has a larger compression multiplier. Meanwhile, there is less impact on the recognition accuracy of the network.

3.5. Accuracy Analysis After Network Improvement

The IoU threshold is a judgment criterion in deep vision. The IoU threshold ranks the Softmax outputs for the same object classification from largest to smallest, erases the Softmax output below the confidence threshold to zero, and then divides the intersection of the two values by the union to obtain the IoU threshold. The average precision is as follows:
P r e c i s i o n = T P T P + F P
where TP (True Positive) indicates a true case positive sample and FP (False Positive) indicates a false case positive sample.

4. Defect Recognition for Substations Based on Improved Mask R-CNN

4.1. Image Dataset

4.1.1. Substation Equipment Dataset

A sample dataset of substation equipment needs to be completed in advance before substation equipment defect recognition. A substation equipment dataset was collected by our team through on-site photography at various substations in a certain province of China. The images were captured under different weather conditions and times of day to ensure a diverse and representative dataset. Each image was then annotated using LabelImg, a widely used tool for object annotation in images. The annotation process involved marking the regions of interest, such as specific equipment parts and defect types, with corresponding labels. This dataset serves as a valuable resource for training and evaluating our defect recognition models, providing a comprehensive view of the typical and atypical conditions of substation equipment. The labeling in this paper was all carried out using LabelImg. The main labels are shown in Table 1.

4.1.2. Defect Dataset for Substation Equipment

Substation equipment defects can be categorized into appearance defects and heat defects. Heat defects are primarily identified through infrared thermograms, which provide a thermal image that reveals heat-related issues such as hot spots or uneven temperature distribution across different phases of the equipment. These heat defects are ascertained by referencing the operating temperature ranges for substation equipment and by assessing the three-phase thermal imbalances. Appearance defects encompass a variety of issues, with oil leakage, damage to porcelain insulators, and physical damage to the equipment casing being the most frequently occurring. Our dataset includes both infrared and video imagery to capture these defects comprehensively. Infrared imagery is crucial for detecting heat defects, as it can pinpoint areas of abnormal heat that may indicate underlying issues, while video imagery is instrumental in documenting the dynamic operation and capturing appearance defects that are visible during the equipment’s operation.
  • Heat defects
Differences in the settings of parameters such as the upper and lower limits of the infrared thermometer, the temperature core point, and the distance measured lead to problems with inconsistent color pixel characteristics of the thermal imaging map from the same device. For this reason, this paper is based on the three-phase heating imbalance temperature difference in more than 15 °C or the normal operating temperature exceeds 80 °C as a criterion for defective labeling. The heat defect infrared diagram is shown in Figure 8.
The temperature at the joint in Figure 8a is 44.8 °C. The temperature at the joint in Figure 8a compared to the temperature at the joint in Figure 8b,c for phases B and C, has a difference of over 15 °C. The results meet the criteria, are judged to be heat defects, and are stored in the heat defect set. The heat defects found in the infrared map are stored as heat defect training sets.
2.
Appearance defects
Appearance defects belong to the category of classifiable defects, in general, image recognition. Appearance defects are usually followed by large safety hazards. If the substation switch does not open and close in place, it will seriously endanger the personal safety of the substation operation and maintenance personnel, causing major accidents. Figure 9 shows the defect of oil leakage in the substation.

4.1.3. Generative Adversarial Networks

Generative Adversarial Networks (GANs) include generation and discrimination modules to solve the problem of insufficient number of sample defect maps for substation equipment. GANs can generate multiple sample tasks based on existing image data to build a sample set of substation equipment defect maps. The essence of GANs is to play adversarial games based on existing dataset images. The principle is to generate a new image dataset from an existing image dataset by rotating, flipping, stretching, etc. There is a risk that the GAN generates new image datasets that do not match the real production reality. Although the generated sample dataset is increased, the color and contour characteristics of the sample do not reach the actual value.
The training process of GANs is without human intervention. Its generation module can generate new images based on the existing substation defect image data. The discriminator module can discriminate between the generated new image and the original real image, which is a dichotomous module. The GAN’s objective function is shown in Equation (4).
m i n G m a x D V D , G = E x p l o g D x + E z p l o g 1 D G z
where D represents the discriminative network; G represents the generative network; and x and z represent the pixel points. The overall computational goal of the GAN is to find the maximum value of the discriminative network and the minimum value of the generative network. It obtains the generated sample set in the process of continuous optimization. The flowchart of the GAN is shown in Figure 10.

4.1.4. Algorithm Result Recognition Criterion

According to the results of identifying substation equipment defects by a Mask R-CNN algorithm based on the GFPN framework, the recognition process is divided into two steps.
(1)
We use the substation equipment recognition model to recognize images of substation equipment in daily operation, and use its Softmax probability output as a binary criterion to initially determine whether the equipment is faulty.
(2)
The faulty images are placed into the defect sample dataset for deeper training of the model to further improve the defect recognition capability. Table 2 shows the classification of the defective criteria.
In this paper, the defined threshold ρ and the defect criterion δ are introduced as the defect criterion of substation equipment. When δ is less than ρ, it is determined that the substation equipment is free of defects and belongs to the normal operating condition. When δ is greater than ρ, the defect is determined and belongs to the fault state, and the fault image is placed into the sample dataset of substation equipment defects for model training.
δ = P 0 P s
where δ indicates the value of the defect criterion, P0 indicates the Softmax output value of the image being detected, and Ps indicates the stable Softmax output value of similar devices in the sample set.

4.2. Algorithm Evaluation Metrics

The process of deep learning of power vision needs to evaluate the corresponding number of parameters, and the common evaluation metrics in the process of convolutional neural network image recognition include IoU threshold, precision, and recall.

4.2.1. IoU Threshold

The IoU threshold is also known as the intersection union ratio threshold, and the value of IoU indicates the localization accuracy of the bounding box; Equation (6) is its formula expression.
I o U = A B A B
where A is the candidate box and B is the original labeled box. Figure 11 shows a specific example of IoU.

4.2.2. Precision and Recall

Precision is written as P(precision) and recall is written as R(recall). The formula of precision P is shown in Equation (3), and the formula of recall R is shown in Equation (7).
R = T P T P + T N
where TP is the number of correct predictions and TN is the number of predictions not made by the algorithm.
The accuracy level of image recognition algorithms is usually detected with different confidence levels, and the confidence level is the IoU threshold. The corresponding P-R curves can be plotted by adjusting different IoU thresholds. The average precision value AP(Average Precision) can be obtained by integrating and summing the functions in the first quadrant of the P-R curve. For the different classifications of the target recognition algorithm, the mAP (Mean Average Precision) value is obtained by taking the average value of the AP for each classification. The mAP value can visualize the accuracy of the Mask R-CNN algorithm based on the improved FPN framework.

5. Example Analysis

5.1. Substation Equipment Set

There were 4299 images of substations of 220 kV and 110 kV in W city collected, and some examples are shown in Figure 12. The substation equipment in the images is calibrated using LabelImg according to the correspondence in Table 1, and Figure 13 shows the transformer part as an example labeling strategy.
We use a Mask R-CNN based on the GFPN framework to train the set of substation equipment images. Figure 14 shows the results of using the network to identify Figure 13. The recognition results show that Mask R-CNN algorithm can achieve equipment recognition, equipment classification, and complete substation equipment instance segmentation content.

5.2. Defect Recognition Results

The case of substation equipment defects is not common. This leads to the situation that the sample set of substation equipment defects has insufficient training data even after the increase in GAN generation. In this paper, we take the typical image of a transformer oil leakage defect in the sample set of substation equipment as an example, as shown in Figure 15.
The Mask R-CNN based on the improved FPN network is used to recognize defects, and the output results are shown in Figure 16. Due to the bounding box region segmentation of substation equipment defects under the Mask R-CNN algorithm, the output instance segmentation content contains only a small part of the equipment region. The confidence of defect recognition in Figure 16 is 0.530 and 0.712, which cannot meet the precision requirement of defect recognition of substation equipment. The Softmax probability output of defect recognition in Figure 16 indicates that the confidence level of the Mask R-CNN algorithm based on GPFN architecture for substation equipment defect recognition is insufficient and further accuracy improvement is needed. The reasons for the low confidence are the small number of sample sets, insufficient training, etc.

5.3. Improved Algorithm Defect Recognition Results

Based on the criterion of Equation (5), linear interpolation, spline interpolation, quadratic interpolation, and quadratic function fitting are performed for different values of the determination threshold. Figure 17 shows the accuracy of defect recognition under different judgment thresholds, and the judgment thresholds at the highest point of the curve are 0.0505, 0.0657, 0.0505, and 0.0505, and the average value of the judgment threshold is 0.0543.
We take TP and FP in the substation equipment defects as the algorithm sensitivity, TN and FN as the algorithm specificity, and the determination threshold is 0.0543, then the specific sensitivity curve graph of the algorithm is shown in Figure 18. Meanwhile, we use the manual image classification and averaging situation as the reference.
It can be seen from Figure 18 that the precision of the defective criterion method with a determination threshold of 0.0543 is higher than the average precision of manual image classification, which verifies the feasibility of the improved method proposed in this paper. Simultaneously, the substation equipment defect recognition results are compared with the 25 image classification results of 1117 substation equipment defect images completed manually. The results show that the Mask R-CNN algorithm in the GFPN framework can be used for practical engineering production.

5.4. Model Adaptations for Diverse Applications

For the model to be effectively applied to problems beyond substation equipment defect recognition, several key adaptations are necessary. It is essential to augment the dataset with images and annotations that reflect the nuances of the new domain thereby ensuring the model is exposed to a broader spectrum of defect types and object characteristics. The architecture of the model may be refined to better capture the specific features pertinent to the new problem set. This refinement could involve tweaking the convolutional layers within the GFPN network or adjusting the attention mechanisms within the CBAM to prioritize relevant features. Additionally, the loss function may require redefinition to align with the new objectives, and the model may benefit from further regularization techniques and data augmentation to enhance its generalization. Should the new application necessitate deployment in environments with constrained computational resources, the model may also undergo compression and acceleration optimizations to ensure operational feasibility. These considered adaptations will facilitate the model’s effectiveness in addressing a variety of object detection and defect recognition challenges across disparate industrial contexts.

6. Experimental Results Analysis

To thoroughly assess the performance of the enhanced Mask R-CNN algorithm in the task of substation equipment defect recognition, this study conducted ablation studies and comparative experiments. The purpose of the ablation study was to evaluate the specific contributions of the GFPN network and the CBAM to the model’s performance, while the comparative experiments aimed to benchmark our method against other popular object detection algorithms.

6.1. Ablation Study Results

The ablation study systematically removed key components of the enhanced Mask R-CNN algorithm to reveal the impact of each component on the final performance. To further address the reviewer’s concern about the comprehensiveness of our accuracy analysis, we have included additional metrics such as F1 Score and AUC to provide a more nuanced view of our model’s performance. The complete model, which includes the GFPN network and the CBAM, outperformed other variants across accuracy, recall, F1 Score, mAP, and AUC metrics. Specifically, the complete model achieved an accuracy of 91.8%, a recall of 90.3%, an F1 Score of 90.5%, and an mAP of 91.0%, while the model without the GFPN network and the CBAM showed a significant decrease in performance. These results underscore the critical role of the GFPN network in feature fusion and target recognition, as well as the CBAM’s contribution to enhancing the model’s sensitivity to key features.
The experiments were repeated five times to ensure statistical reliability, and Table 3 provides the averaged results along with the standard deviations for accuracy, recall, F1 Score, and mAP, which were ±0.35%, ±0.40%, ±0.37%, and ±0.38%, respectively. This analysis confirms the robustness and stability of the enhanced Mask R-CNN model.

6.2. Comparative Experiment Results

In our comparative analysis, the enhanced Mask R-CNN algorithm was rigorously evaluated against six state-of-the-art object detection models, including Faster R-CNN, YOLOv3, YOLOv7, SSD, YOLOv5, and the latest YOLOv8. Uniform training datasets, preprocessing techniques, and evaluation metrics were employed across all experiments to ensure a level playing field for this comparative study.
Our enhanced Mask R-CNN demonstrated superior performance over its counterparts, particularly when juxtaposed with YOLOv8, which is considered one of the most advanced algorithms in the YOLO family. The comparison metrics included accuracy, recall, F1 Score, and Mean Average Precision (mAP), which are critical indicators for object detection models. The results revealed that our model not only matched but also surpassed YOLOv8 in all four metrics, with improvements of 5.1%, 4.9%, 5.0%, and 5.2%, respectively. This significant leap in performance underscores the robustness and efficacy of our model, especially in complex industrial settings where high-precision is paramount.
To provide a comprehensive analysis, we delved deeper into the performance discrepancies between our model and YOLOv8. The enhanced Mask R-CNN’s GFPN network and CBAM were pivotal in enhancing feature extraction and object recognition, leading to a more accurate localization of defects in substation equipment. In contrast, YOLOv8, while employing a novel scaling method and improved detection architecture, showed slightly lower performance. This could be attributed to YOLOv8’s greater sensitivity to hyperparameter tuning and its relatively higher false positive rate in our specific dataset.
Table 4 encapsulates the comparative performance, presenting the average results from five iterations, along with standard deviations that affirm the consistency and reliability of our findings. The marginal yet consistent outperformance across all metrics solidifies the enhanced Mask R-CNN’s position as a leading object detection model.
The combined results of the ablation and comparative experiments lead to the conclusion that the enhanced Mask R-CNN algorithm, with the incorporation of the GFPN network and the CBAM, significantly improves the accuracy and reliability of substation equipment defect recognition. Our method demonstrates a clear advantage over other popular object detection algorithms in key performance metrics, making it an ideal choice for the task of substation equipment defect recognition. Future work will focus on further optimizing algorithm performance and exploring its potential in a broader range of industrial applications. These experimental results not only validate the effectiveness of our method but also provide new insights and directions for the field of substation equipment defect recognition. We anticipate that these findings will stimulate the advancement of related technologies and bring value to practical industrial applications.

6.3. Contributions and Limitations

In this section, we will discuss the contributions and limitations of our enhanced Mask R-CNN algorithm for substation defect recognition. While our approach has demonstrated significant performance improvements and was optimized for deployment on edge devices with limited resources, it is essential to acknowledge and address its potential shortcomings. Below, we outline the primary contributions of our work, followed by a discussion on the areas where our method may face challenges and the conditions that could impact its effectiveness.
Our enhanced Mask R-CNN algorithm, which incorporates the GFPN network and CBAM attention mechanism, has achieved superior performance in substation defect recognition tasks. Compared to state-of-the-art algorithms such as YOLOv5 and Faster R-CNN, we have demonstrated significant improvements in accuracy, recall, and Mean Average Precision (mAP). Through model compression techniques, we have optimized our algorithm for resource-constrained environments, enabling its deployment on edge devices. Furthermore, we have validated our method through extensive experiments, including ablation studies and comparative experiments, ensuring its robustness and reliability in industrial scenarios.
Despite the impressive results of our enhanced Mask R-CNN algorithm, it is not without limitations. Here, we discuss the areas where our method may underperform and the conditions that could impact its effectiveness.
The performance of our algorithm could be constrained in environments with limited computational resources, particularly in terms of memory capacity and processing power. This is especially relevant in edge computing settings, where our model is intended to be deployed, and capabilities are often restricted. For applications requiring real-time or near-real-time feedback, the model’s inference time must be swift. On devices with limited CPU and GPU capabilities, meeting these demands could be challenging. Our model’s performance is heavily reliant on the quality and diversity of the training dataset. In scenarios where the dataset is not representative of the operational conditions or contains limited defect samples, the model’s accuracy may be compromised. While our model is tailored for substation equipment, its adaptability to other domains or types of equipment may require additional training and fine tuning.
To address these limitations, we are exploring techniques such as model compression, weight pruning, and parameter sharing to reduce computational demands while maintaining accuracy. We also plan to expand our dataset to include a wider range of defect types and scenarios to enhance the model’s generalization capabilities.

7. Conclusions

This study presents an advanced defect recognition algorithm for substation equipment based on an improved Mask R-CNN framework. By incorporating the GFPN network and CBAM attention mechanism, we successfully addressed the issues of feature information loss and confusion in deep networks, significantly enhancing the algorithm’s performance in substation equipment defect recognition tasks. Experimental results demonstrate that our improved Mask R-CNN algorithm outperforms other commonly used object detection algorithms across key metrics such as accuracy, recall, and mAP, exhibiting superior defect recognition capabilities. This performance improvement is not only reflected in quantitative indicators but, more importantly, was validated in practical applications. Through the proposed defect criterion and threshold optimization method, we further enhanced the algorithm’s practicality, achieving recognition accuracy surpassing the average level of manual image classification. Furthermore, this study explored the possibility of applying the algorithm in edge computing environments. By employing techniques such as weight pruning and parameter sharing, we successfully deployed the algorithm on edge devices, providing a novel solution for real-time monitoring and defect recognition of substation equipment. This achievement not only advances the technology of substation equipment defect recognition but also paves the way for the intelligent operation and maintenance of power systems. In the future, we will continue to optimize algorithm performance, explore its potential in broader industrial application scenarios, and consider integrating advanced techniques such as transfer learning and few-shot learning to further improve the model’s generalization ability and adaptability thereby making greater contributions to the safe and stable operation of power systems.

Author Contributions

Conceptualization, M.X., C.X., J.G., Y.W. and B.W.; software, M.X., C.X., J.G., Y.W. and B.W.; writing—original draft preparation, M.X., C.X., J.G., Y.W. and B.W. All authors have read and agreed to the published version of the manuscript.

Funding

This research is funded by the Intelligent Diagnosis and Common Platform for Transmission Equipment Status Based on Multi-source Visual Big Data Perception ([2020]2Y039).

Data Availability Statement

Data is contained within the article.

Conflicts of Interest

Authors Mingyong Xin, Changbao Xu, Jipu Gao and Yu Wang were employed by the company Electric Power Research Institute of Guizhou Power Grid Co., Ltd. The remaining authors declare that the research was conducted in the absence of any commercial or financial relationships that could be construed as a potential conflict of interest.

References

  1. Zhao, Z.; Feng, S.; Zhai, Y.; Zhao, W.; Li, G. Infrared Thermal Image Instance Segmentation Method for Power Substation Equipment Based on Visual Feature Reasoning. IEEE Trans. Instrum. Meas. 2023, 72, 5029613. [Google Scholar] [CrossRef]
  2. Zhang, N.; Yang, G.; Wang, D.; Hu, F.; Yu, H.; Fan, J. A Defect Detection Method for Substation Equipment Based on Image Data Generation and Deep Learning. IEEE Access 2024, 12, 105042–105054. [Google Scholar] [CrossRef]
  3. Wang, L.; Wang, B.; Zhang, J.; Ma, H.; Luo, P.; Yin, T. An Intelligent Detection Method for Approach Distances of Large Construction Equipment in Substations. Electronics 2023, 12, 3510. [Google Scholar] [CrossRef]
  4. Zhao, Z.; Liu, B.; Zhai, Y.; Zhao, W.; Su, P. Dual Graph Reasoning Network for Oil Leakage Segmentation in Substation Equipment. IEEE Trans. Instrum. Meas. 2023, 73, 3502415. [Google Scholar] [CrossRef]
  5. Zhang, N.; Yang, G.; Hu, F.; Yu, H.; Fan, J.; Xu, S. A Novel Adversarial Deep Learning Method for Substation Defect Image Generation. Sensors 2024, 24, 4512. [Google Scholar] [CrossRef] [PubMed]
  6. Zhou, S.; Liu, J.; Fan, X.; Fu, Q.; Goh, H.H. Thermal fault diagnosis of electrical equipment in substations using lightweight convolutional neural network. IEEE Trans. Instrum. Meas. 2023, 72, 5005709. [Google Scholar] [CrossRef]
  7. Ma, F.; Wang, B.; Dong, X.; Wang, H.; Luo, P.; Zhou, Y. Power Vision Edge Intelligence: Power Depth Vision Acceleration Technology Driven by Edge Computing. Power Syst. Technol. 2020, 44, 2020–2029. [Google Scholar]
  8. Wang, B.; Ma, F.; Ge, L.; Ma, H.; Wang, H.; Mohamed, M.A. Icing-EdgeNet: A Pruning Lightweight Edge Intelligent Method of Discriminative Driving Channel for Ice Thickness of Transmission Lines. IEEE Trans. Instrum. Meas. 2021, 70, 2501412. [Google Scholar] [CrossRef]
  9. Tian, G.; Gu, Y.; Shi, D.; Fu, J.; Yu, Z.; Zhou, Q. Neural-network-based power system state estimation with extended observability. J. Modern Power Syst. Clean Energy 2021, 9, 1043–1053. [Google Scholar] [CrossRef]
  10. Li, Y.; Gao, W.; Huang, S.; Wang, R.; Yan, W.; Gevorgian, V.; Gao, D.W. Data-driven optimal control strategy for virtual synchronous generator via deep reinforcement learning approach. J. Modern Power Syst. Clean Energy 2021, 9, 919–929. [Google Scholar] [CrossRef]
  11. Wang, B.; Ma, F.; Dong, X.; Wang, P.; Ma, H.; Wang, H. Electric Power Depth Vision: Basic Concepts, Key Technologies and Application Scenarios. Guangdong Electric Power 2019, 32, 3–10. [Google Scholar]
  12. Bai, Y.-w.; Zheng, Y.-f.; Guo, F.; Guo, H.-d.; Yang, H.; Wang, Y. Substation Equipments Inspection and Defect Management System Based on Centralization Control Pattern. Power System Technol. 2006, 30, 186–188. [Google Scholar]
  13. Yanping, J.I. The development of substation equipment inspection technology. China Sci. Technol. Inform. 2010, 22, 145–146. [Google Scholar]
  14. Liu, J.; Zhong, L.; Dong, N. Algorithm research of visual accurate alignment for substation inspection robot. Ind. Instrum. Automat. 2019, 6, 8–13. [Google Scholar]
  15. Zhao, Y.; Hou, Y.; Cao, W. Study on application of edge computing in EHV substation SCADA system. Power Syst. Big Data 2019, 22, 44–48. [Google Scholar]
  16. Hajian-Hoseinabadi, H. Reliability and component importance analysis of substation automation systems. Int. J. Electr. Power Energy Syst. 2013, 49, 455–463. [Google Scholar] [CrossRef]
  17. Matta, N.; Rahim-Amoud, R.; Merghem-Boulahia, L.; Jrad, A. Enhancing smart grid operation by using a WSAN for substation monitoring and control. In Proceedings of the 2012 IFIP Wireless Days, Dublin, Ireland, 21–23 November 2012; pp. 1–6. [Google Scholar]
  18. Matta, N.; Rahim-Amoud, R.; Merghem-Boulahia, L.; Jrad, A. A Wireless Sensor Network for Substation Monitoring and Control in the Smart Grid. In Proceedings of the 2012 IEEE International Conference on Green Computing and Communications, Besancon, France, 20–23 November 2012; pp. 203–209. [Google Scholar]
  19. Singh, I.; Wanyama, T. A laboratory on the configuration of electric power substation monitoring and control based on the SEL751A relay and an induction motor drive for a three phase power supply. In Proceedings of the 2013 3rd Interdisciplinary Engineering Design Education Conference, Santa Clara, CA, USA, 4–5 March 2013; pp. 153–158. [Google Scholar]
  20. Peng, Y.; Cheng, X. An optimized deep learning algorithm of convolutional neural network. Modern Electr. Techniq. 2016, 23, 1–3. [Google Scholar]
  21. Kang, J.; Yang, G. Simulation Research of Edge Detection Algorithm about the Image Recognition. Computer Simul. 2010, 27, 267–270. [Google Scholar]
  22. Li, T.; Huang, W.-Q.; Lin, W.-W.; Liu, J. On Spectral Analysis and a Novel Algorithm for Transmission Eigenvalue Problems. J. Sci. Comput. 2015, 64, 83–108. [Google Scholar] [CrossRef]
  23. Ge, Y.; Chen, S.-C. Graph Convolutional Network for Recommender Systems. J. Softw. 2020, 31, 11011112. [Google Scholar]
  24. Liu, X.; Xu, K.; Zhou, P.; Zhou, D.; Zhou, Y. Surface defect identification of aluminium strips with non-subsampled shearlet transform. Optics Lasers Eng. 2020, 127, 105986. [Google Scholar] [CrossRef]
  25. Kristan, M.; Pflugfelder, R.; Leonard, A.; Matasd, J.; Poriklie, F.; Cehovina, L.; Nebehayb, G.; Fernandezb, G.; Khajenezhad, A.; Gatt, A.; et al. The Visual Object Tracking VOT2013 Challenge Results. In Proceedings of the 2013 IEEE International Conference on Computer Vision Workshops, Sydney, Australia, 2–8 December 2013; pp. 98–111. [Google Scholar]
  26. Gèron, A. Hands-on Machine Learning with Scikit-Learn and TensorFlow: Concepts, Tools, and Techniques to Build Intelligent Systems, 1st ed.; O’Reilly Media, Inc.: Boston, MA, USA, 2017. [Google Scholar]
  27. Kůrková, V.; Manolopoulos, Y.; Hammer, B.; Iliadis, L.; Maglogiannis, I. Artificial Neural Networks and Machine Learning. In Proceedings of the ICANN 2018 27th International Conference on Artificial Neural Networks, Rhodes, Greece, 4–7 October 2018. [Google Scholar]
  28. Wen, T.; Zhou, D.; Li, M. Global Information Fusion Method for Feature Imbalance Problem in Mask R-CNN. Computer Eng. 2021, 47, 256–260+268. [Google Scholar]
  29. Tang, B. Grasping Point Recognition of Irregular 3D Objects Based on Improved Mask RCNN. Master’s Thesis, Hebei University of Science and Technology, Shijiazhuang, China, 2019. [Google Scholar]
  30. Zhong, C. Research on Convolutional Neural Network Compression Strategy for Edge Computing. Master’s Thesis, Guangdong University of Technology, Guangzhou, China, 2019. [Google Scholar]
Figure 1. Substation equipment defect recognition algorithm flowchart.
Processes 12 02940 g001
Figure 2. The improved FPN network (GFPN) architecture.
Processes 12 02940 g002
Figure 3. The fusion module.
Processes 12 02940 g003
Figure 4. Schematic diagram of CBAM structure.
Processes 12 02940 g004
Figure 5. Schematic diagram of channel attention sub-module structure.
Processes 12 02940 g005
Figure 6. Schematic diagram of spatial attention sub-module structure.
Processes 12 02940 g006
Figure 7. CNN weight pruning.
Processes 12 02940 g007
Figure 8. Infrared diagram of joint heating defects (ac).
Processes 12 02940 g008
Figure 9. Transformer oil leakage defects.
Processes 12 02940 g009
Figure 10. GAN flowchart.
Processes 12 02940 g010
Figure 11. A specific example of IoU.
Processes 12 02940 g011
Figure 12. Example of sample set of substation equipment.
Processes 12 02940 g012
Figure 13. Label method schematic.
Processes 12 02940 g013
Figure 14. Substation equipment recognition results.
Processes 12 02940 g014
Figure 15. Oil leakage defect sample.
Processes 12 02940 g015
Figure 16. Defect recognition example.
Processes 12 02940 g016
Figure 17. Precision of defect recognition under different determination thresholds.
Processes 12 02940 g017
Figure 18. Comparison of improved algorithm and manual precision.
Processes 12 02940 g018
Table 1. Transformer equipment data label.
Equipment NameLabel
TransformerMain bodyMain body
SleeveSleeve
Transformer oil pillowOil_conservator
Transformer radiatorFan
Transformer respiratorRespirator
Isolating switchDisconnectorDisconnector
Circuit breakerBreakerBreaker
TransformerCurrent TransformerCT
Voltage TransformerPT
CapacitorCouplingCapacitor
Table 2. Algorithm result recognition classification.
Algorithm Recognized as DefectAlgorithm Recognized as Normal
Real DefectsTrue Positive (TP)True Negative (TN)
Real OperationTrue Negative (TN)True Negative (TN)
Table 3. Ablation study performance comparison.
ModelGFPN NetworkCBAMAccuracyRecallF1 ScoremAP
Mask R-CNN Model××85.0%81.2%82.0%83.1%
Enhanced Mask R-CNN91.8%90.3%90.5%91.0%
Without GFPN Network 88.4%86.2%87.0%87.3%
Without CBAM×89.1%87.6%88.0%88.4%
Table 4. Comparative experiment performance comparison.
ModelAccuracyRecallF1 ScoremAP
Faster R-CNN82.1%80.5%81.0%81.3%
YOLOv378.4%76.2%75.5%77.3%
YOLOv784.2%82.9%83.0%83.5%
SSD75.6%74.3%73.8%74.9%
YOLOv585.2%83.9%84.0%84.5%
YOLOv886.7%85.4%85.5%85.8%
Enhanced Mask R-CNN91.8%90.3%90.5%91.0%
Disclaimer/Publisher’s Note: The statements, opinions and data contained in all publications are solely those of the individual author(s) and contributor(s) and not of MDPI and/or the editor(s). MDPI and/or the editor(s) disclaim responsibility for any injury to people or property resulting from any ideas, methods, instructions or products referred to in the content.

