
Modeling and Experimental Verification of In-House Built Portable Ultrafiltration (PUF) System to Maintain Water Quality


Abstract
:1. Introduction
- (i)
- Development of an inexpensive, in-house-built portable ultrafiltration (PUF) system that has been thoroughly evaluated for its performance to see how well it treats different kinds of water while meeting drinking-water quality standards.
- (ii)
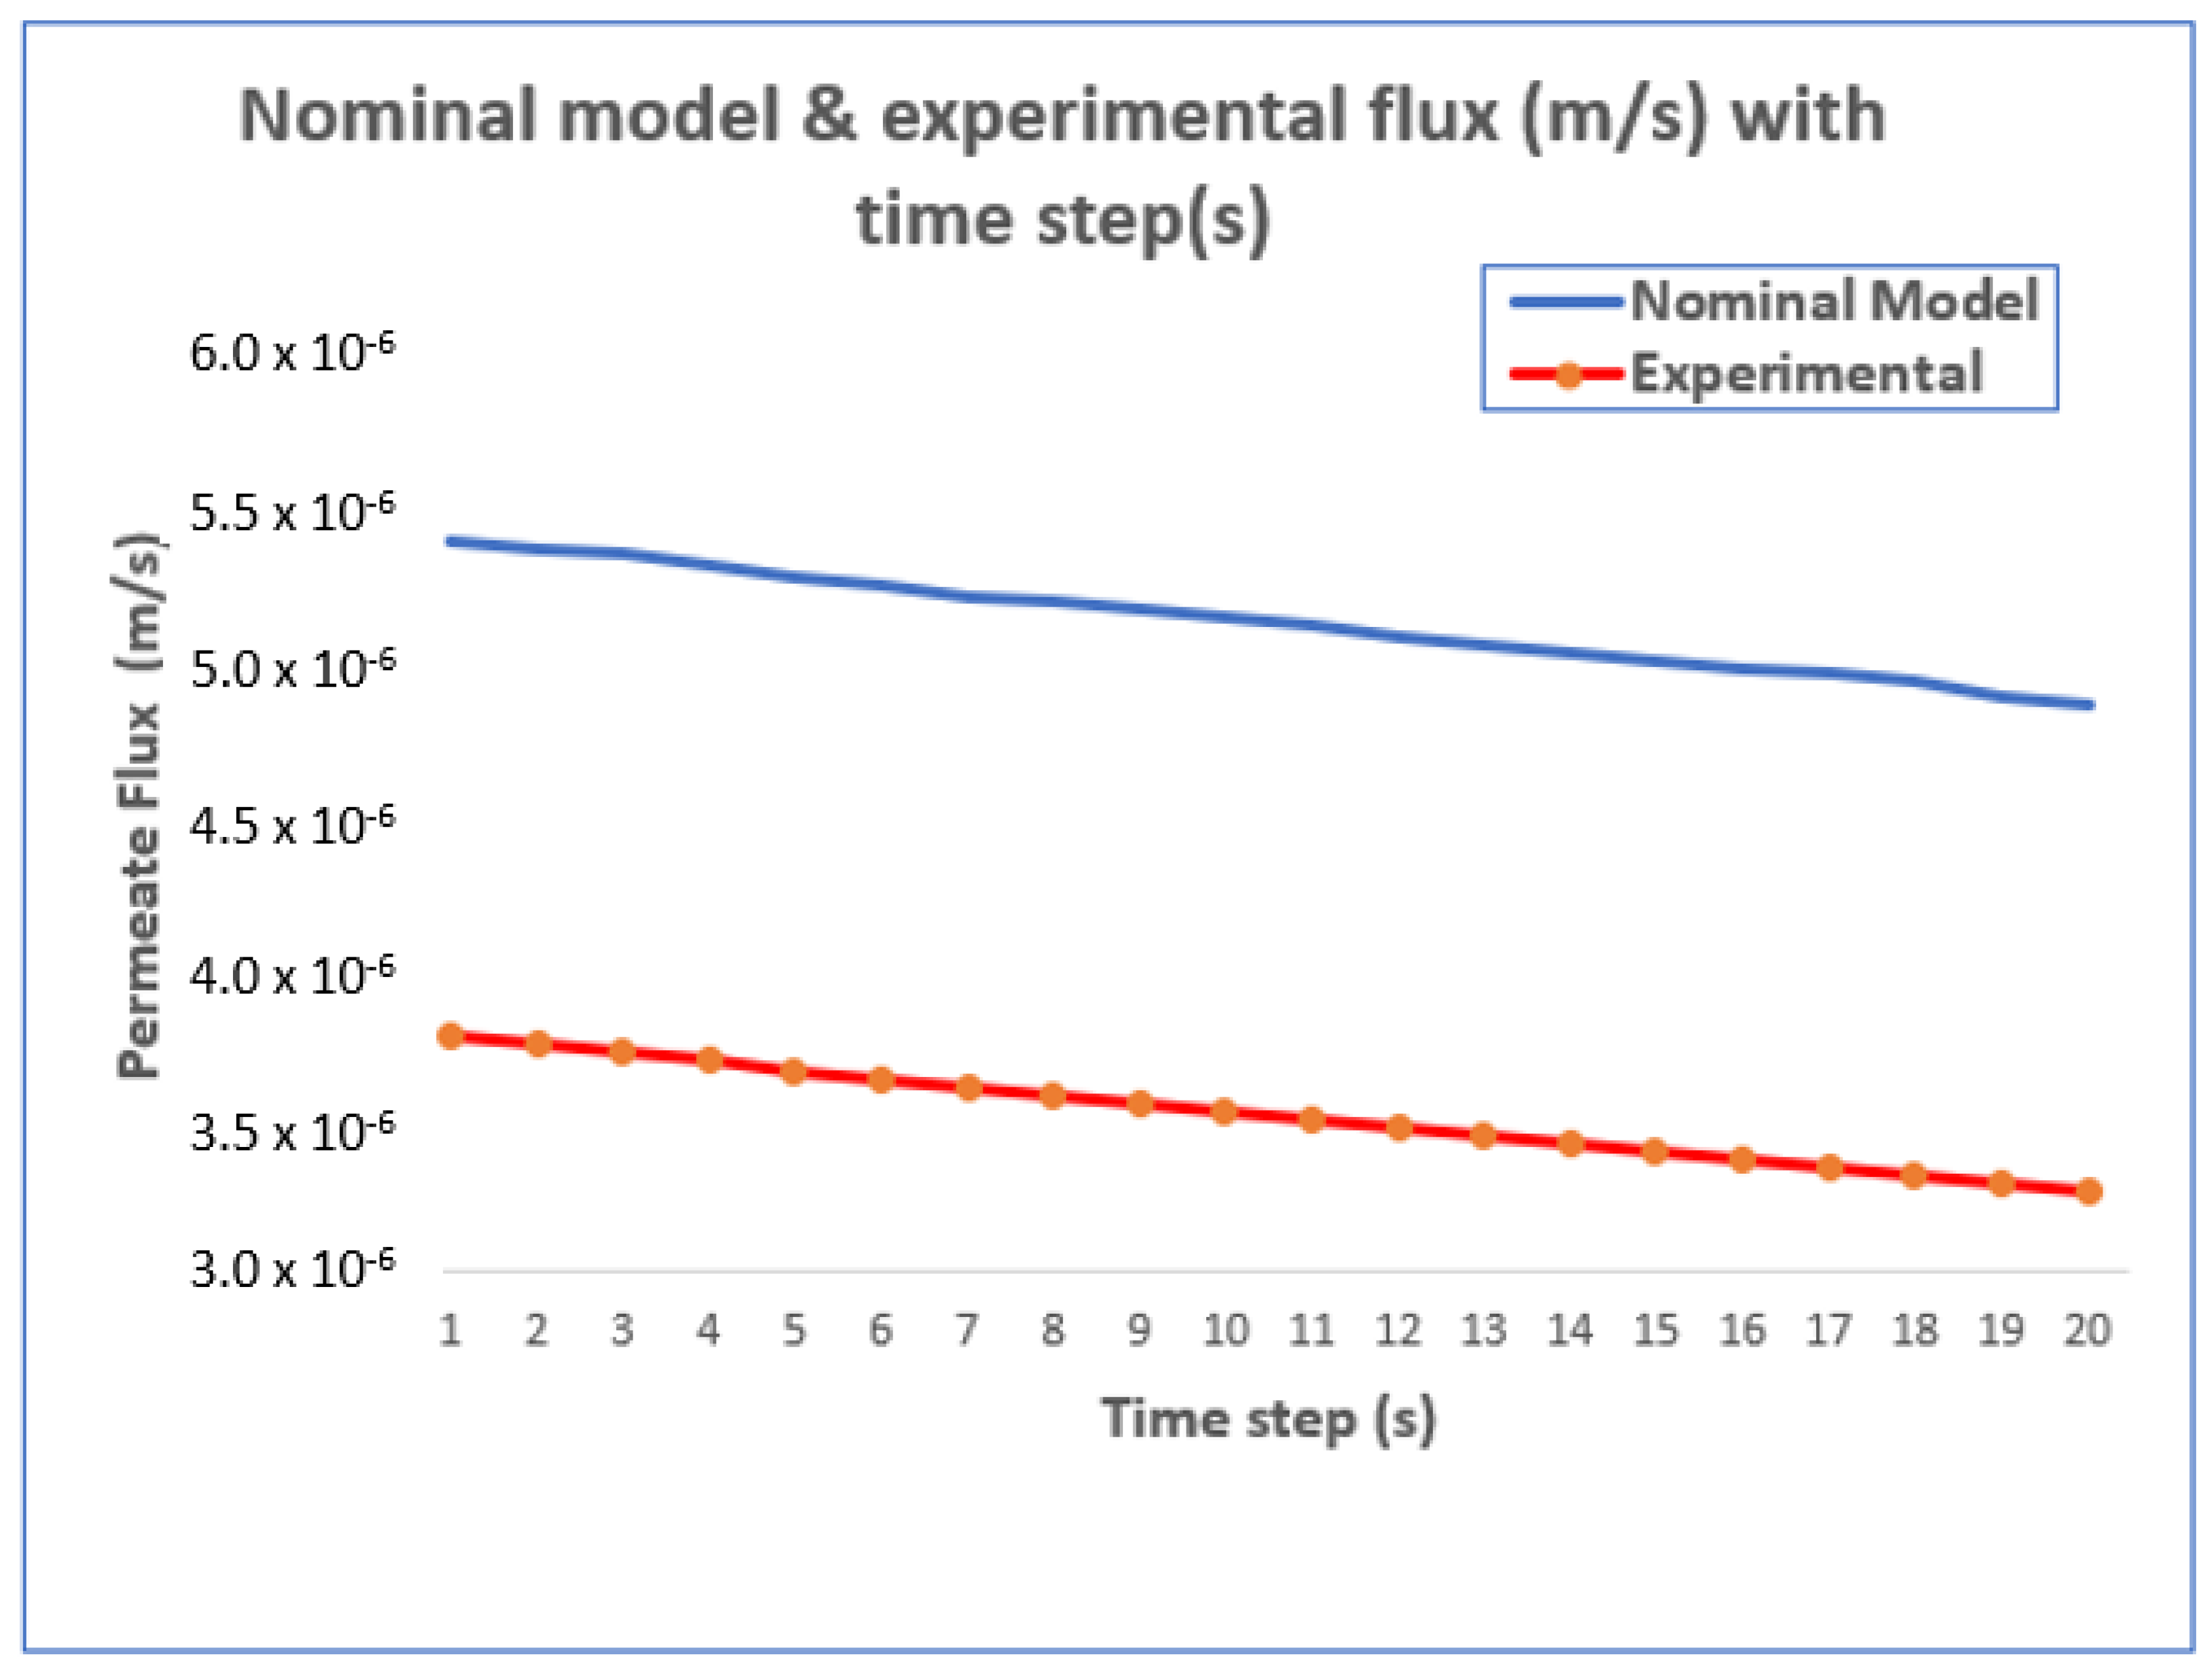
- Formulation of a simple but accurate model for this in-house-built portable ultrafiltration unit, allowing for the prediction of TMP and permeate flux within the portable system. This will allow quick predictions to be made of the performance of the unit without having to run experimental tests all the time.
- (iii)
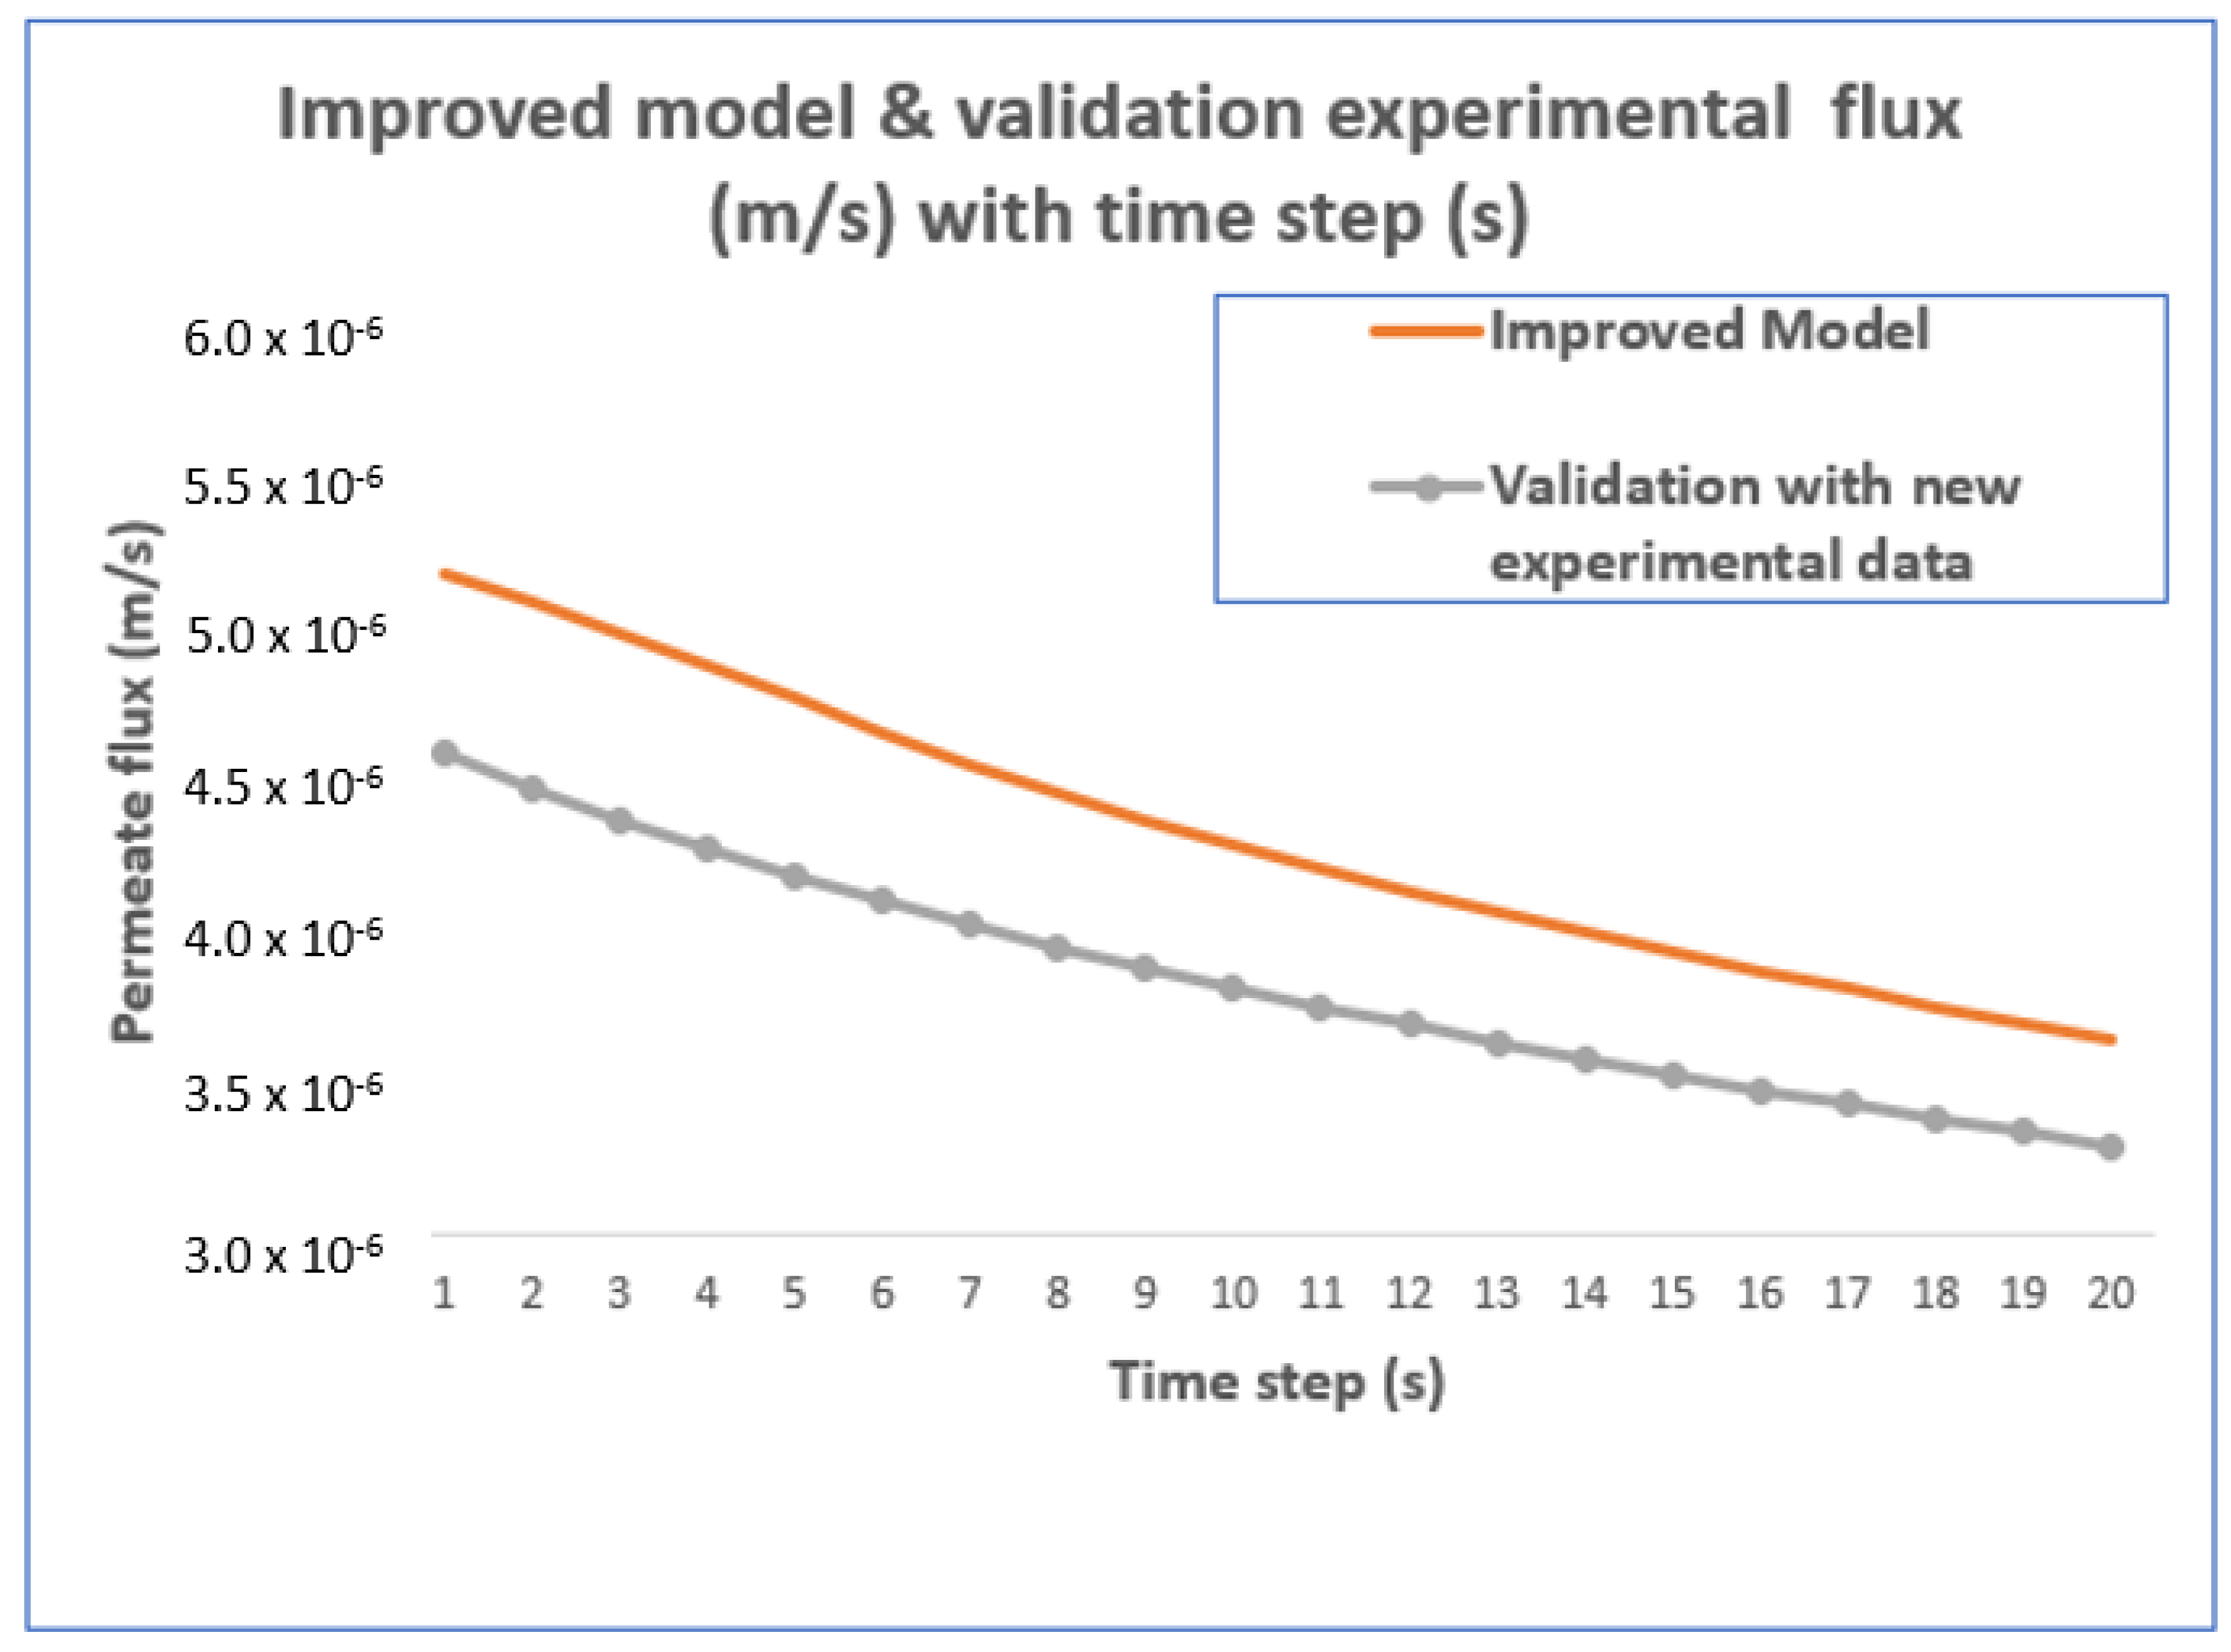
- Application of the Evolutionary Programming (EP) approach, to update the parameter of the model to produce an improved model that closely resembles the actual PUF unit and which has been validated by experimental testing.
2. Literature Review
3. Methodology
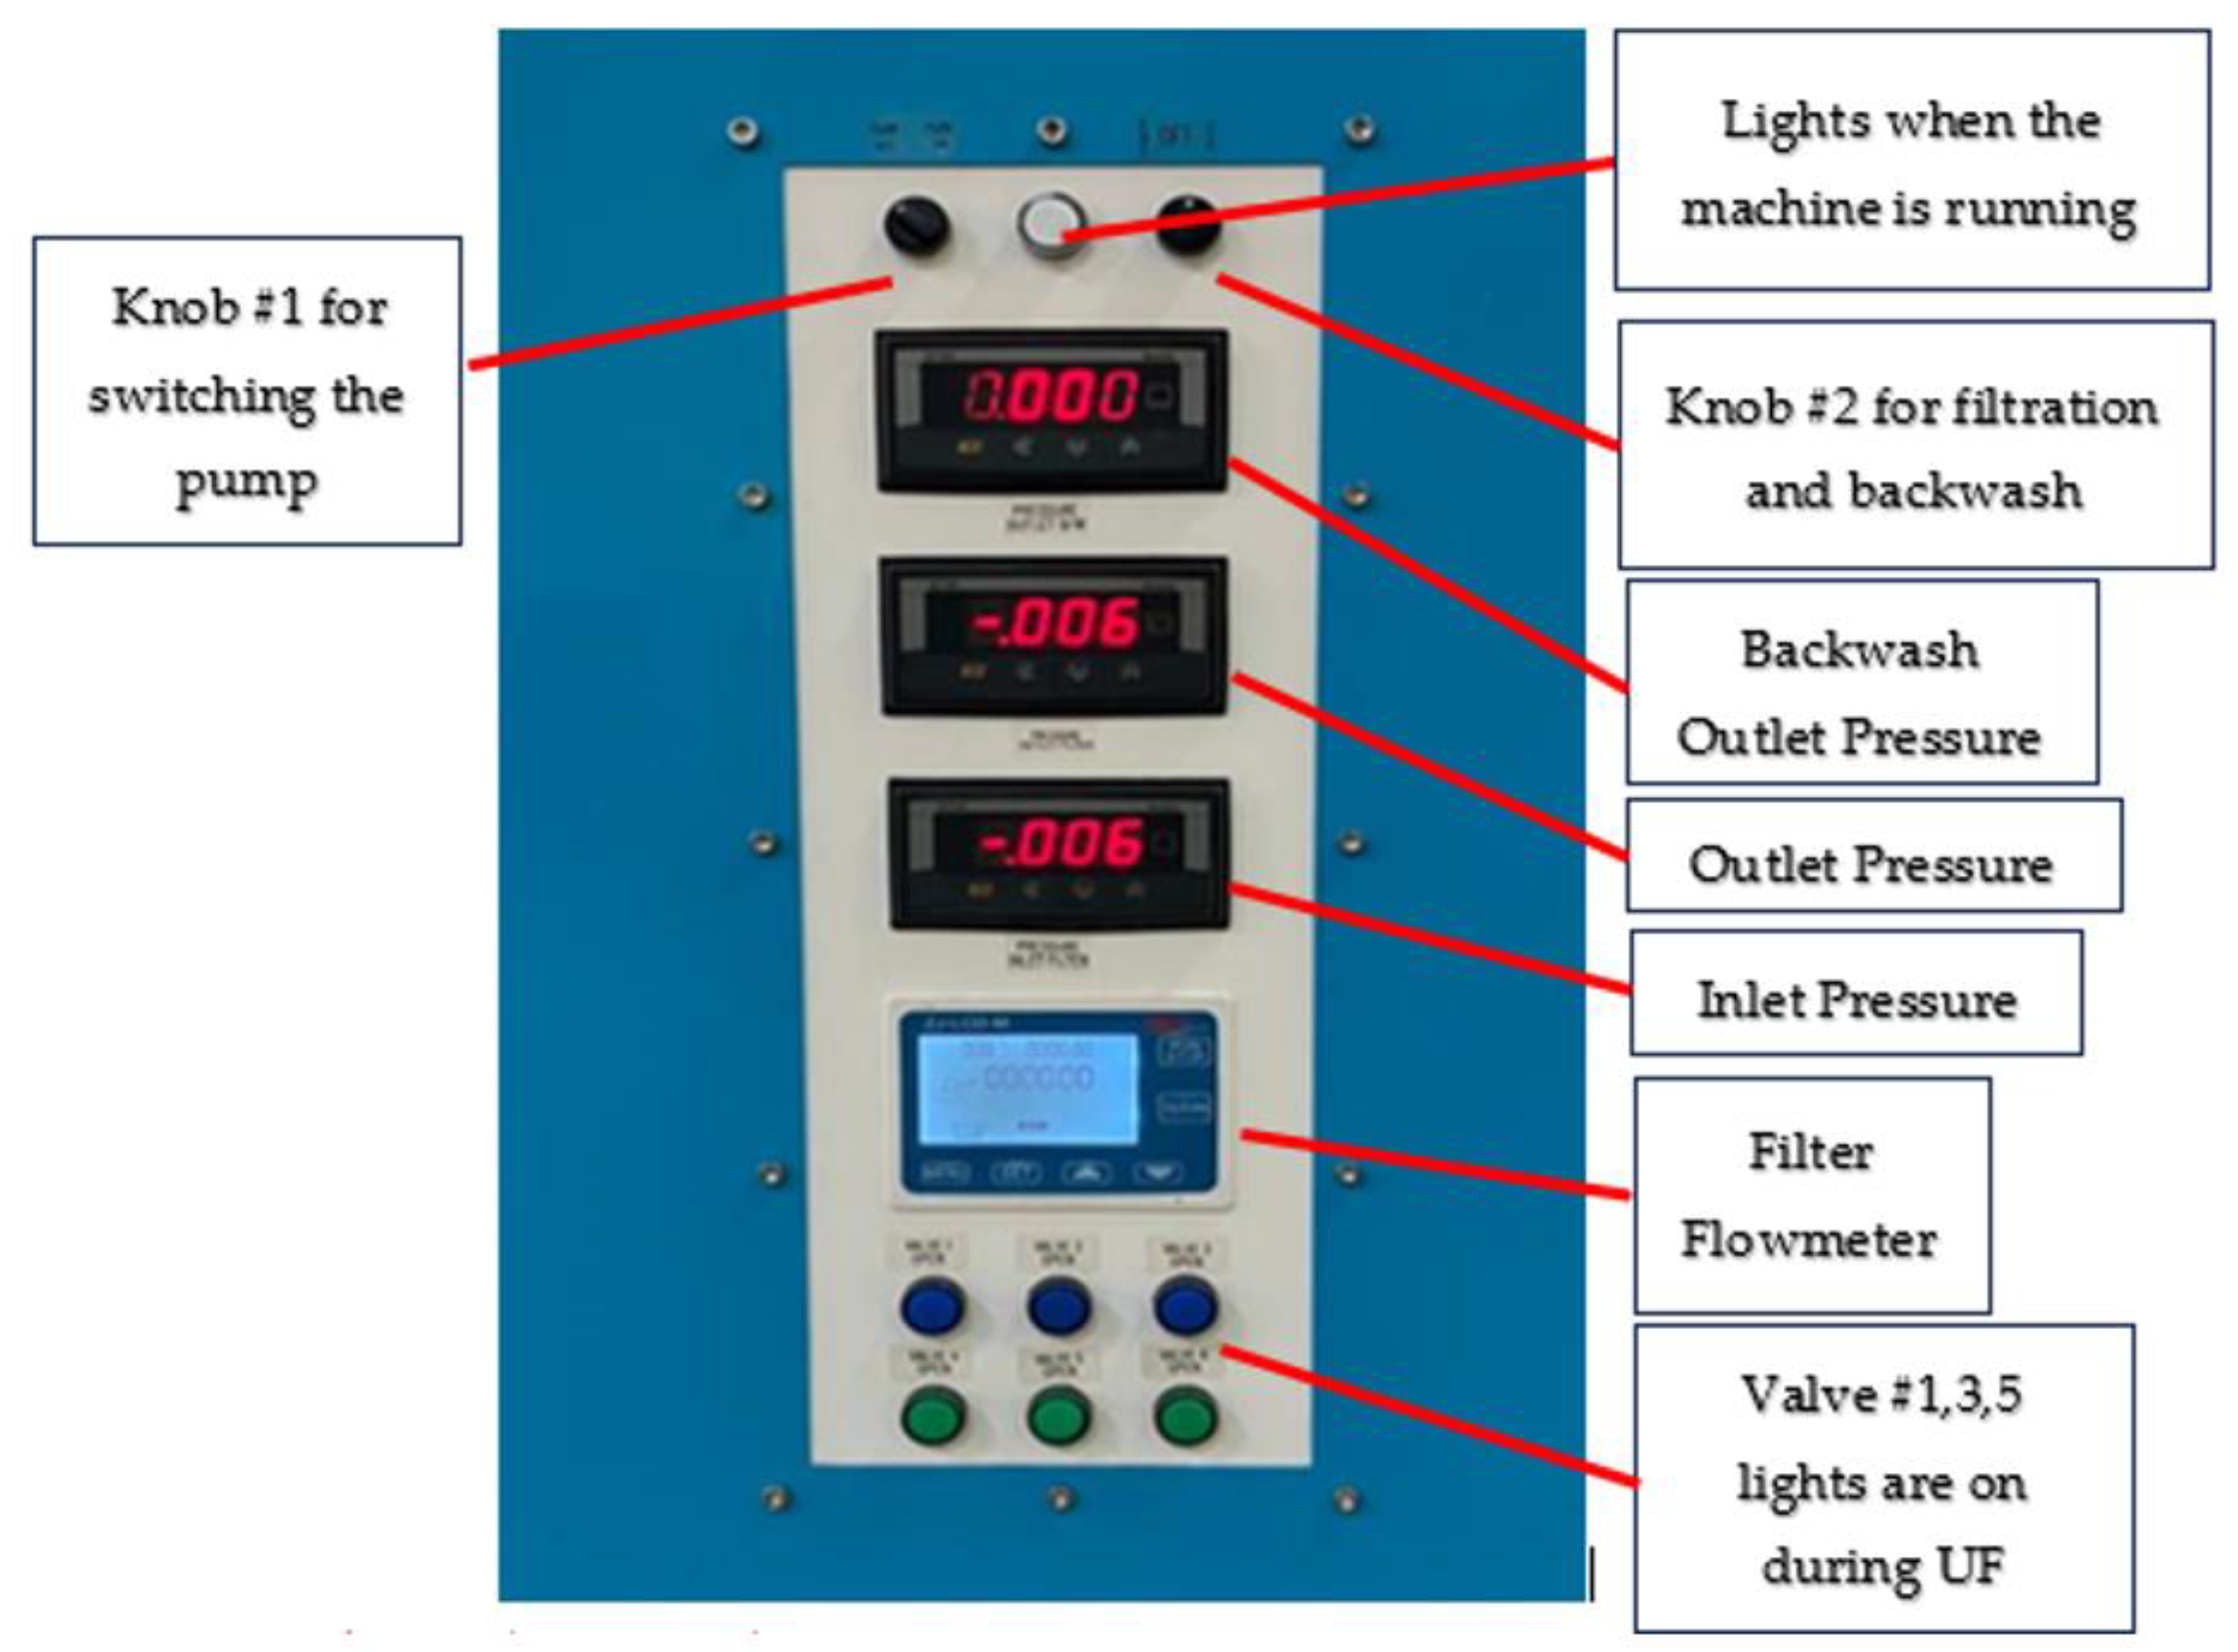
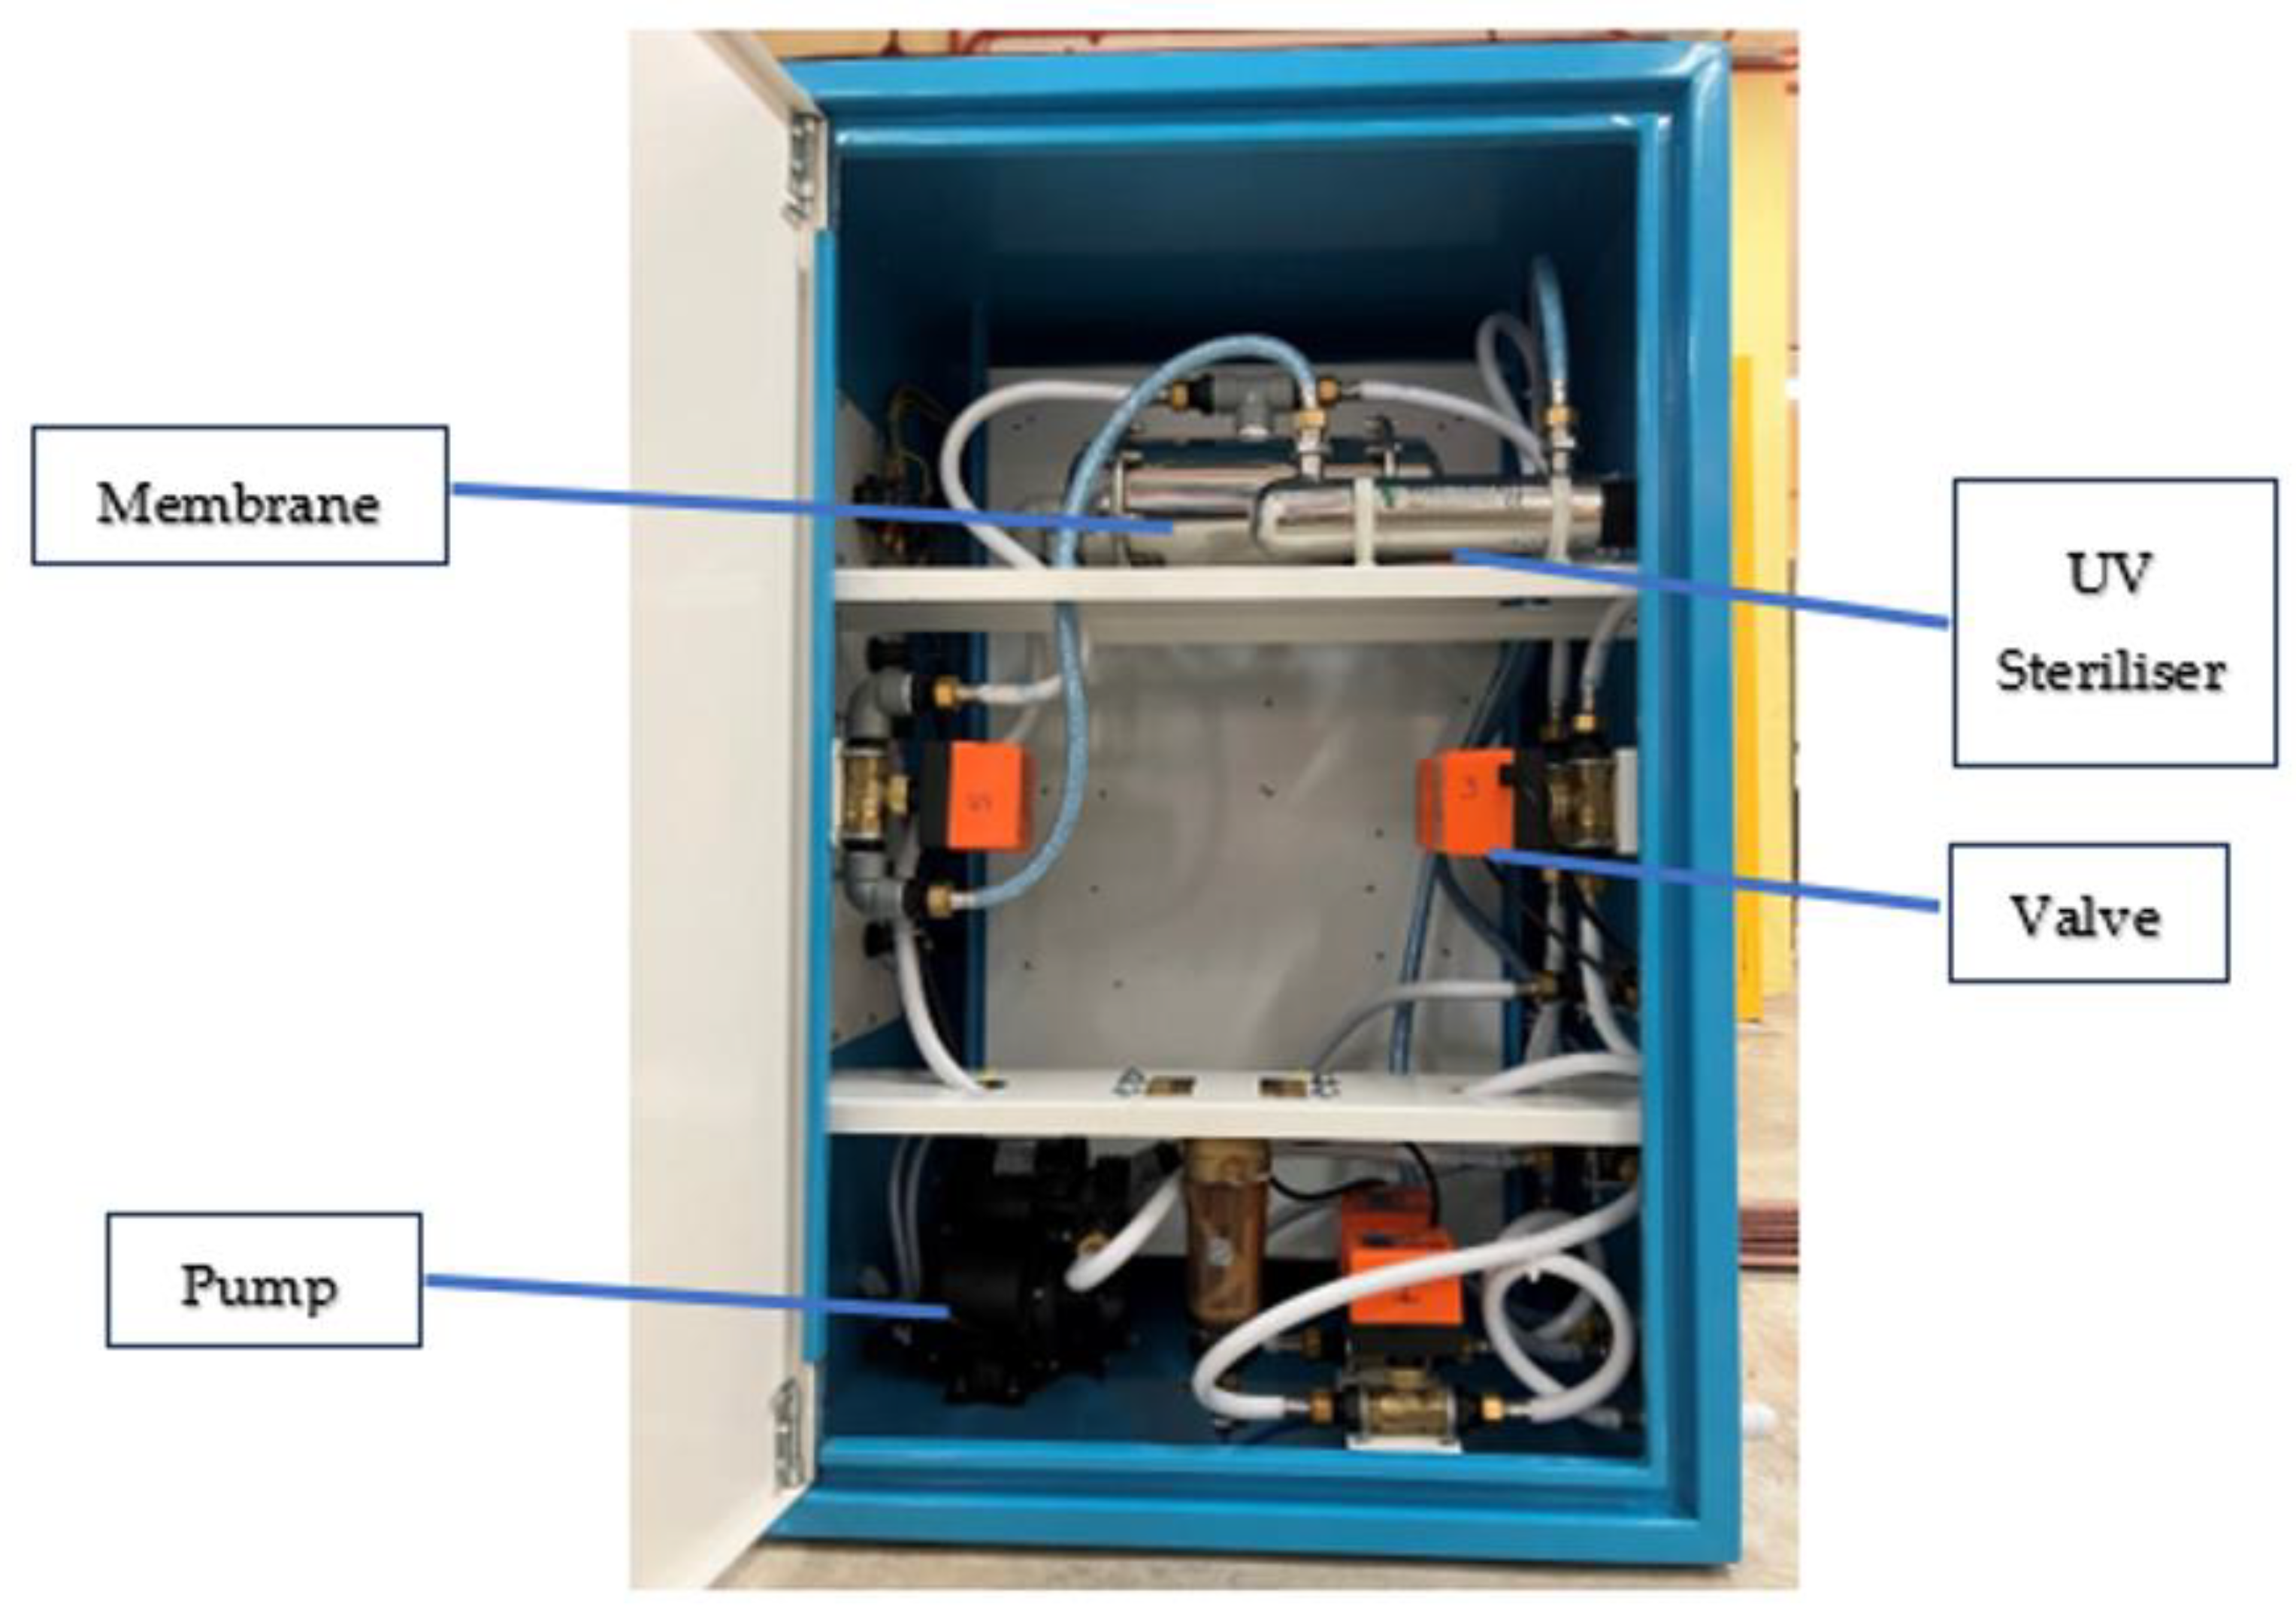
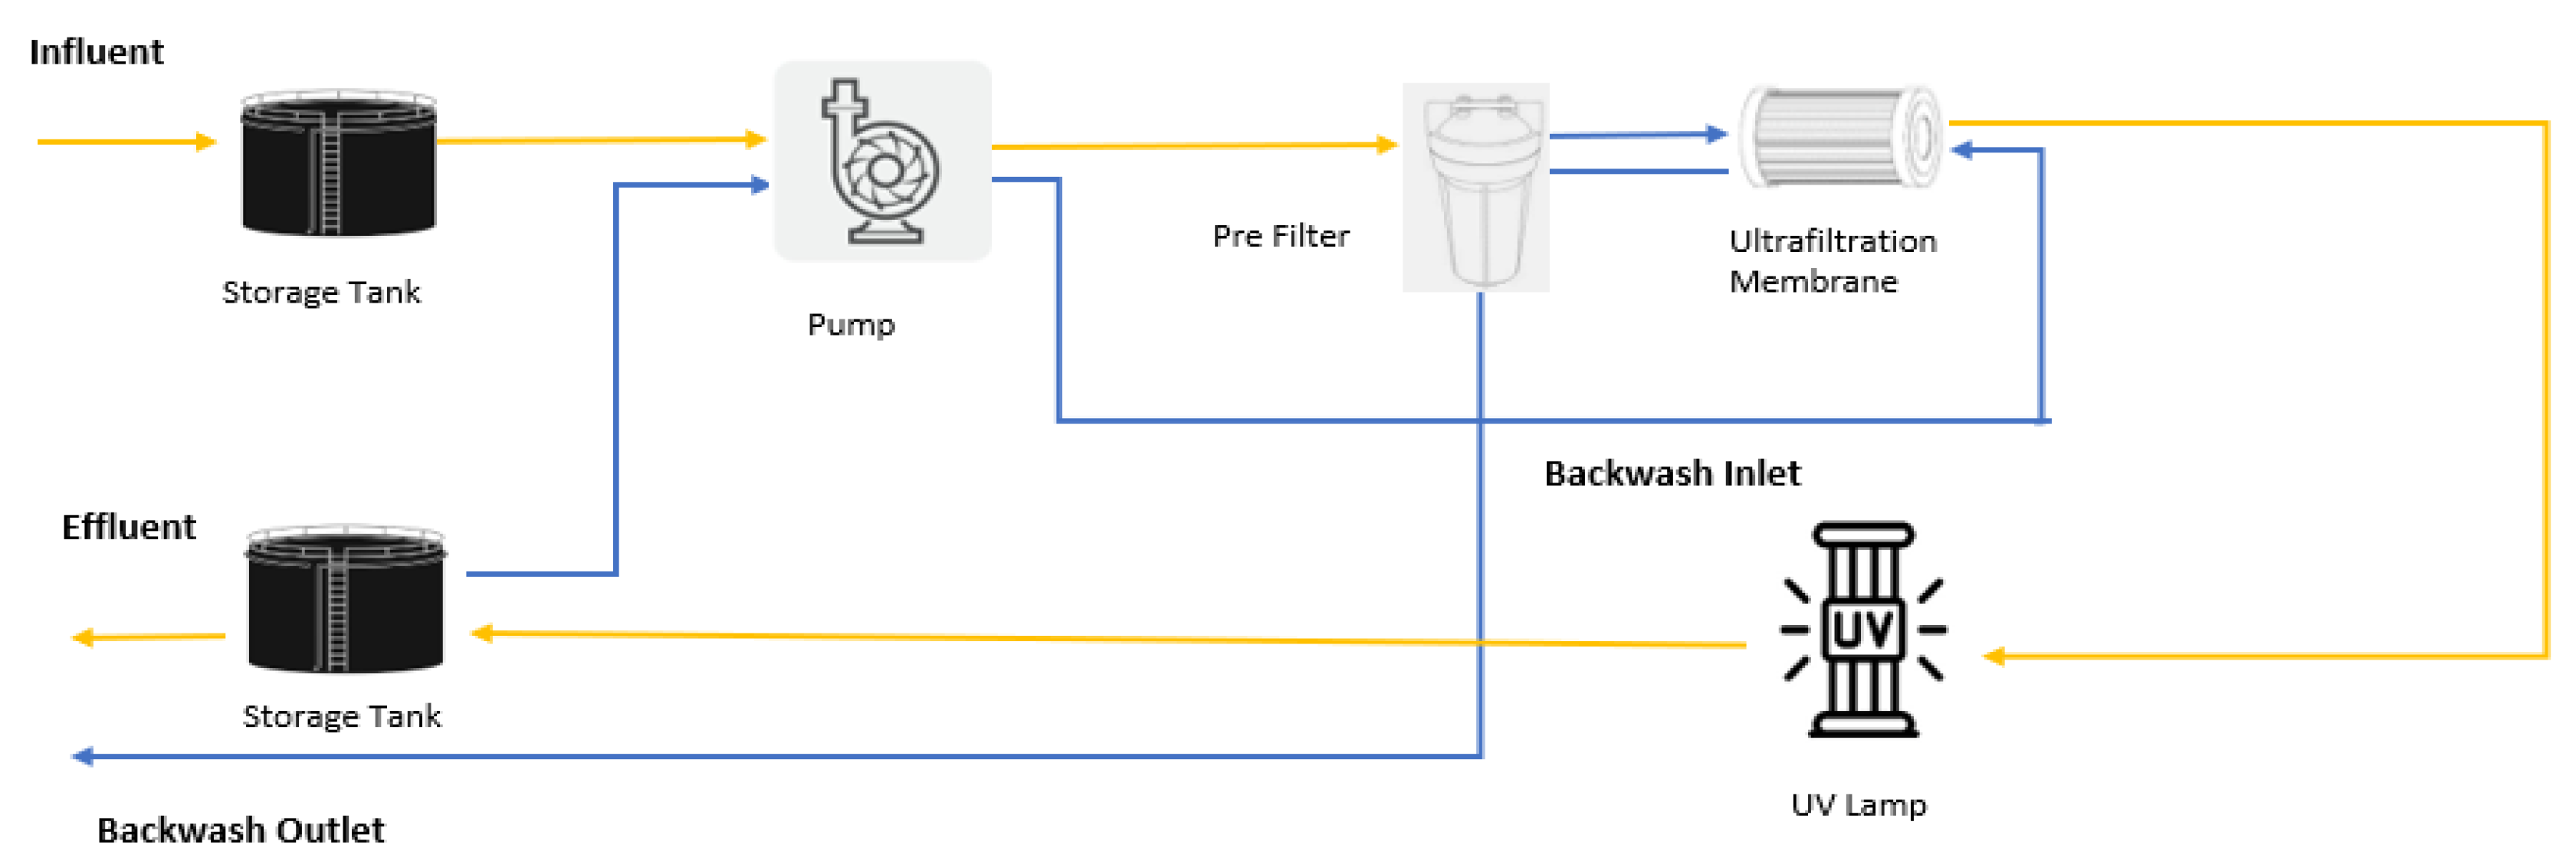
3.1. Description of In-House-Built Portable Ultrafiltration (PUF) Unit
3.2. Experimental Setup and Procedure of the Portable PUF System
3.3. Water Quality Test
3.4. Modeling and Simulation
Parameter Estimation Using Evolutionary Programming
4. Results and Discussion
4.1. Improved Modeling Using the EP Approach
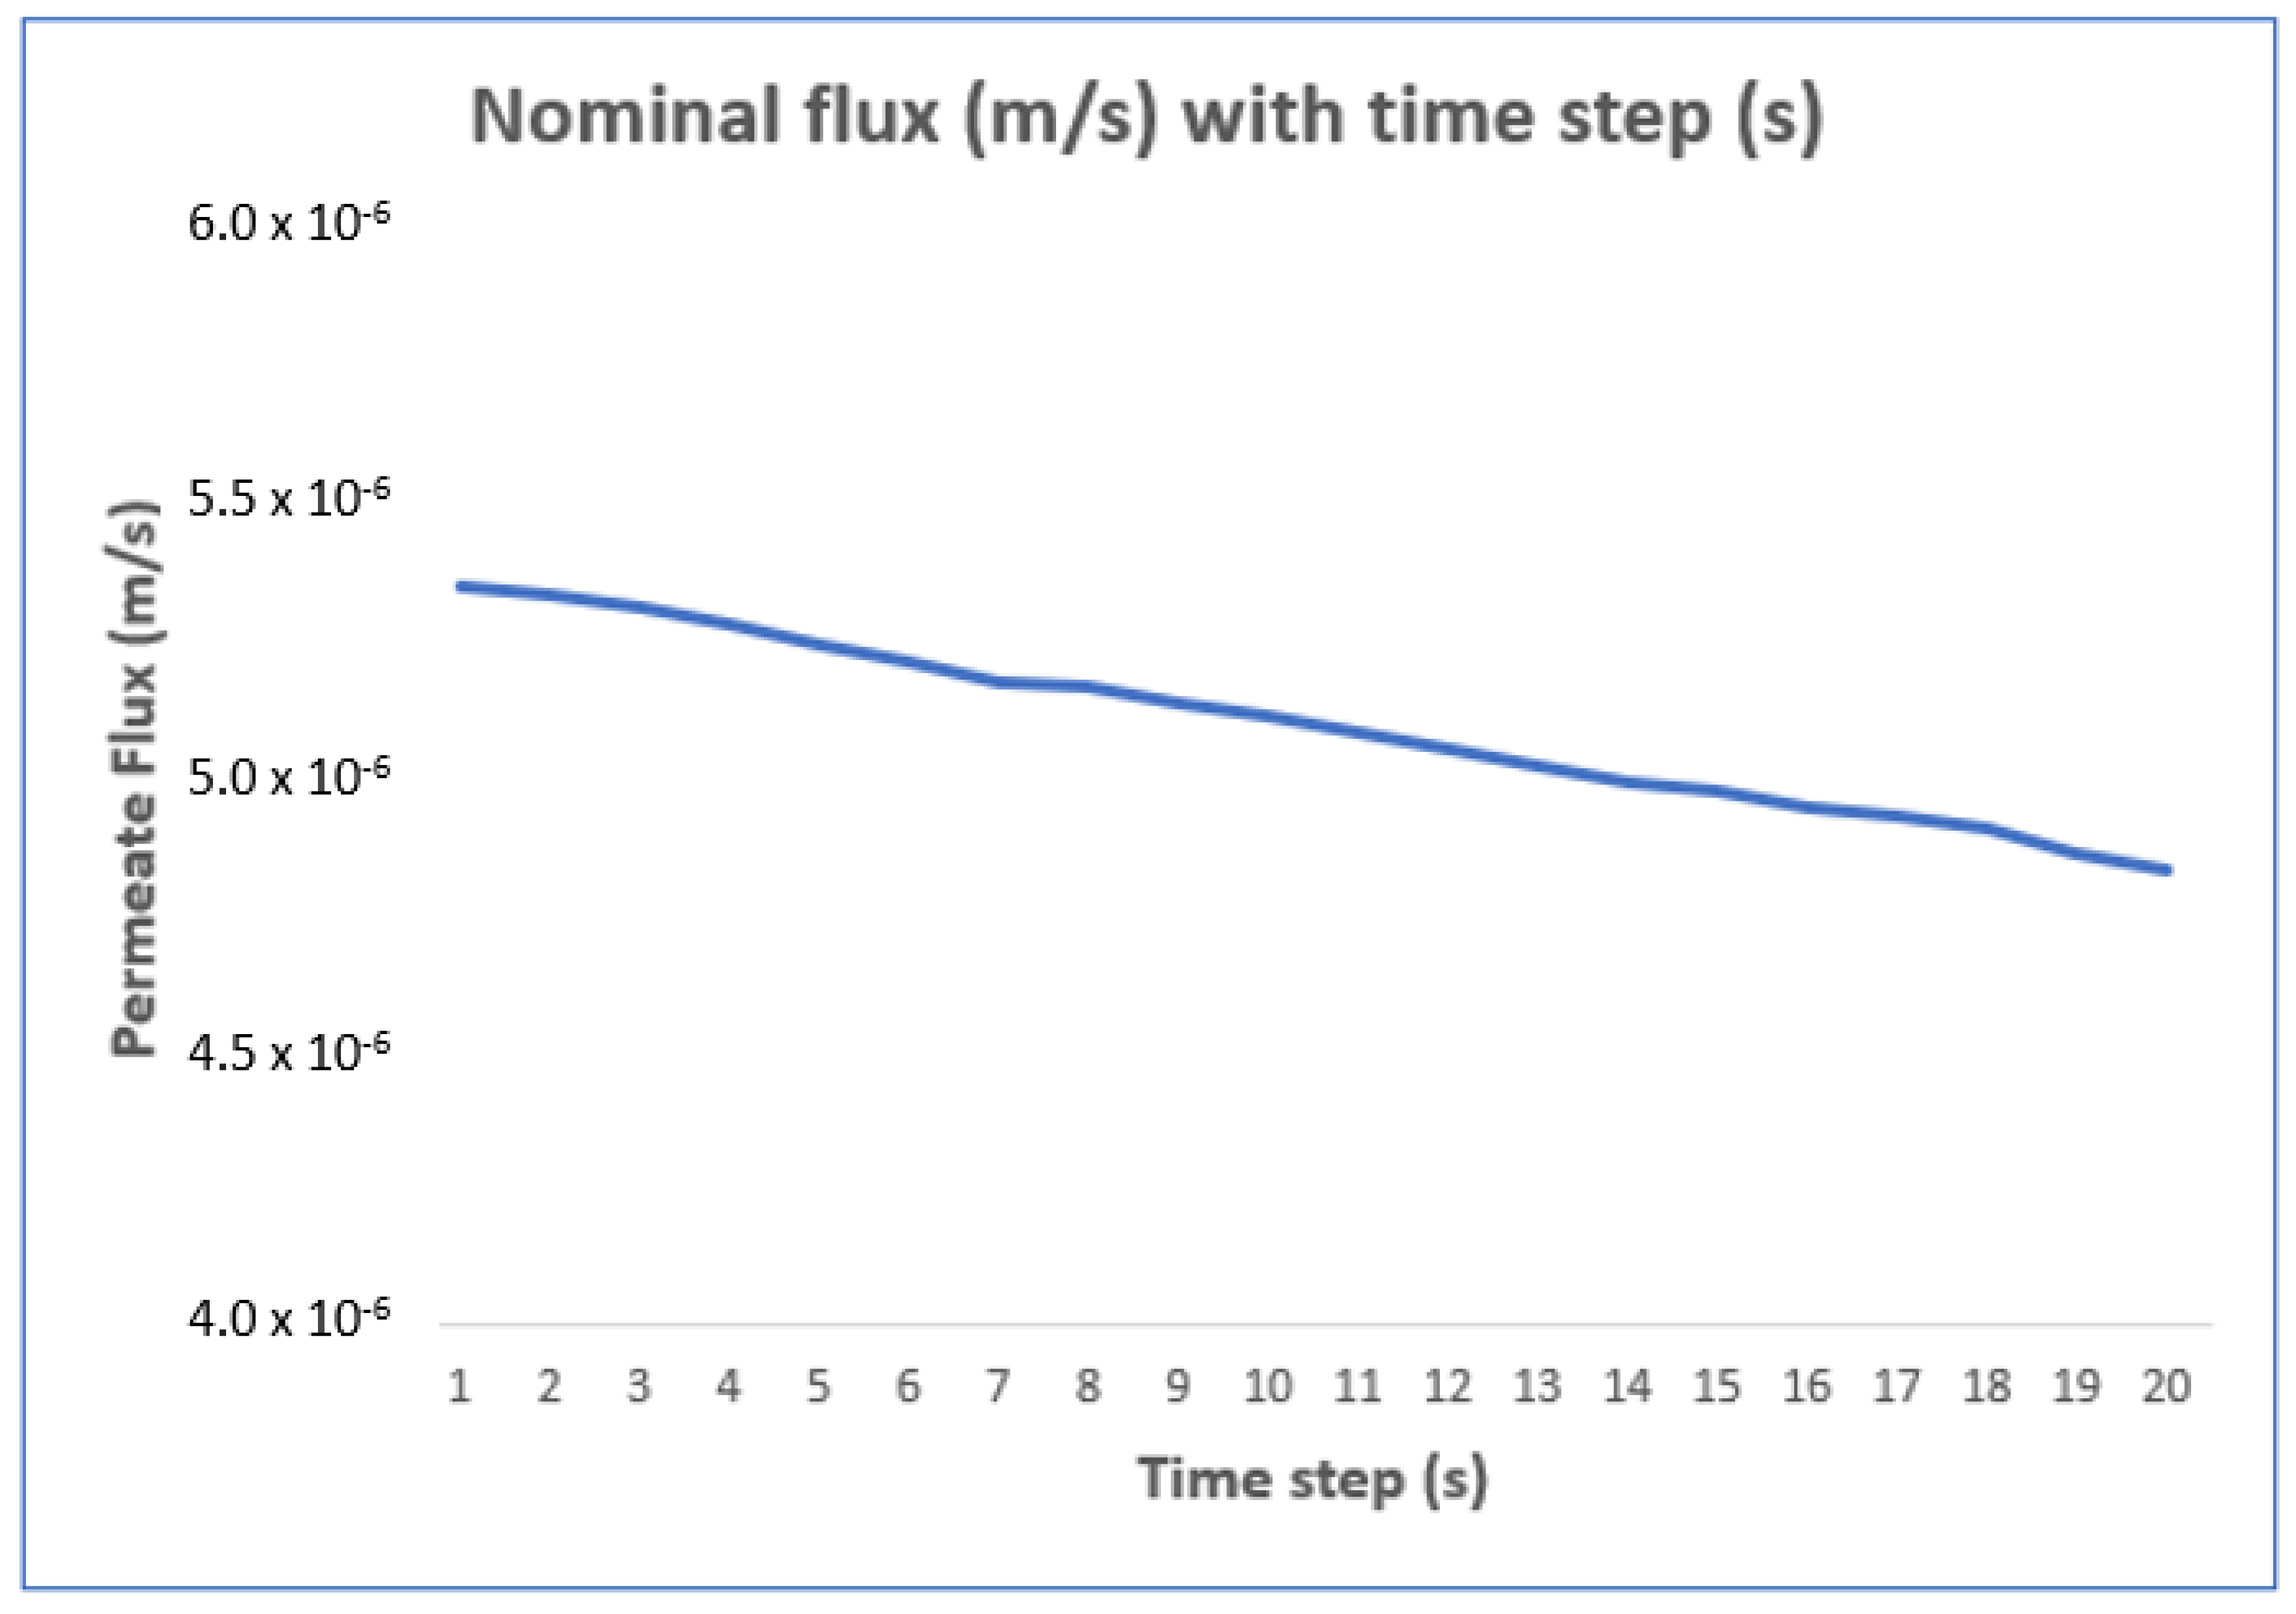
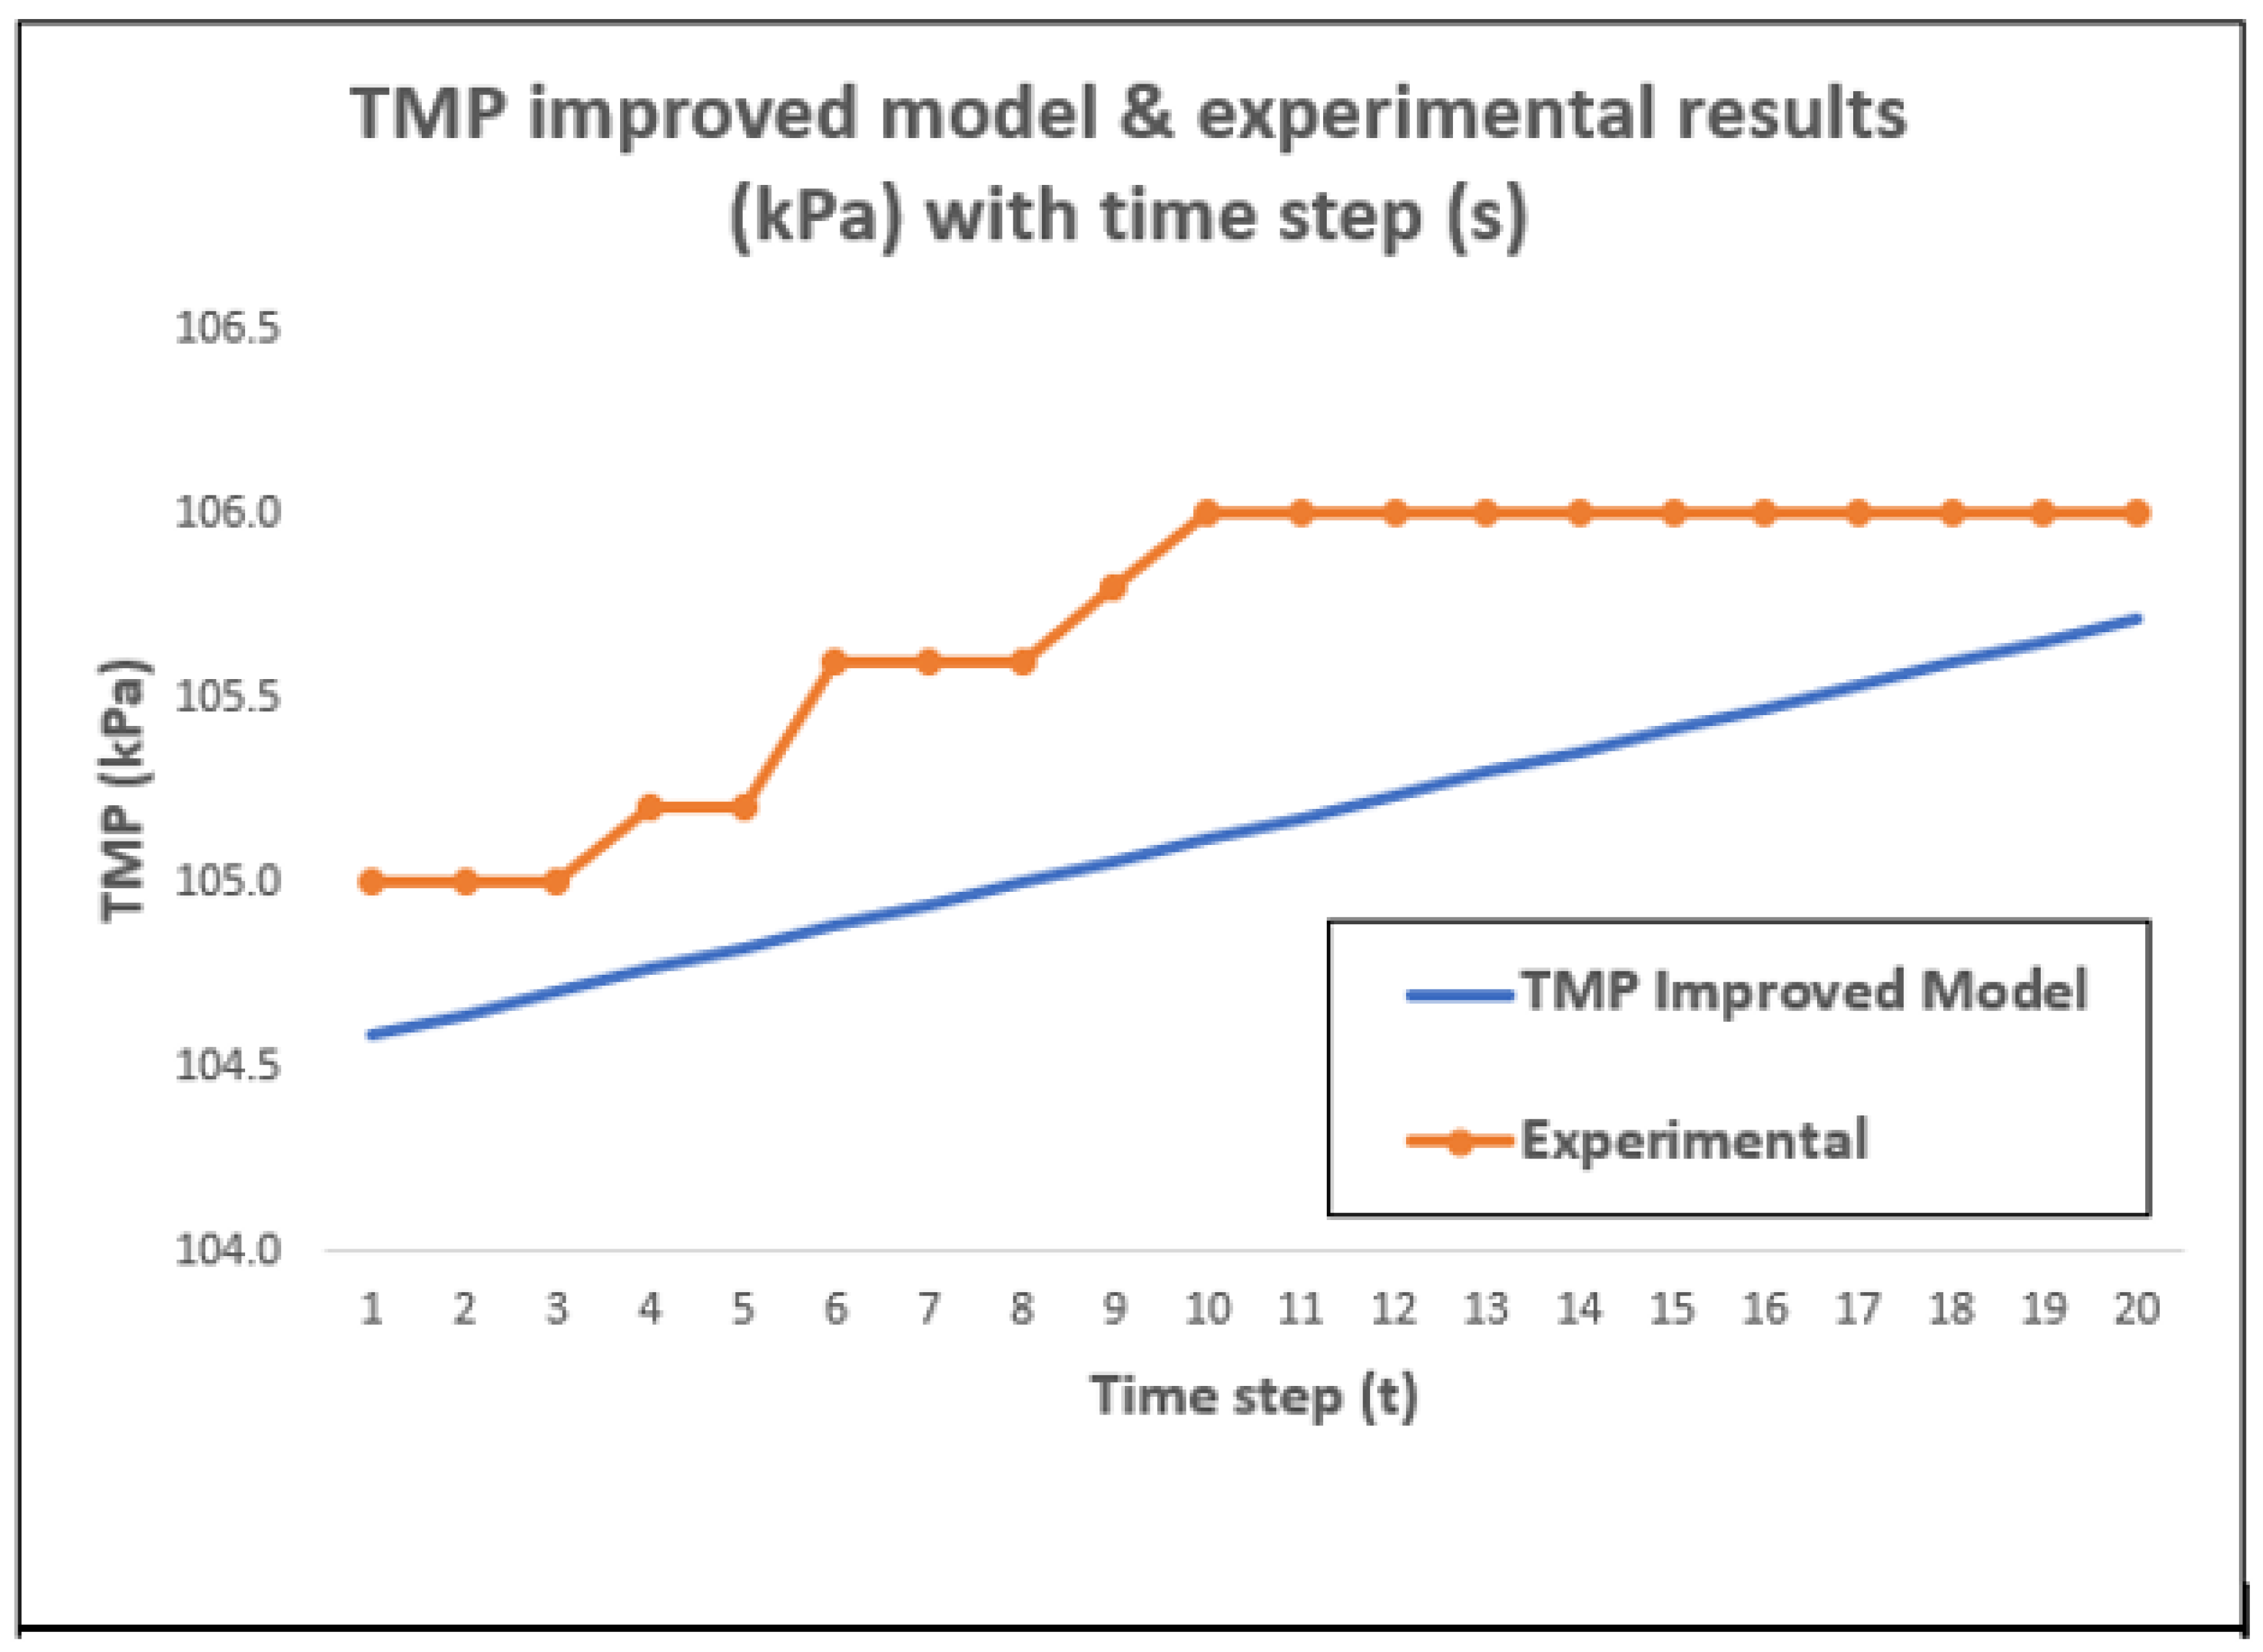
4.2. TMP Change with Time Using the Improved Model
4.3. Commercial Viability, Sustainability, System Scalability, and Limitations
5. Conclusions
Author Contributions
Funding
Data Availability Statement
Acknowledgments
Conflicts of Interest
References
- UN. Sustainable Development Goals. Goal 6: Ensure Access to Water and Sanitation for All. 2023. Available online: https://www.un.org/sustainabledevelopment/water-and-sanitation/ (accessed on 10 December 2024).
- GBD 2016 Diarrhoeal Disease Collaborators. Estimates of the global, regional, and national morbidity, mortality, and aetiologies of diarrhoea in 195 countries: A systematic analysis for the Global Burden of Disease Study 2016. Lancet Infect. Dis. 2018, 18, 1211–1228. [Google Scholar] [CrossRef] [PubMed]
- WHO. WHO Mortality Database. 2024. Available online: https://platform.who.int/mortality/countries/country-details/MDB/malaysia (accessed on 10 December 2024).
- WHO. SDG Target 6.1|Drinking Water. World Health Organization. 2024. Available online: https://www.who.int/data/gho/data/themes/topics/indicator-groups/indicator-group-details/GHO/sdg-target-6.1-drinking-water (accessed on 10 December 2024).
- UNICEF. Progress On Household Drinking Water Sanitation; UNICEF: New York, NY, USA, 2021. [Google Scholar]
- Norizam, S.S.; Hussain, M.A.; Junaidi, M.U.M. Enhanced modelling and experimental validation of ultra-low pressure reverse osmosis membrane system for treatment of synthetic brackish water. Water Sci. Technol. 2021, 84, 3372–3387. [Google Scholar] [CrossRef] [PubMed]
- Yang, J.; Monnot, M.; Eljaddi, T.; Ercolei, L.; Simonian, L.; Moulin, P. Ultrafiltration as tertiary treatment for municipal wastewater reuse. Sep. Purif. Technol. 2021, 272, 118921. [Google Scholar] [CrossRef]
- Chew, C.M.; Aroua, M.K.; Hussain, M.A.; Ismail, W.M.Z.W. Evaluation of ultrafiltration and conventional water treatment systems for sustainable development: An industrial scale case study. J. Clean. Prod. 2016, 112, 3152–3163. [Google Scholar] [CrossRef]
- Glover, F.A.; National Institute for Research in Dairying. Ultrafiltration and Reverse Osmosis for the Dairy Industry; Technical bulletin (National Institute for Research in Dairying (Great Britain)); National Institute for Research in Dairying: Reading, UK, 1985. [Google Scholar]
- Huang, Y.F.; Ang, S.Y.; Lee, K.M.; Lee, T.S. Quality of water resources in Malaysia. Res. Pract. Water Qual. 2015, 3, 65–94. [Google Scholar]
- Chew, C.M.; Aroua, M.K.; Hussain, M.A.; Ismail, W.M.Z.W. Practical performance analysis of an industrial-scale ultrafiltration membrane water treatment plant. J. Taiwan Inst. Chem. Eng. 2015, 46, 132–139. [Google Scholar] [CrossRef]
- Venkatesha, R.; Rao, A.; Kedare, S.B. Portable Water Purifiers; Centre for Technology Alternatives for Rural Areas (CTARA), Indian Institute of Technology Bombay: Mumbai, India, 2014. [Google Scholar] [CrossRef]
- Akshay, P.; Shreekanth, S.; Rajesh, R.; Prasad, G. Portable and efficient graphene-oxide based multistage filtration unit for water purification. Mater. Today Proc. 2020, 26, 2344–2350. [Google Scholar] [CrossRef]
- El-Harbawi, M. Design of a portable dual purposes water filter system. J. Eng. Sci. Technol. 2010, 5, 165–175. [Google Scholar]
- Arnala, J.; Sancho, M.; García-Fayos, B.; Lora, J.; Verdú, G. UF-designed facility location protocol for a potable water treatment in developing countries. Desalination 2006, 200, 322–324. [Google Scholar] [CrossRef]
- PAUL. PAUL Waterbackpack. 2024. Available online: http://waterbackpack.org (accessed on 10 December 2024).
- LG. LG. 2024. Available online: https://www.lg.com/my/water-purifiers (accessed on 10 December 2024).
- COWAY. COWAY (MALAYSIA). 2024. Available online: https://www.coway.com.my/about#marketshare (accessed on 10 December 2024).
- Cuckoo. Cuckoo Water Purifiers—Beyond Drinking Water. 2024. Available online: https://www.cuckoo.com.my/products/water-purifiers (accessed on 10 December 2024).
- Chew, C.M.; Aroua, M.K.; Hussain, M.A. Advanced process control for ultrafiltration membrane water treatment system. J. Clean. Prod. 2018, 179, 63–80. [Google Scholar] [CrossRef]
- Amgo. Amgo. Available online: https://www.amgo.com.my/?q=product_sub&pc=13 (accessed on 10 December 2024).
- Li, P.; Yang, J.; He, Y.; He, M.; Ma, J. Preparation of efficient and durable ultrafiltration membranes based on supramolecular assembly enhanced surface separation method. Chem. Eng. J. 2023, 475, 145842. [Google Scholar] [CrossRef]
- Yang, C.; Zhang, Z.; Wang, P.; Xu, P.; Shen, T.; Wang, M.; Zheng, Q.; Zhang, G. Ultrathin g-C3N4 composite Bi2WO6 embedded in PVDF UF membrane with enhanced permeability, anti-fouling performance and durability for efficient removal of atrazine. J. Hazard. Mater. 2023, 451, 131154. [Google Scholar] [CrossRef] [PubMed]
- Ariffin, A. Performance Testing of A Portable Ultrafiltration System to Maintain Water Quality Through Modelling and Experimental. Master’s Thesis, Department of Chemical Engineering, Universiti Malaya, Kuala Lumpur, Malaysia, 2024; p. 113. [Google Scholar]
- Siddique, A.; Yaqoob, A.A.; Mirza, M.A.; Kanwal, A.; Ibrahim, M.N.M.; Ahmad, A. Chapter 14—Potential use of ultrafiltration (UF) membrane for remediation of metal contaminants. In Emerging Techniques for Treatment of Toxic Metals from Wastewater; Ahmad, A., Kumar, R., Jawaid, M., Eds.; Elsevier: Amsterdam, The Netherlands, 2023; pp. 341–364. [Google Scholar] [CrossRef]
- Meng, S.; Zhang, M.; Yao, M.; Qiu, Z.; Hong, Y.; Lan, W.; Xia, H.; Jin, X. Membrane fouling and performance of flat ceramic membranes in the application of drinking water purification. Water 2019, 11, 2606. [Google Scholar] [CrossRef]
- Kanani, D.M.; Ghosh, R. A constant flux based mathematical model for predicting permeate flux decline in constant pressure protein ultrafiltration. J. Membr. Sci. 2007, 290, 207–215. [Google Scholar] [CrossRef]
- Ghosh, R. Study of membrane fouling by BSA using pulsed injection technique. J. Membr. Sci. 2002, 195, 115–123. [Google Scholar] [CrossRef]
- Demirci, K.; Zungur-Bastıoğlu, A.; Görgüç, A.; Bayraktar, B.; Yılmaz, S.; Yılmaz, F.M. Microwave irradiation, evolutionary algorithm and ultrafiltration can be exploited in process intensification for high-purity and advanced inulin powder production. Chem. Eng. Process.-Process Intensif. 2023, 194, 109565. [Google Scholar] [CrossRef]
- Fogel, L.J. Intelligence Through Simulated Evolution: Forty Years of Evolutionary Programming; John Wiley & Sons, Inc.: Hoboken, NJ, USA, 1999. [Google Scholar]
- Fogel, D.B. The evolution of intelligent decision making in gaming. Cybern. Syst. 1991, 22, 223–236. [Google Scholar] [CrossRef]
- Kumar, R.; Ismail, A. Fouling control on microfiltration/ultrafiltration membranes: Effects of morphology, hydrophilicity, and charge. J. Appl. Polym. Sci. 2015, 132, 42042. [Google Scholar] [CrossRef]
- Holman, S.R.; Ohlinger, K.N. An evaluation of fouling potential and methods to control fouling in microfiltration membranes for secondary wastewater effluent. WEFTEC Water Environ. Fed. 2007, 2007, 6417–6444. [Google Scholar] [CrossRef]
- Helmenstine, A. Sources of Error in Science Experiments. 2024. Available online: https://sciencenotes.org/error-in-science/ (accessed on 10 December 2024).
- Drouiche, M.; Lounici, H.; Belhocine, D.; Grib, H.; Piron, D.; Mameri, N. Economic study of the treatment of surface water by small ultrafiltration units. Water SA 2004, 27, 199–204. [Google Scholar] [CrossRef]
- Ikhlef, S. Backwash Optimization for Drinking Water Treatment Biological Filters; Carleton University: Ottawa, ON, Canada, 2016. [Google Scholar]
- Zhang, B.; Kotsalis, G.; Khan, J.; Xiong, Z.; Igou, T.; Lan, G.; Chen, Y. Backwash sequence optimization of a pilot-scale ultrafiltration membrane system using data-driven modeling for parameter forecasting. J. Membr. Sci. 2020, 612, 118464. [Google Scholar] [CrossRef]


| Classification | Description |
|---|---|
| Portable Unit | Lighter and smaller in size, suitable for single users. It provides drinkable water for individual use. |
| Mobile Unit | Big in size and a more substantial unit. It is installed on a vehicle and can have a size range from a bicycle to a huge truck or a vessel. |
| Modular Unit | This unit cannot be transported or moved to new locations without being dismantled and reassembled from the parts at the new locations. |
| Product |  |  |  | 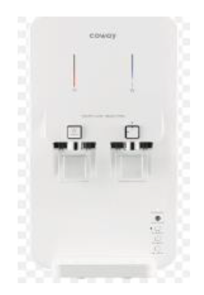 | 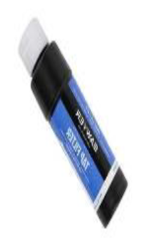 | 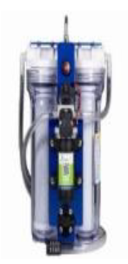 | 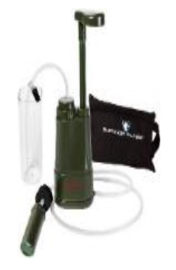 |
| Name | LG Puri Care | Cuckoo Grande | Panasonic UF Alkaline | Coway Neo | Sawyer | Portawell | Survivor Filter PRO |
| Process | UF Membrane | Nano Membrane Filter | UF Membrane | RO Membrane Filter | Micro Filtration Membrane | Ceramic Membrane | UF Membrane |
| Type | 4-Stage Filtration | 3-Stage Filtration | 4 Stages of Filtration | 3-Stage Filtration | Tap Filter Type | 2 Stages of Filtration | Pump-Typed |
| Filter Capacity | 2 L per Minute | Tank Capacity: 7.6 L | 6000 L Capacity | Tank Capacity: 5.8 L | 1900 L/Day | 230 L per Hour | 0.5 L per Minute |
| Weight | 6 kg | 18.5 kg | 3.8 kg | 18 kg | 0.15 kg | 4.54 kg | 0.36 kg |
| Bacteria Removal | Yes | Yes | Yes | Yes | Yes | Yes | Yes |
| Item | Description |
|---|---|
| Material of Shell | 304 Stainless Steel (food-Grade) |
| Intake Pressure | 1 to 3 Bar |
| Intake Temperature | 5 to 45 °C |
| Filtration Precision | 0.01 Micron |
| Inlet/Outlet Size (Inch) | 0.5 Inches |
| Backwash Mode | Manual |
| Membrane Service Life | 3 Years (Depending on Water Quality) |
| Filtration Technology | Ultrafiltration (UF) |
| Soil Weight in 60 L Water (g) | Concentration (g/L) | Turbidity (NTU) |
|---|---|---|
| 10 | 0.167 | 17.22 |
| 15 | 0.250 | 25.30 |
| 20 | 0.333 | 35.60 |
| 30 | 0.500 | 51.30 |
| No. | Equation | Description |
|---|---|---|
| 1 | To measure the transmembrane pressure (kPa) | |
| 2 | To measure the volumetric permeate flux ) | |
| 3 | To measure the fouling resistance (kPa s/m) | |
| 4 | To measure the permeate flux decline in constant-pressure UF | |
| 5 | To measure the permeate flux decline in constant-pressure UF |
| Particles | Description |
|---|---|
| Particle 1 | Rm0 (Membrane Hydraulic Resistance (kPa s/m)) |
| Particle 2 | Rmx (Initial Rapid Fouling Constant (kPa s/m)) |
| Particle 3 | k (Mass Transfer Coefficient ) |
| Particle 4 | Cb (Foulant Bulk Concentration ) |
| Parameter Values | Particle 1 | Particle 2 | Particle 3 | Particle 4 | TMP |
|---|---|---|---|---|---|
| Nominal Values | 1.40 × 10⁶ | 3.86 × 10⁵ | 9.95 × 10⁻⁶ | 0.3729 | 105 |
| Improved Values | 1.47 × 10⁶ | 2.68 × 10⁴ | 9.22 × 10⁻⁶ | 0.0052 | 105 |
Disclaimer/Publisher’s Note: The statements, opinions and data contained in all publications are solely those of the individual author(s) and contributor(s) and not of MDPI and/or the editor(s). MDPI and/or the editor(s) disclaim responsibility for any injury to people or property resulting from any ideas, methods, instructions or products referred to in the content. |
© 2024 by the authors. Licensee MDPI, Basel, Switzerland. This article is an open access article distributed under the terms and conditions of the Creative Commons Attribution (CC BY) license (https://creativecommons.org/licenses/by/4.0/).
Share and Cite
Ariffin, A.; Abdul Wahab, A.K.; Hussain, M.A. Modeling and Experimental Verification of In-House Built Portable Ultrafiltration (PUF) System to Maintain Water Quality. Processes 2024, 12, 2926. https://doi.org/10.3390/pr12122926
Ariffin A, Abdul Wahab AK, Hussain MA. Modeling and Experimental Verification of In-House Built Portable Ultrafiltration (PUF) System to Maintain Water Quality. Processes. 2024; 12(12):2926. https://doi.org/10.3390/pr12122926
Chicago/Turabian StyleAriffin, Azman, Ahmad Khairi Abdul Wahab, and Mohd Azlan Hussain. 2024. "Modeling and Experimental Verification of In-House Built Portable Ultrafiltration (PUF) System to Maintain Water Quality" Processes 12, no. 12: 2926. https://doi.org/10.3390/pr12122926
APA StyleAriffin, A., Abdul Wahab, A. K., & Hussain, M. A. (2024). Modeling and Experimental Verification of In-House Built Portable Ultrafiltration (PUF) System to Maintain Water Quality. Processes, 12(12), 2926. https://doi.org/10.3390/pr12122926