Article

Novel Scaling Prediction Model for Gathering and Transportation Station in Changqing Oilfield

1
No. 2 Oil Production Plant of PetroChina Changqing Oilfield Branch, Qingyang 745100, China
2
No. 11 Oil Production Plant of PetroChina Changqing Oilfield Branch, Qingyang 745100, China
3
Academy of Artificial Intelligence, Beijing Institute of Petrochemical Technology, Beijing 102617, China
4
College of Energy and Mining Engineering, Shandong University of Science and Technology, Qingdao 266590, China
*
Author to whom correspondence should be addressed.
Processes 2024, 12(12), 2915; https://doi.org/10.3390/pr12122915
Submission received: 16 November 2024 / Revised: 14 December 2024 / Accepted: 18 December 2024 / Published: 19 December 2024

Abstract

:
Scaling is a significant challenge in oilfield production gathering and transportation stations, and it not only constrains the economic efficiency but also affects the development of oil and natural gas. This study proposes a scaling prediction model based on chemical experimental analysis and reservoir dynamic analysis methods for the gathering and transportation stations in the Changqing Oilfield. The objective of this study is to provide technical support for the oilfield to advance precise management and achieve cost reduction and efficiency enhancement. Initially, the water quality and scale samples of the oilfield were tested and analyzed using Inductively Coupled Plasma (ICP), Ion Chromatography (IC), and Scanning Electron Microscopy-Energy Dispersive Spectroscopy (SEM-EDS), and the distribution and patterns of scaling in the gathering and transportation pipelines were studied. Based on this, using the test data and the production liquid ratio of each development layer at the gathering and transportation stations, a reservoir dynamic correlation method was employed to construct a prediction model for the development layer with the highest similarity to the tested water samples at the stations and the types of scale samples. The results indicate that this prediction method can effectively reduce the scaling rate and provide guidance for the anti-scaling process in the Changqing Oilfield.

1. Introduction

With the development of oilfields, the comprehensive water cut continues to rise, and factors such as incompatibility between formation water and injected water lead to a large amount of scaling in gathering pipelines and stations. Scaling prevention and control in oilfields has become one of the main challenges in oilfield development and production [1]. Scaling in oilfield gathering and transportation stations is mainly concentrated in the main control valves, the inlet and outlet pipelines of the heater, and the heater coils, etc., with severe scaling in multi-layer mixed transportation and oil wells where injection water is seen at the station. Affected by water injection development, the scaling characteristics of each layer system station are different, which greatly increases the difficulty of scaling prevention and control in gathering and transportation stations. Scaling in the oilfield gathering system pipelines not only blocks the pipelines but also reduces the heat transfer efficiency of heat transfer equipment, and at the same time, it can also lead to pipeline corrosion, perforation, and even cause production shutdowns and other huge losses. How to effectively prevent or reduce the occurrence of scaling in oilfield gathering and transportation stations is of great significance to the normal production of oilfields and cost savings.
At present, oilfields and researchers mainly study how to control the generation of scaling products in terms of three aspects, including the study of scaling mechanism, chemical scaling prevention technologies, and mechanical processes to remove scales. Research on scaling mechanisms is very important for scaling prediction, scaling prevention technology, and the selection of scaling removal measures. Zhang et al. (2022) [2] and Su et al. (2024) [3] studied the scaling mechanisms of the wellbore in Huanjiang Oilfield and Sulige Oilfield by testing and analyzing the water quality and scaling types in the target areas, respectively. This research shows that, under the combined action of formation temperature, pressure, and ion concentration, different types of scale show different scaling trends. Abdulhussein et al. (2023) [4] discussed the impact of the environment in preheating pipelines on scaling and analyzed it according to different crude oil mixing ratios. Chemical scaling prevention technologies mainly achieve scaling prevention through chelating solubilization, dispersion, crystal lattice distortion, and the synergistic effects of chemical reagents [5]. Li et al. (2022) systematically studied the influence of chemical inhibitors (including polyacrylic acid, sodium hexametaphosphate, 2-phosphonobutane-1,2,4-tricarboxylic acid, and diethylene triamine penta-methylene phosphonate) on the scaling behavior of calcium carbonate crystals through scaling tests and dynamic adsorption experiments (monitoring dissipation with a quartz crystal microbalance) [6]. Mady et al. (2020) studied the application of nanomaterials and technologies such as nanoemulsions, nanoparticles, magnetic nanoparticles, polymer nanocomposites, and carbon nanotubes in oilfield scaling control. The research results show that nanotechnology can change the form of scaling substances, making the scale easier to remove. Mechanical scaling removal usually involves physical methods, such as using physical phenomena, such as electricity, magnetism, and ultrasonic waves, to interact with the scale body to achieve the purpose of scaling removal. Leal et al. (2009) developed a new mechanical scaling removal method for the high-pressure and high-temperature Khuff Gas Field using gas wells which successfully removed nearly three tons of iron sulfide deposits from the oil pipes and casings of the gas wells [7]. Zhang et al. (2024) developed a mechanical, ultrasonic chemical-coupling demulsification and dehydration treatment process for aging oil in oilfields, which can effectively improve the oil recovery rate and reduce the water content of the recovered oil. Existing research results show that mechanical scaling removal is non-corrosive to equipment and non-polluting to the environment, but the equipment is relatively complex, the effective area is limited, and the effect on some hard scales is not obvious [8]. Although there are many analyses of water samples and scaling substances at gathering stations, there are still limited studies on scaling control in the Changqing Oilfield, especially for the prediction of scaling products at gathering stations.
The objective of this study was to carry out research on the scaling patterns of gathering and transportation stations based on the analysis of water quality, ground pipeline scale samples, and scaling distribution in the gathering pipelines of the Changqing Oilfield, and to construct a scaling prediction model to provide guidance for the anti-scaling process matching at oilfield gathering station sites.

2. Oilfield Description

Changqing Oilfield is one of the largest oil and gas fields in China [9], located in the Ordos Basin, spanning five provinces and regions, including Shaanxi, Gansu, Ningxia, Inner Mongolia, and Shanxi, with a total exploration area of approximately 370,000 square kilometers. The oilfield has formed multiple development layers, mainly including the Jurassic Yan 9 and Yan 10, as well as the Triassic Chang 4 + 5, Chang 6, and Chang 8. Based on the principles of high efficiency and energy conservation, its crude oil gathering and transportation system adopts a mixed gathering and transportation treatment method of different layers of crude oil, which saves a lot of investment [10]. However, due to the different physical properties of formation water and crude oil, the problem of pipeline scaling and blockage caused by mixed gathering and transportation has become increasingly prominent, resulting in pipeline blockage, reduced oil and gas production, high back pressure of well clusters, and insufficient injection of water wells, affecting normal production operation. In severe cases, pipeline blockage and even pipeline leakage may occur, causing environmental pollution. Scaling at gathering and transportation stations can cause damage to equipment, such as the main unit, heating furnace, and export pump, reduce system operating efficiency, and increase equipment maintenance costs. Among them, stations such as H-1, HZ-1, and HZ-35 have more severe scaling, with an average scaling rate of 13 mm/a and an average frequency of physical cleaning of 1.4 times/year. The stations frequently hold pressure, resulting in high cleaning costs and risks, which seriously affect the safety production and economic benefits of the gathering and transportation station system.
In addition to the mismatch of the produced fluids in each layer, the reservoir temperature in Changqing Oilfield is relatively high (usually greater than 80 °C), and the temperature of the produced fluids gradually decreases during the gathering and transportation process, resulting in a decrease in the solubility of metal salt ions and a significant tendency towards scaling. During the process of gathering and transporting pipelines, these sediments settle at slow flow points such as bends in the gathering and transporting pipelines. After preliminary research, it was found that the produced fluid in Changqing Oilfield contains a large amount of bicarbonate. As the exposed metal area increases, the corrosion below the sediment will also become more severe. A large amount of iron containing sediments adhere to the gathering and transportation pipelines and the inner walls of oil wells, causing the internal channels of the pipelines to become smaller and leading to blockages in the gathering and transportation pipelines. The adhesion of sediment increases the roughness of the inner wall of the pipeline, promotes the adhesion of a large amount of scaling products, accelerates the rate of scaling formation, and exacerbates pipeline blockages.
Therefore, focusing on the severe scaling issues within the Changqing Oilfield’s gathering and transportation station system, this study aims to elucidate scaling mechanisms and key influencing factors. By developing a predictive model for scaling in these stations, this study offers vital technical insights for anti-scaling measures across the entire plant’s gathering and transportation facilities. This endeavor is crucial for enhancing both the operational safety and economic efficiency of the oilfield.

3. Data Preparation

Data form an important foundation for building scale prediction models for gathering and transportation stations, and the quality of data directly determines the effectiveness and accuracy of model predictions. The data source for the scale prediction model of this research site includes three parts: the production data of oilfield layers (such as liquid production of each layer), the detection and analysis results of scale samples from different oil production wells (100 samples), and the detection and analysis data of scale samples from different gathering and transportation stations (120 samples). The detection and analysis data of water samples and scale samples were obtained through methods such as inductively coupled plasma atomic emission spectroscopy (ICP), ion chromatography (IC), energy dispersive spectroscopy (EDS) combined with scanning electron microscopy (SEM) to detect the scale samples of water samples from four operating areas, accessing the different development layers, and using different sites in Changqing Oilfield, including the main structure, heating furnace, collection tube, and export pump.

4. Methodologies

4.1. Materials

All water samples and scale samples were sampled and provided from the Changqing Oilfield, which includes 100 injection/formation water samples from different payzones, 120 scale samples from wellbore, 31 water samples, and 25 scale samples from the oil gathering and transportation system.

4.2. Composition Analysis of Water and Scale

This study predicts the scaling trend at different locations and sites by detecting and analyzing water quality and scale samples from different sites. The water quality testing method used by the research institute is based on the Chinese petroleum and natural gas industry standards SY/T 5523-2016 [11] and SY/T 5329-2012 [12]. The ion content in the water sample was determined by inductively coupled plasma atomic emission spectroscopy (ICP) from Optima and ion chromatography (IC) from Thermo Scientific which analyzed the water quality of the water sample. The detailed description about IC can be found in our previous work [2]. The water type is classified based on the Sulin classification method, which links the chemical composition of water samples with their station locations, and represents different station locations with different water types. Different site scale samples were analyzed for the types and contents of elemental components in the material’s micro area using an energy dispersive spectrometer (EDS, from HITACHI) combined with a scanning electron microscope (SEM, from FEI). The scale sample analysis test example is shown in Figure 1. The top row in Figure 1 shows the SEM results, while the bottom row shows the EDS test results. The horizontal axis of the EDS graph represents energy, and the vertical axis represents the count/quantity of each detected element. Different peaks represent the number of elements detected at different energies, and the more there are, the higher the content of that element in the scale sample. From the EDS chart, it can be observed that the barium and strontium element contents are relatively high at all three sites. In addition, the iron element content is also relatively high in S-5. Therefore, the types of scale from left to right at the three sites in Figure 1 are barium strontium scale, barium strontium scale, and barium strontium scale associated with corrosion scale.

4.3. Scale Prediction Modeling

Scale sample prediction is crucial for screening efficient scale inhibitors. Considering the dynamic changes in oil well production at different stratigraphic sites, it is difficult to predict subsequent scale samples at the site by studying water samples and scale sample types at a certain stage. In response to this issue, this study established a scaling prediction method for gathering and transportation stations based on the production data of oilfield layers, water sample detection, analysis results of oilfield oil wells/production wells, scale sample detection, and analysis of data of water samples from different gathering and transportation stations. Figure 2 shows the flowchart for constructing the prediction model. Firstly, based on the on-site production data of the oil field, the development layers of the gathering and transportation oil wells at the site and the contribution ratio of each layer to the production fluid were clarified. Then, the ion concentration content of different development layer detected in the study area was calculated to determine the different ion concentration contents at the site. Furthermore, the reservoir dynamic correlation method was utilized to determine the development layer with the highest similarity to the site water sample, and, finally, the ‘Payzone-Scale’ charts were combined to predict the site scale type.

Reservoir Dynamic Correlation Method

The reservoir dynamic correlation method is a method or theory for studying the intrinsic correlation between things. Compared with other correlation methods (such as the grey correlation method) [13], this method requires that the degree of correlation between things will change with the development of things. However, the reservoir dynamic correlation method is more suitable for calculating the correlation degree between unknown water sample types and known water sample types at gathering stations. The specific steps for calculating the correlation coefficient are as follows:
Step 1: Calculation of ion concentration for water samples
Due to the gathering and transportation of crude oil from multiple development layers of oil wells at the same site, the ion concentrations of the site water samples are first determined based on the liquid production ratio of each development layer collected and transported at the site. The calculation formula for the concentration of various ions in water samples from gathering and transportation stations is as follows:
T i , k = j = 1 m R i , j S ( i , j , k )
where T i , k is the concentration of k ions in the water sample at station i , R i , j is the proportion of liquid production in layer j of the i station gathering and transportation system, S ( i , j , k ) is the concentration of k ions in layer j of station i , and m is the number of ion species measured at different layers.
Step 2: Correlation analysis between ion concentration T i of water sample at site i and ion concentration O r of the target water sample
The reservoir dynamic correlation method calculates the correlation degree R between known r target water sample types and unknown water samples at gathering and transportation stations:
R = [ R 1 ; R 2 ; R 3 ; R 4 ; R 5 R r ]
where:
R r = E T O r E T × E O r E T E T 2 × E O r E O r 2         r ( 1 , , n )
E T = 1 n i = 1 n T i
E O r = 1 n j = 1 n O r
E T = 1 n i = 1 n T i 2
E O r = 1 n j = 1 n O r 2
E T O r = 1 n i = 1 n T i × O r 2
R m a x = max   ( R )
In Formulas (2)–(9), the correlation degree between the unknown water sample at the gathering and transportation station and the r th target water sample type is denoted by R r ; T i is the ion concentration of the water sample at station i ; and O r is the ion concentration of the target water sample type k , which includes H C O 3 , C l , S O 4 2 , N a + , K + , M g 2 + , C a 2 + , B a 2 + and S r 2 + . R m a x is the water sample of the small layer close to the target water sample, which is the target water sample type. E T , E O r , E T , E O r , E T O r are all the transit parameters which are related to T i or O r .
From the above calculation process, it can be seen that the range of values for the correlation coefficient is −1 to 1. The larger the value, the better the correlation between the unknown water sample at the gathering station and the target water sample.
Step 3: Scale prediction
On the basis of clarifying the target water sample type, further prediction of scale samples is achieved based on the corresponding oil well scale sample result map of the target water sample.

5. Results and Discussion

5.1. Composition of Water and Scale Samples

At present, based on preliminary on-site research, sampling, and testing analysis (ICP/IC, SEM-EDS), the test results of 11 gathering stations and 31 water samples in the target oilfield have been obtained. Table 1 shows the test results of water samples (provided by Changqing Oilfield) from 11 different sites.
Based on the detection results of water quality components, according to the Sulin classification method, the water type could be obtained, as shown in Table 1. The analysis results showed that, except for the complex water type of the H-1 station, which contained two types of water, CaCl2 and NaHCO3, the water types of samples obtained at different locations at the same station were consistent.
Table 2 shows the test results and scale type analysis of 25 scale samples (provided by Changqing Oilfield). The scale sample test results indicate that, except for the calcium type scale, most other sites had barium strontium scale, accompanied by severe corrosion scale.

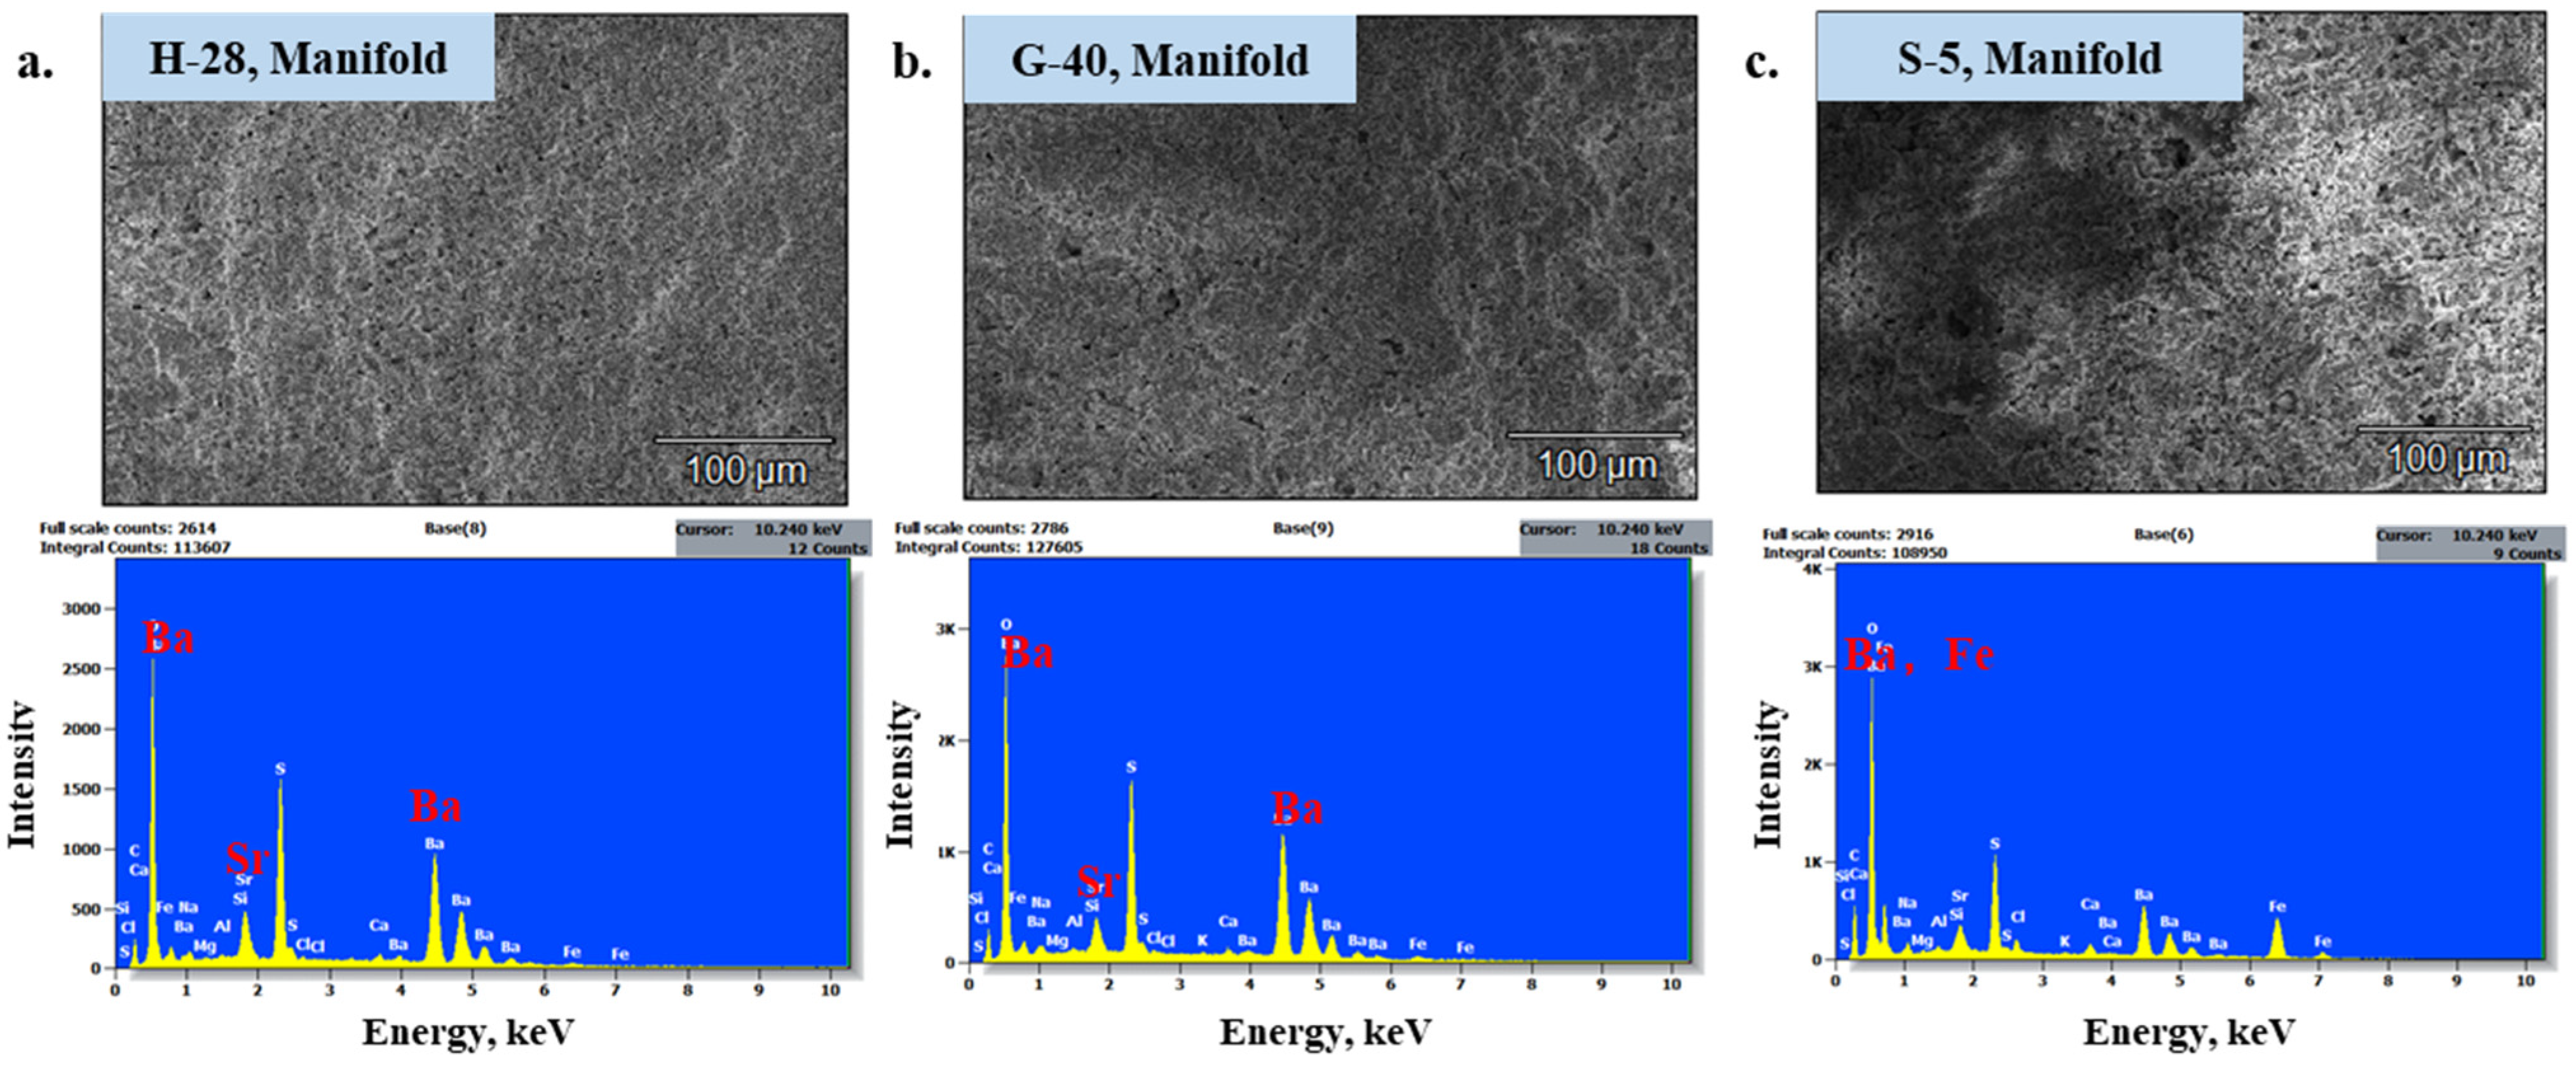
5.2. Scale Characteristics and Scale Mechanisms

Based on the analysis of the scale sample testing results, it was found that the types of scale formation in different layers were different. The main reason is that the types of scale formation in the station are greatly affected by the oil well development layer system, and the incompatible fluids lead to scale formation in the gathering and transportation station. Among them, the scaling of the extended layer system was mainly inorganic scaling, accounting for between 29% and 53%. The Yan’an Formation was mainly composed of paraffin scale and rust scale, accounting for 22% to 38%. The mixed layer system of Yan’an Formation and Yanchang Formation was mainly composed of barium scale, rust scale, and paraffin scale, accounting for 4% to 36% of the total scale types.
By comparing and analyzing the results of the scale sample testing at different nodes of the same site, it was found that the scale sample content showed a specific trend of variation among the main control station, pig receiver, heating furnace, buffer tank, and export pump. The content of inorganic scale showed an increasing trend from the main mechanism to the pig receiver. When it flows through the heating furnace, its content significantly increases, but gradually decreases in the subsequent process. The content of rust gradually increases from the main mechanism to the receiving cylinder and then to the heating furnace, and then gradually decreases. Paraffin (wax deposition) scale will decrease significantly when passing through the heating furnace, but gradually increases in the subsequent process. The variation of scale samples at different sites indicates that the scaling process is influenced by different equipment and conditions in the process, among which the heating furnace (temperature) plays a key role in the variation of scale content [14].

5.3. Scale Prediction

Due to the similar ion composition of water samples obtained from different locations at the same gathering and transportation station, it was mainly determined by the water samples from the development layer of the gathering and transportation oil wells. By testing 100 water samples and 120 scale samples from different payzones (previous work published in 2022 [2]), a ‘payzone-scale’ chart was established to lay the foundation for predicting scale types in subsequent stations. The following formula was used to analyze the variance of ion content in different water samples from the same development layer:
S 2 = X X ¯ 2 n 1
The water sample test results are shown in Table 3. It can be seen that the ion content and formation water salinity of water samples at the same formation were similar, with relatively small variances and belonging to the same category. Corresponding to the payzone, the research area can be divided into a total of 10 categories of water samples.
Based on the above analysis, the ion content distribution of water samples of the same category was obtained by taking the average of each ion. The ion content distribution of water samples of different categories is shown in Figure 3.
From Figure 3, it can be seen that the content of scale forming anions (HCO3) and scale forming cations (Ca2+) in the water of payzone Chang 4 + 5 to Chang 9 formation is high. During the gathering and transportation process, temperature and pressure changes led to a greater tendency for inorganic scale (CaCO3) to form. Meanwhile, each category contained a large amount of Na+, K+, Cl, and, during the gathering and transportation process, the temperature and pressure decreased, leading to the crystallization and precipitation of NaCl and KCl. In addition, the water type of the formation water in Yan 9 to Chang 6 was the CaCl2 type, and the water type of the injected water (fresh water) was Na2SO4. The incompatibility of fluids leads to a greater tendency for CaSO4 scaling.
Based on the classification of different types of water samples in the research area, the analysis results of scale components corresponding to different water sample types are shown in Figure 4.
From Figure 4, it can be seen that the scale samples from different payzones are mainly composed of barium strontium scale. In addition to barium strontium scale, Yan 6 to Yan 10 mainly consist of calcium type scale, supplemented by wax deposition scale, rust/corrosion scale, and NaCl and KCl crystal scale precipitated due to supersaturation caused by temperature and pressure changes. In addition to barium strontium scale, Chang 4 + 5 to Chang 9 mainly consist of wax deposition scale and corrosion scale, with a significant reduction in calcium type scale compared to the Yan’an Group. Based on the results of Figure 3 and Figure 4, a corresponding payzone-scale chart can be constructed.
After constructing the corresponding diagram of payzone and scale, based on the scale prediction model established in Section 4.3, the above diagram was validated using the example of the H-1 central processing facility. Figure 5 shows the process and results of scale sample prediction at the H-1 station. Firstly, by extracting and calculating the on-site production data of the oilfield, it was found that the H-1 station could collect and transport the produced water from eight payzones ranging from Yan 6 to Chang 9. After calculating the proportion of formation water collected and transported from each formation, the ion concentration of the water sample could be obtained based on Figure 3 and Formula (1). Based on the dynamic correlation analysis of oil reservoirs, the similarity between the water samples of the H-1 and various payzones could be calculated. Then, according to the corresponding chart of ‘payzone-scale’, it was predicted that the scale type of the H-1 is mainly barium scale, accompanied by corrosion scale and wax deposition. This result is consistent with the actual measured scale sample analysis results, proving the accuracy of the scale type prediction model.
The model has demonstrated the ability to handle data from multiple stations and samples, showing potential for incorporating more data as the oilfield expands. Its payzone categorization can be extended for broader understanding of scaling issues. It can adapt to analyze and predict scaling for new layers as they emerge, handling the complexity of evolving oilfield infrastructure. Moreover, it could scale up by incorporating additional relevant variables like chemical additives and flow rate variations to enhance prediction accuracy and widen its applicability.
In addition, accurate scale type prediction by the model helps implement preventive measures, reducing equipment maintenance costs and preventing system breakdowns or inefficiencies caused by scaling, thus saving operational costs in long-term. Predictions also enable more targeted chemical treatment, avoiding the overuse of chemicals to save costs and reduce the environmental impact. Additionally, its categorization and prediction abilities assist in better resource allocation, focusing resources on high-scaling-risk areas to maximize return on investment in scale management and maintain efficient oilfield operations.

6. Conclusions

Based on the analysis of water quality, surface pipeline scale samples, and scale distribution in the gathering and transportation stations, this study first conducted research on the scaling patterns in the gathering and transportation station. Based on the classification of water samples at the gathering and transportation station, a corresponding chart of water type/payzone and scaling type in the study area was formed, and a scaling prediction model was constructed, providing guidance for slowing down the structural rate and supporting anti-scaling processes at Changqing Oilfield. The research results mainly include the following:
(1)
Through testing and analysis of water and scale samples from gathering and transportation stations, it was found that for different gathering and transportation stations, the main type of scale sample is barium strontium scale, accompanied by corrosion scale. There are many barium strontium scales and corrosion scales in the main control station, and the heating furnace and export pump are mainly composed of corrosion scales, accompanied by barium strontium scales.
(2)
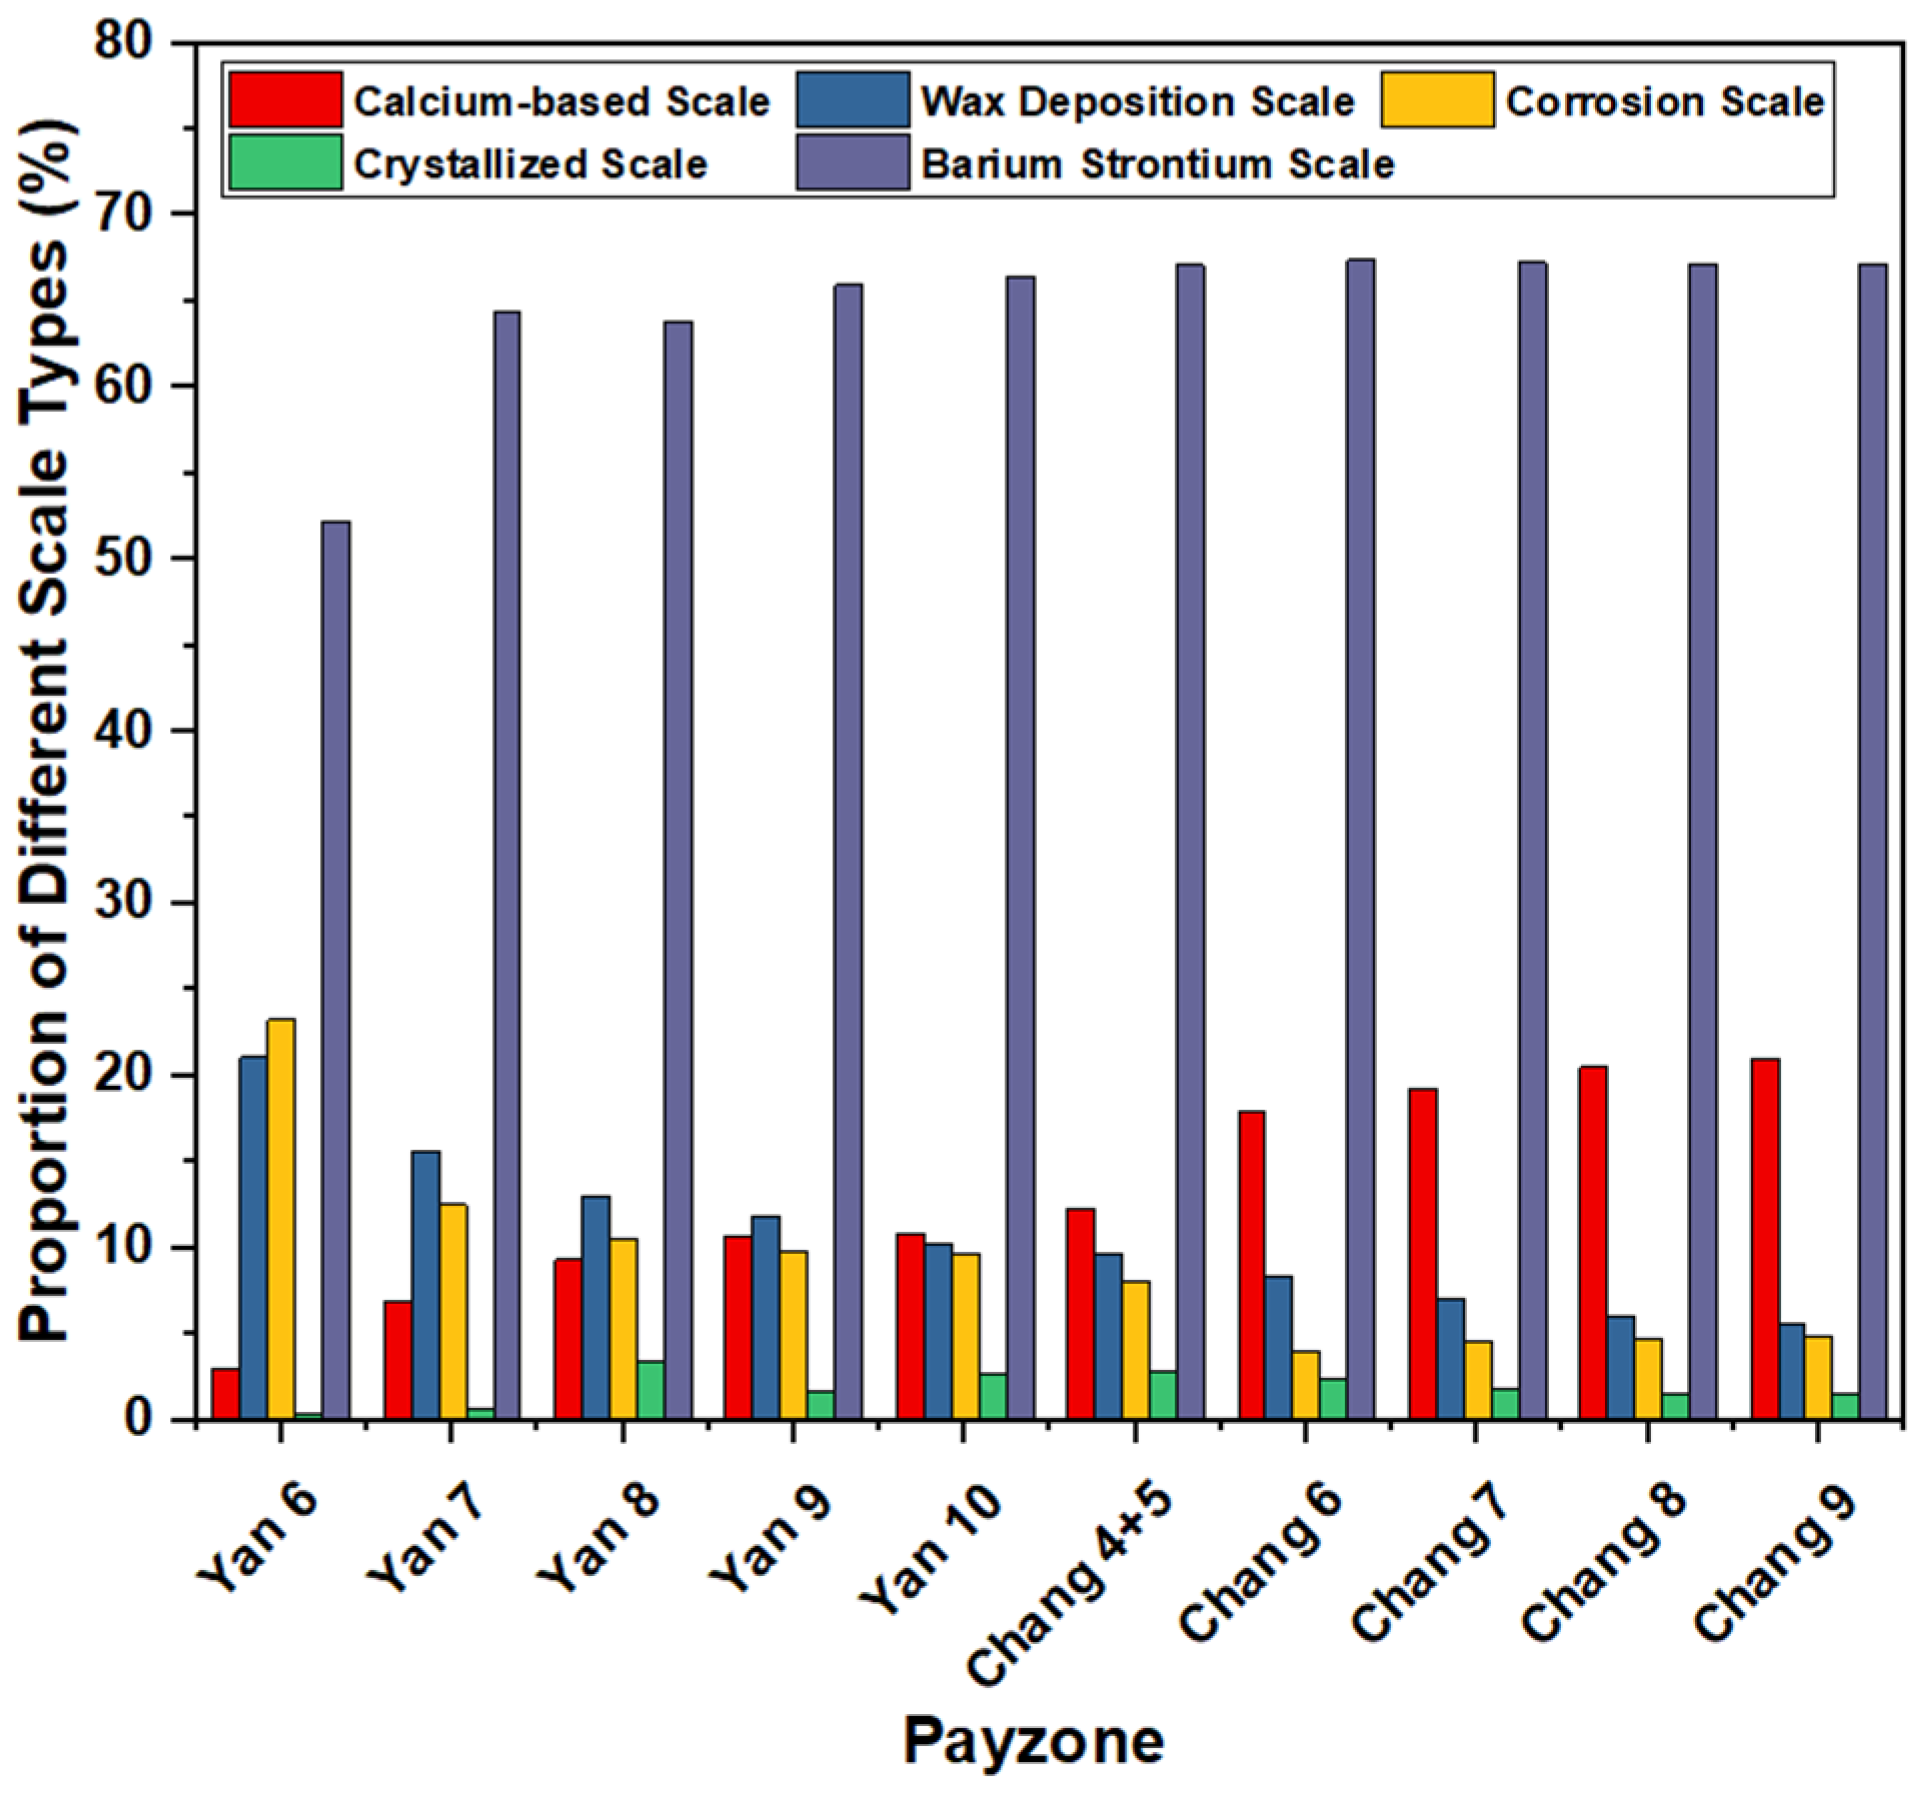
Based on the analysis results of 100 water samples, this study divided the water quality types of produced water in Changqing Oilfield into 10 categories, and analyzed a total of 120 corresponding scale samples. A ‘payzone-scale’ correspondence chart was constructed.
(3)
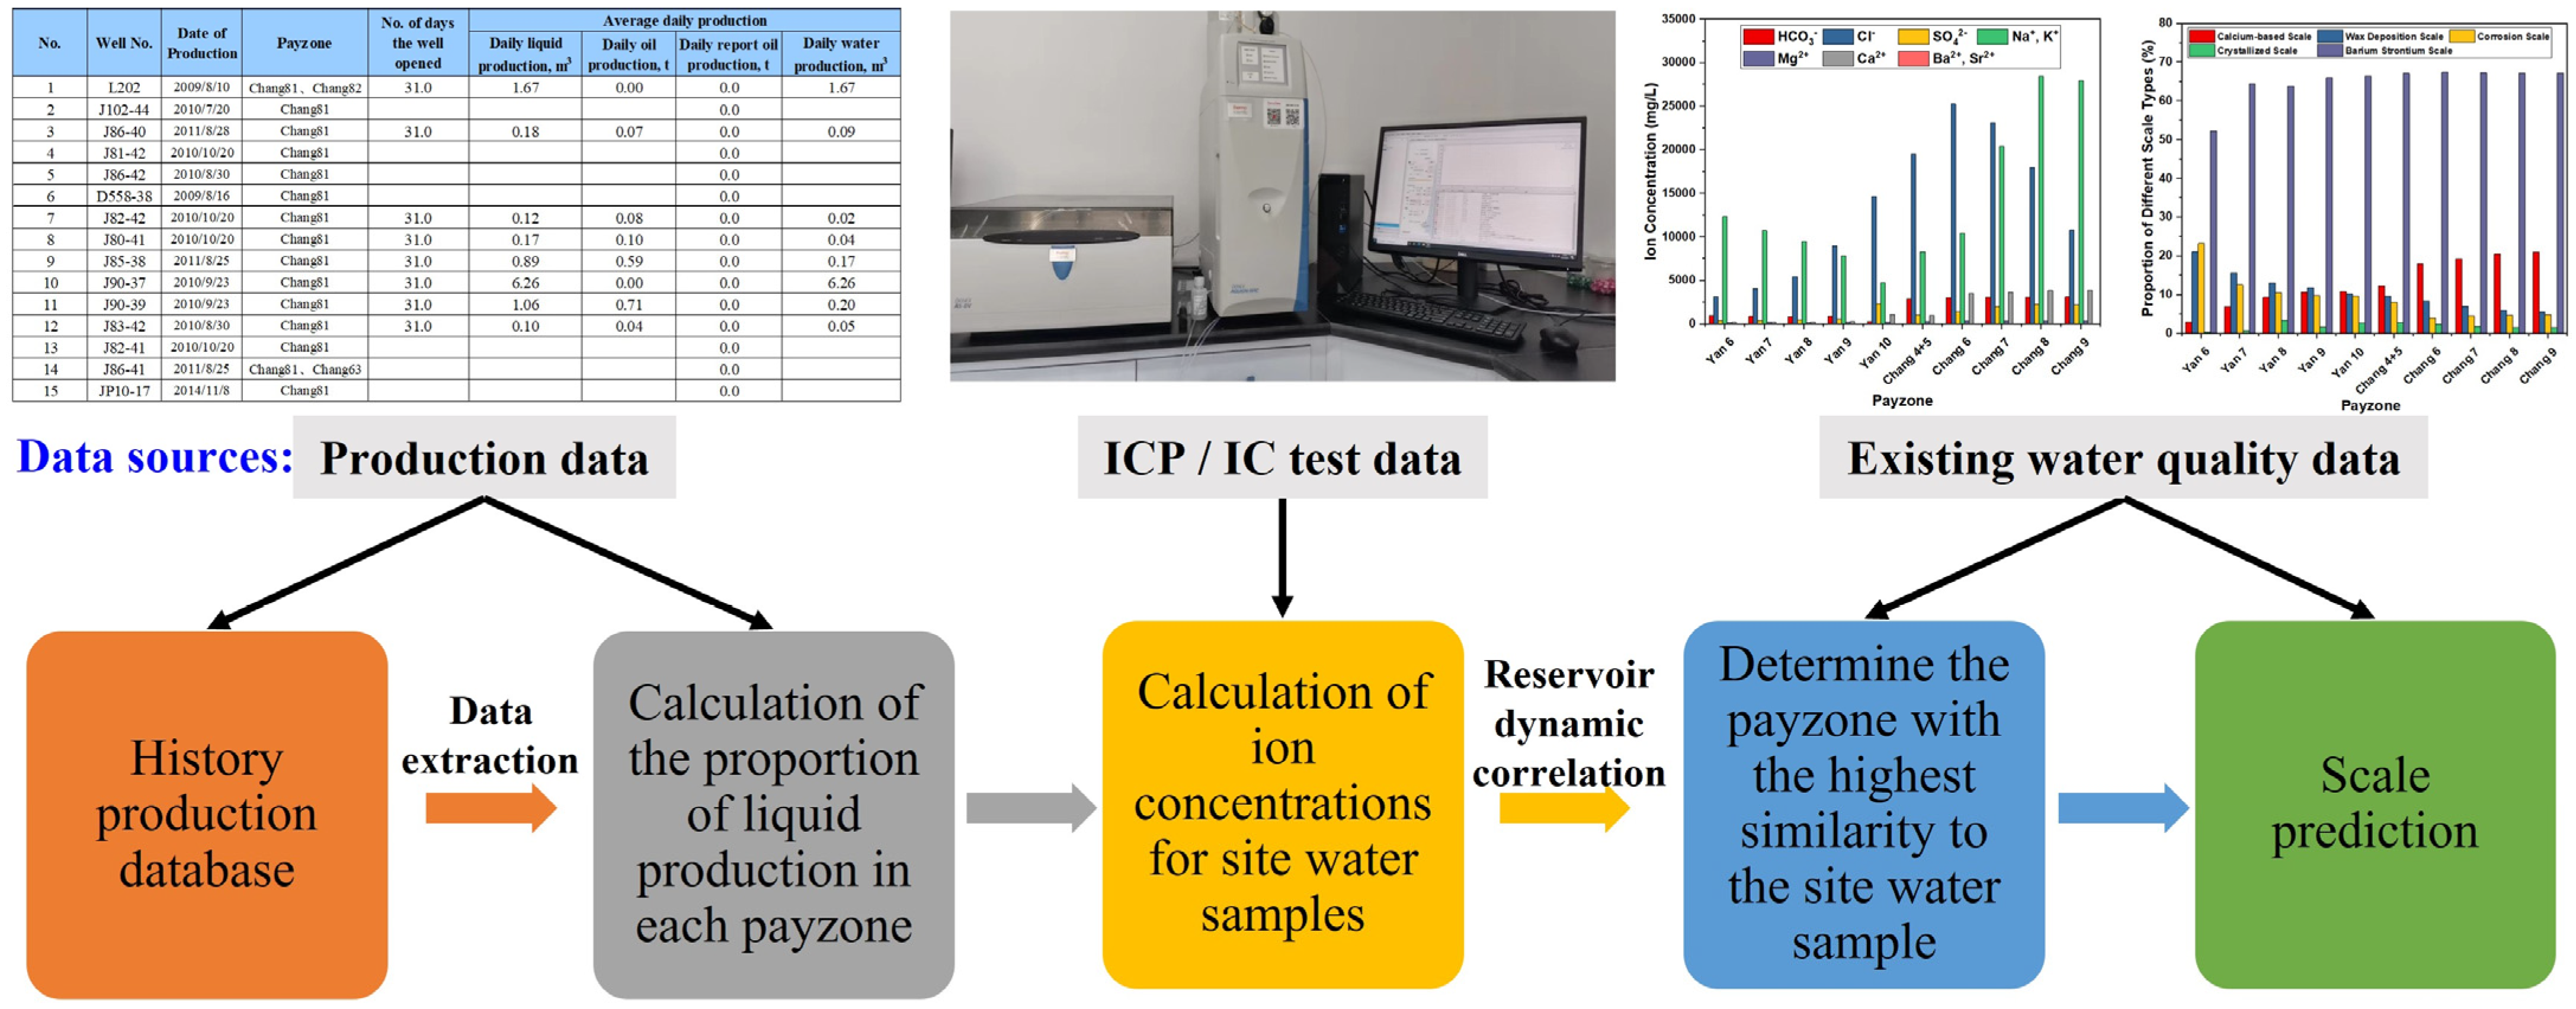
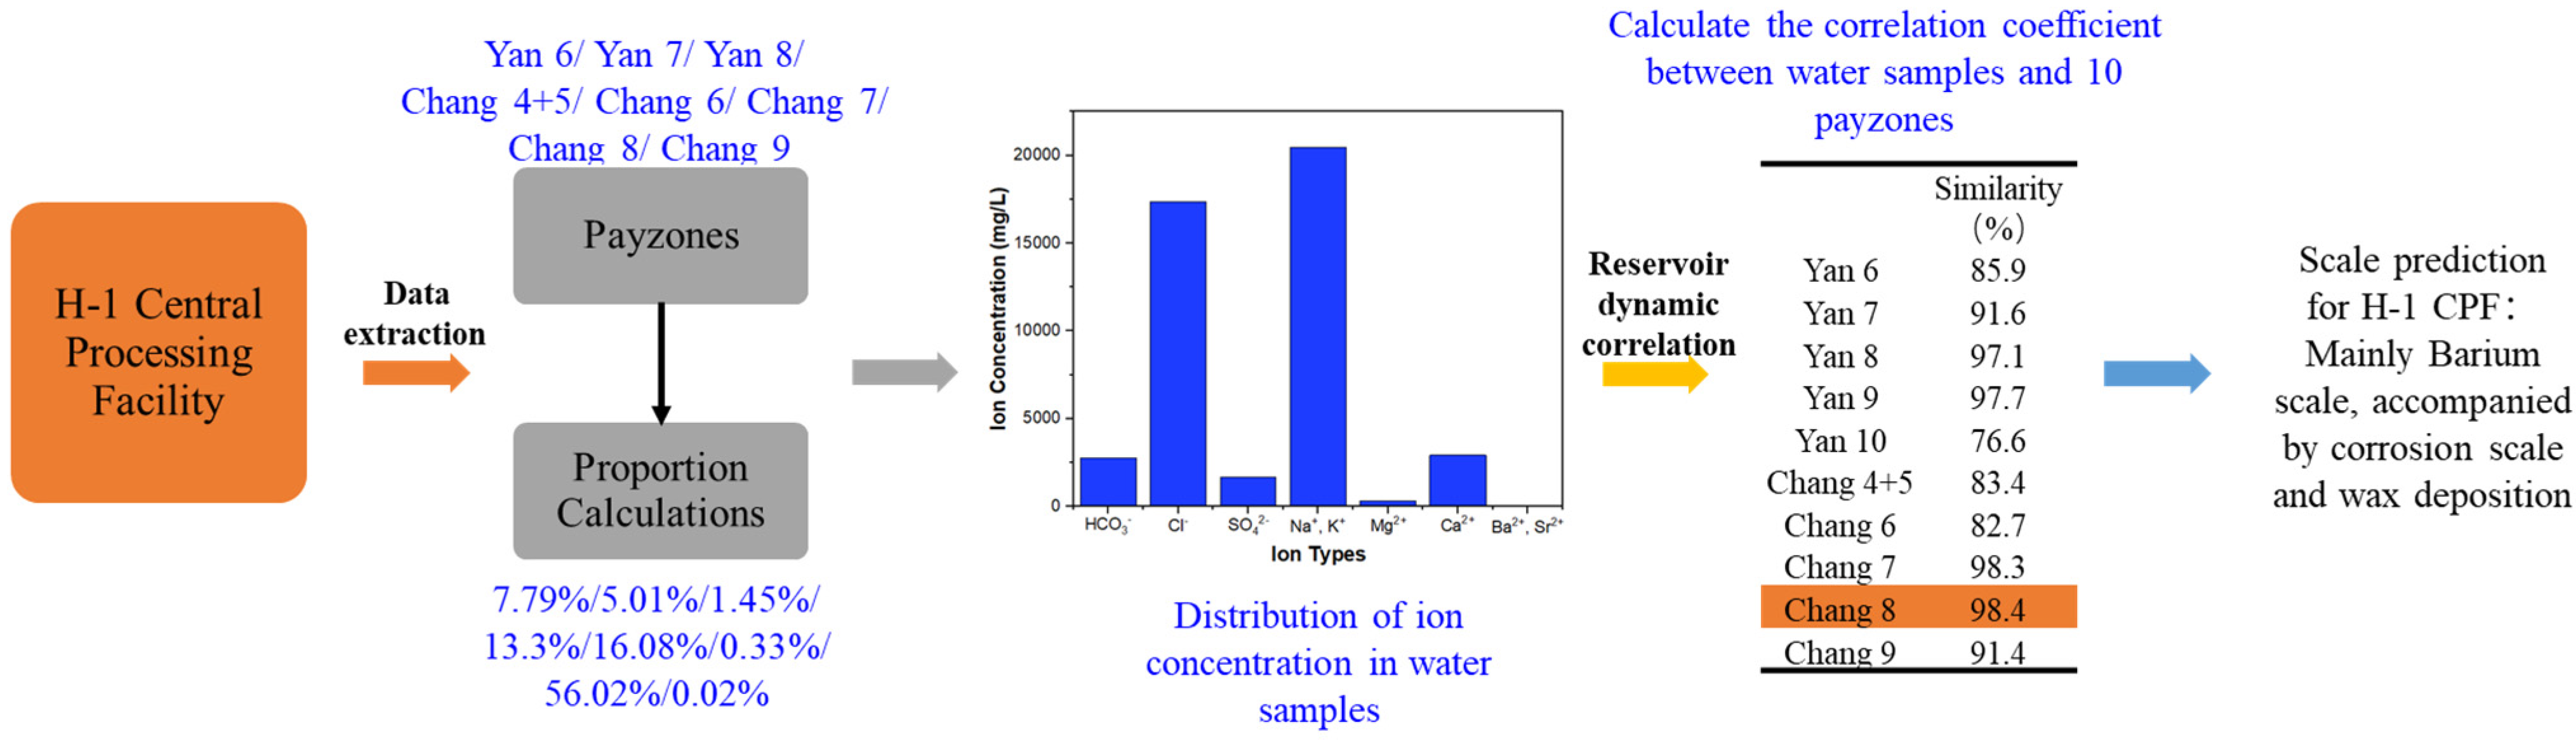
A scale type prediction model for Changqing Oilfield was constructed based on oilfield production data, reservoir dynamic correlation analysis, and water type scale type. The effectiveness of the prediction model was verified through the analytical results of water samples and scale samples from the gathering and transportation station.

Author Contributions

Conceptualization, N.Z.; formal analysis J.Z.; investigation, S.D.; methodology, Z.Z.; project administration, Z.Z.; resources, S.D.; validation, F.Z. and J.Y.; visualization, F.Z.; writing-original draft, T.L.; writing-review and editing, N.Z. and J.Y. All authors have read and agreed to the published version of the manuscript.

Funding

This research was supported by the No. 2 Oil Production Plant of PetroChina Changqing Oilfield Branch.

Data Availability Statement

Data are contained within the article.

Conflicts of Interest

Authors Ting Liu, Zheng Zhang, Shengfu Dongye, Jinlin Zhao, Fashi Zhang were employed by the company No. 2 Oil Production Plant of PetroChina Changqing Oilfield Branch. Author Jiaqing You was employed by the company No. 11 Oil Production Plant of PetroChina Changqing Oilfield Branch. The remaining authors declare that the research was conducted in the absence of any commercial or financial relationships that could be construed as a potential conflict of interest. The companies had no role in the design of the study; in the collection, analyses, or interpretation of data; in the writing of the manuscript, or in the decision to publish the results.

References

  1. Olajire, A.A. A review of oilfield scale management technology for oil and gas production. J. Pet. Sci. Eng. 2015, 135, 723–737. [Google Scholar] [CrossRef]
  2. Zhang, N.; Wang, X.; Zhang, J.; He, X.; Kang, S.; Pu, J.; Fan, S.; Li, X. Experimental and statistical study on wellbore scaling mechanisms and characteristics for Huanjiang Oilfield. Geofluids 2022, 2022, 9068440. [Google Scholar] [CrossRef]
  3. Su, X.; Zhou, D.; Wang, H.; Xu, J. Research on the scaling mechanism and countermeasures of tight sandstone gas reservoirs based on nachinelearning. Processes 2024, 12, 527. [Google Scholar] [CrossRef]
  4. Abdulhussein, Z.A.; Al-Sharify, Z.T.; Alzuraiji, M.; Onyeaka, H. Environmental impact of fouling for crude oil flow in preheat pipes according to oil blends. Heliyon 2023, 9, e21999. [Google Scholar] [CrossRef] [PubMed]
  5. Spinthaki, A.; Demadis, K.D. Chemical methods for scaling control. In Corrosion and Fouling Control in Desalination Industry; Saji, V.S., Meroufel, A.A., Sorour, A.A., Eds.; Springer International Publishing: Cham, Switzerland, 2020; pp. 307–342. [Google Scholar]
  6. Li, A.; Zhang, H.; Liu, Q.; Zeng, H. Effects of chemical inhibitors on the scaling behaviors of calcite and the associated surface interaction mechanisms. J. Colloid Interface Sci. 2022, 618, 507–517. [Google Scholar] [CrossRef]
  7. Leal, J.; Nunez, W.; Al-Ismail, S.; Solares, J.R.; Ramanathan, V. Novel mechanical scale clean-out approach to remove iron sulphide scale from tubulars in vertical high pressure and temperature deep gas producers: A case history. In Proceedings of the EUROPEC/EAGE Conference and Exhibition, Amsterdam, The Netherlands, 8–11 June 2009. [Google Scholar]
  8. Green, T.A.; Leal Jauregui, J.A.; Ginest, N.H.; Al-Bu Ali, M.S.; Vielma, J.R.; Chacon, A. Challenging HPCT scale removal op-erations in high H2S environment successfully completed with interdisciplinary job design and execution. In Proceedings of the Abu Dhabi International Petroleum Exhibition and Conference, Abu Dhabi, United Arab Emirates, 10–13 November 2014. [Google Scholar]
  9. Tian, Y.; Uzun, O.; Shen, Y.; Lei, Z.; Yuan, J.; Chen, J.; Kazemi, H.; Wu, Y.S. Feasibility study of gas injection in low permeability reservoirs of Changqing oilfield. Fuel 2020, 274, 117831. [Google Scholar] [CrossRef]
  10. He, J.; Yu, H.; He, G.; Zhang, J.; Li, Y. Natural gas development prospect in Changqing gas province of the Ordos Basin. Nat. Gas Ind. B 2022, 9, 197–208. [Google Scholar] [CrossRef]
  11. SY/T 5523-2016; Method for Analysis of Oilfield Water. National Energy Administration: Beijing, China, 2016.
  12. SY/T 5329-2012; Water Quality Standard and Practice for Analysis of Oilfield Injecting Waters in Clastic Reservoirs. National Energy Administration: Beijing, China, 2012.
  13. Fang, X.; Feng, H.; Zhang, Z.; Li, F. Brittleness index prediction method of tight reservoir based on grey correlation and analytic hierarchical process. Pet. Sci. Technol. 2024, 42, 2495–2519. [Google Scholar] [CrossRef]
  14. Jakubowicz, P.; Steliga, T.; Wojtowicz, K. Analysis of temperature influence on precipitation of secondary sediments during water injection into an absorptive well. Energies 2022, 15, 9130. [Google Scholar] [CrossRef]
Figure 1. SEM-EDS testing results of scale samples from different oil gathering and transportation manifolds.
Processes 12 02915 g001
Figure 2. Workflow for scale prediction in the Changqing Oilfield.
Processes 12 02915 g002
Figure 3. Testing results for water samples in different payzones.
Processes 12 02915 g003
Figure 4. Corresponding scale component content for different water sample categories.
Processes 12 02915 g004
Figure 5. Scale prediction for H-1 central processing facility based on the proposed method.
Processes 12 02915 g005
Table 1. Water quality test results of different water samples.
StationsNo. of SamplesBaCaFeMgNaSSiClWater Type
HZ-5416.8611.83.770.67209.924.429.411,025.0CaCl2
HZ-4917.9790.226.457.42373.1222.718.85268.7CaCl2
HZ-12414.4947.9108.6214.712,669.9298.544.833,701.3CaCl2
HZ-2910.8169.411.659.010,536.31672.815.19568.1Na2SO4
HZ-2811.27.31.21.568.441.55.027.2Na2SO4
HZ-4413.36.76.91.436.655.64.730.5NaHCO3
H-1320.41399.1219.6241.113,927.9230.246.826,217.6CaCl2, NaHCO3
HZ-35518.05.724.10.521.1150.24.233.7CaCl2
HZ-5550.28.30.40.418.734.09.528.0CaCl2
HZ-526.0603.527.477.6100.7100.854.238.4Na2SO4
HZ-870.51128.90.6138.97002.7349.618.316,124.4CaCl2
Table 2. Analysis results of scale samples.
StationsSiteCONaMgAlSiSClCaFeBaSrKPScale Type
%%%%%%%%%%%%%%
HZ-40Main control station2.8723.51.1300.260.410.730.260.591.6353.974.470.2 Barium strontium scale
HZ-28Main control station2.6825.190.7900.240.2811.650.250.641.0750.86.42 Barium strontium scale
HZ-28Main control station725.91.0400.370.410.290.631.0611.2635.976.08 Barium strontium scale
BQ-43Heater furnace3.3629.580.070.010.321.732.080.31.1960.740.61 Corrosion scale
HZ-1Heater outlet5.5744.060.210.520.491.062.90.1833.689.731.59 Calcium based scale
HZ-17Buffer tank inlet11.5822.040.920.010.30.399.770.50.941.650.131.8 Barium strontium scale
HZ-55Main control station to pig receiver5.5926.431.130.04 0.3510.020.391.755.8744.513.92 Barium strontium scale
H-1Main control station8.4629.230.950.150.790.8110.390.412.310.625.5210.110.28 Corrosion scale associated with barium strontium scale
H-1L38-78.3325.813.1300.250.249.173.090.689.3333.466.51 Barium strontium scale
HZ-2Main control station to pig receiver20.5726.10.620.070.270.326.80.190.9818.9922.812.28 Corrosion scale associated with barium strontium scale
HZ-2Pig receiver to heater furnace11.1627.761.090.10.290.299.450.2633.4938.314.230.220.35Barium strontium scale
H-1L38-3114.1829.32.020.07 0.054.971.563.6817.8211.0315.32 Corrosion scale
H-1Pig receiver to heater furnace6.9625.763.240.040.240.6411.591.121.233.8211.24.19 Corrosion scale
H-1Main control station5.8121.682.060.010.250.1118.490.610.5543.684.592.16 Corrosion scale
H-1Export pump outlet11.3126.812.040.06 1.3411.250.860.8422.5117.295.69 Corrosion scale associated with barium strontium scale
H-1Export pump inlet18.423.271.680.150.40.5910.010.941.8537.315.15 0.25 Corrosion scale associated with barium strontium scale
H-1L38-711.0624.971.80.08 0.0310.460.931.0712.130.496.830.19 Barium strontium scale
HZ-43Main control station to buffer tank5.3328.440.8200.380.4110.390.780.9416.0933.722.69 Corrosion scale associated with barium strontium scale
HZ-5Main control station6.8329.341.290.010.410.897.651.111.2720.1229.963.880.23 Corrosion scale associated with barium strontium scale
BQ-12-1Pig receiver to heater furnace20.3423.360.880.26 0.558.80.30.791.2543.47 Barium strontium scale
HZ-5Heater furnace7.0527.530.950.180.290.4710.670.182.2923.8418.97.64 Corrosion scale associated with barium strontium scale
HZ-8Pig receiver to heater furnace34.4831.10.620.542.055.123.580.331.2220.130.3 0.52 Corrosion scale
HZ-8Main control station12.1641.092.060.853.6516.360.681.967.9611.690.11 1.42 Corrosion scale
HZ-8L226-354.5916.53.380.230.390.355.852.570.6415.40.1 Barium strontium scale
HZ-8L226-434.4422.95.60.190.451.325.314.751.8123.120.12 Corrosion scale
Table 3. Water sample testing results at different payzones.
Water CategoryPayzoneWater TypeAverage Formation Water Salinity (mg/L)Variance
C1Yan 6NaHCO317,208126
C2Yan 7NaHCO316,569144
C3Yan 8NaHCO316,746101
C4Yan 9CaCl218,809144
C5Yan 10CaCl223,299488
C6Chang 4 + 5CaCl233,023365
C7Chang 6CaCl244,041342
C8Chang 7CaCl252,681117
C9Chang 8NaHCO356,121172
C10Chang 9NaHCO348,354111
Disclaimer/Publisher’s Note: The statements, opinions and data contained in all publications are solely those of the individual author(s) and contributor(s) and not of MDPI and/or the editor(s). MDPI and/or the editor(s) disclaim responsibility for any injury to people or property resulting from any ideas, methods, instructions or products referred to in the content.

