Article

The Variation Law of Fracture Conductivity of Shale Gas Reservoir Fracturing–Flowback Integration

1
State Key Laboratory of Shale Oil and Gas Enrichment Mechanisms and Effective Development, Beijing 100083, China
2
Sinopec Key Laboratory of Shale Oil/Gas Exploration and Production Technology, Beijing 100083, China
3
School of Petroleum Engineering, Yangtze University, Wuhan 430100, China
4
Oil & Gas Technology Institute, PetroChina Changqing Oilfield Company, Xi’an 710018, China
5
Technology Monitoring Center, PetroChina Changqing Oilfield Company, Xi’an 710018, China
*
Author to whom correspondence should be addressed.
Processes 2024, 12(12), 2908; https://doi.org/10.3390/pr12122908
Submission received: 24 November 2024 / Revised: 9 December 2024 / Accepted: 16 December 2024 / Published: 19 December 2024
(This article belongs to the Special Issue Shale Gas and Coalbed Methane Exploration and Practice)

Abstract

Hydraulic fracturing is a commonly used technical tool in the extraction process of unconventional shale gas reservoirs. However, the damage caused by fracturing fluids to the proppant fracture inflow conductivity during the whole fracturing, reentry, and production process is very obvious, which affects the fracturing and production increase effect. Conventional proppant fracture inflow conductivity test experiments only use a single-phase fluid in the gas or liquid phase to complete the test and evaluation, and few scholars have paid attention to the change rule of inflow conductivity during the whole fracturing and re-discharge process. Therefore, combined with the characteristics of shale gas production, we simulated the whole fracturing–returning–production process, carried out three consecutive phases of proppant fracture inflow conductivity test experiments, and investigated the change rule of fracture inflow conductivity during the whole process. The results show that under the condition of closure pressure 35 MPa, after distilled water simulated fracturing, the damage to mineral sand flow-conducting capacity is as high as 81.55% due to the effect of shale hydration. During the simulated return discharge process, the gas-measured flow-conducting capacity experiments were carried out at 25%, 50%, 75%, and 100% of the initial gas-measured discharge, and the fracture flow conductivity kept rising, and its maximum recovery value was 54.67% of the original one; the experiments simulated the fluctuations caused by changes in the wellbore flow pressure on the closure pressure in the process of production as well as the influence of fracture flow-conducting capacity under the condition of long-term soaking of the proppant, and the results of this study are useful for the design of fracturing programs and high-efficiency fracturing of shale gas. The results of this study have certain reference significance for the design and efficient development of shale gas reservoir fracturing programs.

1. Introduction

Large-scale hydraulic fracturing is an important technical means for the efficient development of unconventional reservoirs, in which the fracture inflow conductivity is an important evaluation index of the fracturing effect [1,2,3]. The physical properties of shale reservoirs are complex, and there are many factors affecting the flow conductivity [4,5]. The conventional proppant fracture hydraulic conductivity testing experiments only use a single gas or liquid phase to complete the testing and evaluation, and there are fewer experimental methods for hydraulic conductivity testing in which the liquid test is connected to the gas test or the gas test is connected to the liquid test. Therefore, it is necessary to adopt gas–liquid–gas three-phase continuous testing of proppant fracture inflow conductivity to simulate the whole fracturing–flowback–production process in indoor devices. Therefore, the field fracturing–returning–production process is simulated by indoor experiments.
At present, the indoor experimental method of fracturing–returning–production integration to study the changing law of inflow conductivity is not yet sufficient. Most of the proppant fracture flow conductivity experiments are conducted with fracturing fluid or nitrogen as the injected fracture fluid for single-phase testing of flow conductivity, but in the actual process of return drainage, there are gas–liquid two-phase flows in the fracture, which leads to the fact that a single gas test experiment does not characterize the change rule of fracture flow conductivity under stratigraphic conditions [6]. For shale reservoirs, the experimental design is based on a single gas–liquid phase flow. For shale reservoirs, the experimental design is to change the gas-phase flow test immediately after the long-term fracturing fluid conductivity test, which can better characterize the actual on-site reentry–production process [7,8,9,10]. One study shows that the influence of the gas–liquid phase on hydraulic conductivity is quite significant in the process of flowback, and with the increase in gas volume, the hydraulic conductivity rises [11]. The effect of the gas–liquid ratio on the flow-conducting capacity is quite significant. Wang Subing et al. analyzed the effect of distilled water on infusion capacity through experiments, and the damage reached 90.2% [12]. Fu, L.P. through experiments concluded that the degree of injury of a 0.5% fiber polymer is 34.2% [13]. Zhu Junjian compared the effect of slick water and distilled water on inflow conductivity through experiments and concluded that the injury of the inflow conductivity of proppant cracks caused by the auxiliary drainage and anti-expansion effect of slick water is less than that of distilled water [14]. The effect of the sloshing water on the inflow conductivity of proppant fracture is less than distilled water. Wang Lei analyzed the factors affecting the flow-conducting ability of proppants and experimentally proved that the flow-conducting ability increases with the increase in proppant particle size [15]. ELINE believed that the closure pressure has the greatest influence on the flow-conducting capacity [16]. Zhang Maiyun deduced the calculation process of wellbore flow pressure in an intermittent switching well working regime and established a mathematical model of production and wellbore flow pressure [17]. Liu Qiguo et al. studied the effect of well closure on bottomhole pressure and concluded that well closure during the production stage would lead to an increase in bottomhole pressure, which would lead to a decrease in proppant bearing pressure [18].
In this paper, the influence of different factors on flow conductivity during the fracturing–returning–production process is analyzed through indoor experiments; the influence of formation pressure fluctuations caused by the opening and closing of wells and changes in production rate on fracture flow conductivity is also investigated, and the changes in the flow conductivity of proppants under a long-term soaking condition of fracturing fluid during the production process are also taken into account. Through indoor experiments, the changing law and damage mechanism of the fracture inflow conductivity of proppants during the fracturing-production process are studied, which has a certain guiding effect on the design of fracturing plans and production optimization in the field.

2. Experimental Preparation and Principles

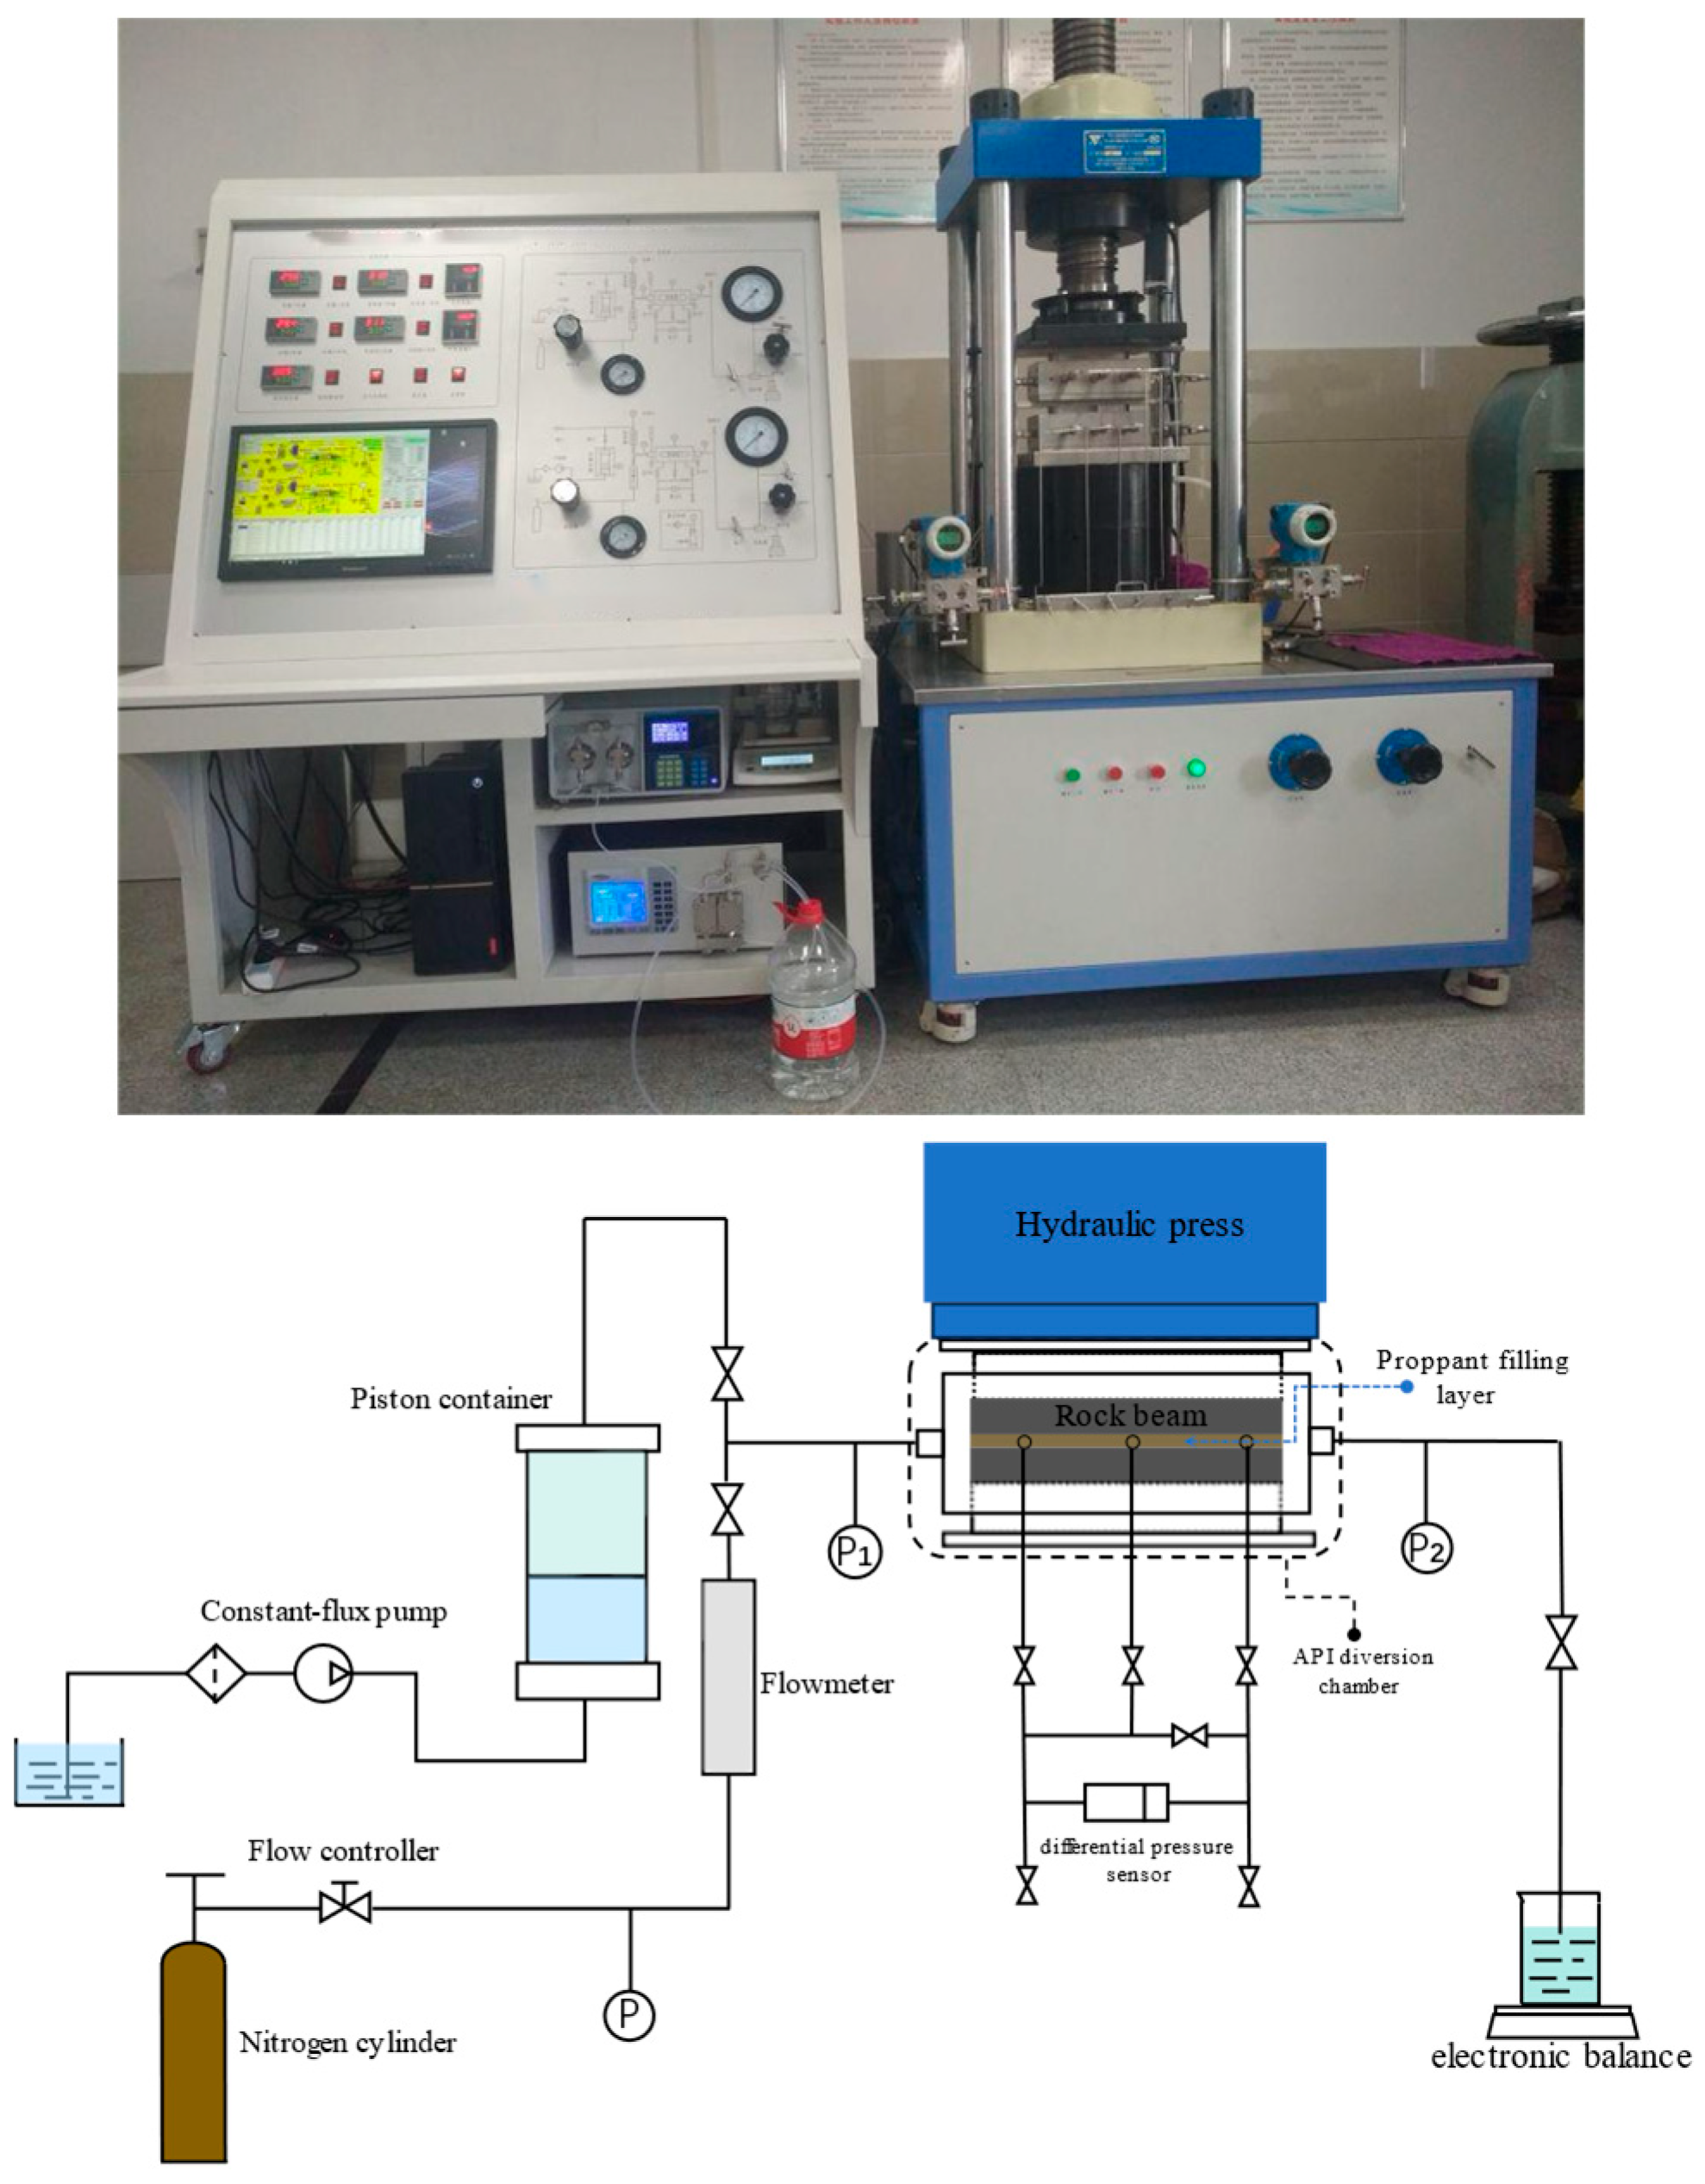
2.1. Experimental Device

The equipment used for the experiment was an HXDL-2C proppant long-term inflow conductivity evaluation device, as shown in Figure 1, where the closure pressure borne by the API inflow chamber was controlled by a hydraulic press, the nitrogen cylinder supplied the gas for gas measurement experiment, and the advective pump provided a stable injection pressure and discharge for the experimental liquid [19]. Figure 1 shows the setup.

2.2. Experimental Materials

Experimental gas: Dry nitrogen gas was used for gas measurement of inflow capacity.
Experimental fluids: Including distilled water, as well as low-viscosity slickwater and polymer fracturing fluid systems used in the fracturing site for comparison, the viscosity of the slickwater fracturing fluid at room temperature was tested to be 4.9 mPa·s, and the viscosity of the polymer body fracturing fluid was tested to be 8.5 mPa·s.
Proppant: Quartz sand of three grain sizes, 20/40 mesh, 40/70 mesh, and 70/140 mesh, as well as mineral sand of 20/40 mesh and ceramic granules of 20/40 mesh, were used, and the experimental sand laying concentration was 5 kg/m2.
Rock plates: The rock slabs are shale rocks, and the rock types are mainly siliceous shale, clay-bearing siliceous shale, siliceous clay shale, and siliceous clay-bearing shale. The mineral composition is mainly clay minerals, silicate minerals, carbonate minerals, etc. Siliceous minerals and clay minerals are dominant, with clay minerals being 29.6%. Clay minerals are dominated by illite and illite mixed layers, followed by chlorite.

2.3. Experimental Principles

The short-term and long-term inflow conductivity tests follow Darcy’s formula, and the proppant gas-measured and liquid-measured long-term inflow conductivity experiments were conducted in accordance with the national standard “NB/T 14023-2017 Recommended Methods for Determining the Long-term Flowing Capacity of Shale Proppant Filling Layers” [20]. The experimental temperature was 25 °C at room temperature, the nitrogen cylinder provided the gas phase, and the advection pump maintained the steady flow and pressure of the liquid phase. The formulas for calculating the inflow conductivity of gas measured and liquid measured are shown in Equations (1) and (2):
Gas flow conductivity equation:
K g w f = 2 Q g μ g L p 0 W ( p 1 2 p 2 2 )
where Kg is liquid-measured permeability, μm2; wf is proppant thickness, cm; Qg is gas flow rate, mL/s; μg is gas viscosity, mPa∙s; L is the length of both ends of the measured point, cm; p0 is atmospheric pressure, 10−1 MPa; W is inflow groove width, cm; and p1 and p2 are the pressures at both points of gas measurement, 10−1 MPa.
Liquid measurement conductivity equation:
K w w f = Q w μ w L W Δ p
where Kw is liquid-measured permeability, μm2, Qw is liquid flow rate, mL/s, μw is liquid viscosity, mPa∙s, and Δp is the pressure difference between two points of liquid measurement, 10−1 MPa.
The inflow conductivity measuring device is equipped with an API standard inflow chamber, the width of the chamber is 3.81 cm, the differential pressure measured point spacing is 12.7 cm, and the atmospheric pressure p0 is 10−1 MPa. Therefore, the gas and liquid inflow Equations (1) and (2) can be simplified as follows, respectively:
Gas-measured conductivity equation:
K g w f = 1.11 × 10 3 Q g μ g ( p 1 2 p 2 2 )
Liquid-measured conductivity equation:
K w w f = 5.555 Q w μ w Δ p

3. Experimental Method

3.1. Experiments Simulating the Process of Fracturing and Flowback

3.1.1. Experimental Design

After the fracturing fluid enters the shale reservoir, its return process is mainly divided into three stages: at the early stage of return, it is mainly single-phase flow of the fracturing fluid, and with the output of shale gas, there is gas–liquid two-phase flow; at the middle and late stages of return, there is more and more gas phase, and finally it occupies the main seepage channel, while carrying fluid through the flow rate.
There are many main factors affecting the proppant fracture inflow conductivity during the return flow process, and four factors are considered in this experiment, which are fracturing fluid type, proppant type, proppant particle size, and closure pressure. Among them, the closure pressure has a greater influence on the proppant fracture inflow capacity. Therefore, the closure pressure is designed to be 35 MPa to reduce the interference of proppant fragmentation on the experimental results. The experiments were programmed for the four influencing factors and three parallel conditions, with a total of nine groups of experiments, and the experimental conditions are listed in the Table 1.

3.1.2. Experimental Flow

In order to simulate the change rule of proppant fracture inflow conductivity during the integration process of shale gas fracturing and flowback, firstly, the proppant fracture inflow conductivity should be measured by gas measurement before injection of fracturing fluid; subsequently, the fracturing and flowback process is simulated by injecting nitrogen at different ratios to simulate the influence of the gradual increase in the gas phase in the gas–liquid two-phase fluid on the fracture inflow conductivity during the flowback process. The experimental process can be divided into the following three stages:
The first stage of gas flow conductivity: in the experiment, dry nitrogen was injected to measure the conductivity before fracturing, and the gas flow rate was 400 mL/min.
The second stage of liquid flow conductivity: the long-term conductivity of the fracture proppant was measured after the fracturing fluid was injected; the liquid flow rate was 5 mL/min, the measurement time was 36 h, and the whole fracturing process was simulated.
The third stage of gas flow conductivity: the process of flowback after fracturing was simulated, and gradually the gas flow rate was increased, with a flow rate of 25% or 400 mL/min, to measure the proppant fracture conductivity after fracturing fluid injury; under the same experimental conditions, the different discharges of 50%, 75%, and 100% were used and the process of gradual increase in the gas flow rate in the pre-production period of the flowback–production period was simulated.

3.2. Experiments to Simulate Different Production Rates Under Shale Gas Well Working System

In the production process of shale gas wells, the water and gas contradiction at the surface is usually adjusted by shutting down the well, the wellhead pressure after shutting down the well is influenced by the renewal effect, and the surface shutdown usually leads to a slight increase in the pressure at the wellhead and at the bottom of the well.
Therefore, without considering the conditions of interaction between the formation and the wellbore, the experiment simulates that the bottomhole pressure rises when the well is shut in, thus decreasing the closure pressure borne by the proppant. An HXDL-2C long-term inflow conductivity evaluation device was utilized to simulate the conditions of pressure change endured by the proppant when the well was opened and closed, and to carry out a comparative experiment on the influence law of fracture inflow conductivity by considering the change in strength caused by long-term soaking of the proppant by the fracturing fluid. During the experiment, nitrogen gas was injected to measure the inflow conductivity of 40/70 mesh quartz sand. The duration of the measurement was 12 h for both the opening and closing phases of the well.

4. Analysis of Experimental Results

4.1. Effect of Different Fracturing Materials on Fracture Inflow Capacity

4.1.1. Fracturing Fluid Type

The experiments were carried out under a closure pressure of 35 MPa, and a 20/40 mesh ceramic proppant was selected as the medium-term experimental fluid to conduct the experiments on the damage to the hydraulic conductivity of distilled water, a slick water system, and a polymer fracturing fluid system. The changes in hydraulic conductivity are shown in Figure 2. It can be seen that, comparing the fracture inflow conductivity under the initial displacement, the gas-measured inflow conductivity decreases at an initial displacement of 100% of the secondary nitrogen injection. Polymer fracturing fluid system, slick water system, and distilled water injury increase in order, and are 45.33%, 48.74%, and 57.53%, respectively. With the increase in gas volume, the rate of proppant fracture inflow conductivity increases.
After the fracturing fluid has caused damage to the reservoir, at the initial stage of return drainage, the degree of recovery of fracture inflow conductivity is small because the gas occupies a small part of the fracture channel to carry the fracturing fluid in the reverse flow. With the continuous increase in gas flow, the fluid phase throughout the fracture is mainly gas phase, which makes the fracture flow conductivity increase rapidly. When the gas flow rate is stabilized, the fracture inflow conductivity tends to stabilize.
For polymer fracturing fluid, the reason for the injury to fracture inflow conductivity mainly comes from the retention and adsorption of polymer fracturing fluid; the slick water fracturing fluid has a good drag reduction effect, which is conducive to the stabilization of clay and prevents the proppant from dispersing and transporting, which is detrimental to the inflow capacity. At the same time, the degree of damage caused by the polymer fracturing fluid is smaller than that caused by the slick water fracturing fluid, because the polymer fracturing fluid has a small viscosity and a significantly lower residue content than that of the slick water fracturing fluid. Therefore, fracturing fluid selection is the key to fracturing design, and a fracturing fluid system with low residue and good anti-expansion performance should be used to reduce proppant transportation and damage to the formation, and to enhance the fracturing modification effect.

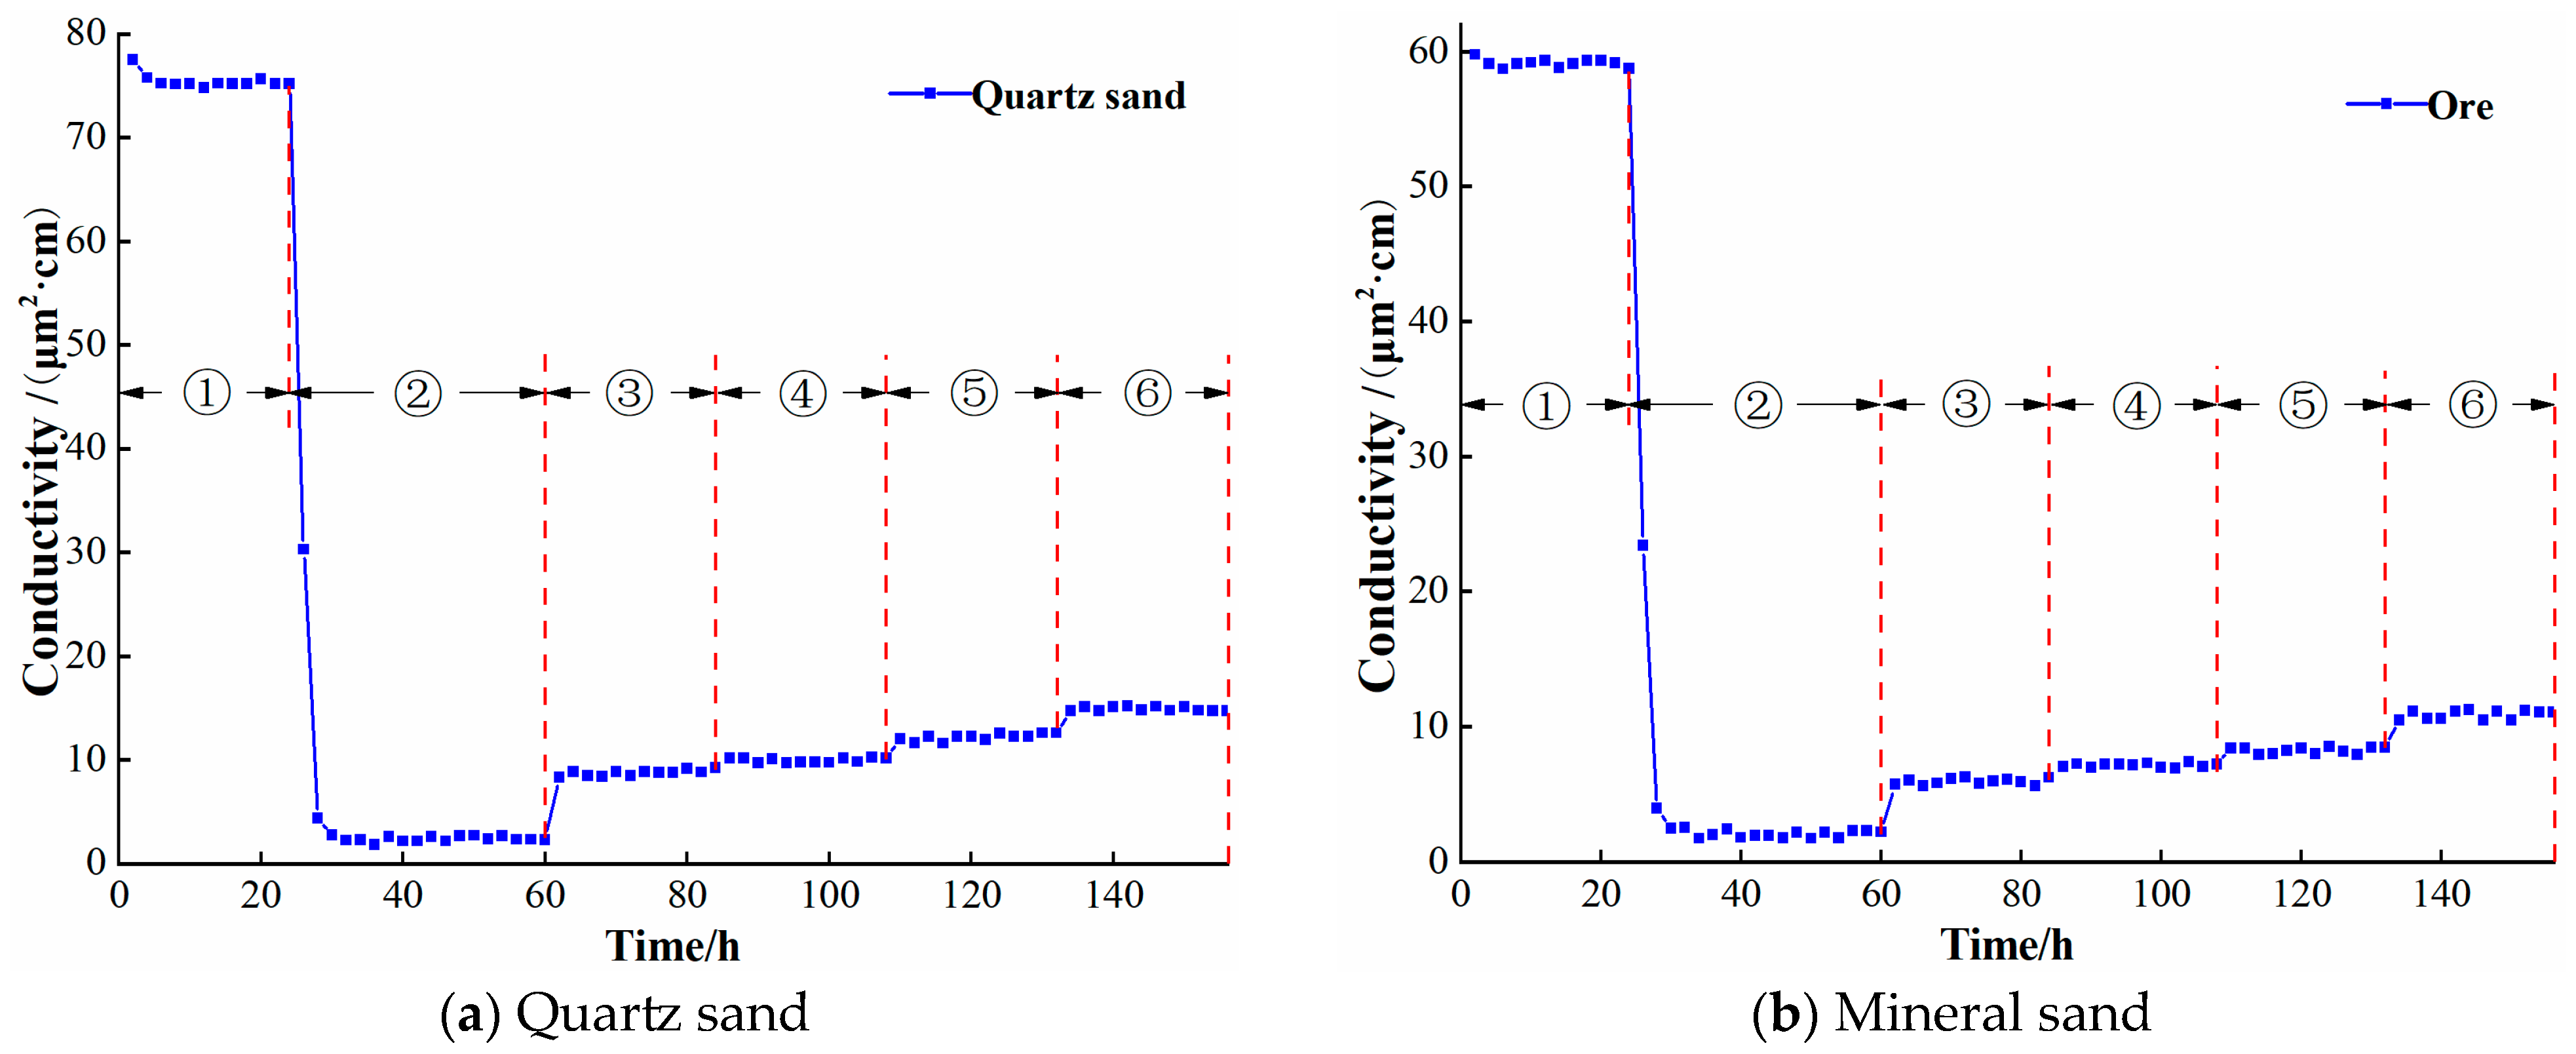
4.1.2. Proppant Type

For the experiment, 20/40 mesh quartz sand and mineral sand were selected, and the liquid was distilled water. Under the closure pressure of 35 MPa, the inflow conductivity injury experiment was divided into three stages: nitrogen gas measurement, distilled water liquid measurement, and the second injection of nitrogen gas measurement. The influence law of infusion capacity is as Figure 3.
In conjunction with the previous section, from Figure 3 it can be seen that the gas-measured fracture flow conductivity of mineral sand, quartz sand, and ceramic grains with the same mesh number increases gradually. After the liquid intrusion, the mineral sand proppant fracture flow conductivity injury is the largest, reaching 81.55%; quartz sand is the second largest, with an inflow conductivity injury of 80.18%; ceramic grain is the smallest, with 57.53%. As the performance of ceramic grains’ broken rate is much larger than that of quartz sand and mineral sand, the injury to ceramic grains’ flow ability mainly comes from the fracturing fluid, and in the results of the second nitrogen gas injection gas measurement, ceramic grains’ flow-guiding ability recovers faster and the injury to the fracture flow conductivity is smaller.

4.1.3. Proppant Particle Size

Different mesh (40/70 and 70/140 mesh) ceramic grains were selected for the experiment; the experimental liquid was distilled water, and the closure pressure was 35 MPa to carry out the three-stage test of air–liquid–air infiltration capacity. The results are shown in Figure 4: the smaller the proppant particle size, the lower the fracture inflow capacity; under the action of the closing pressure, the large-size proppant particles have a large pore volume between them, which maintains a higher inflow capacity. Comparing the initial gasometric inflow capacity, the 70/140 mesh has the largest damage of 59.15%, followed by the 40/70 mesh damage of 55.54% and 20/40 mesh damage of 57.53%. Most of the unbroken proppant particles maintain a certain pore volume, providing a high inflow capacity.
When the proppant is soaked by the fracturing fluid for a long period of time, the fragmentation rate increases, generating a large amount of debris, and the gas flow at smaller displacements carries the debris, thus blocking the flow channels that are already small for small particle sizes. As the displacement increases, the debris is flushed out of the main flow channels, and the restoration of inflow conductivity is accelerated.

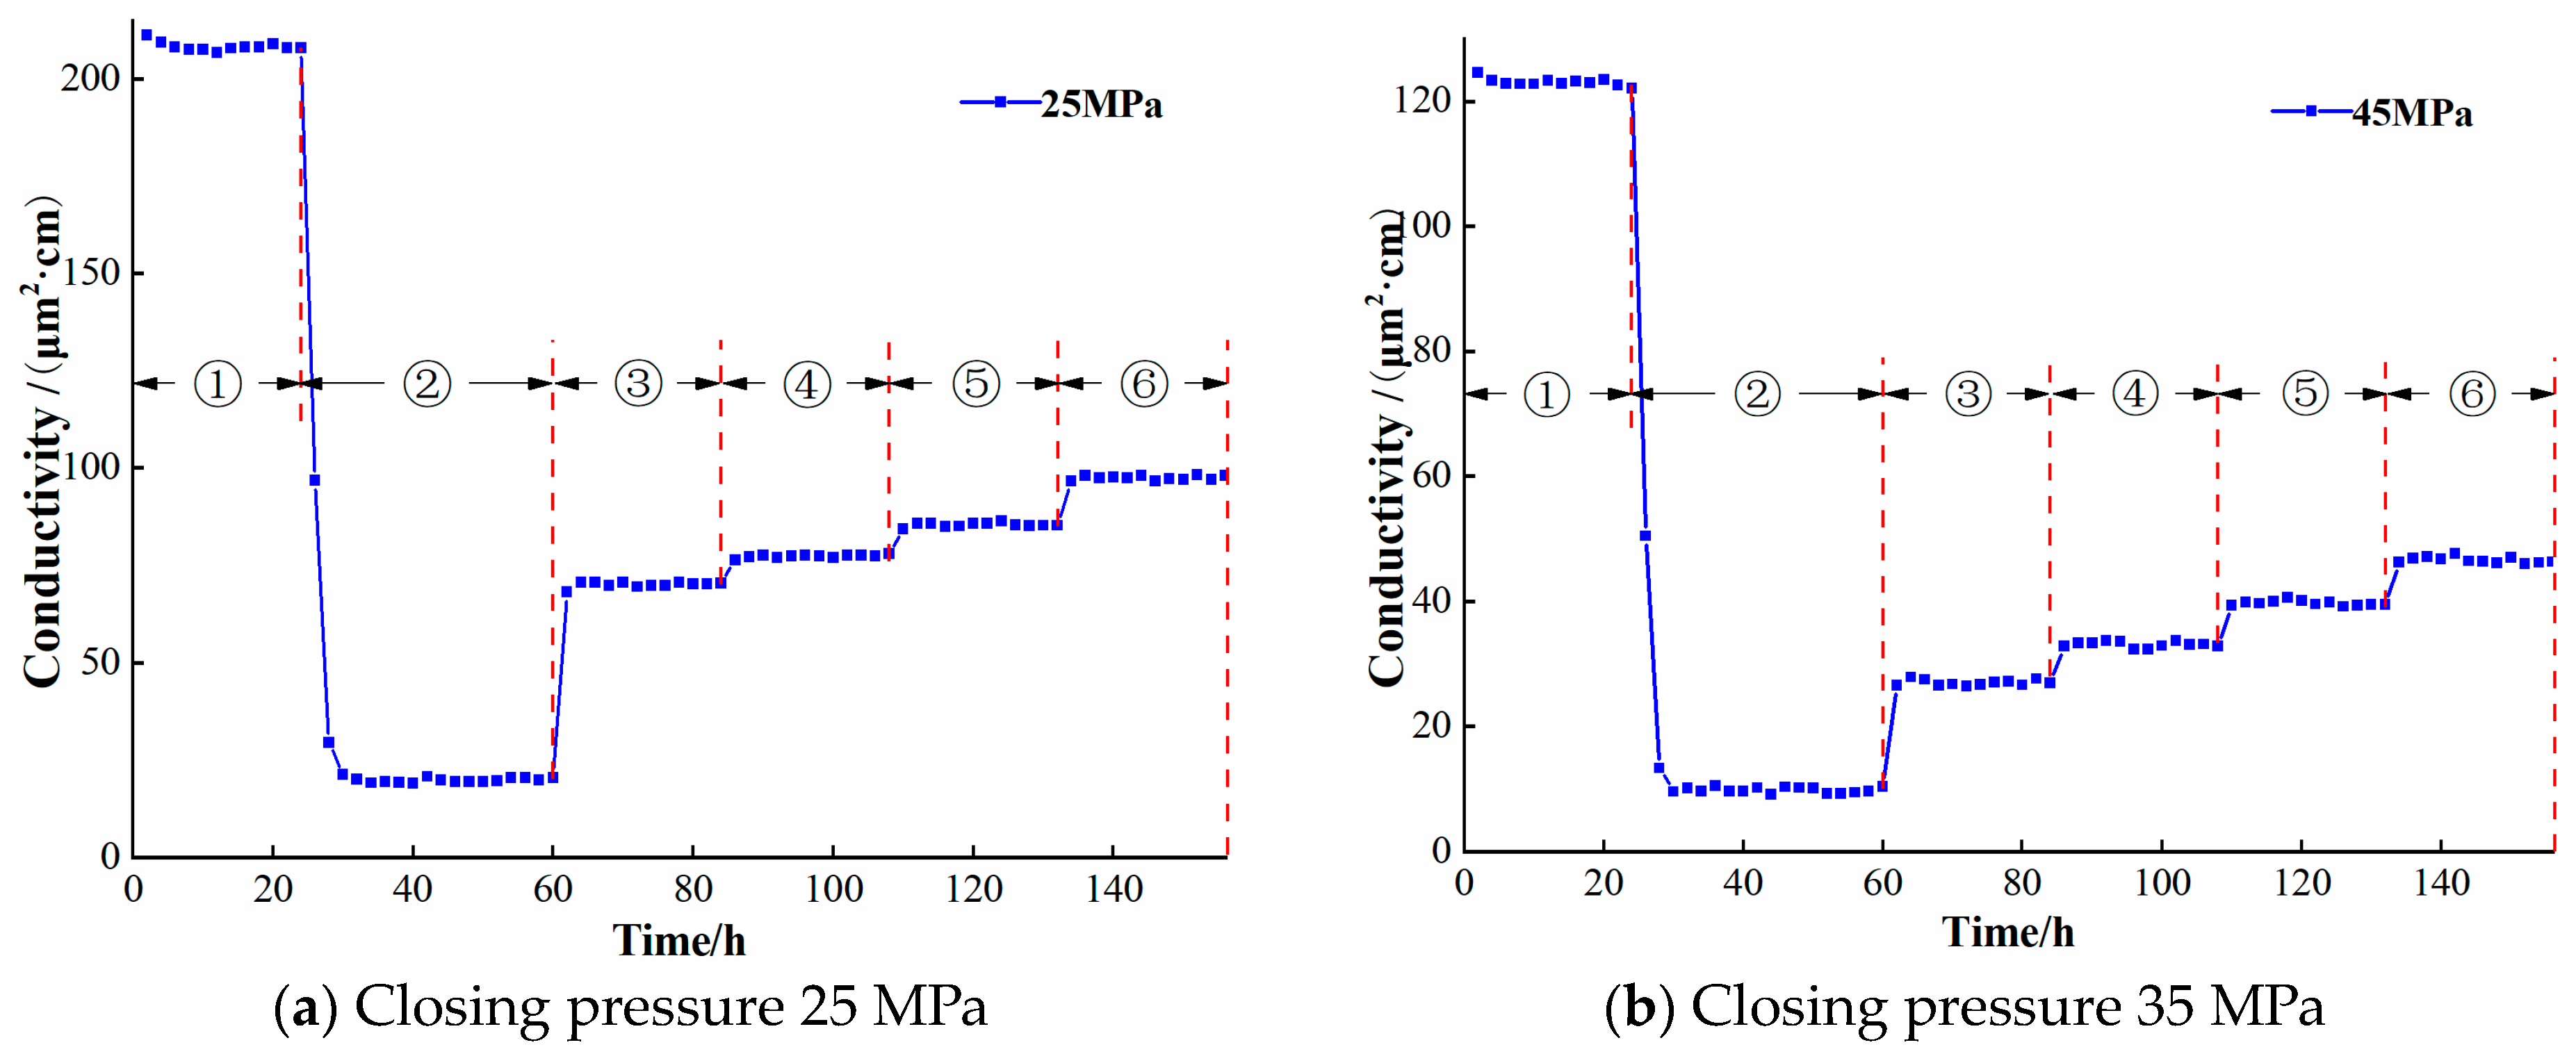
4.1.4. Closure Pressure

The proppant 40/70 mesh ceramic grains were selected for the experiments of nitrogen gas measurement, distilled water liquid measurement, and secondary nitrogen gas injection air measurement of the inflow conductivity under different closure pressures of 25 and 45 MPa, respectively. As Figure 5 shows, the larger the closure pressure, the smaller the first gas measurement of the inflow capacity and the second gas measurement of the inflow conductivity after the liquid is passed; as the damage increases, the pressure from small to large (25, 35, and 45 MPa) corresponding to the degree of the inflow conductivity of the damage is 53.11%, 57.53%, and 62.07%, respectively. Under the action of closure pressure, the proppant in the inflow channel is compacted, and the rate of the inflow conductivity rebound increases with the increase in the discharge. When the closure pressure is larger, the pore space in the flow-guiding slot is smaller, the increase in the flow-guiding capacity in the early stage of the secondary nitrogen gas injection gas measurement is still larger, and in the later stage, even if the gas volume is increased, there is no more effective flow-guiding space, and the rise in the flow-guiding capacity of the proppant fracture is smaller.

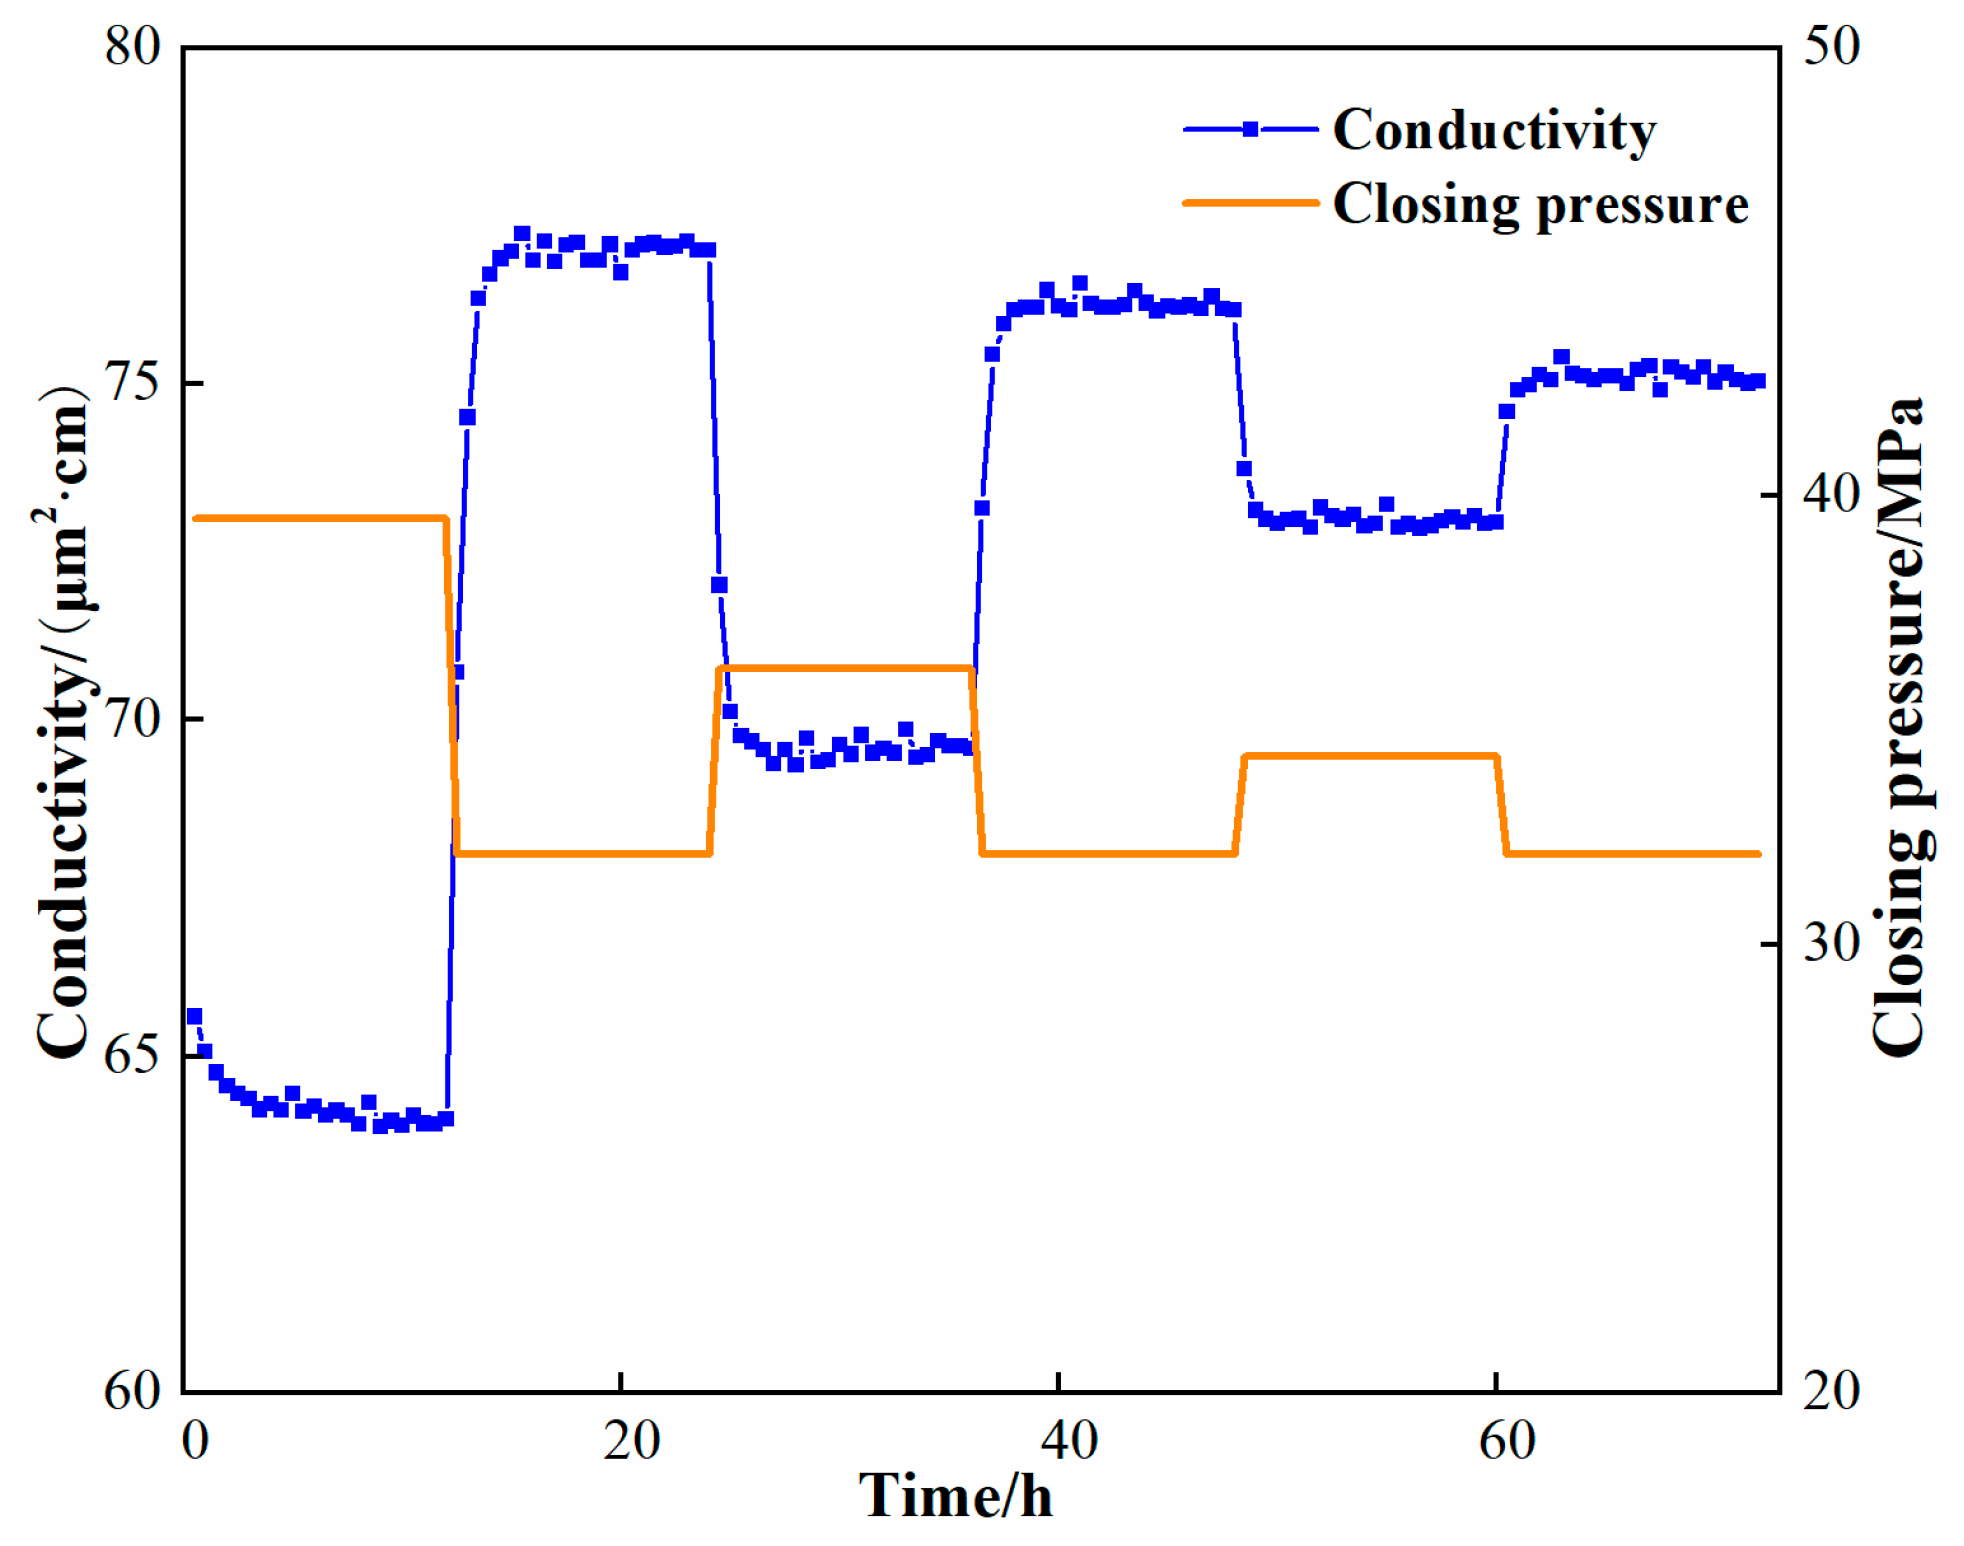
4.2. Impact of Shale Gas Well Working System

When shale gas reservoir production stabilizes, gas production rates are often adjusted by opening and closing wells. With the continuous production of shale gas, the production decreases, and the proppant closure pressure due to the shut-in wells has an impact. According to the data of well X, the depth of the well is 3100 m, and the reservoir pressure is 32 MPa. Pipesim is an industry software that is used to simulate shale gas production. Pipesim modeling is used to calculate the change in bottomhole pressure caused by shutting down the well under different gas production rates, and the closure pressure is calculated according to the reservoir pressure. The results are shown in the table below.
Therefore, an experiment was conducted to simulate the change in closure pressure caused by opening and closing the well during the production process, with 40/70 mesh quartz sand selected as the proppant and distilled water as the liquid measurement fluid to study its effect on the fracture conductivity of the proppant. When the well is shut in, the closure pressure is 32 MPa; when the well is opened with different production rates, the closure pressure gradually decreases as the production rate decreases, as is shown in Table 2
The experiment explores the change in inflow conductivity in the fracture by simulating the gradual decrease in production in the formation production process. In the experiments of long-term inflow conductivity of gas measurement for opening and closing wells, each section of the simulation experiment of opening or closing wells is 12 h, three repeats of losing well experiments are carried out, and the closure pressures at the three repeats of closing wells are the formation pressures, and the closure pressures at the time of opening the wells are 39.5 MPa, 36.15 MPa, and 34.2 MPa, respectively. The experimental materials are selected as 40/70 mesh quartz sand proppant, and the curves of the changes in the inflow conductivity of the gas measurements over time are as follows in Figure 6. It can be seen that the inflow conductivity rises after well shut-in at different production rates. And with the increase in the number of well closures, the inflow conductivity decreased at the opening of the well. In the first well shutdown at the production rate of 7 × 10⁴ m3/d, the closure pressure decreased from 39.5 MPa to 32 MPa, and the inflow conductivity increased by 20.6%; in the second well shutdown at the production rate of 6 × 10⁴ m3/d, the closure pressure decreased from 36.15 MPa to 32 MPa, and the inflow conductivity increased by 9.4%; and in the third well shutdown at the production rate of 5 × 10⁴ m3/d, the closure pressure decreased from 34.2 MPa to 32 MPa, and the inflow conductivity rose by 2.8%. The increase in inflow conductivity due to well shut-in decreases with the decrease in production. Meanwhile, for the first and second well closures, the inflow conductivity at the time of well closure decreased by 1.26%, and for the second and third well closures, the inflow conductivity at the time of well closure decreased by 1.38%. Therefore, frequent switching off and on wells and adjusting production parameters in the process of shale gas production still have a large impact on the fracture inflow capacity.

5. Conclusions

  • This paper investigates the changing law and injury mechanism of proppant fracture conductivity in shale gas reservoirs during the integrated process of fracturing–flowback and production through indoor experiments, which is a guide to the design of fracturing schemes and production optimization in the field.
  • Simulating the production process of fracturing–flowback and production, the proppant fracture capacity gradually picks up as the gas discharge increases. When the reservoir closure pressure is higher, the rise in the inflow conductivity is more affected, and the inflow conductivity rises slowly.
  • Frequent switching off and on of wells due to different working rules in the middle and late stages of production leads to fluctuations in closure pressure, and fluctuations in closure pressure have a large impact on inflow capacity. The increase in inflow conductivity after well closure under three production regimes of 7 × 10⁴ m3/d, 6 × 10⁴ m3/d, and 5 × 10⁴ m3/d were 20.6%, 9.4%, and 2.8%, respectively.
  • The influence of reservoir depth on fracture conductivity cannot be ignored. With the exploration and development of deep shale gas, these issues will gradually gain more attention.

Author Contributions

D.X.: project management, access to funds, and validation. C.L. and Z.L.: project management and validation. Y.G.: verification and validation. All authors have read and agreed to the published version of the manuscript.

Funding

This study was supported by the Open Fund of Sinopec Key Laboratory of Shale Oil/Gas Exploration and Production Technology (“Study on stimulation mechanism of fracturing, soaking and production integration of shale oil reservoir”).

Data Availability Statement

No new data were created or analyzed in this study.

Conflicts of Interest

Authors Changheng Li and Yukai Guo have received research grants from PetroChina Changqing Oilfield Company. The PetroChina Changqing Oilfield Company had no role in the design of the study; in the collection, analyses, or interpretation of data; in the writing of the manuscript, or in the decision to publish the results.

References

  1. Jiang, H.; Liu, S.; He, B.S.; Chen, M.; Cao, Y.F. Research on hydraulic fracturing mechanism of shale gas reservoir. Sci. Technol. Eng. 2014, 14, 23–25. [Google Scholar] [CrossRef]
  2. Jiang, Y.Q.; Dong, D.Z.; Chi, L.; Shen, Y.F.; Jiang, C.; He, B.W. Basic characteristics of shale gas reservoirs and their evaluation. Nat. Gas Ind. 2010, 30, 7–12+113–114. [Google Scholar] [CrossRef]
  3. Wang, X.; Winterfeld, P.; Ma, X.; Ye, D.; Miao, J.; Wang, Y.; Wang, C.; Wu, Y.-S. Simulation of Coupled Hydraulic Fracturing Propagation and Gas Well Performance in Shale Gas Reservoirs. In Proceedings of the SPE Unconventional Resources Conference, The Woodlands, TX, USA, 1–3 April 2014. [Google Scholar]
  4. Ju, Y.W.; Bu, H.L.; Guang, G.C. Main characteristics of shale gas reservoirs and their impact on reservoir modification. Adv. Earth Sci. 2014, 29, 492–506. [Google Scholar]
  5. Li, Q.; Li, Q.; Wang, F.; Wu, J.; Wang, Y. The Carrying Behavior of Water-Based Fracturing Fluid in Shale Reservoir Fractures and Molecular Dynamics of Sand-Carrying Mechanism. Processes 2024, 12, 2051. [Google Scholar] [CrossRef]
  6. Li, Q.; Li, Q.; Han, Y. A Numerical Investigation on Kick Control with the Displacement Kill Method during a Well Test in a Deep-Water Gas Reservoir: A Case Study. Processes 2024, 12, 2090. [Google Scholar] [CrossRef]
  7. Meng, L.; Shi, H.; Zhou, C.J.; Hui, B.; Li, P.; Zhao, J.S. Evaluation and optimization of proppant inflow capacity for fracturing in tight gas reservoirs. J. Xi’an Pet. Univ. (Nat. Sci. Ed.) 2022, 37, 59–64. [Google Scholar] [CrossRef]
  8. Zhou, Z.H.; Zhu, W.Y.; Song, Z.Y. Effect of clear water on the damage of shale microfracture conductivity. In Proceedings of the Twenty-Third Annual Academic Conference of the Beijing Mechanics Society, Beijing Mechanics Society, Beijing, China, 14 January 2017. [Google Scholar]
  9. Elputranto, R.; Cirdi, A.P.; Akkutlu, I.Y. Formation Damage Mechanisms Due to Hydraulic Fracturing of Shale Gas Wells. In Proceedings of the SPE Europec, Virtual, 1–3 December 2020. [Google Scholar]
  10. Chen, Y.X. Research on the Mechanism of Post-Pressure Return and Drainage of Oil and Gas Wells and the Optimization Method of Working Regime. Doctoral Thesis, China University of Petroleum (East China), Dongying, China, 2019. [Google Scholar]
  11. Wen, Q.Z.; Wang, Q. Analysis and discussion of factors affecting long-term inflow capacity of proppant. Inn. Mong. Petrochem. Ind. 2003, 29, 101–104. [Google Scholar] [CrossRef]
  12. Wang, S.B. Overview of clear water fracturing technology. Nat. Gas Explor. Dev. 2005, 28, 39–42+72. [Google Scholar] [CrossRef]
  13. Fu, L.P. Research on Self-Polymerizing Proppant for Channel Fracturing. Doctoral Thesis, China University of Petroleum (East China), Dongying, China, 2017. [Google Scholar]
  14. Zhu, J.J.; Zhang, G.Q.; Qiao, G.F.; Xiao, B. Research and pilot application of slickwater for shale gas fracturing. Petrochem. Appl. 2013, 32, 24–28. [Google Scholar] [CrossRef]
  15. Wang, L.; Zhang, S.C.; Zhang, W.Z.; Wen, Q.Z. Experimental study on long-term hydraulic conductivity of proppant combinations with different particle sizes in composite fracturing. Nat. Gas Ind. 2005, 25, 64–66+155–156. [Google Scholar] [CrossRef]
  16. Eline, V.F.; Akkutlu, I.Y.; Moridis, G.J. Impact of Hydraulic Fracturing Fluid Damage on Shale Gas Well Production Performance. In Proceedings of the SPE Annual Technical Conference and Exhibition, Dubai, United Arab Emirates, 26–28 September 2016. [Google Scholar]
  17. Hui, G.; Chen, Z.; Schultz, R.; Chen, S.; Song, Z.; Zhang, Z.; Song, Y.; Wang, H.; Wang, M.; Gu, F. Intricate unconventional fracture networks provide fluid diffusion pathways to reactivate pre-existing faults in unconventional reservoirs. Energy 2023, 282, 128803. [Google Scholar] [CrossRef]
  18. Liu, Q.G.; Tang, F.P.; Feng, G.Q.; Yan, Z.H.; Hu, X.P.; Chen, J.; Li, Y. Influence of different degrees of stress sensitivity on bottomhole pressure dynamics in switching wells. Oil Gas Geol. 2007, 523–527. [Google Scholar] [CrossRef]
  19. Han, H.F.; Peng, J.L.; Wu, J.; Gao, J.; Wang, L. Testing method for long-term inflow capacity of shale-supported fractures and modification of testing device. Drill. Process 2018, 41, 55–58+5. [Google Scholar] [CrossRef]
  20. Wang, L.; Wang, Q. Experimental study on flow conductivity of hydraulically fractured complex fractures in shale gas reservoirs. J. Xi’an Pet. Univ. (Nat. Sci. Ed.) 2017, 32, 73–77. [Google Scholar] [CrossRef]
Figure 1. HXDL-2C evaluation device for long-term flow-conducting capability of proppant and working flow chart.
Processes 12 02908 g001
Figure 2. Changing law of inflow conductivity of different fracturing fluids. ①/②/③/④/⑤/⑥ are the initial gas measurement, the liquid measurement, and the gas measurement stage under the initial gas measurement displacement of 25%, 50%, 75%, and 100%.
Processes 12 02908 g002
Figure 3. Changing law of inflow conductivity of different proppant types. ①/②/③/④/⑤/⑥ are the initial gas measurement, the liquid measurement, and the gas measurement stage under the initial gas measurement displacement of 25%, 50%, 75%, and 100%.
Processes 12 02908 g003
Figure 4. Changing law of different particle sizes. ①/②/③/④/⑤/⑥ are the initial gas measurement, the liquid measurement, and the gas measurement stage under the initial gas measurement displacement of 25%, 50%, 75%, and 100%.
Processes 12 02908 g004
Figure 5. Changing law of different closure pressures. ①/②/③/④/⑤/⑥ are the initial gas measurement, the liquid measurement, and the gas measurement stage under the initial gas measurement displacement of 25%, 50%, 75%, and 100%.
Processes 12 02908 g005
Figure 6. Effect of opening and closing wells on the flow-conducting capacity of quartz sand.
Processes 12 02908 g006
Table 1. Design of simulated flowback experiment.
Experiment NumberType of ProppantProppant MeshFracturing Fluid TypeClosing Pressure
1ceramic granule20/40 meshdistilled water35 MPa
2ceramic granule20/40 meshslickwater fracturing fluid35 MPa
3ceramic granule20/40 meshPolymer Fracturing Fluid35 MPa
4quartz sand20/40 meshdistilled water35 MPa
5mineral sand20/40 meshdistilled water35 MPa
6ceramic granule40/70 meshdistilled water35 MPa
7ceramic granule70/140 meshdistilled water35 MPa
8ceramic granule40/70 meshdistilled water25 MPa
9ceramic granule40/70 meshdistilled water45 MPa
Table 2. Calculation results of bottomhole pressure and closure pressure at different production rates.
Production Rate/(×104 m3/d)Wellbore Pressure/MPaClosing Pressure/MPa
713.039.5
619.736.15
523.634.2
Disclaimer/Publisher’s Note: The statements, opinions and data contained in all publications are solely those of the individual author(s) and contributor(s) and not of MDPI and/or the editor(s). MDPI and/or the editor(s) disclaim responsibility for any injury to people or property resulting from any ideas, methods, instructions or products referred to in the content.

