Article

Comparative Exergy Analysis of Series and Parallel Dual-Pressure Auto-Cascade Organic Rankine Cycles

1
Shandong Tianrui Heavy Industry Co., Ltd., Weifang 261061, China
2
School of Energy and Power Engineering, Shandong University, 73 Jingshi Road, Jinan 250061, China
*
Author to whom correspondence should be addressed.
Processes 2024, 12(12), 2872; https://doi.org/10.3390/pr12122872
Submission received: 7 November 2024 / Revised: 3 December 2024 / Accepted: 10 December 2024 / Published: 16 December 2024

Abstract

The organic Rankine cycle (ORC) is a valuable method for harnessing low-temperature waste heat to generate electricity. In this study, two dual-pressure auto-cascade ORC systems driven by low-grade geothermal water are proposed in series and parallel configurations to ensure high thermal efficiency and power output. The energy and exergy analysis models for two systems are developed for comparative and parametric analysis, which uses a zeotropic refrigerant mixture of R134a and R245fa. The findings indicate that, with a heat source temperature of 393.15 K, the thermal efficiency and exergy efficiency of the series auto-cascade ORC reach 10.12% and 42.07%, respectively, which are 27% and 21.9% higher than those of the parallel auto-cascade ORC. However, the parallel cycle exhibits a higher net power output, indicating a better heat source utilization. The exergy analysis shows that evaporator 1 and the condenser possess the highest exergy destruction in both cycles. Finally, the parameter analysis reveals that the system performance is affected significantly by the heat source and heat sink temperature, the pinch temperature difference, and the refrigerant mixture concentration. These findings could provide valuable insights for improving the overall performance of ORCs driven by low-grade energy when using zeotropic refrigerant mixtures.

1. Introduction

Low-grade waste heat resources refer to the heat generated during industrial production or the geothermal energy that has not yet been effectively utilized. Recovering and utilizing this low-grade energy through waste heat recovery technology has been critical in promoting energy utilization efficiency and reducing carbon emissions [1]. Low-grade waste heat, typically found as low-temperature hot water, presents considerable potential for recovery [2]. To alleviate the current energy shortage and environmental pollution problems, it is essential not only to focus on developing new energy sources but also to explore new technologies to improve the efficiency of low-grade energy utilization usage.
Currently, the mainstream methods for low-grade energy conversion are the Kalina cycle and the organic Rankine cycle (ORC) [3,4]. The research on the ORC mainly focuses on the cycle configurations, the refrigerant selections [5], and the expansion device developments [6]. Various ORC cycle configurations include transcritical cycles, multi-pressure evaporation cycles, regenerative cycles, and cycles with injection boosters [7]. Bamorovat Abadi et al. [8] investigated the performance of refrigerant mixtures compared to pure refrigerants. The results demonstrated that refrigerant mixtures could enhance the exergy efficiency of both the evaporator and condenser. Shahrooz et al. [9] analyzed 25 pure refrigerants and 104 refrigerant mixtures, comparing the performance of refrigerant mixtures with their pure refrigerants. The findings showed that refrigerant mixtures offered performance improvements and higher exergy efficiency. Zhao et al. [10] reviewed expansion devices for ORC systems, including scroll, screw, piston, vane, turbine, and injector types, guiding the selection of expansion devices in ORC systems. Cao et al. [4] discussed the working fluid selection, cycle improvement methods, integrated systems, and applications of ORC. ORC is used in a variety of cycle forms, such as transcritical cycles [11], trilateral cycles, multiple evaporation pressure cycles [12], and organic flash cycles [13]. In order to achieve better thermodynamic performance, the original cycle form is usually improved by the addition of the regenerator [14], the reheater, or the vapor ejector [15].
The Kalina cycle utilizes ammonia water as the working fluid, with the commonly used KCS-11 configuration being suitable for waste heat recovery in the range of 100–200 °C [16,17]. Compared to the ORC, the Kalina cycle incorporates a gas-liquid separator for component regulation [18]. Although the Kalina cycle offers higher thermodynamic efficiency, its heat source utilization is lower due to the incomplete evaporation process. Kumar Singh et al. [19] integrated the Kalina cycle with a parabolic trough collector, achieving a maximum thermal efficiency of 48.17%. Anish Modi et al. [20] proposed four configurations of the Kalina cycle based on different regenerators and compared their cycle efficiency and cooling water requirements, identifying the optimal layout. Parvathy S. et al. [21] improved the performance of the Kalina cycle by employing a two-stage expansion, resulting in a 4.04% increase in cycle thermal efficiency.
Ammonia water is a common zeotropic fluid known for its “temperature glide” behavior [22], allowing it to match the temperature variations of the waste heat during the evaporation process, thereby reducing irreversibilities in the heat exchange within the evaporator. However, ammonia is flammable and toxic, which poses risks for large-scale power generation systems. In recent years, binary zeotropic refrigerant mixtures composed of different boiling point substances have gained widespread application [23,24,25]. Zeotropic mixture refrigerants can reduce irreversible losses during the two-phase heat transfer of ORC compared to pure refrigerants due to the better matching of the temperature distribution to the heat source/sink, enabling an increase in the mean temperature of the heat supply and/or a decrease in the mean temperature of the heat rejection, which leads to better thermodynamic performance [26,27]. However, zeotropic mixture refrigerants have lower phase change heat transfer coefficients and require larger heat transfer areas, making them incur higher capital investment costs [28]. Drawing inspiration from both the auto-cascade cycle and the Kalina cycle, Zhao et al. [26] proposed an auto-cascade Rankine cycle (ARC) using zeotropic mixtures to minimize thermodynamic irreversibilities. Compared to the ORC, the ARC achieved a 13.1% increase in thermal efficiency and a 13.7% improvement in energy utilization.
The dual-pressure evaporation cycle significantly reduces irreversibilities in the evaporator by employing a dual-pressure evaporation strategy [27], thereby greatly enhancing heat source utilization and power generation. Li et al. [28] introduced the system layout, process characteristics, and component arrangement of dual-pressure evaporation ORCs, along with an overview of cycle structure enhancements and potential application fields. Zheng et al. [29] investigated the effects of zeotropic mixtures (R245fa and R152a) on two types of dual-pressure series and parallel ORCs. The results indicated that using zeotropic refrigerant mixtures improved the net power output of both systems. Zheng et al. [30] also proposed a parallel dual-pressure Kalina cycle system for harnessing geothermal energy. The findings revealed that the maximum net power output is increased by 19.9% and the exergy efficiency is increased by 33.3% compared to the simple Kalina cycle. Shokati et al. [31] compared the simple ORC, dual-pressure ORC, and Kalina cycle, and the results revealed that the dual-pressure ORC had the highest net power output, surpassing the simple ORC by 15.22%. Additionally, the Kalina cycle exhibited the lowest cost, with its optimal value being 52.09% lower than that of the dual-pressure ORC.
As previously discussed, the organic Rankine cycle (ORC) is known for its high heat source utilization efficiency, while the auto-cascade Rankine cycle (ARC) has excellent thermal efficiency. Considering a dual-pressure evaporation strategy, combining the ARC with the ORC can enhance the overall performance of the cycle system. This study proposes dual-pressure ORC configurations in both series and parallel forms and provides a comparative study and parametric analysis. The structure of the paper is summarized as follows: The second section describes the proposed systems; the third section details the system thermodynamic models; the fourth section compares the two proposed cycles and performs exergy analysis, and then examines the effects of crucial parameters on the thermodynamic performance of the system.

2. System Description

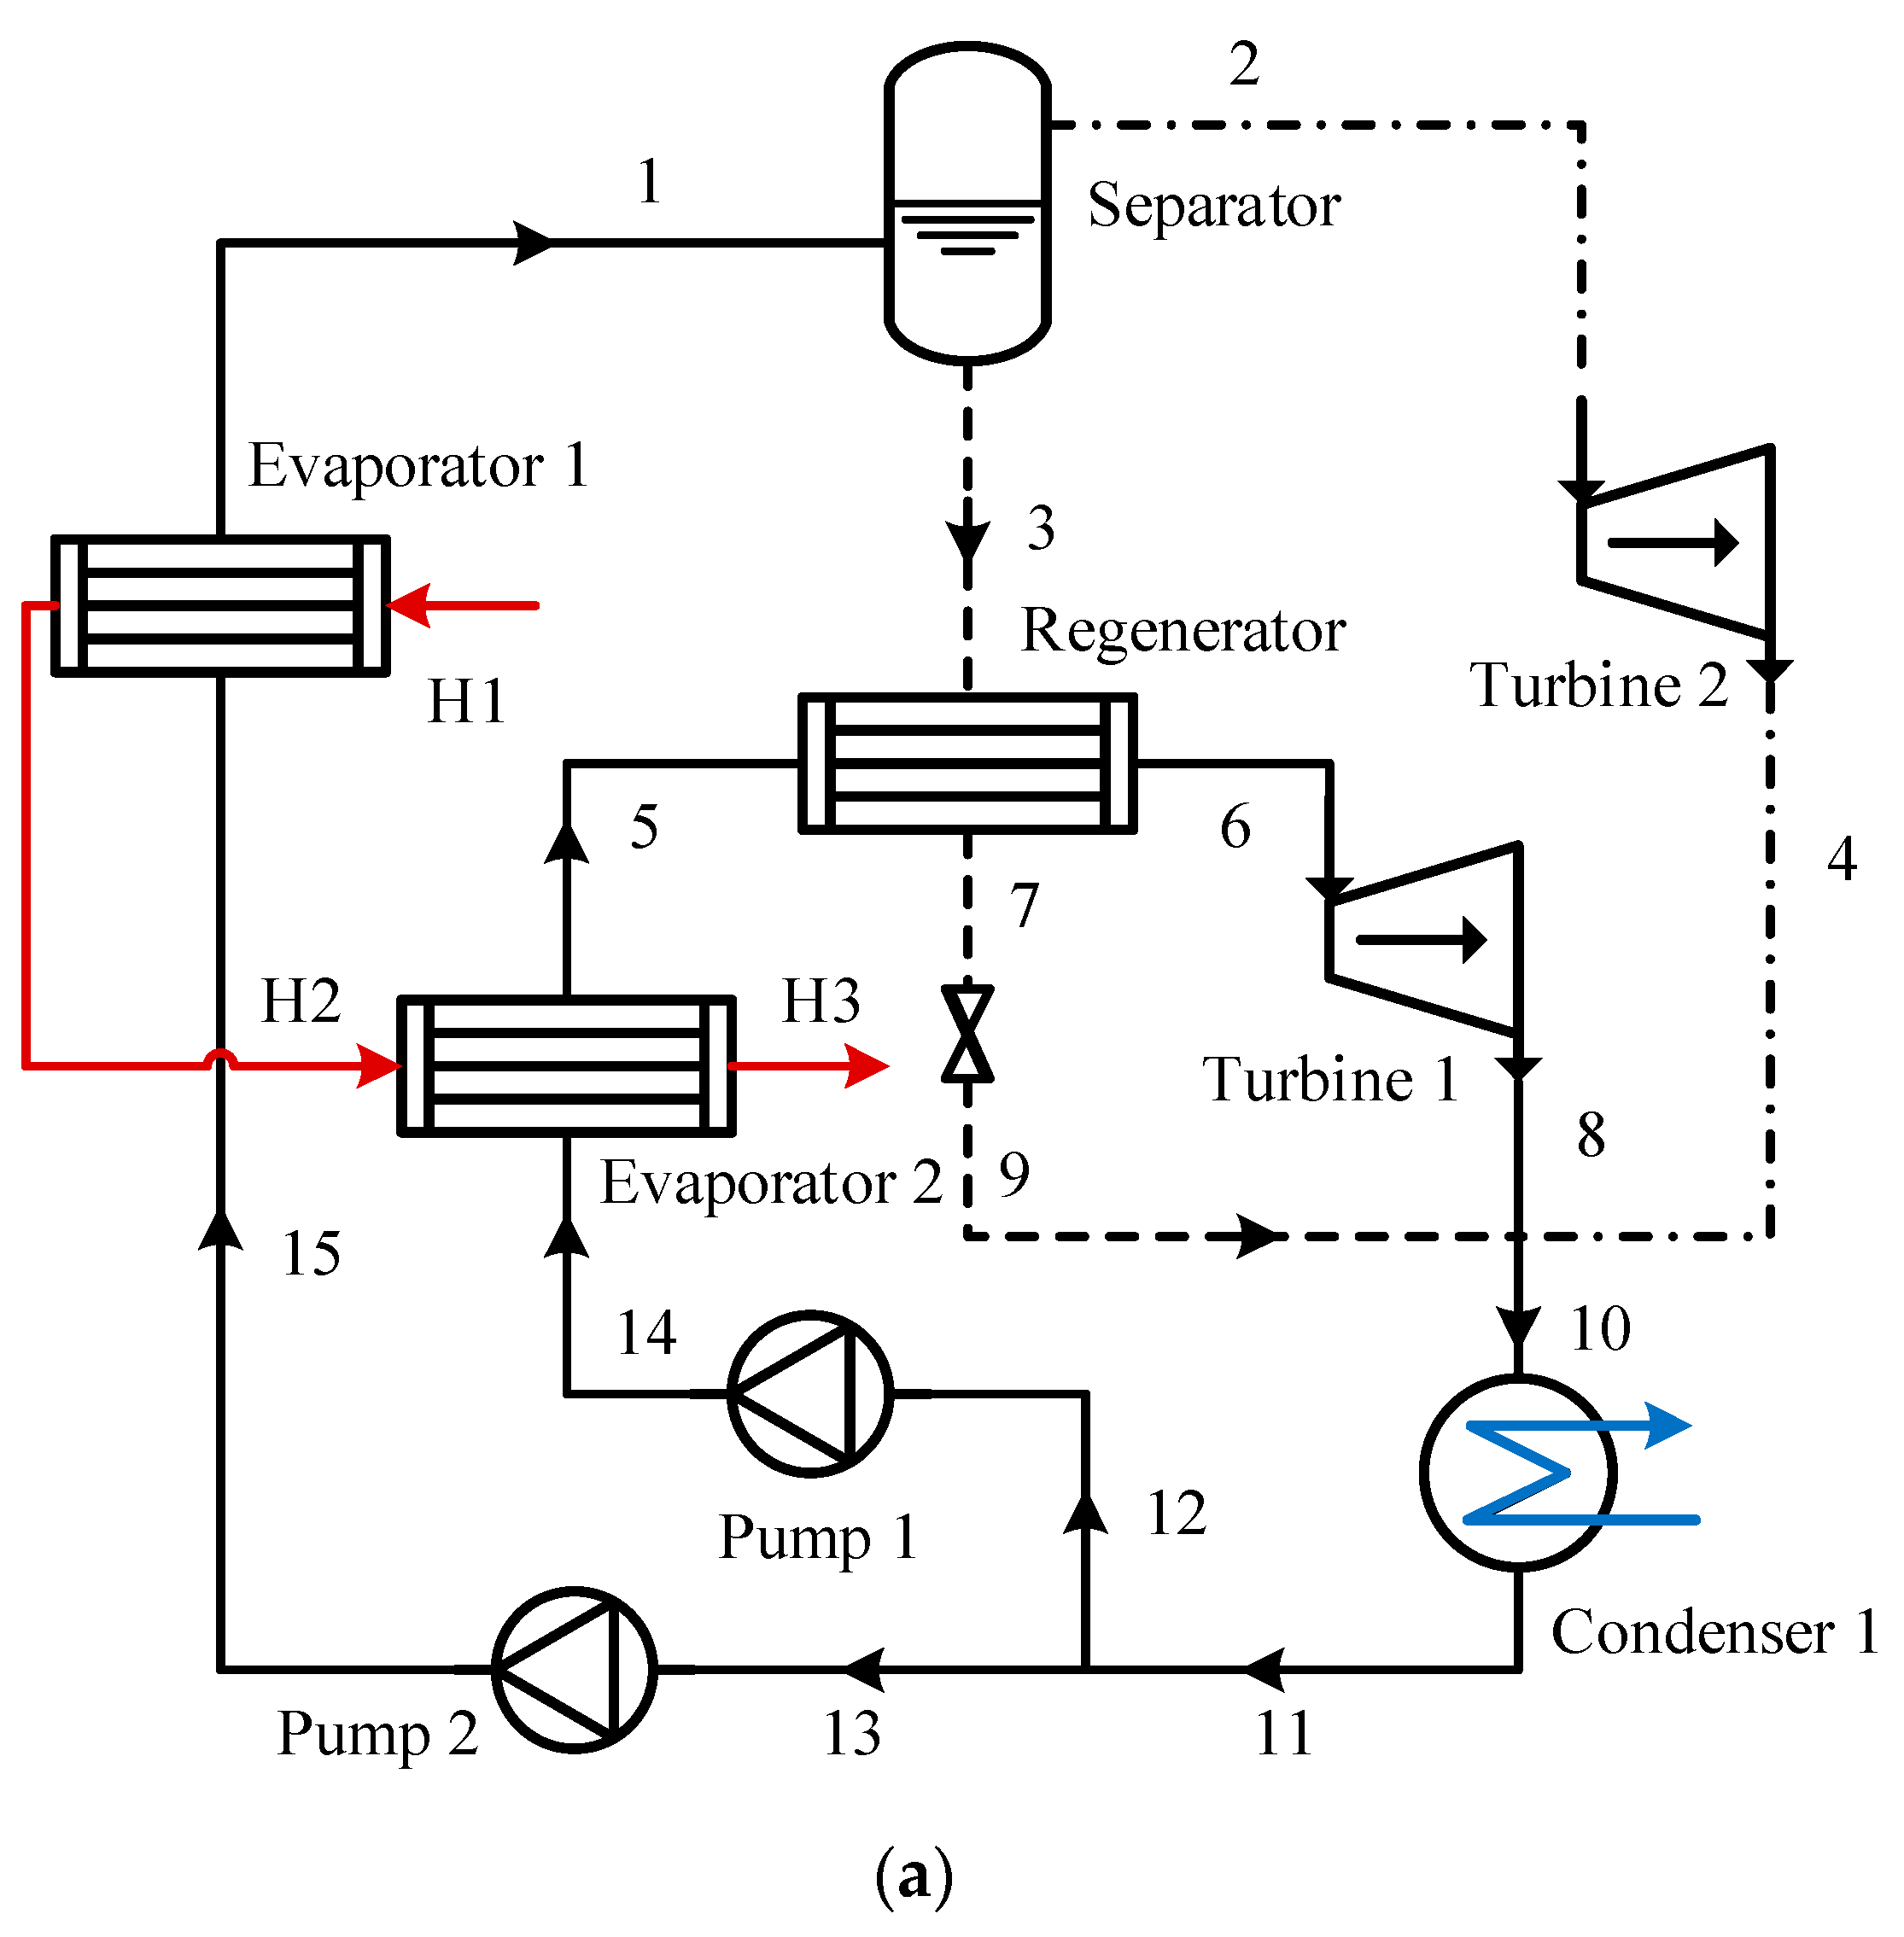
The schematic of the series auto-cascade organic Rankine cycle (SAORC) is shown in Figure 1. The working fluid absorbs heat from industrial wastewater in evaporator 1, turning into a high-pressure vapor–liquid mixture with a quality of about 0.5. This mixture is separated into saturated vapor and liquid in a vapor–liquid separator. The vapor contains more low-boiling fluid, while the liquid contains more high-boiling fluid. The high-pressure liquid is then throttled to an intermediate pressure and enters evaporator 2, where it absorbs more heat and becomes superheated vapor. Meanwhile, the high-pressure vapor expands in turbine 2 to produce power, while the intermediate-pressure vapor powers turbine 1. The exhaust from turbine 1 is condensed, pressurized, and combined with the low-pressure vapor from turbine 2 before entering condenser 2 for further condensation. The condensed fluid is then pressurized and sent back to evaporator 1 to repeat the cycle.
The PAORC diagram (Figure 2) shows the system where subcooled liquid at point 11 is split into two streams. One is pressurized by pump 2 and enters evaporator 1 (point 15), while the other is pressurized by pump 1 to intermediate pressure and enters evaporator 2 (point 14). Waste heat passes through both evaporators, heating the zeotropic working fluid. The solution at point 1 is separated into saturated vapor (point 2) and liquid (point 3) in a separator. The vapor expands in turbine 2, generating power, while the liquid heats the vapor through a regenerator and becomes superheated (point 5). The superheated vapor at point 6 expands in turbine 1. Low-pressure vapors from points 4 and 8, along with the working fluid, combine at point 10 and enter the condenser. The condensed fluid then returns through pumps 1 and 2 to complete the cycle.
In the SAORC, the intermediate pressure is reduced by a throttling valve, which acts as a conventional ORC. The valve forms a series configuration with the high-pressure portion of the auto-cascade organic Rankine cycle. The PAORC combines the auto-cascade organic Rankine cycle with the conventional ORC, where the high-pressure section uses the auto-cascade configuration and the intermediate-pressure section uses the conventional configuration, achieving a parallel combination of the two cycles.

3. Cycle Modelling

3.1. Thermodynamic Model

The system assumptions are summarized as follows [32]:
(1)
The system operates under steady-state conditions.
(2)
Pressure losses during flow and heat dissipation are neglected.
(3)
The zeotropic refrigerant mixture at the condenser outlet is kept saturated.
(4)
The gas-liquid separator outlets are in a state of saturated vapor and saturated liquid.
The first law of thermodynamics involves analyzing energy conservation within the system, ensuring that energy input and output are balanced. The second law of thermodynamics involves examining the exergy changes within the system to ensure that it adheres to the principles of irreversibility during actual operation.
For each component, the mass conservation equation is expressed as follows:
i m i n = i m o u t
The energy conservation equations for each component are as follows:
i ( Q i n Q o u t ) + j ( m i n h i n m o u t h o u t ) + k ( W i n W o u t ) = 0
For the low-boiling-point refrigerant component in a zeotropic mixture, the mass fraction conservation equation is shown as follows:
i m i n x i n = i m i n x o u t
The exergy balance equations are as follows [33]:
i m i n e x i n = i m o u t e x o u t + i W + i E x D
where ExD is the exergy destruction.
The energy balance equations in the ORC are provided in Table 1. The calculation of the exergy destruction and exergy efficiency of each component in the SAORC and PAORC is shown in Table 2 and Table 3.
The net power output of the ORC system is calculated as follows:
W n e t = W t W p
The thermal efficiency of the ORC system is defined as follows:
η t h = W n e t Q e v a
The exergy efficiency of the ORC can be expressed as follows:
η e x = W n e t E x i n
where the input exergy is calculated as follows:
E x i n = Q e v a ( 1 T sin k / T s o u r c e )

3.2. Model Validation

Under the conditions of a geothermal water temperature of 449.17 K and a condensation temperature of 288.15 K, the auto-cascade organic Rankine cycle (ARC) model is compared with the reference model proposed in the literature [26]. Using a refrigerant mixture of R245fa and R601a, the results in Table 4 indicate that the error between the present model and the reference model is less than 5%, demonstrating the developed model has high precision. The series and parallel cycles are improvements based on the auto-cascade organic Rankine cycle, so the results obtained by the model are reliable.

4. Results and Discussion

4.1. Comparative Analysis

Choosing the right working fluid can significantly improve system efficiency, especially in zeotropic mixture applications. Zeotropic fluids exhibit a temperature glide during phase changes, which optimizes temperature matching in evaporators and condensers, thereby reducing system irreversibility. In this study, the mixture of R134a and R245fa is selected as components of the zeotropic mixture. These fluids have distinct application backgrounds; that is, R134a is widely used in refrigeration, while R245fa is commonly utilized in heat pumps and ORC [34]. The physical properties of the R134fa and R245fa mixtures were calculated using the RefProp 10.0 software [35], and this is the most widely used and cheapest of the blends [36]. The physical property data for R134a and R245fa are presented in Table 5. The phase diagram of zeotropic fluids is illustrated in Figure 3. At a given concentration, the temperature glide is represented by the difference between the dew point temperature and the bubble point temperature. For the same mass fraction, the evaporation and condensation pressures are different. As the proportion of the low-boiling refrigerant increases, both condensation and evaporation pressure increase.
When using R134a and R245fa as working fluids, the performance of the series auto-cascade organic Rankine cycle (SAORC) is compared with that of the parallel auto-cascade organic Rankine cycle (PAORC). The input parameters are shown in Table 6; the heat source is industrial wastewater, with the heat source and heat sink temperatures set at 393.15 K and 303.15 K, respectively.
As indicated in Table 7, the findings reveal that the SAORC achieves a thermal efficiency of 10.12%, which is 27% higher than that of the PAORC. In addition, the exergy efficiency of the SAORC is 42.07%, which exceeds the exergy efficiency of the PAORC by 21.9%. This indicates that the SAORC outperforms the PAORC in thermodynamic performance. The superior performance of the SAORC is attributed to its optimized system design, which reduces the expansion work of the throttling valve, thereby decreasing the overall pump power consumption and increasing the system’s net power output. However, the SAORC has a higher hot water outlet temperature at condenser output compared to the PAORC. This indicates that the SAORC absorbs less heat from hot water, leading to a lower heat source utilization efficiency. Table 8 and Table 9 show the thermodynamic parameters of each state point of the SAORC and PAORC. For vapor quality, 998 means overheated, and −1 means undercooled.

4.2. Exergy Analysis

The exergy analysis can identify the areas for potential improvement. In the SAORC system, the exergy destruction and exergy efficiency are shown in Figure 4. The main exergy destruction is evaporator 1 and condenser 1, which have large heat transfer capacities of 478.9 kW and 283.5 kW, respectively, leading to significant exergy destruction. Additionally, the exergy efficiency of these components is relatively low, both less than 90%. Notably, condenser 1 has an exergy efficiency of 60.59%, making it a critical area for improvement in enhancing the overall exergy efficiency. By optimizing the cooling water flow rate to align more closely with the temperature glide of the refrigerant on the condenser side, then irreversible losses can be effectively reduced.
In the PAORC system, shown in Figure 5, evaporator 1 and the condenser continue to be the largest contributors to exergy destruction. Due to the parallel system absorbing more waste heat, the higher refrigerant flow rate leads to the condenser’s exergy destruction being 1.9 times that of the series system. Moreover, the exergy destruction in the throttling valve 1 is significantly higher in the parallel system, at 7.5 times that of the series system, with an exergy efficiency of only 70.62% (compared to 96.39% in the series system). This is one of the main reasons why the overall exergy efficiency of the parallel system is lower than that of the series system. The series system recovers part of the expansion work to generate power, not only reducing exergy destruction in the throttling valve but also increasing the turbine’s power output. To further minimize exergy destruction during the throttling process, the use of ejectors or two-phase turbines could be considered [37].

4.3. Parameter Analysis

This section analyzes the effects of heat source temperature (Tsource), heat sink temperature (Tsink), heat exchanger pinch temperature difference (Tpinch), and a low-boiling-point refrigerant mass fraction (xmass) on system performance. These analyses will provide insights for system optimizing operations.
Figure 6 illustrates the impact of Tsource on the system’s thermal efficiency and exergy efficiency. As Tsource rises, the thermal efficiency of the SAORC gradually increases, showing a growth of 52.4% observed when Tsource is increased by 30 °C. The thermal efficiency of the PAORC is also increased by 43.1%. The exergy efficiency of the SAORC levels off with increasing Tsource, while the PAORC shows an initial increase followed by a decrease, peaking at a Tsource of 380 K. This behavior is due to the rising heat absorbed by the evaporator with the increasing Tsource and the corresponding increase in net power output, leading to a maximum exergy efficiency.
From the standpoint of the second law of thermodynamics, the PAORC operates more effectively at a Tsource of 380 K. In terms of net power output, the PAORC consistently exhibits higher heat exchange in the evaporator and a greater system net power output across all heat source temperatures. This indicates that the PAORC performs better at absorbing heat from the wasted heat and utilizes more of the available thermal energy from the hot water.
The impact of heat sink temperature (Tsink) is shown in Figure 7. The analysis reveals that both the thermal efficiency and exergy efficiency of the SAORC and PAORC decline as the Tsink rises. This occurs because an increase in Tsink raises the turbine back pressure, leading to a reduction in the pressure ratio and thereby decreasing the turbine power output. Consequently, both thermal efficiency and exergy efficiency decline. With an increase of 20 °C at heat sink temperature, the thermal efficiency of both systems drops by 30% to 33%, while the exergy efficiency decreases by 31% to 35%.
Additionally, as illustrated in Figure 7b, the heat absorption of the evaporator also decreases with a rising Tsink. This reduction occurs because the evaporator inlet refrigerant temperature increases, leading to reduced heat absorbed from the hot water according to energy balance principles. Since the reduction in power output occurs at a faster rate, higher heat sink temperatures negatively affect thermodynamic performance. Heat sink temperature is typically influenced by environmental factors. In warmer environments or during hotter seasons, higher heat sink temperatures can adversely affect system performance.
Figure 8 illustrates the influence of heat exchanger pinch temperature difference (Tpinch) on system performance. As the pinch temperature difference increases, both thermal efficiency and exergy efficiency decrease, with thermal efficiency dropping by 14% and exergy efficiency by 35%. The heat absorbed by the evaporator in both cycles gradually decreases, but the reduction is more pronounced in the PAORC, as the heat absorption in the evaporator 2 of the SAORC is less affected by Tpinch.
The net power output of both cycles also diminishes with increasing Tpinch due to the higher back pressure on the turbines, which reduces the power output. In summary, reducing the pinch temperature difference can enhance power output and improve heat source utilization efficiency. However, a very small temperature difference may increase the required heat exchanger area, and typically, the temperature difference should be greater than 2 °C. Furthermore, due to the compositional shift in zeotropic mixtures, temperature crossovers may occur in the evaporator [38], necessitating an appropriate increase in the Tpinch to maintain stable system operation.
Figure 9 demonstrates the effect of zeotropic mixture mass fraction (xmass) on system performance. For the SAORC, both thermal efficiency and exergy efficiency increase with the rising mass fraction of the low-boiling-point component. This is because, despite a reduction in net power output, the heat absorbed by the evaporator also decreases. Specifically, the net power output for the SAORC decreases by 24.6%, while the heat absorbed by the evaporator drops by 29.7%.
In the case of the PAORC, the thermal efficiency remains relatively constant as xmass increases, while the exergy efficiency slightly decreases. This is because both the heat absorbed by the evaporator and the net power output decrease with the increase in xmass, each showing a reduction of 21.3%. The decrease in net power output is attributed to the increase in condensing pressure caused by the higher xmass at the same condensation temperature, leading to higher back pressure. The heat reduction absorbed by the evaporator primarily results from a decrease in temperature glide with the rise in xmass, which increases the temperature of the hot water at the evaporator outlet.

5. Conclusions

Combining the basic organic Rankine cycle (ORC) with the high thermal efficiency of the auto-cascade cycle, this study proposes dual-pressure series and parallel auto-cascade ORC systems for waste heat recovery from geothermal water. A thermodynamic performance comparison and parameter analysis were performed for these systems using a mixture of R134a and R245fa refrigerants, which led to the following conclusions:
(1)
At a Tsource of 343.15 K, the thermal efficiency and exergy efficiency of the series auto-cascade ORC (SAORC) achieve 10.12% and 42.07%, respectively, which are 27% and 21.9% higher than those of the parallel auto-cascade ORC (PAORC). This indicates that the SAORC has superior thermodynamic performance. The geothermal water outlet temperature at condenser 2 for the SAORC is 378.8 K, which is 31.9% higher than that of the PAORC. This means that the series cycle has a lower net power output that is 43.1% lower than that of the parallel cycle.
(2)
In the SAORC and PAORC, evaporator 1 and the condenser experience the highest exergy destruction. Improving the temperature alignment between the cooling water and the refrigerant can significantly reduce the heat transfer irreversible losses. The series system, by recovering part of the expansion work for power generation, provides a higher exergy efficiency of 36.5% compared to the throttle in the parallel system, resulting in a higher overall exergy efficiency of the SAORC.
(3)
The thermal efficiencies of both the SAORC and the PAORC increase with the rise of Tsource. The exergy efficiency of the SAORC tends to stabilize with increasing Tsource, while the exergy efficiency of the PAORC reaches a peak at a Tsource of 380 K. Lowering Tsink and Tpinch is beneficial for improving the thermal and exergy efficiencies of both the series and parallel cycles. With an increase in xmass, the thermodynamic efficiency of the SAORC increases, while the thermal efficiency of the PAORC remains relatively stable, and its exergy efficiency decreases slightly.

Author Contributions

Conceptualization, Z.L. and J.Z.; Validation, H.Z.; Formal analysis, X.H.; Investigation, Y.Q.; Writing—original draft, Y.L.; Writing—review & editing, Z.Y. All authors have read and agreed to the published version of the manuscript.

Funding

The work was supported by the Shandong Province Central Guidance Local Science and Technology Development Fund (YDZX2022207).

Data Availability Statement

The original contributions presented in this study are included in the article. Further inquiries can be directed to the corresponding author(s).

Conflicts of Interest

Authors Yongsheng Li, Zhiyu Li, Haigang Zhang, Jieyu Zhang and Xiaohong He were employed by the company Shandong Tianrui Heavy Industry Co., Ltd. The remaining authors declare that the research was conducted in the absence of any commercial or financial relationships that could be construed as a potential conflict of interest.

Nomenclature

exspecific exergy, kJ/kg
Exexergy, kW
henthalpy, kJ/kg
mmass flow rate, m/s
Ppressure, bar
Qheat, kW
qvapor quality
TTemperature, K
Wpower, kW
xmass fraction
Greek letters
ηefficiency, %
ρdensity, kg/m3
Subscripts
comcompressor
concondenser
Ddestruction
evaevaporator
exexergy
ininlet
netnet
outoutlet
ppump
pinchpinch point
sisentropic process
sinkheat sink
sourceheat source
tturbine
ththermal
vvapor

References

  1. Jouhara, H.; Khordehgah, N.; Almahmoud, S.; Delpech, B.; Chauhan, A.; Tassou, S.A. Waste Heat Recovery Technologies and Applications. Therm. Sci. Eng. Prog. 2018, 6, 268–289. [Google Scholar] [CrossRef]
  2. Loni, R.; Najafi, G.; Bellos, E.; Rajaee, F.; Said, Z.; Mazlan, M. A Review of Industrial Waste Heat Recovery System for Power Generation with Organic Rankine Cycle: Recent Challenges and Future Outlook. J. Clean. Prod. 2021, 287, 125070. [Google Scholar] [CrossRef]
  3. Jaatinen-Värri, A.; Honkatukia, J.; Uusitalo, A.; Turunen-Saaresti, T.; Schuster, S.; Markides, C.N.; White, A.J. Design and Off-Design Optimisation of an Organic Rankine Cycle (ORC) System with an Integrated Radial Turbine Model. Appl. Therm. Eng. 2020, 174, 115192. [Google Scholar] [CrossRef]
  4. Cao, J.; Zheng, L.; Zheng, Z.; Peng, J.; Hu, M.; Wang, Q.; Leung, M.K.H. Recent Progress in Organic Rankine Cycle Targeting Utilisation of Ultra-Low-Temperature Heat towards Carbon Neutrality. Appl. Therm. Eng. 2023, 231, 120903. [Google Scholar] [CrossRef]
  5. Siddiqui, M.E.; Almatrafi, E.; Saeed, U. Performance Analysis of Organic Rankine Cycle with Internal Heat Regeneration: Comparative Study of Binary Mixtures and Pure Constituents in Warm Regions. Processes 2023, 11, 2267. [Google Scholar] [CrossRef]
  6. Feng, X.; Li, H.; Huang, J.; Ma, Q.; Lin, M.; Li, J.; Wu, Z. Structural Design and Analysis of a 100 kW Radial Turbine for an Ocean Thermal Energy Conversion–Organic Rankine Cycle Power Plant. Processes 2023, 11, 3341. [Google Scholar] [CrossRef]
  7. Lecompte, S.; Huisseune, H.; van den Broek, M.; Vanslambrouck, B.; De Paepe, M. Review of Organic Rankine Cycle (ORC) Architectures for Waste Heat Recovery. Renew. Sustain. Energy Rev. 2015, 47, 448–461. [Google Scholar] [CrossRef]
  8. Bamorovat Abadi, G.; Kim, K.C. Investigation of Organic Rankine Cycles with Zeotropic Mixtures as a Working Fluid: Advantages and Issues. Renew. Sustain. Energy Rev. 2017, 73, 1000–1013. [Google Scholar] [CrossRef]
  9. Shahrooz, M.; Lundqvist, P.; Nekså, P. Performance of Binary Zeotropic Mixtures in Organic Rankine Cycles (ORCs). Energy Convers. Manag. 2022, 266, 115783. [Google Scholar] [CrossRef]
  10. Zhao, Y.; Liu, G.; Li, L.; Yang, Q.; Tang, B.; Liu, Y. Expansion Devices for Organic Rankine Cycle (ORC) Using in Low Temperature Heat Recovery: A Review. Energy Convers. Manag. 2019, 199, 111944. [Google Scholar] [CrossRef]
  11. Li, Y.; Xu, S.-Z. Thermodynamic Analysis of Subcritical/Transcritical ORCs with Metal–Organic Heat Carriers for Efficient Power Generation from Low-Grade Thermal Energy. Energy 2022, 255, 124519. [Google Scholar] [CrossRef]
  12. Li, J.; Yang, Z.; Shen, J.; Duan, Y. Enhancement Effects of Adding Internal Heat Exchanger on Dual-Pressure Evaporation Organic Rankine Cycle. Energy 2023, 265, 126329. [Google Scholar] [CrossRef]
  13. Yu, Z.; Feng, C.; Lai, Y.; Xu, G.; Wang, D. Performance Assessment and Optimization of Two Novel Cogeneration Systems Integrating Proton Exchange Membrane Fuel Cell with Organic Flash Cycle for Low Temperature Geothermal Heat Recovery. Energy 2022, 243, 122725. [Google Scholar] [CrossRef]
  14. Dai, Y.; Wang, J.; Gao, L. Parametric Optimization and Comparative Study of Organic Rankine Cycle (ORC) for Low Grade Waste Heat Recovery. Energy Convers. Manag. 2009, 50, 576–582. [Google Scholar] [CrossRef]
  15. Xu, R.-J.; He, Y.-L. A Vapor Injector-Based Novel Regenerative Organic Rankine Cycle. Appl. Therm. Eng. 2011, 31, 1238–1243. [Google Scholar] [CrossRef]
  16. Kalina, A.I.; Leibowitz, H.M. Application of the Kalina Cycle Technology to Geothermal Power Generation. Trans.-Geotherm. Resour. Counc. 1989, 13, 605–611. [Google Scholar]
  17. Madhawa Hettiarachchi, H.D.; Golubovic, M.; Worek, W.M.; Ikegami, Y. The Performance of the Kalina Cycle System 11(KCS-11) With Low-Temperature Heat Sources. J. Energy Resour. Technol. 2007, 129, 243–247. [Google Scholar] [CrossRef]
  18. Zhang, X. A Review of Research on the Kalina Cycle. Renew. Sustain. Energy Rev. 2012, 16, 5309–5318. [Google Scholar] [CrossRef]
  19. Kumar Singh, S.; Kumar Tiwari, A.; Paliwal, H.K. Techno-Economic Assessment of Retrofitted Parabolic Trough Collector for Kalina Power Cycle. Appl. Therm. Eng. 2024, 236, 121550. [Google Scholar] [CrossRef]
  20. Modi, A.; Haglind, F. Thermodynamic Optimisation and Analysis of Four Kalina Cycle Layouts for High Temperature Applications. Appl. Therm. Eng. 2015, 76, 196–205. [Google Scholar] [CrossRef]
  21. Devi Parvathy, S.; Varghese, J. Energy Analysis of a Kalina Cycle with Double Turbine and Reheating. Mater. Today Proc. 2021, 47, 5045–5051. [Google Scholar] [CrossRef]
  22. Ahrens, M.U.; Loth, M.; Tolstorebrov, I.; Hafner, A.; Kabelac, S.; Wang, R.; Eikevik, T.M. Identification of Existing Challenges and Future Trends for the Utilization of Ammonia-Water Absorption–Compression Heat Pumps at High Temperature Operation. Appl. Sci. 2021, 11, 4635. [Google Scholar] [CrossRef]
  23. Andreasen, J.G.; Baldasso, E.; Kærn, M.R.; Weith, T.; Heberle, F.; Brüggemann, D.; Haglind, F. Techno-Economic Feasibility Analysis of Zeotropic Mixtures and Pure Fluids for Organic Rankine Cycle Systems. Appl. Therm. Eng. 2021, 192, 116791. [Google Scholar] [CrossRef]
  24. Fronk, B.M.; Garimella, S. In-Tube Condensation of Zeotropic Fluid Mixtures: A Review. Int. J. Refrig. 2013, 36, 534–561. [Google Scholar] [CrossRef]
  25. Blondel, Q.; Tauveron, N.; Lhermet, G.; Caney, N. Zeotropic Mixtures Study in Plate Heat Exchangers and ORC Systems. Appl. Therm. Eng. 2023, 219, 119418. [Google Scholar] [CrossRef]
  26. Bao, J.; Zhao, L. Exergy Analysis and Parameter Study on a Novel Auto-Cascade Rankine Cycle. Energy 2012, 48, 539–547. [Google Scholar] [CrossRef]
  27. Zhu, Z.; Zhang, Z.; Chen, Y.; Wu, J. Parameter Optimization of Dual-Pressure Vaporization Kalina Cycle with Second Evaporator Parallel to Economizer. Energy 2016, 112, 420–429. [Google Scholar] [CrossRef]
  28. Li, J.; Peng, X.; Yang, Z.; Hu, S.; Duan, Y. Design, Improvements and Applications of Dual-Pressure Evaporation Organic Rankine Cycles: A Review. Appl. Energy 2022, 311, 118609. [Google Scholar] [CrossRef]
  29. Zheng, Z.; Cao, J.; Wu, W.; Leung, M.K.H. Parallel and In-Series Arrangements of Zeotropic Dual-Pressure Organic Rankine Cycle (ORC) for Low-Grade Waste Heat Recovery. Energy Rep. 2022, 8, 2630–2645. [Google Scholar] [CrossRef]
  30. Zheng, S.; Chen, K.; Du, Y.; Fan, G.; Dai, Y.; Zhao, P.; Wang, J. Comparative Analysis on Off-Design Performance of a Novel Parallel Dual-Pressure Kalina Cycle for Low-Grade Heat Utilization. Energy Convers. Manag. 2021, 234, 113912. [Google Scholar] [CrossRef]
  31. Shokati, N.; Ranjbar, F.; Yari, M. Exergoeconomic Analysis and Optimization of Basic, Dual-Pressure and Dual-Fluid ORCs and Kalina Geothermal Power Plants: A Comparative Study. Renew. Energy 2015, 83, 527–542. [Google Scholar] [CrossRef]
  32. Yu, Z.; Feng, C.; Bian, F.; Wang, D. Investigation and Optimization of a Two-Stage Cascade ORC System for Medium and Low-Grade Waste Heat Recovery Using Liquefied Natural Gas Cold Energy. Int. J. Refrig. 2022, 135, 97–112. [Google Scholar] [CrossRef]
  33. Somayaji, C. First and Second Law Analysis of Organic Rankine Cycle. Ph.D Thesis, Mississippi State University, Starkville, MS, USA, 2008. [Google Scholar]
  34. Huber, M.L.; Lemmon, E.W.; Bell, I.H.; McLinden, M.O. The NIST REFPROP Database for Highly Accurate Properties of Industrially Important Fluids. Ind. Eng. Chem. Res. 2022, 61, 15449–15472. [Google Scholar] [CrossRef] [PubMed]
  35. Bell, I.H.; Lemmon, E.W. Automatic Fitting of Binary Interaction Parameters for Multi-Fluid Helmholtz-Energy-Explicit Mixture Models. J. Chem. Eng. Data 2016, 61, 3752–3760. [Google Scholar] [CrossRef]
  36. Bell, I.H.; Riccardi, D.; Bazyleva, A.; McLinden, M.O. Survey of Data and Models for Refrigerant Mixtures Containing Halogenated Olefins. J. Chem. Eng. Data 2021, 66, 2335–2354. [Google Scholar] [CrossRef] [PubMed]
  37. Yan, G.; Chen, J.; Yu, J. Energy and Exergy Analysis of a New Ejector Enhanced Auto-Cascade Refrigeration Cycle. Energy Convers. Manag. 2015, 105, 509–517. [Google Scholar] [CrossRef]
  38. Liu, L.; Cui, G.; Wieland, C.; Spliethoff, H. The Impact of Initial Working Fluid Charge on Performance of Organic Rankine Cycle Using Zeotrope Mixture under Design Condition. Appl. Therm. Eng. 2023, 223, 119994. [Google Scholar] [CrossRef]
Figure 1. Schematic diagram of the series auto-cascade organic Rankine cycle system (SAORC). (a) Schematic diagram of the SAORC. (b) T-s diagram of the SAORC.
Processes 12 02872 g001aProcesses 12 02872 g001b
Figure 2. Schematic diagram of the parallel auto-cascade organic Rankine cycle system (PAORC). (a) Schematic diagram of the PAORC. (b) T-s diagram of the PAORC.
Processes 12 02872 g002aProcesses 12 02872 g002b
Figure 3. Phase diagram of the zeotropic mixture of R134a and R245fa.
Processes 12 02872 g003
Figure 4. Exergy destruction and exergy efficiency of components of the SAORC.
Processes 12 02872 g004
Figure 5. Exergy destruction and exergy efficiency of components of the PAORC.
Processes 12 02872 g005
Figure 6. The impacts of heat source temperature (Tsource) on system performance. (a) Thermal efficiency and exergy efficiency. (b) Evaporation heat and net power output.
Processes 12 02872 g006aProcesses 12 02872 g006b
Figure 7. The impact of heat sink temperature (Tsink) on system performance. (a) Thermal efficiency and exergy efficiency. (b) Evaporation heat and net power output.
Processes 12 02872 g007aProcesses 12 02872 g007b
Figure 8. The effects of pinch temperature difference (Tpinch) on system performance. (a) Thermal efficiency and exergy efficiency. (b) Evaporation heat and net power output.
Processes 12 02872 g008aProcesses 12 02872 g008b
Figure 9. The effects of mass fraction of zeotropic mixture (xmass) on system performance. (a) Thermal efficiency and exergy efficiency. (b) Evaporation heat and net power output.
Processes 12 02872 g009aProcesses 12 02872 g009b
Table 1. Energy balance equations for each component.
ComponentsSAORCPAORC
Evaporator 1 Q e v a 1 = m 1 ( h 1 h 12 ) Q e v a 1 = m 1 ( h 1 h 15 )
Evaporator 2 Q e v a 2 = m 6 ( h 7 h 6 ) Q e v a 2 = m 5 ( h 6 h 5 )
Turbine 1 W t 1 = m 7 ( h 7 h 8 s ) η t W t 1 = m 6 ( h 6 h 8 s ) η t
Turbine 2 W t 2 = m 2 ( h 2 h 4 s ) η t W t 2 = m 2 ( h 2 h 4 s ) η t
Pump 1 W p 1 = m 10 ( h 10 s h 9 ) / η p W p 1 = m 14 ( h 14 s h 12 ) / η p
Pump 2 W p 2 = m 12 ( h 12 s h 11 ) / η p W p 2 = m 15 ( h 15 s h 13 ) / η p
Condenser 1 Q c o n 1 = m 8 ( h 8 h 9 ) Q c o n 1 = m 10 ( h 10 h 11 )
Condenser 2 Q c o n 2 = m 5 ( h 5 h 11 ) /
Regenerator/ Q ˙ r e g = m ˙ 3 ( h 3 h 7 ) = m ˙ 6 ( h 6 h 5 )
Table 2. Exergy destruction and exergy efficiency for each component in the SAORC.
SortsExergy DestructionExergy Efficiency
Evaporator 1 ( E x H 1 + E x 12 ) ( E x H 2 + E x 1 ) ( E x H 2 + E x 1 ) / ( E x H 1 + E x 12 )
Evaporator 2 ( E x H 2 + E x 6 ) ( E x H 3 + E x 7 ) ( E x H 3 + E x 7 ) / ( E x H 2 + E x 6 )
Condenser 1 E x 8 E x 9 E x 9 / E x 8
Condenser 2 E x 5 E x 11 E x 11 / E x 5
Pump 1 E x 9 + W p 1 E x 10 E x 10 / ( E x 9 + W p 1 )
Pump 2 E x 11 + W p 2 E x 12 E x 12 / ( E x 11 + W p 2 )
Turbine 1 E x 7 W t 1 E x 8 ( E x 8 + W t 1 ) / E x 7
Turbine 2 E x 2 W t 2 E x 4 ( E x 4 + W t 2 ) / E x 2
Valve 1 E x 3 E x 6 E x 6 / E x 3
Table 3. Exergy destruction and exergy efficiency for each component in the PAORC.
SortsExergy DestructionExergy Efficiency
Evaporator 1 ( E x H 1 + E x 12 ) ( E x H 2 + E x 1 ) ( E x H 2 + E x 1 ) / ( E x H 1 + E x 12 )
Evaporator 2 ( E x H 2 + E x 14 ) ( E x H 3 + E x 5 ) ( E x H 3 + E x 5 ) / ( E x H 2 + E x 14 )
Condenser E x 10 E x 11 E x 11 / E x 10
Regenerator ( E x 3 + E x 5 ) ( E x 7 + E x 6 ) ( E x 7 + E x 6 ) / ( E x 3 + E x 5 )
Pump 1 E x 12 + W p 1 E x 14 E x 14 / ( E x 12 + W p 1 )
Pump 2 E x 13 + W p 2 E x 15 E x 15 / ( E x 13 + W p 2 )
Turbine 1 E x 6 W t 1 E x 8 ( E x 8 + W t 1 ) / E x 6
Turbine 2 E x 2 W t 2 E x 4 ( E x 4 + W t 2 ) / E x 2
Valve 1 E x 7 E x 9 E x 9 / E x 7
Table 4. Model validation.
ParameterReference ModelPresent ModelError (%)
Power output (kW)55105592.71.5
Net power output (kW)535555483.6
Energy efficiency (%)15.9516.53.4
Exergy efficiency (%)59.1260.752.8
Table 5. The physical properties of R134a and R245fa [34].
RefrigerantTcrit (°C)Pcrit (MPa)ODPGWPSGM
R134a101.064.05901430A1102.032
R245fa153.863.6501030B1134.05
Table 6. The input parameters of the two proposed cycles.
ParameterValue
Tsource (K)393.15
Tpinch (K)5
msource (kg/s)10
Tsink (K)303.15
ηt0.8
ηp0.8
xmass0.5
qcon0.5
Table 7. The output value of the two proposed cycles.
ParameterSAORCPAORC
TH2 (K)381.9318.93
TH3 (K)378.8367.1
ηth10.127.97
ηex42.0734.87
Wt1 (kW)33.9665.74
Wt2 (kW)35.2735.27
Wp1 (kW)0.055.376
Wp2 (kW)7.8287.828
Qeva1 (kW)478.93478.93
Qeva2 (kW)127.45622.50
Table 8. Thermodynamic parameters of the SAORC.
StateT (K)P (bar)q (-)h (kJ/kg)s (kJ/kg-K)m (kg/s)
1388.232.760.5415.9041.6742.907
2388.232.761455.8061.7781.432
3388.232.760377.1431.5731.474
4318.75.910.9896431.1811.7971.432
5314.25.910.4954338.4231.5012.907
6370.722.590.3091377.1431.5781.474
7376.922.591463.5891.8101.474
8325.75.57998440.5571.8221.474
9308.25.570248.2831.2111.474
10308.25.91−1248.3171.2111.474
11308.25.910248.4381.2122.907
12309.832.76−1251.1311.2142.907
Table 9. Thermodynamic parameters of the PAORC.
StateT (K)P (bar)q (-)h (kJ/kg)s (kJ/kg-K)m (kg/s)
1388.232.760.5415.9041.6742.907
2388.232.761455.8061.7781.432
3388.232.760377.1431.5731.474
4318.75910.9896431.1811.7971.432
5376.924.041461.0881.8032.953
6381.224.04998468.0571.8212.953
7381.932.76−1363.1871.5371.474
8331.35.91998445.7931.8382.953
9318.55.910.6107363.1871.5771.474
10320.45.910.9276421.4351.7635.859
11308.25.910248.4381.2125.859
12308.25.910248.4381.2122.953
13308.25.910248.4381.2122.907
14309.324.04−1250.2591.2132.953
15309.832.76−1251.1311.2142.907
Disclaimer/Publisher’s Note: The statements, opinions and data contained in all publications are solely those of the individual author(s) and contributor(s) and not of MDPI and/or the editor(s). MDPI and/or the editor(s) disclaim responsibility for any injury to people or property resulting from any ideas, methods, instructions or products referred to in the content.

