


Urban-Scale Acoustic Comfort Map: Fusion of Social Inputs, Noise Levels, and Citizen Comfort in Open GIS


Abstract
1. Introduction
2. Materials and Methods
3. Implementing the Reference Architectures
3.1. Data Collection Campaign
3.2. Feeding the GIS
3.3. Model Training
4. Results
- CadnaA used 2020 data to predict noise levels for 2022.
- The measured noise levels included all possible noise sources, such as traffic, construction, and human activity, whereas the simulating software only considered traffic noise.
- CadnaA simulation does not account for road congestion effects.
- CadnaA simulation does not factor in the impact of traffic signals or other traffic control measures on flow.
5. Model Development
5.1. Data Preparation and Preprocessing
5.2. Prediction Models’ Performance
5.3. Deployment
6. Conclusions
- Integration of diverse data types: This study integrated actual noise measurements, simulated noise data, and social parameters of hypothetical travelers to comprehensively analyze the real-world impact of urban noise on citizens.
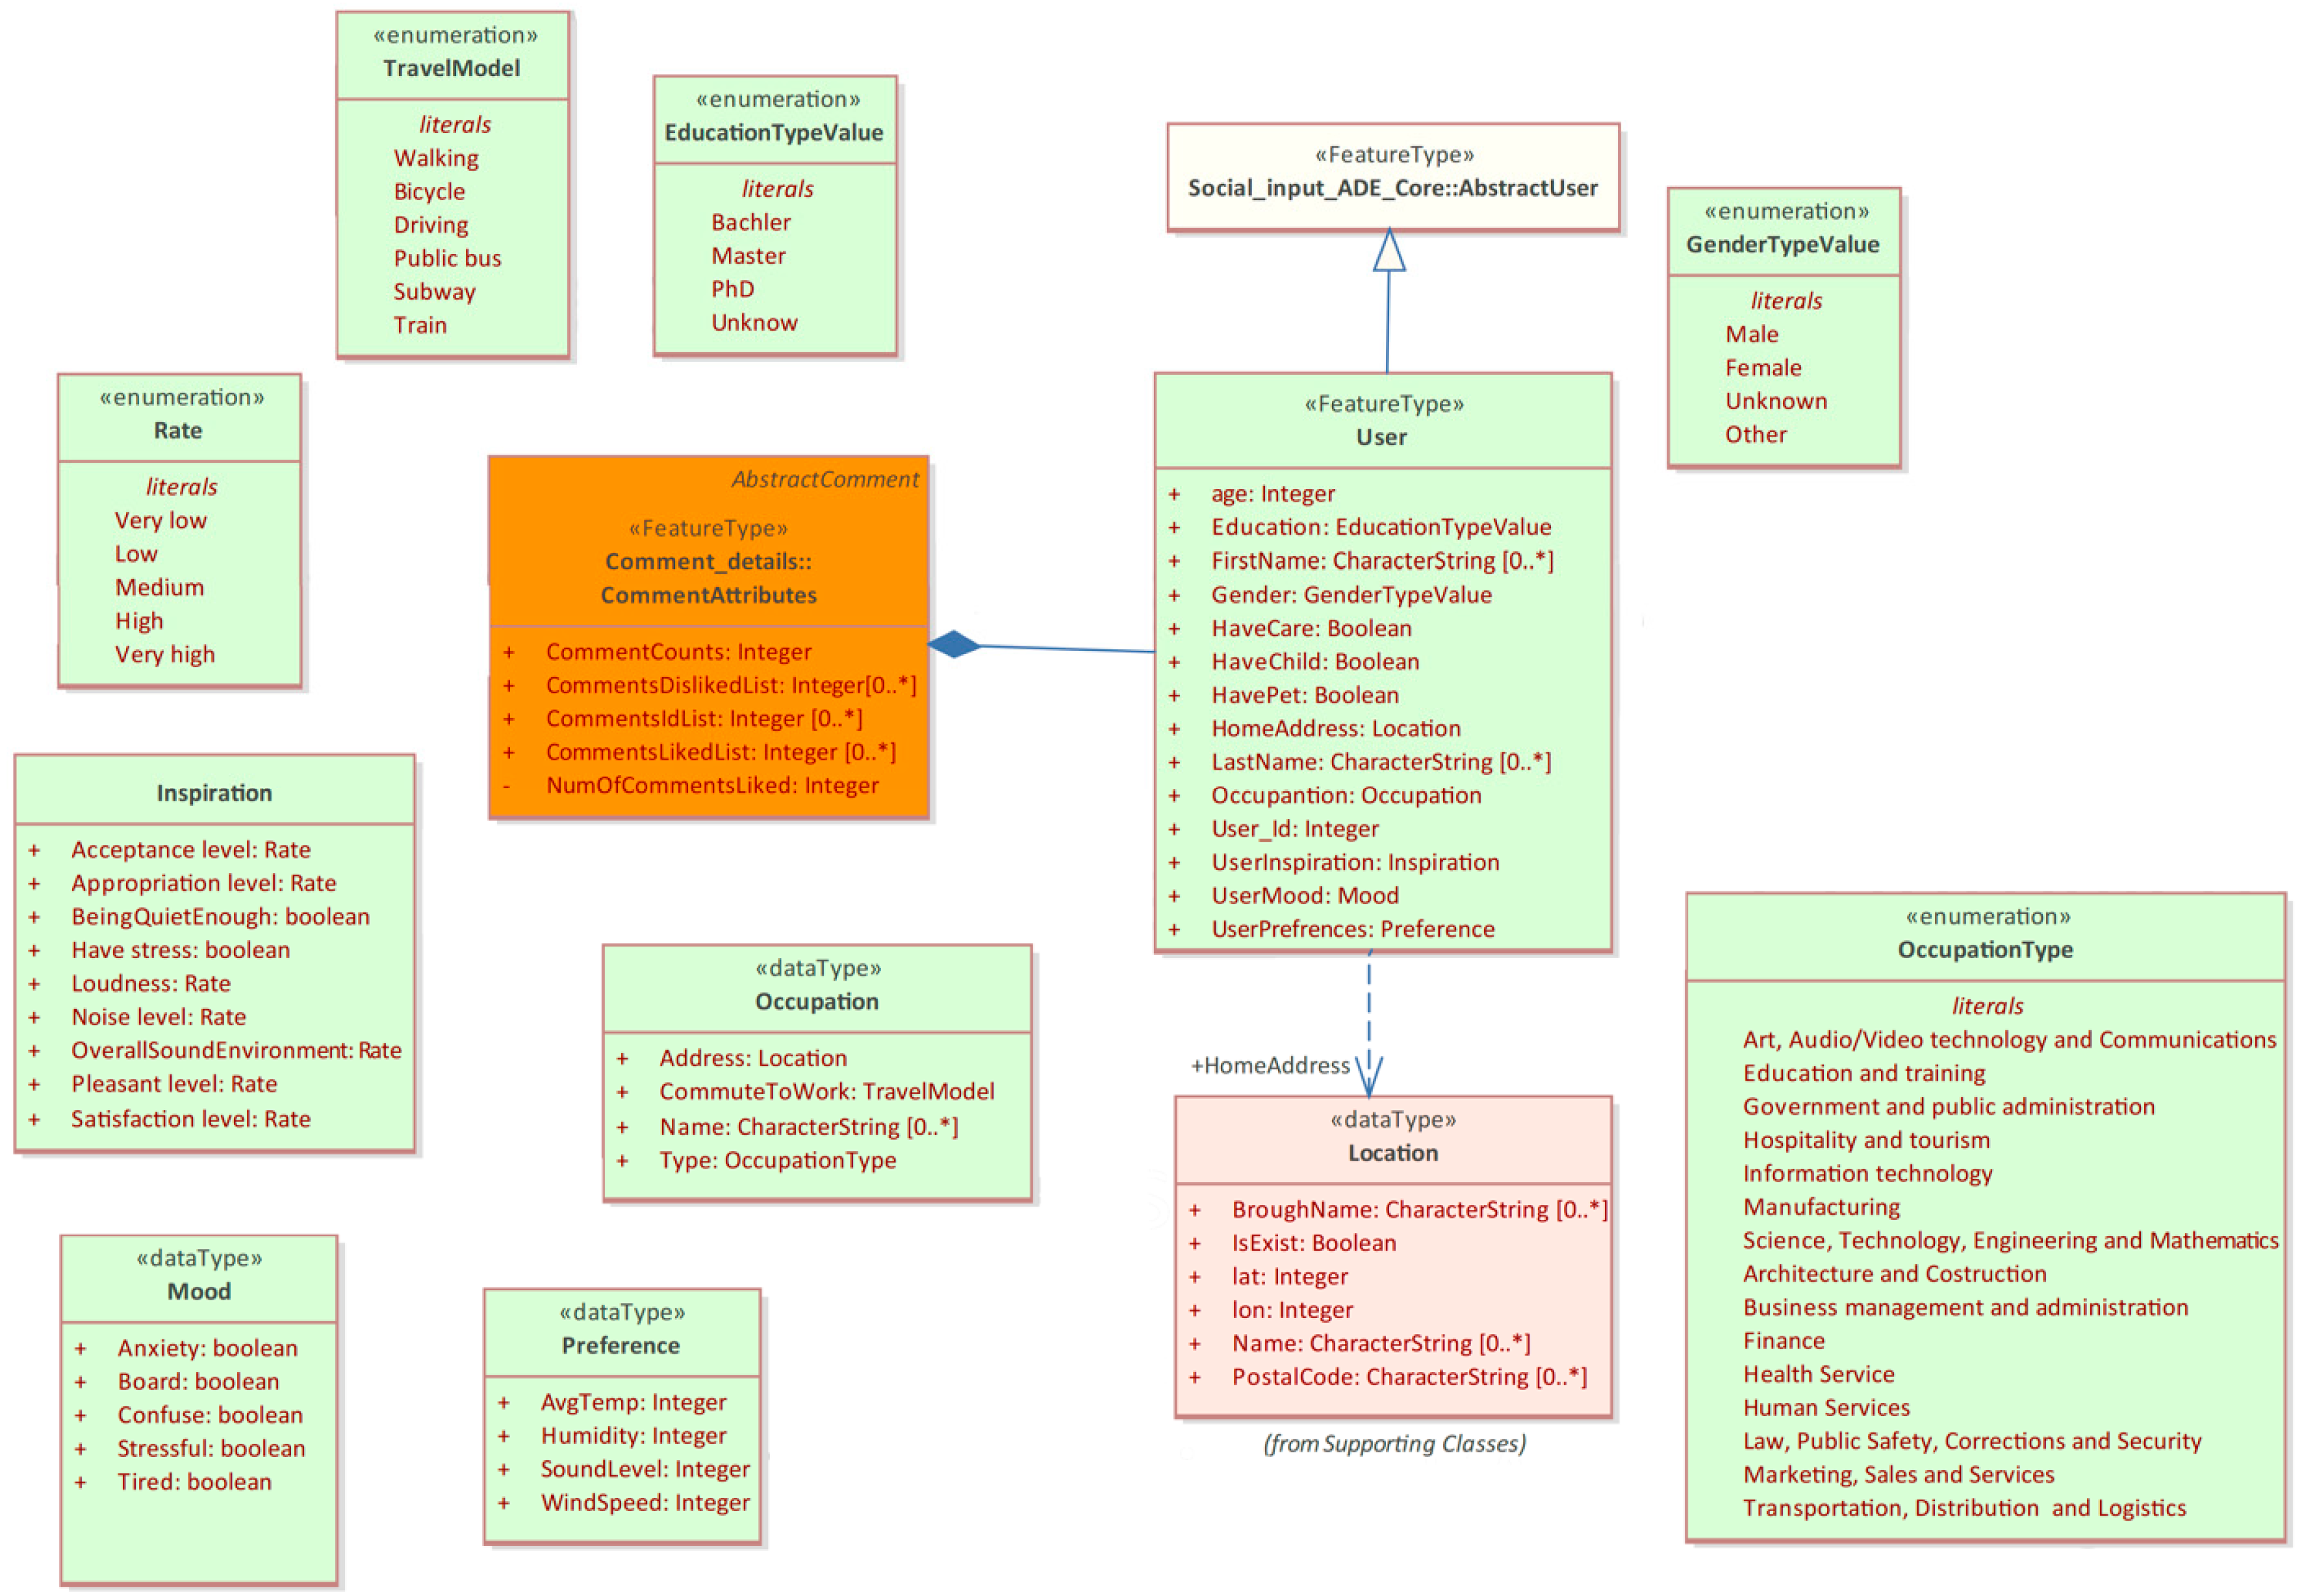
- Integrated model for acoustic comfort: A CityGML-based data model was developed, combining physical, physiological, and psychological parameters relevant to acoustic comfort. This facilitated the systematic storage, retrieval, and spatial–temporal analysis of acoustic comfort data, filling a gap in prior research.
- Identification of social and psychological influences: This study demonstrated that acoustic comfort is influenced by not only physical and environmental factors, such as traffic, but also social and psychological factors, including age, gender, and stressors. This highlights the importance of these parameters in managing urban comfort.
- Predictive modeling for acoustic comfort: Predictive models—KNN, SVR, and XGBoost—were developed to forecast acoustic comfort levels by using integrated data. These interpretable models provided insights into the relative influence of each factor, making them valuable for urban planning applications.
- Case study at urban bus stops: A case study at selected bus stops in Montréal demonstrated the application of the proposed model. This highlighted how the approach could assess acoustic comfort in real-world settings and inform actionable infrastructure improvements.
Supplementary Materials
Author Contributions
Funding
Institutional Review Board Statement
Data Availability Statement
Conflicts of Interest
References
- Yao, J.; Yang, F.; Zhuang, Z.; Shao, Y.; Yuan, P.F. The effect of personal and microclimatic variables on outdoor thermal comfort: A field study in a cold season in Lujiazui CBD, Shanghai. Sustain. Cities Soc. 2018, 39, 181–188. [Google Scholar] [CrossRef]
- Chen, X.; Xue, P.; Liu, L.; Gao, L.; Liu, J. Outdoor thermal comfort and adaptation in severe cold area: A longitudinal survey in Harbin, China. Build. Environ. 2018, 143, 548–560. [Google Scholar] [CrossRef]
- Lian, Y.Q.; Ou, D.Y.; Pan, S.S.; Ren, L.Y. An evaluation study on soundscape of different landscape space types. Build. Sci. 2020, 36, 57–63. [Google Scholar]
- Mazzeo, D.; Kontoleon, K.J. The role of inclination and orientation of different building roof typologies on indoor and outdoor environment thermal comfort in Italy and Greece. Sustain. Cities Soc. 2020, 60, 102111. [Google Scholar]
- Chang, S.; He, W.; Yan, H.; Yang, L.; Song, C. Influences of vernacular building spaces on human thermal comfort in China’s arid climate areas. Energy Build. 2021, 244, 110978. [Google Scholar] [CrossRef]
- Nasrollahi, N.; Namazi, Y.; Taleghani, M. The effect of urban shading and canyon geometry on outdoor thermal comfort in hot climates: A case study of Ahvaz, Iran. Sustain. Cities Soc. 2021, 65, 102638. [Google Scholar] [CrossRef]
- Wang, Y.; Pan, C.; Huang, Z. Comparison of applicability of PET and UTCI in different seasons in Shanghai. Build. Sci. 2020, 36, 55–61. [Google Scholar]
- Davtalab, J.; Deyhimi, S.P.; Dessi, V.; Hafezi, M.R.; Adib, M. The impact of green space structure on physiological equivalent temperature index in open space. Urban Clim. 2020, 31, 100574. [Google Scholar] [CrossRef]
- Azar, E.; O’Brien, W.; Carlucci, S.; Hong, T.; Sonta, A.; Kim, J.; Andargie, M.S.; Abuimara, T.; El Asmar, M.; Jain, R.K.; et al. Simulation-aided occupant-centric building design: A critical review of tools, methods, and applications. Energy Build. 2020, 224, 110292. [Google Scholar] [CrossRef]
- Yin, Y.; Zhang, D.; Zhen, M.; Jing, W.; Luo, W.; Feng, W. Combined effects of the thermal-acoustic environment on subjective evaluations in outdoor public spaces. Sustain. Cities Soc. 2022, 77, 103522. [Google Scholar] [CrossRef]
- Yang, W.; Kang, J. Acoustic comfort evaluation in urban open public spaces. Appl. Acoust. 2005, 66, 211–229. [Google Scholar] [CrossRef]
- Herranz-Pascual, K.; Gutiérrez, L.; Acero, J.A.; García, I.; Santander, A.; Aspuru, I. Environmental Comfort as Criteria for Designing Urban Places. In Proceedings of the Architecture, Education and Society, Barcelona, Spain, 4–6 June 2014. [Google Scholar]
- Herranz-Pascual, K.; García, I.; Aspuru, I.; Díez, I.; Santander, A. Progress in the understanding of soundscape: Objective variables and objectifiable criteria that predict acoustic comfort in urban places. Noise Mapp. 2016, 3, 247–263. [Google Scholar] [CrossRef]
- Brown, A.L.; Gjestland, T.; Dubois, D. Acoustic environments and soundscapes. In Soundscape and the Built Environment; CRC Press: Boca Raton, FL, USA, 2016; pp. 1–16. [Google Scholar]
- National Institute for Occupational Safety and Health (NIOSH). NIOSH Sound Level Meter App. 2019. Available online: https://www.cdc.gov/niosh/noise/about/app.html (accessed on 1 December 2024).
- Filipponi, L.; Santini, S.; Vitaletti, A. Data collection in wireless sensor networks for noise pollution monitoring. In International Conference on Distributed Computing in Sensor Systems; Springer: Berlin/Heidelberg, Germany, 2008; pp. 492–497. [Google Scholar]
- Salomons, E.M.; Zhou, H.; Lohman, W.J. Fast traffic noise mapping of cities using the Graphics Processing Unit of a personal computer. In INTER-NOISE and NOISE-CON Congress and Conference Proceedings; Institute of Noise Control Engineering: Wakefield, MA, USA, 2014; Volume 249, pp. 420–429. [Google Scholar]
- Kang, J.; Schulte-Fortkamp, B. (Eds.) Soundscape and the Built Environment; CRC Press: Boca Raton, FL, USA, 2016; Volume 525. [Google Scholar]
- Baffoe, P.E.; Duker, A.A.; Senkyire-Kwarteng, E.V. Assessment of health impacts of noise pollution in the Tarkwa Mining Community of Ghana using noise mapping techniques. Glob. Health J. 2022, 6, 19–29. [Google Scholar] [CrossRef]
- CityGML. Available online: https://www.3dcitydb.org/3dcitydb/citygml/ (accessed on 1 December 2024).
- Zarei, F.; Nik-Bakht, M. Extending CityGML with public input–social ADE. Built Environ. Proj. Asset Manag. 2024, 14, 547–561. [Google Scholar] [CrossRef]
- Aspuru, I.; García, I.; Herranz, K.; Santander, A. CITI-SENSE: Methods and tools for empowering citizens to observe acoustic comfort in outdoor public spaces. Noise Mapp. 2016, 3, 37–48. [Google Scholar] [CrossRef]
- Decibel X:dB Sound Level Meter. Available online: https://apps.apple.com/us/app/decibel-x-db-sound-level-meter/id448155923 (accessed on 1 December 2024).
- SPLnFFT Noise Meter. Available online: https://apps.apple.com/us/app/splnfft-noise-meter/id355396114 (accessed on 1 December 2024).
- Decibel Meter Pro. Available online: https://apps.apple.com/app/apple-store/id1227650795 (accessed on 1 December 2024).
- IEC 61672-3:2013; Electroacoustics—Sound Level Meters—Part 3: Periodic Tests. IEC International Electrotechnical Commission: Geneva, Switzerland, 2013.
- DataKustik. Available online: https://www.datakustik.com/products/cadnaa/cadnaa (accessed on 1 December 2024).
- Sun, K.; Kardous, C.A.; Shaw, P.B.; Kim, B.; Mechling, J.; Azman, A.S. The potential use of a NIOSH sound level meter smart device application in mining operations. Noise Control Eng. J. 2019, 67, 23–30. [Google Scholar] [CrossRef]
- Lai, D.; Lian, Z.; Liu, W.; Guo, C.; Liu, W.; Liu, K.; Chen, Q. A comprehensive review of thermal comfort studies in urban open spaces. Sci. Total Environ. 2020, 742, 140092. [Google Scholar] [CrossRef]
- Weisser, A.; Buchholz, J.M. Conversational speech levels and signal-to-noise ratios in realistic acoustic conditions. J. Acoust. Soc. Am. 2019, 145, 349–360. [Google Scholar] [CrossRef]
- Bottalico, P.; Murgia, S.; Puglisi, G.E.; Astolfi, A.; Kirk, K.I. Effect of masks on speech intelligibility in auralized classrooms. J. Acoust. Soc. Am. 2020, 148, 2878–2884. [Google Scholar] [CrossRef]
- Liu, Y.; Oiamo, T.; Rainham, D.; Chen, H.; Hatzopoulou, M.; Brook, J.R.; Davies, H.; Goudreau, S.; Smargiassi, A. Integrating random forests and propagation models for high-resolution noise mapping. Environ. Res. 2021, 195, 110905. [Google Scholar] [CrossRef]
- Long, M. Architectural Acoustics; Elsevier: Amsterdam, The Netherlands, 2005. [Google Scholar]
- CityGML Urban Planning ADE for i-Urban Revitalization. Open Geospatial Consortium. 2020. Available online: http://www.opengeospatial.org (accessed on 1 December 2024).
- Kavisha, K.; Ledoux, H.; Commandeur, T.J.F.; Stoter, J.E. Modelling urban noise in CityGML ADE: Case of the Netherlands. In Proceedings of the 12th 3D Geoinfo Conference, Melbourne, Australia, 26–27 October 2017; pp. 73–81. [Google Scholar]
- Nettleton, D. Chapter 6—Selection of variables and factor derivation. In Commercial Data Mining: Processing, Analysis and Modeling for Predictive Analytics Projects; Elsevier: Amsterdam, The Netherlands, 2014. [Google Scholar]
- Kuhn, M.; Johnson, K. Applied Predictive Modeling; Springer: Berlin/Heidelberg, Germany, 2018; p. 490. [Google Scholar]
- Ragettli, M.S.; Goudreau, S.; Plante, C.; Fournier, M.; Hatzopoulou, M.; Perron, S.; Smargiassi, A. Statistical modeling of the spatial variability of environmental noise levels in Montreal, Canada, using noise measurements and land use characteristics. J. Expo. Sci. Environ. Epidemiol. 2016, 26, 597–605. [Google Scholar] [CrossRef]


| POIs | Bus Stops | Numbers of Measurements |
|---|---|---|
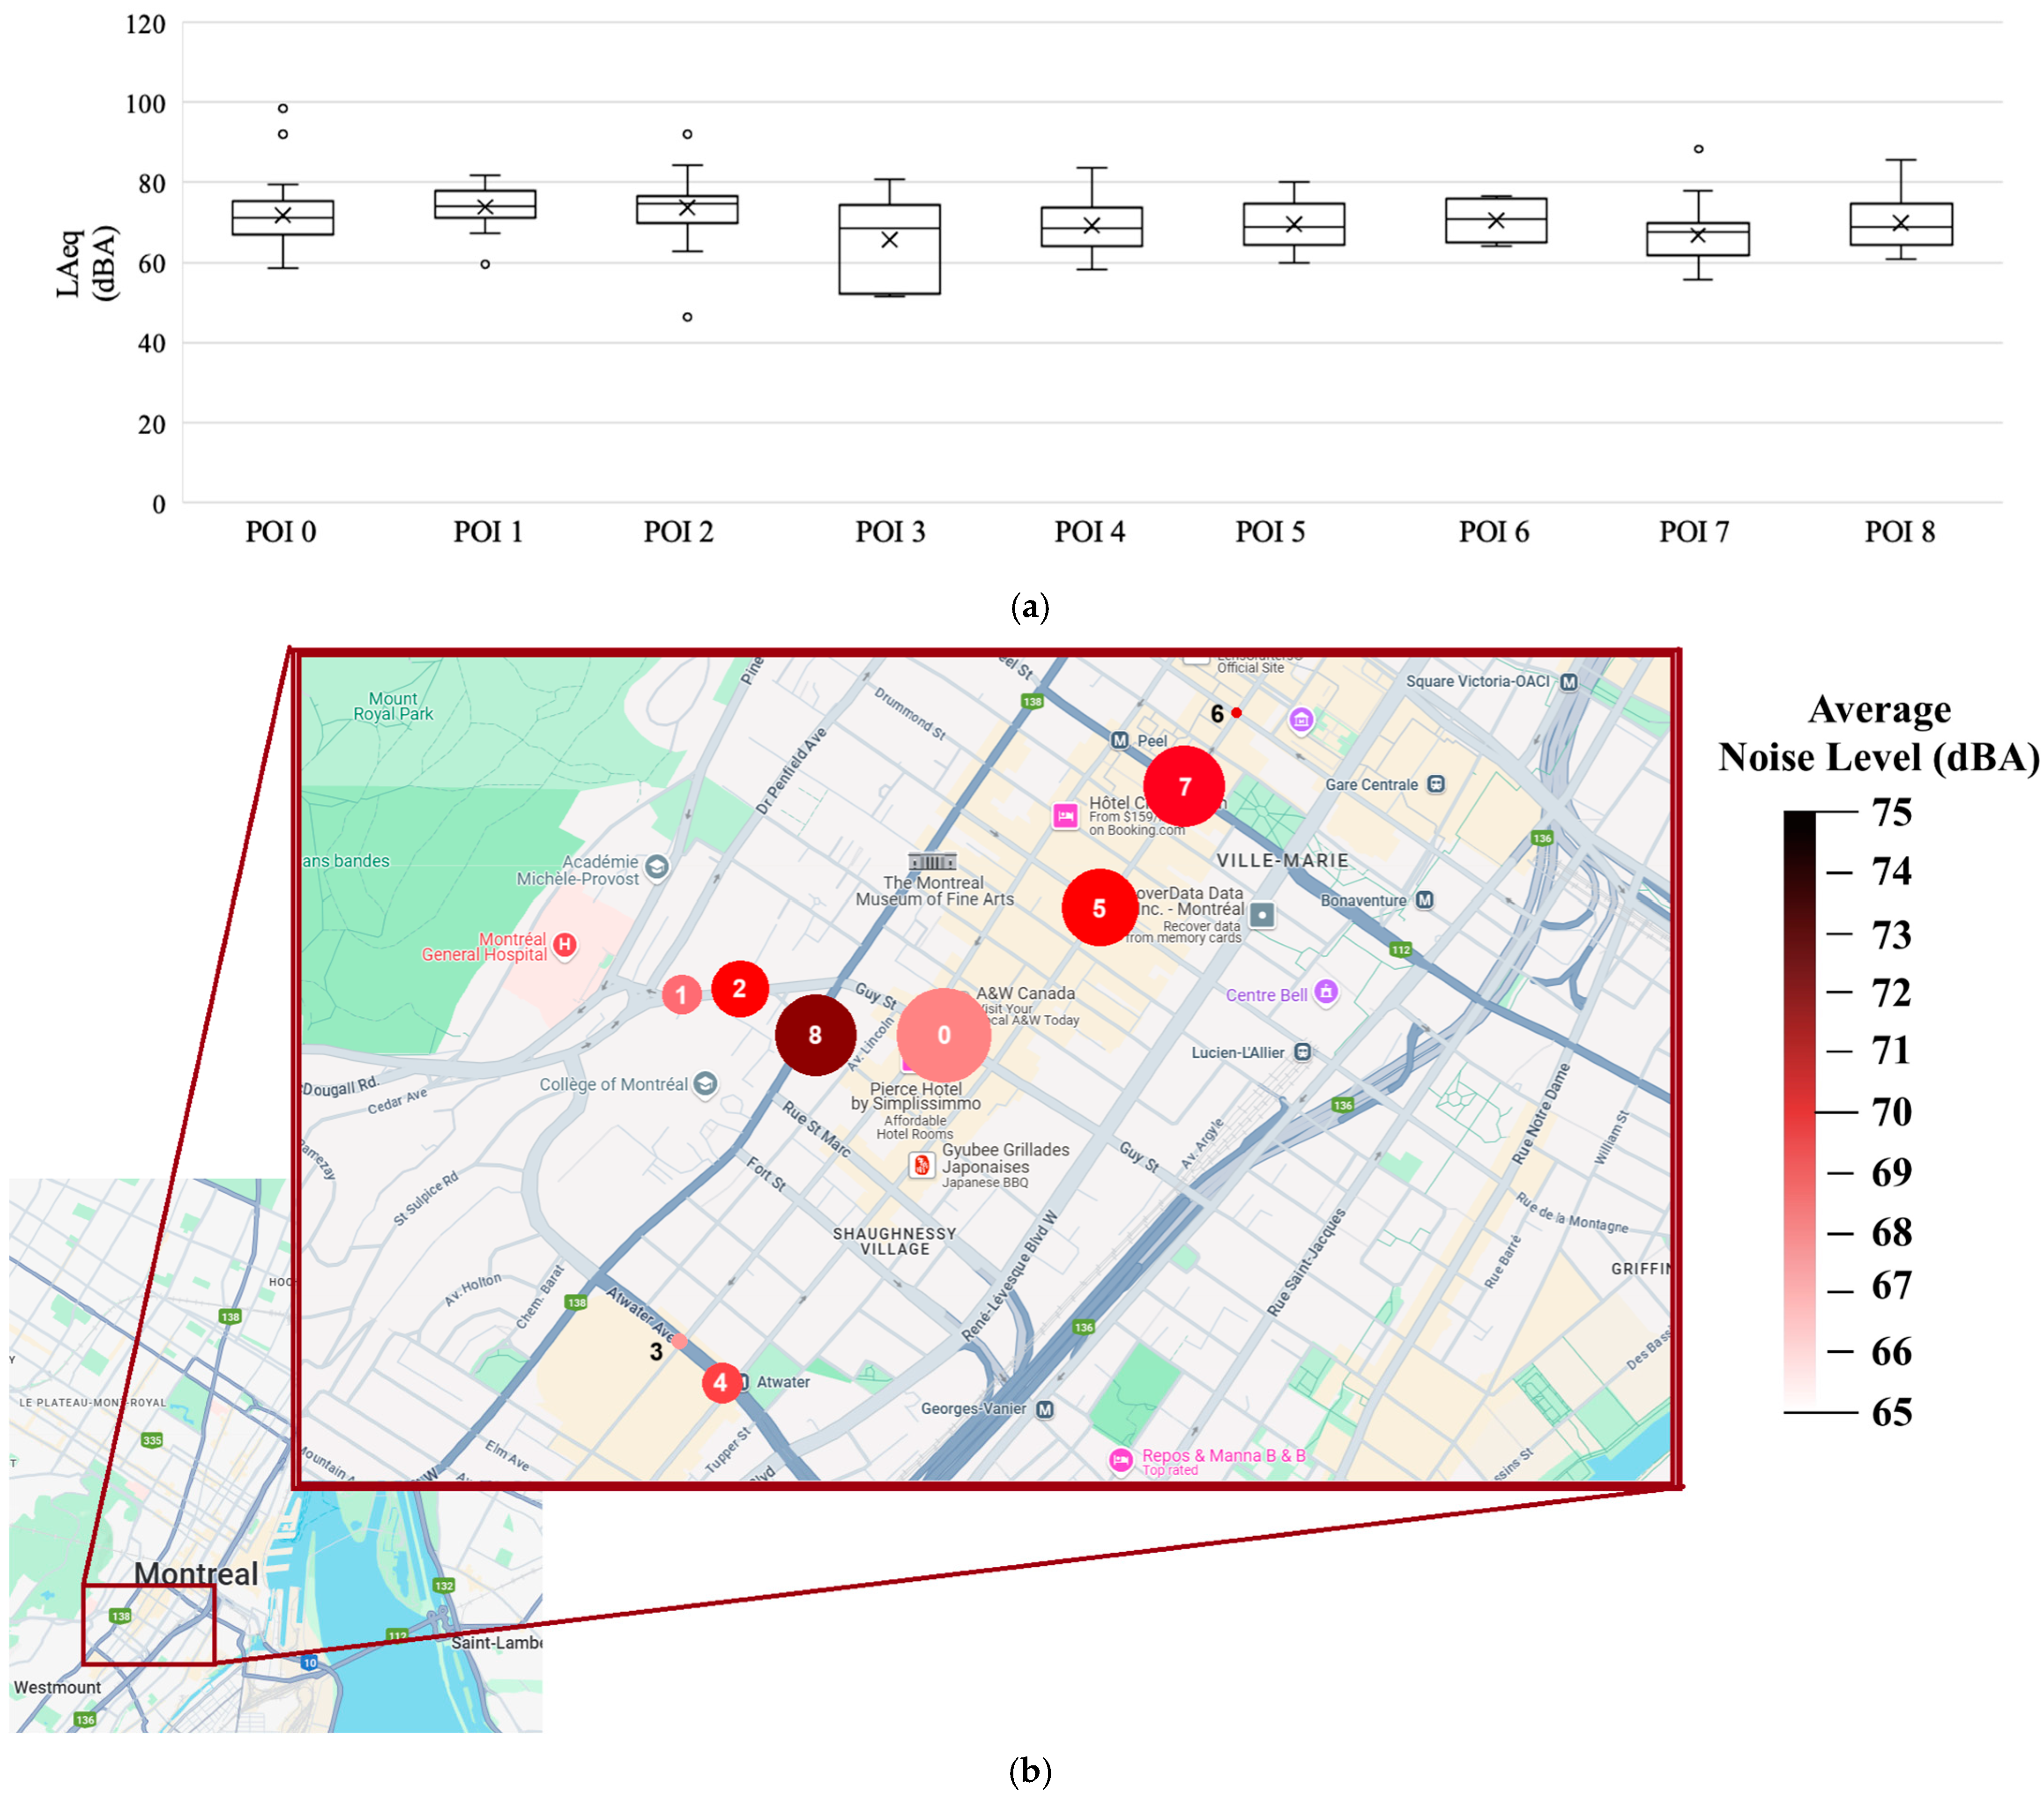
| POI 0 | Guy/Maisonneuve | 51 |
| POI 1 | Côte-des-Neiges/Docteur-Penfield (int. n-e) | 20 |
| POI 2 | Côte-des-Neiges/Summerhill | 32 |
| POI 3 | Atwater/Maisonneuve | 7 |
| POI 4 | Atwater/Sainte-Catherine | 20 |
| POI 5 | Montagne/Sainte-Catherine | 43 |
| POI 6 | Mansfield/Sainte-Catherine | 4 |
| POI 7 | Peel/Sainte-Catherine | 42 |
| POI 8 | Saint-Mathieu/Sherbrooke | 43 |
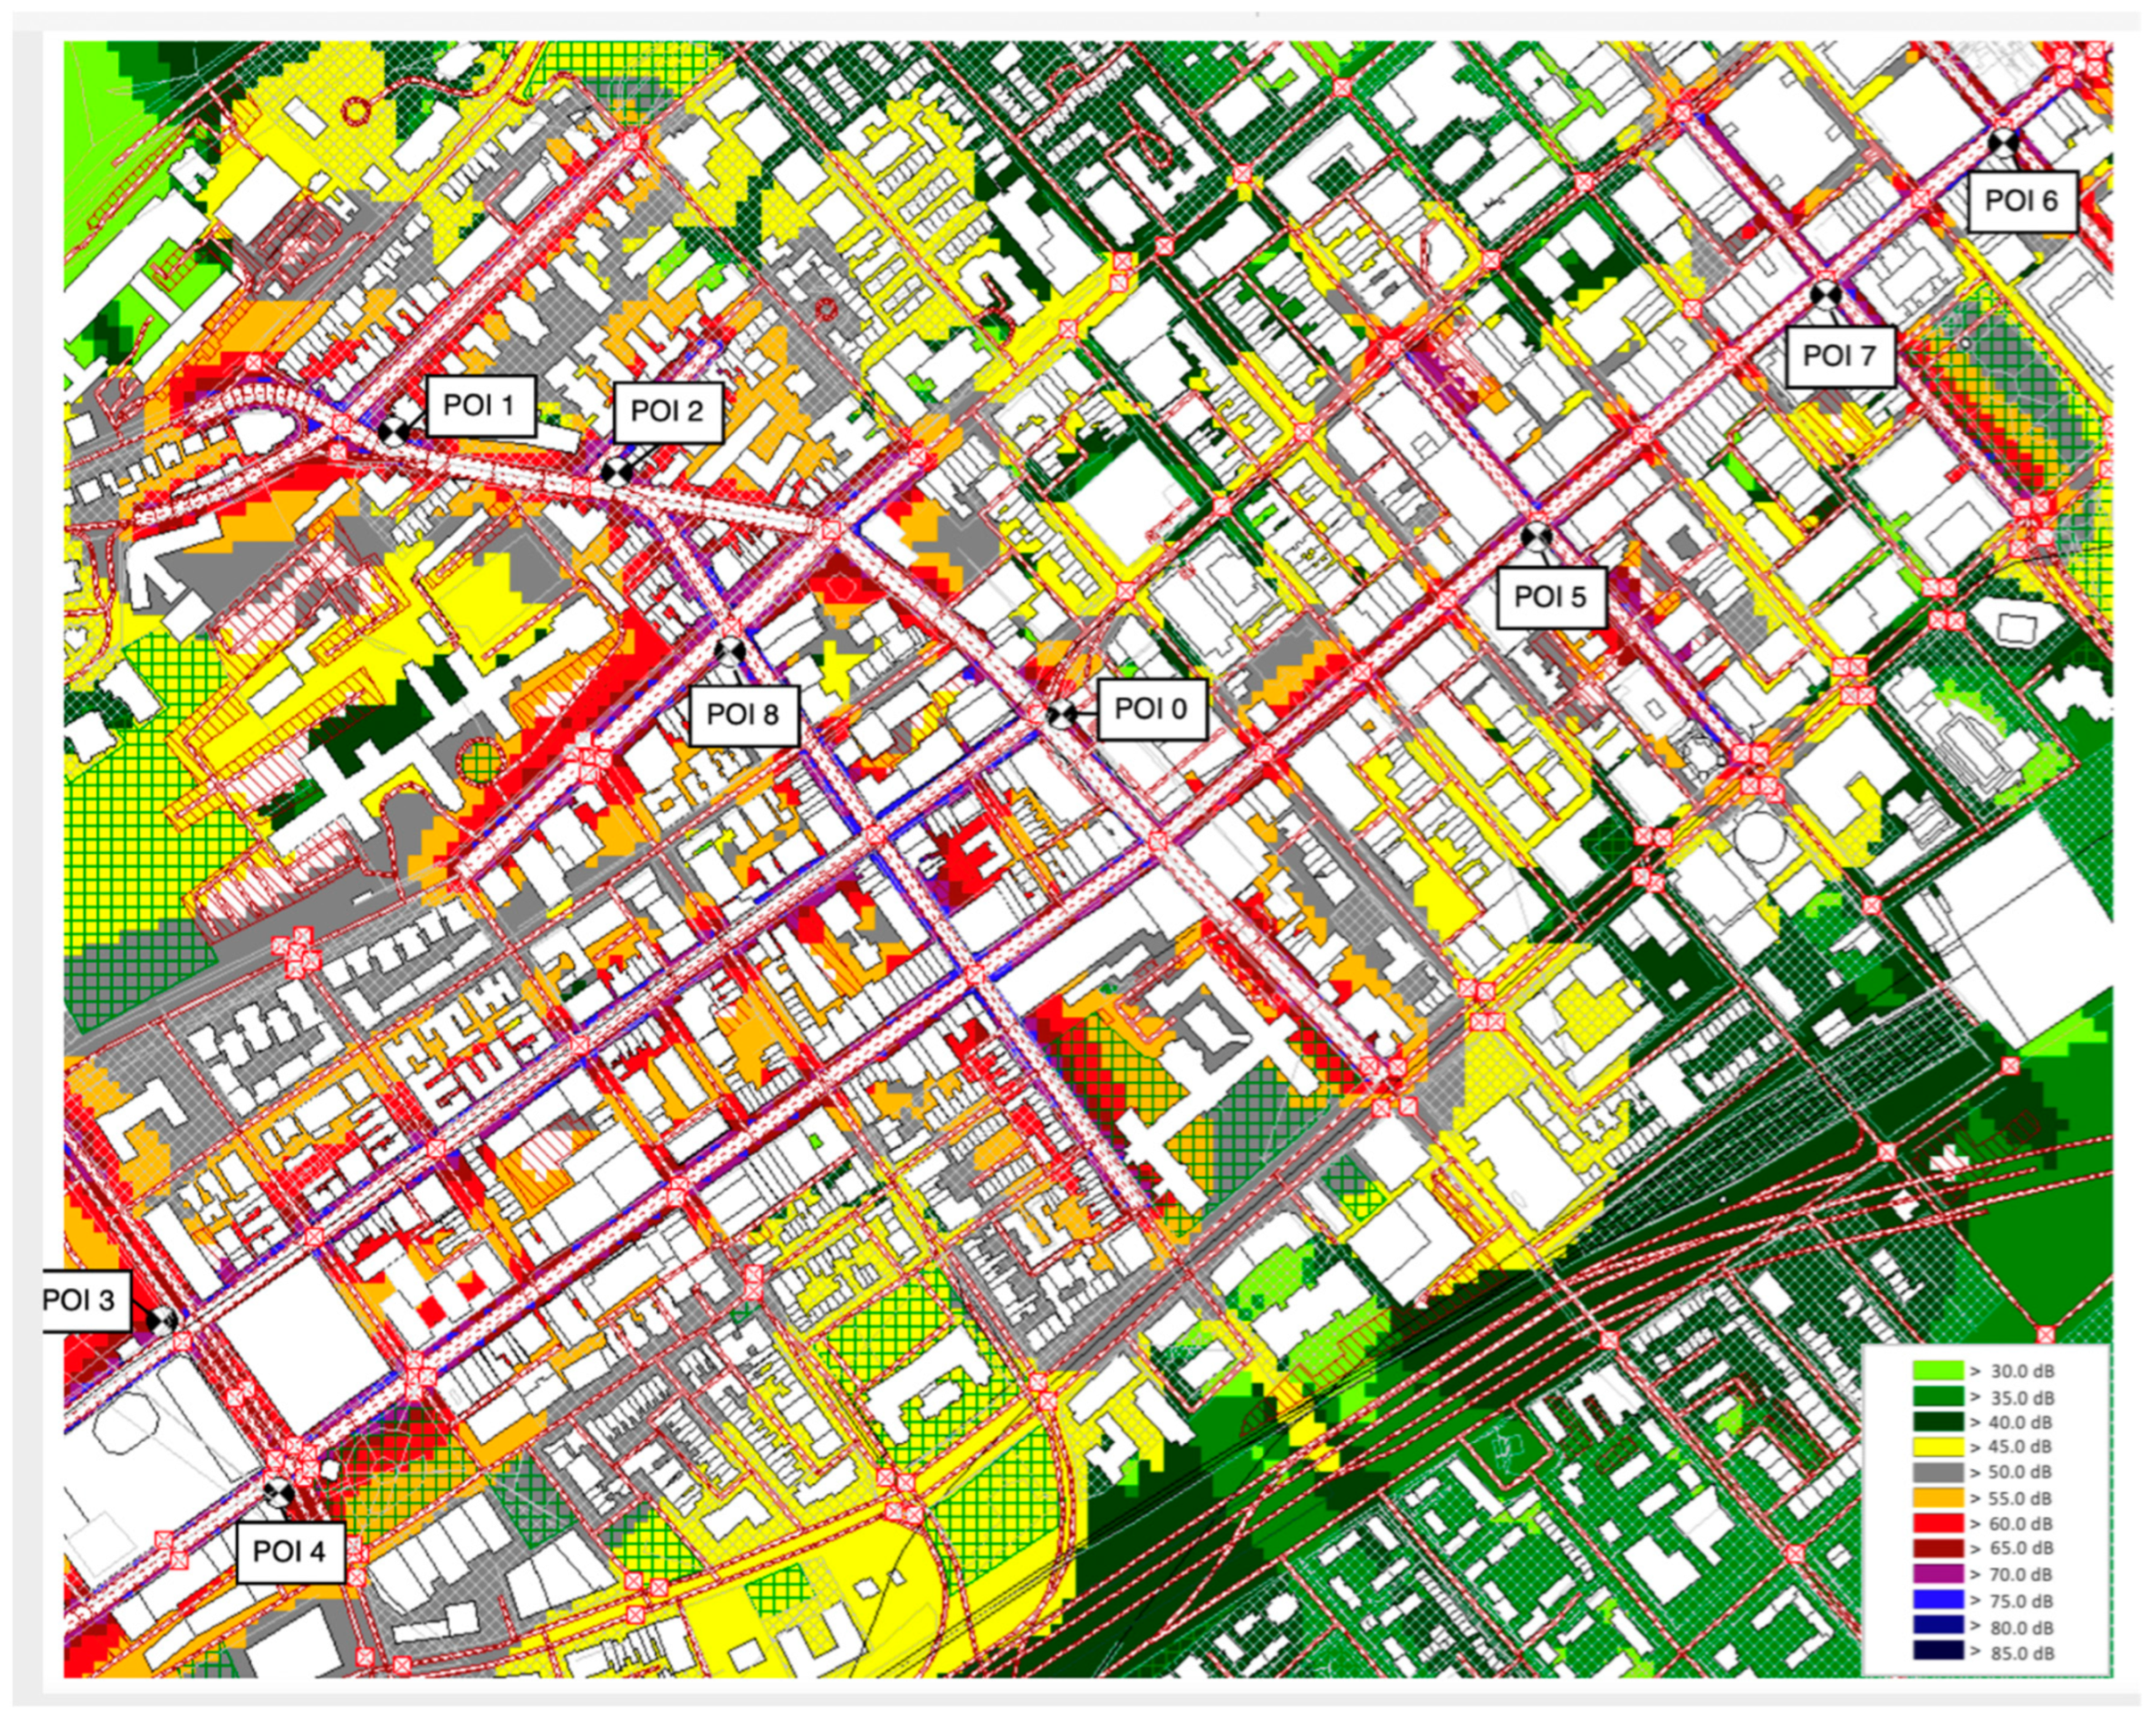
| POIs | Bus Stops | Simulated LAeq (dBA) | Measured LAeq (dBA) | Difference Between Simulated and Measured LAeq (dBA) |
|---|---|---|---|---|
| POI 0 | Guy/Maisonneuve | 69.5 | 67.3 | 3.26% |
| POI 1 | Côte-des-Neiges/Docteur-Penfield (int. n-e) | 71.3 | 67.7 | 5.31% |
| POI 2 | Côte-des-Neiges/Summerhill | 72.4 | 69.6 | 4.02% |
| POI 3 | Atwater/Maisonneuve | 70.8 | 67.1 | 5.15% |
| POI 4 | Atwater/Sainte-Catherine | 70.5 | 68.3 | 3.22% |
| POI 5 | Montagne/Sainte-Catherine | 71.7 | 70.3 | 1.99% |
| POI 6 | Mansfield/Sainte-Catherine | 71.6 | 70.9 | 0.98% |
| POI 7 | Peel/Sainte-Catherine | 72.7 | 69 | 5.36% |
| POI 8 | Saint-Mathieu/Sherbrooke | 74.7 | 72.8 | 2.6% |
| Variables | Questions in the Survey to Measure Categorical Variables (Possible Answered Values) |
|---|---|
| Convenience Level | If you were asked to stay at this location for one hour from now, would you find the acoustic environment too noisy or acceptable? |
| Expectation Level | Do you prefer/expect the environment to be quieter, or it is OK? (Quieter/It is OK) |
| Appropriateness | How appropriate is the sound to the surrounding? (Rank between 1 to 5) |
| Being Temporary/Permanent | Is the main source of the noise temporary or permanent? |
| Being Pleasant | From the aspect of noise, on a scale of 1 to 5, how pleasant is it here? |
| Income Group | Which of the following income groups do you belong to? |
| Loudness | How loud is it here? (Rank between 1 to 5) |
| Noise sources | What is the main source of the noise? |
| Being Tired | Which of the following best explains your emotion when you were waiting at this location? |
| Being Confused | Which of the following best explains your emotion when you were waiting at this location? |
| Having Deadline | Have you had a deadline or exam recently, or will you have one in the near future? (Yes/No) |
| Age group | Which of the following age groups do you belong to? |
| Being Bored | Which of the following best explains your emotion when you were waiting at this location? |
| Education Category | Which of the following categories best describes you: (Undergraduate student/Graduate student) |
| Being Happy | Which of the following best explains your emotion when you were waiting at this location? |
| Variables | Coef. | Std. Err. | z | p > |z| |
|---|---|---|---|---|
| Gender | −16.756 | 95138839.2 | 0 | 1 |
| Age group | −3.100 | 38296914.932 | 0 | 1 |
| Income Group | 527.491 | 16869572.260 | 0 | 1 |
| Convenience Level | −0.205 | 0.085 | −2.421 | 0.015 |
| Expectation Level | 0.045 | 0.134 | 0.336 | 0.737 |
| Being Temporary/Permanent | 0.297 | 0.149 | 1.997 | 0.016 |
| Noise sources | 0.127 | 0.154 | 0.823 | 0.41 |
| Being Tired | −0.056 | 0.59 | −0.095 | 0.925 |
| Being Confused | −0.072 | 0.622 | −0.116 | 0.908 |
| Having Deadline | 0.071 | 0.206 | 0.342 | 0.732 |
| Being Bored | 0.084 | 0.589 | 0.142 | 0.887 |
| Education Category | 0.259 | 0.622 | 0.416 | 0.677 |
| Being Happy | 0.008 | 0.6 | 0.013 | 0.99 |
| Appropriateness | 0.252 | 0.062 | 4.096 | 0 |
| Being Pleasant | 0.197 | 0.082 | 2.417 | 0.016 |
| Loudness | −0.205 | 0.085 | −2.421 | 0.015 |
| Using LAeq | Using Simulation LAeq | Using Physical Attributes | ||
|---|---|---|---|---|
| Machine Learning Model | Normalized Error | Selected Features, LAeq | Selected Features, LAeq | Selected Features, Car, Bus, Camions, and Medium Bus |
| KNN | NMSE | 0.0181 | 0.0277 | 0.0307 |
| MAE | 0.0890 | 0.1178 | 0.1198 | |
| RMSE | 0.1349 | 0.1666 | 0.1752 | |
| Max error | 0.4166 | 0.5000 | 0.6666 | |
| SVR | MSE | 0.0146 | 0.0268 | 0.0358 |
| MAE | 0.0979 | 0.1210 | 0.1300 | |
| RMSE | 0.1211 | 0.1639 | 0.1894 | |
| Max error | 0.3746 | 0.5640 | 0.9001 | |
| XGBoost | MSE | 0.0205 | 0.0250 | 0.0396 |
| MAE | 0.1030 | 0.1141 | 0.1098 | |
| RMSE | 0.1434 | 0.1583 | 0.1990 | |
| Max Error | 0.3923 | 0.4787 | 0.9999 |
Disclaimer/Publisher’s Note: The statements, opinions and data contained in all publications are solely those of the individual author(s) and contributor(s) and not of MDPI and/or the editor(s). MDPI and/or the editor(s) disclaim responsibility for any injury to people or property resulting from any ideas, methods, instructions or products referred to in the content. |
© 2024 by the authors. Licensee MDPI, Basel, Switzerland. This article is an open access article distributed under the terms and conditions of the Creative Commons Attribution (CC BY) license (https://creativecommons.org/licenses/by/4.0/).
Share and Cite
Zarei, F.; Nik-Bakht, M.; Lee, J.; Zarei, F. Urban-Scale Acoustic Comfort Map: Fusion of Social Inputs, Noise Levels, and Citizen Comfort in Open GIS. Processes 2024, 12, 2864. https://doi.org/10.3390/pr12122864
Zarei F, Nik-Bakht M, Lee J, Zarei F. Urban-Scale Acoustic Comfort Map: Fusion of Social Inputs, Noise Levels, and Citizen Comfort in Open GIS. Processes. 2024; 12(12):2864. https://doi.org/10.3390/pr12122864
Chicago/Turabian StyleZarei, Farzaneh, Mazdak Nik-Bakht, Joonhee Lee, and Farideh Zarei. 2024. "Urban-Scale Acoustic Comfort Map: Fusion of Social Inputs, Noise Levels, and Citizen Comfort in Open GIS" Processes 12, no. 12: 2864. https://doi.org/10.3390/pr12122864
APA StyleZarei, F., Nik-Bakht, M., Lee, J., & Zarei, F. (2024). Urban-Scale Acoustic Comfort Map: Fusion of Social Inputs, Noise Levels, and Citizen Comfort in Open GIS. Processes, 12(12), 2864. https://doi.org/10.3390/pr12122864