Article

Methanol Production via Power-to-Liquids: A Comparative Simulation of Two Pathways Using Green Hydrogen and Captured CO2

Faculty of Chemistry and Chemical Engineering, University of Maribor, 2000 Maribor, Slovenia
*
Author to whom correspondence should be addressed.
Processes 2024, 12(12), 2843; https://doi.org/10.3390/pr12122843
Submission received: 6 November 2024 / Revised: 6 December 2024 / Accepted: 9 December 2024 / Published: 11 December 2024
(This article belongs to the Section Chemical Processes and Systems)

Abstract

:
Methanol is a versatile substance that can be used in combustion engines and fuel cells and as a feedstock for the production of various chemicals. However, the majority of methanol is currently produced from fossil fuels, which is not sustainable. The aim of this study was to analyze and evaluate the feasibility of methanol production from renewable sources as a bridge to a low-carbon economy and its potential as an alternative to fossil-derived chemicals. For this purpose, the process of methanol production from captured CO2 and water as an H2 source was simulated in Aspen Plus. For CO2 capture, the monoethanolamine (MEA) absorption process was assumed. The H2 required for methanol synthesis was obtained by alkaline water electrolysis using electricity from renewable sources. The captured CO2 and the produced H2 were then converted into methanol through the process of CO2 hydrogenation in two ways, direct and two-step synthesis. In the direct conversion, the hydrogenation of CO2 to methanol was carried out in a single step. In the two-step conversion, the CO2 was first partly converted to CO by the reverse water-gas shift (RWGS) reaction, and then the mixture of CO and CO2 was hydrogenated to methanol. The results show that direct synthesis has a higher methanol yield (0.331 kmol of methanol/kmol of H2) compared to two-step synthesis (0.326 kmol of methanol/kmol of H2). The direct synthesis produces 13.4 kmol of methanol/MW, while the two-step synthesis produces 11.2 kmol of methanol/MW. This difference amounts to 2.2 kmol of methanol/MW, which corresponds to a saving of 0.127 $/kmol of methanol. Besides the lesser energy requirements, the direct synthesis process also produces lower carbon emissions (22,728 kg/h) as compared to the two-step synthesis process (33,367 kg/h).

1. Introduction

1.1. CO2 Capture

At present, environmental issues are receiving growing global attention, particularly the problem of greenhouse gas emissions resulting from the burning of fossil fuels [1]. CO2 emissions and their concentration in the atmosphere have been rapidly increasing through the last century, resulting in an increase in global temperature. Reducing CO2 emissions is a key research topic in many countries and has received significant attention [2]. The fundamental issue that is often overlooked when considering technologies to convert CO2 emissions into higher value-added products is that this requires a relatively large number of process technologies to be coupled, which are often energy intensive. Frequently, only one stage in the conversion chain is assessed from an efficiency standpoint, which gives overly optimistic results and thus prevents the much-needed realistic evaluation of the efficiency of the given technology.
CO2 capture technologies can be classified into the following three main approaches:
  • Pre-combustion capture
  • Post-combustion capture
  • Oxyfuel combustion (combustion with pure oxygen)
The choice of an appropriate CO2 capture method depends on the type of CO2-producing facility and the fuel used [3].
In pre-combustion capture, the fuel (usually coal or natural gas) is treated before combustion. In the case of coal, this involves gasification in a low-oxygen environment, producing syngas made of CO and H2 [4]. The syngas reacts with steam in the water-gas shift (WGS) reaction, converting CO into CO2 and producing more H2 [5]. Steam is added, and the syngas passes through a catalyst bed to complete the reaction. CO2 is then separated, and the H2 is used to generate electricity or for applications such as fuel cells and transportation. This method is more cost-effective than post-combustion capture due to the higher concentration of CO2 in the syngas [6].
In the post-combustion capture process, the CO2 is removed from the flue gases after combustion, making it suitable for retrofitting existing power plants [4]. Flue gases typically contain less than 15% CO2 [7], and chemical absorption is commonly used for capture [8]. However, capturing CO2 from these gases is technically challenging, as high temperatures and strong solvents are required, which leads to high energy consumption during regeneration [7].
Oxyfuel combustion is a promising method in which the fuel is burned in pure oxygen mixed with recycled flue gases, producing a CO2-rich flue gas stream. The remaining gases consist mainly of CO2 and water vapor, which can be easily separated by condensation. The CO2 concentration in the dry flue gases ranges from 70% to 95%, depending on factors like fuel type and O2 purity [5]. This process reduces the cost of capture, but the need for large amounts of oxygen and recirculating flue gases increases operating costs [9].
Several well-developed technologies are available for CO2 capture, including absorption, adsorption, cryogenic processes, and membrane technologies [4], as follows:
  • Absorption processes use chemical or physical solvents and are commonly used in fossil-fueled power plants [8]. In continuous operation, CO2-rich flue gas enters the absorber, where the solvent absorbs the CO2. The CO2-rich stream is sent to a regenerator for desorption, and the solvent is recycled [10]. Common absorbents include monoethanolamine (MEA), diethanolamine (DEA), N-methyldiethanolamine (MDEA), and di-2-propanolamine (DIPA) [11]. Studies show that MEA is the most efficient, with a CO2 capture rate of over 90% [12].
  • In adsorption, solid sorbents are used to capture CO2 on their surface. Key criteria for selecting a sorbent include high specific surface area, high selectivity, and strong regeneration capability. Typical sorbents are molecular sieves, activated carbon, zeolites, calcium oxides, hydrotalcites, and lithium zirconate [4].
  • Cryogenic processes separate CO2 by cooling the flue gas to very low temperatures, eliminating the need for chemical solvents, but they face challenges such as pressure drops and ice formation [13].
  • Membrane technologies use selective barriers to filter CO2 from flue gases, but their effectiveness is limited to low CO2 concentrations and pressure [14].

1.2. Power-to-X

Power-to-X (P-t-X) is an umbrella term that refers to various processes for converting renewable electricity into different energy carriers such as heat, H2, methane, liquid fuels, and others [15]. In a typical P-t-X system, H2 produced from renewable energy sources and CO2, captured or separated from air, biogas, or flue gas, are combined to produce a renewable hydrocarbon-based fuel [16].
Hydrogen (H2) is the simplest energy carrier that utilizes (renewable) electricity within the P-t-X framework. The primary technology used for this conversion from renewable sources (water and electricity from renewable sources) is water electrolysis. It is a process in which water is split into H2 and oxygen. Although oxygen is often treated as a byproduct and released into the atmosphere, it is a valuable resource that can be utilized in various applications (steel manufacturing, pharmaceuticals, and as an oxidant in combustion processes) [17]. The main product of electrolysis is H2, which serves as the first potential output of the P-t-X process. This particular conversion is known as Power-to-Hydrogen (P-t-H), representing one segment of the broader P-t-X concept [18].
To further expand on the P-t-X concept, the H2 produced can react with pure CO2, which could ideally be captured from exhaust gases of industrial processes and power plants. The resulting mixture of H2 and CO2 can then be fed to a methanation reactor to generate methane, a process known as Power-to-Gas (P-t-G). Additionally, other products can be obtained by combining H2 and CO2, including liquid fuels (such as alcohols and dimethyl ether) and green chemicals. Alternative P-t-X schemes can incorporate not only CO2 but also other chemical compounds such as nitrogen (N2) in the Power-to-Ammonia concept. Broader categories such as Power-to-Liquids (P-t-L) and Power-to-Chemicals (P-t-C) can be introduced to expand the scope of these technologies, including valuable production streams for storing renewable electricity [18]. In summary, the Power-to-X concept includes the following pathways:
  • Power-to-Hydrogen (P-t-H),
  • Power-to-Gas (P-t-G),
  • Power-to-Liquids (P-t-L),
  • Power-to-Chemicals (P-t-C), and
  • Power-to-Power (P-t-P).

1.3. H2 Production via Water Electrolysis

H2 is produced using four main technologies: natural gas reforming [19], coal gasification [20], methane pyrolysis [21], and water electrolysis [22].
Water electrolysis is a well-known method for producing oxygen and H2 [22]. The core of the electrolysis unit is an electrochemical cell filled with an electrolyte (e.g., an aqueous KOH solution) and two electrodes connected to an external power supply [23].
The reactions occurring at the anode and cathode depend on the conditions under which electrolysis takes place [24]. Table 1 shows the reactions at the anode and cathode under acidic and alkaline conditions.
Despite the different reactions at the anode and cathode depending on the conditions, the overall reaction during the water electrolysis process is always the same (Equation (1)) [22,23,24,25]:
2 H 2 O 2 H 2 + O 2
Water electrolysis can be categorized into four types based on the electrolyte, operating conditions, and the ionic substances (OH, H+, O2−) migrating from one electrode to the other. The four types of electrolysis are alkaline water electrolysis (AWE), proton exchange membrane (PEM) water electrolysis, anion exchange membrane (AEM) water electrolysis, and solid oxide electrolysis (SOE) [24,25].
  • Alkaline Water Electrolysis (AWE) is an established process that was introduced by Troostwijk and Diemann in 1789 [24] and in which H2 is produced by reducing an alkaline solution at the cathode to form hydroxyl ions (OH). At the anode, the OH ions form oxygen and water [25].
  • Proton Exchange Membrane (PEM) electrolysis was developed in 1966. PEM electrolysis uses a sulfonated polymer membrane that allows the diffusion of H+ [24]. Water is split into H2 and oxygen, with protons migrating through the membrane to the cathode and forming H2 gas [25].
  • Anion Exchange Membrane (AEM) electrolysis is an emerging technology for H2 production [25]. In AEM electrolysis, conventional membranes are replaced by anion exchange membranes that allow the migration of OH [26]. Water is reduced at the cathode, producing H2 and hydroxyl ions, which recombine at the anode to form oxygen [24].
  • Solid Oxide Electrolysis (SOE) was first presented in the 1980s [25]. SOE operates at high temperatures and pressures using water vapor [27]. Water is reduced at the cathode to produce H2 and oxide ions (O2−), which are transported to the anode to produce oxygen and electrons [24].

1.4. Methanol Synthesis

In the P-t-L process, green H2 and CO2 captured from the air are used as feedstocks to produce target hydrocarbon products [17,28]. These hydrocarbon products can also be referred to as e-fuels, which are carbon-neutral synthetic fuels. E-fuels hold the position as a potential solution to reduce the carbon footprint associated with traditional fossil fuels [29]. Among the various potential fuels, methanol is particularly interesting as it is an energy carrier that can be used as fuel or as an additive to fuels for internal combustion engines [30], as well as in methanol fuel cells [31]. Moreover, it is also a chemical feedstock for the production of many valuable chemicals, such as formaldehyde [32], acetic acid [33], methyl methacrylate [34], dimethyl terephthalate [35], methylamines [36], chloromethanes [37], dimethyl carbonate [38], methyl tert-butyl ether [39], etc.
Methanol can be produced from a wide range of carbon and H2 sources. Currently, most methanol production is done by the conversion of synthesis gas, which is a mixture of CO, CO2, and H2 [40]. For efficiency reasons, a lower proportion of CO2 is typically used compared to CO [41]. Syngas is usually produced from natural gas and coal [42], which is neither sustainable nor environmentally friendly. There are other sources for the production of syngas, such as biomass [41], waste [43], and other sources that are slightly more beneficial from an environmental point of view [44]. An even more promising solution is methanol production by combining captured CO2 with H2 produced by water electrolysis using electricity from renewable sources [42].
Methanol can be produced by CO2 hydrogenation involving the following reactions: the reverse water-gas shift (RWGS) reaction (Equation (2)), methanol synthesis from CO (Equation (3)), and methanol synthesis from CO2 (Equation (4)) [45]:
C O 2 + H 2 C O + H 2 O
C O + 2 H 2 C H 3 O H
C O 2 + 3 H 2 C H 3 O H + H 2 O
The conversion of CO2 to CO (Equation (2)) is endothermic, meaning higher temperatures are favorable for equilibrium. However, the conversions of CO and CO2 to methanol (Equations (3) and (4)) are exothermic, making it so that higher temperatures have a negative effect on the equilibrium. Therefore, higher methanol yields are achieved at lower temperatures and higher pressures [46].
Methanol can be obtained by CO2 hydrogenation in a single-step or a two-step process. In the single-step conversion, CO2 is hydrogenated directly to methanol, with the above reactions occurring simultaneously. In the two-step process, the CO2 is first converted into CO via the RWGS reaction (Equation (2)) and then hydrogenated to methanol [2]. This process is also known as the CAMERE process (CO2 hydrogenation to methanol via reverse water-gas shift). The reason why the two-step conversion is more favorable is the very low CO2 conversion during direct synthesis [47].
The key bottlenecks highlighted in most studies are associated with high energy requirements and low equilibrium conversions [17,48]. The high energy demand can be attributed to the processes of water electrolysis, gas compression, and the capture and purification of CO2 [48]. Furthermore, the current commercial catalysts are hindered by thermodynamic limitations, low selectivity, and lower stability of the catalysts under higher water contents. To overcome these challenges, most often, the need for a new catalyst is discussed [49]. One of the limiting factors is also the price of methanol. The production of methanol via the P-t-L process becomes economically competitive with fossil fuel-based synthesis only with the increase in methanol prices [17].
Numerous studies have investigated the kinetics of CO2 hydrogenation [11,50,51] as well as various comparisons and economic evaluations [2,47,52] of methanol production. Great efforts have been made to understand these processes individually; however, the relationships and effects between different processes for methanol production are poorly described. This work aims to bridge this gap by integrating the processes of CO2 capture and green H2 synthesis with the process of methanol production. In addition, heat integration and utility analyses were carried out to evaluate energy efficiency, energy consumption, and carbon emissions. Furthermore, a sensitivity analysis was conducted to assess the impact of critical operating parameters and further strengthen the overall approach.

2. Methods

In this study, Aspen Plus and Aspen Energy Analyzer were used to simulate the methanol production process utilizing green H2 generated by alkaline water electrolysis and CO2 captured from the flue gas using an aqueous amine solution (MEA). Because the entire simulation is quite extensive, each part of the simulation is described separately.
Alkaline water electrolysis was considered because it is currently the most mature technology for water electrolysis [16], has low operating temperatures [24], is reliable under continuous operating conditions [48], and is suitable for large-scale applications [53].
Post-combustion capture using absorption via MEA was used because it is most suitable for retrofitting existing power plants [4]. The process of absorption was considered because it is most commonly used to capture CO2 from fossil-fueled power plants [8]. MEA was chosen as the absorbent as it is the most efficient, with a CO2 capture rate of over 90% [12].

2.1. CO2 Capture

The capture of CO2 after combustion with aqueous amine solutions involves a reactive solvent absorption-regeneration process. The system can be divided into two main sections: absorption, in which CO2 is transferred from the vapor/gas phase to the liquid phase, and desorption, in which the solvent is regenerated. During the absorption process, a chemical bond is formed between the CO2 and the solvent in the liquid phase. In the desorption phase, a reverse reaction occurs, allowing the amine solvent to separate from CO2. The CO2 is then released as gas [54].
The simulation was based on data from reference [54], while the model’s foundation, including equations and constants, was derived from the built-in Aspen Plus model specifically designed for CO2 capture from a coal-fired power plant, as described in reference [55]. The ENTRL-RK thermodynamic model was used for this simulation because it effectively handles the thermodynamic behavior of electrolyte solutions, including the activity coefficients and phase equilibrium of CO2 in aqueous amine systems.

2.1.1. Reactions

The process involves two phases: gas and liquid. In the gas phase, nitrogen, oxygen, and water vapor are present along with CO2. In the liquid phase, the CO2-MEA-H2O system is characterized by the presence of ions due to ionic dissociation. The equilibrium reactions for the CO2-MEA-H2O system are presented in Equations (5)–(9) [54,55].
M E A H + + H 2 O M E A + H 3 O +
M E A C O O + H 2 O M E A + H C O 3
2 H 2 O H 3 O + + O H
2 H 2 O + C O 2 H 3 O + + H C O 3
2 H 2 O + H C O 3 H 3 O + + C O 2
Additionally, four kinetic reactions were included in the simulation (Equations (10)–(13)).
C O 2 + O H H C O 3
H C O 3 C O 2 + O H
M E A + H 2 O + C O 2 M E A C O O + H 3 O +
M E A C O O + H 3 O + M E A + H 2 O + C O 2
The kinetic parameters for the reactions are presented in the Supplementary Materials Table S1.

2.1.2. Process Flow Diagram and Feed Solution in the CO2 Capture Simulation

The purpose of the absorption section is to capture CO2 from the flue gases. It is assumed that other pollutants (SO2, NOx, etc.) have already been removed beforehand. The composition of the flue gases as well as the temperature and pressure is based on a coal-fired power plant operating under subcritical pressure [54]. The composition of the feed solution/flue gases is shown in Table 2.
The CO2-rich flue gas is fed to the bottom of the absorber and flows counter-currently to the liquid solvent (FLUEGAS in Figure 1). The exhaust gas (Z17 in Figure 1) exits at the top of the column (ABSORBER in Figure 1) and is fed to the water washing unit (WASHING in Figure 1). The CO2-rich solvent (Z1 and Z2 in Figure 1) is pumped from the bottom of the absorber through a pump into a counterflow heat exchanger (EXH1 in Figure 1), where its temperature is raised to the desired level. The heated solvent is then fed into the top of the stripper (STRIPPER in Figure 1). The stripper is heated, which leads to CO2 desorption from the liquid solvent and leaves the stripper as a gas. The stream (Z5 in Figure 1) contains CO2, however, water from the solvent also partially evaporates. This gas mixture is fed into a partial condenser (COND in Figure 1), where the CO2 is separated from the excess water. The CO2 from the partial condenser is then fed into a separator (SEP-CO2 in Figure 1), where it is purified from the remaining water and other volatile components before being used for methanol production. The excess water from the partial condenser is fed to the water washing unit (WASHING in Figure 1), where it is purified. The solvent from the bottom of the stripper (Z6–Z9 in Figure 1) is cooled and mixed with make-up water and MEA (as much as cannot be regenerated) (WATER-MU in Figure 1) before being returned to the absorber (Z15 and Z16 in Figure 1).

2.2. Water Electrolysis

In the simulation of alkaline water electrolysis in Aspen Plus, the articles by Sanchez et al. [56] and Ulleberg [57] were used as reference examples for the design process. The thermodynamic model used for the simulation was ELEC NRTL, which is suited for electrolyte systems and accurately represents phase equilibria in aqueous solutions. Since Aspen Plus does not include an operational unit for modeling alkaline water electrolyzers, the study by Sanchez et al. [56] employed a model of the alkaline water electrolyzer that was integrated into Aspen Plus as a subroutine using Aspen Custom Modeler (ACM). The STACK model is based on semi-empirical equations. In this case, a simplified model of the equations was used to calculate the power and conversion of H2O to H2. The simplified STACK model was then introduced to Aspen Plus as an RSTOIC reactor connected to a component separator (SEP), representing the electrolyzer. The required power of the STACK was calculated using Equation (14).
P s t a c k = U c e l l × N × I
Pstack stands for the power of the cell, Ucell for the voltage of the cell, N for the number of cells and I for the electric current. The cell voltage was calculated according to Ulleberg’s model [57], as presented in Equation (15).
U c e l l = V r e v + y 1 + y 2 × T × i + s × log t 1 + t 2 T + t 3 T 2 × i + 1
Vrev stands for the reversible voltage of the cell; T for the temperature; i denotes the current density; y1, y2, s, t1, t2, and t3 represent the experimentally determined constants.
The constants used were determined experimentally by Sanchez et al. [56] and are shown in the Supplementary Materials Table S1.
The H2 production was calculated using Equation (16).
F H 2 = P s t a c k U c e l l × z × F
FH2 stands for the molar flow rate of H2; z denotes the number of electrons transferred per molecule of H2; F expresses the Faraday constant 94,485 C/mol.
To accurately simulate the STACK model using the RSTOIC reactor, the value of the water conversion ratio is needed, which was calculated using Equation (17).
x H 2 O = M H 2 O × F H 2 w H 2 O × F f e e d
xH2O is the water conversion ratio; MH2O is the molar mass of water (18 g/mol); wH2O is the mass fraction of water in the feed solution; Ffeed is the molar flow rate of the feed solution.
To calculate the water conversion ratio and the power of the STACK, data on several parameters are also needed, which are listed in the Supplementary Materials. The data was obtained from the study by Sanchez et al. [56].
Using the data of experimentally determined coefficients and required parameters, which are presented in the Supplementary Materials Table S1, and the previously mentioned Equations (14)–(17), the power of the STACK cell and the water conversion ratio were calculated. The calculated power of the STACK cell is 0.65 GW, and the water conversion ratio is 0.0111.

2.2.1. Reactions

In the liquid phase of the system, ions are formed by the dissociation of water (Equation (18)) and KOH (Equation (19)).
H 2 O H + + O H
K O H K + + O H
The core of the system is the cell stack, STACK. Electrical energy and heat are supplied to the cells to break down water into H2 and oxygen through the electrochemical reaction shown in Equation (1).
The STACK was simulated as an RSTOIC reactor, and the operating conditions were calculated using the studies by Sanchez et al. [56] and Ulleberg [57]. The operating conditions are presented in Table 3.

2.2.2. Process Flow Diagram and Feed Solution in the Water Electrolysis Simulation

The process flow diagram shows two inlet streams, STACK-IN (Figure 2) and H2ODEFIC (Figure 2). The STACK-IN stream represents the initial amount of water and KOH required to start up the water electrolysis. After the initial KOH entry, the STACK-IN and RECYCLE (Figure 2) streams are merged to allow the electrolyte to circulate within the system. They are not connected in Figure 2; however, function Transfer was used to “connect” the two streams and avoid convergence challenges. H2ODEFIC represents the actual feed stream or input solution for the process, as it supplies the water consumed in H2 production. The composition and parameters of the H2ODEFIC and STACK-IN inlet streams are shown in Table 4.
H2 (H2-OUT in Figure 2) and oxygen (O2-OUT in Figure 2), produced in the STACK, are fed together with the electrolyte (KOH) to the gas-liquid separators (H2-SEP and O2-SEP in Figure 2), where the electrolyte is separated from the gases and returned to the STACK by recirculation pumps (PUMP-6 for the cathode loop and PUMP-7 for the anode loop in Figure 2). Both KOH recirculation streams (E9 and E10 in Figure 2) are passed to the mixer (MIXER-2 in Figure 2) and then through a heater (HEATER-1 in Figure 2) to heat the electrolyte before it re-enters the STACK. The separated H2 (E2 in Figure 2) and oxygen (E6 in Figure 2) from the two-phase separators are passed through condensate traps (H2OTRAP1 and H2OTRAP2 in Figure 2) to remove the condensed water. To maintain the appropriate water level, deionized water (H2ODEFIC in Figure 2) is pumped (PUMP-4 in Figure 2) into the gas-liquid separator (O2-SEP in Figure 2). The H2 produced (H2-PROD in Figure 2) passes through a separator (SEP-H2 in Figure 2), where the remaining water is removed before it is used for methanol synthesis.

2.3. Methanol Synthesis

Two pathways of methanol production from H2 and CO2 were simulated. The direct methanol synthesis consists of one reactor in which CO2 hydrogenation is present. In the two-step methanol synthesis, an RWGS reactor is additionally present, in which the CO2 is partially converted into CO. For the simulation of these reactions, the RPLUG reactor model in Aspen Plus was used based on the reaction kinetics, enabling accurate simulations of the processes. The thermodynamic model used for the simulation of both the direct and two-step methanol synthesis was PENG-ROB. The PENG-ROB (Peng-Robinson) equation of state is ideal for simulating methanol synthesis because it accurately predicts the phase behavior and thermodynamic properties of hydrocarbon systems, especially under high pressure and varying temperatures.

2.3.1. Kinetic Model for the Methanol Synthesis and RWGS Reactor

Several kinetic models with various forms of kinetic laws have been described in the literature, depending on the rate-determining mechanism considered [47] which describes methanol synthesis. The studies differ in terms of reaction conditions (temperature and pressure), feed composition, and the catalysts used [50,51]. Some models have been developed for methanol synthesis from CO and H2, while others consider CO2 in the feed mixture.
Experimental studies show that under typical conditions with Cu/ZnO/Al2O3 catalysts when both CO and CO2 are present, CO2 is the main source of methanol. CO participates in the synthesis, but only after it has been converted to CO2 by the WGS reaction. At high volumetric flow rates, methanol yield continually increases as CO is progressively replaced by CO2. In the case of a CO2-dominant feedstock, the kinetic model developed by Graaf et al. [50] or the kinetic model of van den Bussche and Froment [51] is most suitable. In this study, the kinetic model developed by Graaf et al. [50] was used.
Graaf et al. [50] performed calculations to characterize the chemical equilibrium in methanol synthesis. The thermodynamic equilibrium constants were calculated and depend only on temperature and remain unchanged when the inlet conditions (such as pressure or composition) and the catalyst are varied [50].
The corresponding kinetic rate expressions for methanol synthesis (reactions 2, 3, and 4) are given by Equations (20)–(22) [50,51,58].
r 2 = k 2 b C O 2 { p C O 2 p H 2 p C O p H 2 O K 2 ( 1 + b C O p C O + b C O 2 p C O 2 ) [ p H 2 1 2 + ( b H 2 O b H 2 1 2 ) p H 2 O ] }
r 3 = k 3 b C O { p C O p H 2 3 2 p C H 3 O H p H 2 1 2 K 3 ( 1 + b C O p C O + b C O 2 p C O 2 ) [ p H 2 1 2 + ( b H 2 O b H 2 1 2 ) p H 2 O ] }
r 4 = k 4 b C O 2 { p C O 2 p H 2 3 2 p C O p H 2 O p H 2 3 2 K 4 ( 1 + b C O p C O + b C O 2 p C O 2 ) [ p H 2 1 2 + ( b H 2 O b H 2 1 2 ) p H 2 O ] }
k2, k3, and k4 are the kinetic constants of reactions 2, 3, and 4, respectively; K2, K3, and K4 indicate the equilibrium constants for reactions 2, 3, and 4, respectively. bj denotes the adsorption constants for species j. pj stands for the partial pressure of species j.
In another study, Graaf et al. [50] described the impact of internal mass transfer limitations to determine kinetic parameter values. These numerical values are influenced by the catalyst used, the operating conditions, and the hydrogen-to-carbon ratio [50,58]. The equilibrium, adsorption, and kinetic constants are shown in the Supplementary Materials Table S1.
The kinetic model for the RWGS reactor was taken from studies by Rahimpour et al. [59] and Santos et al. [60]. The equilibrium constant, activation energy, and reaction rate constant for the RWGS reactor are shown in Supplementary Materials Table S1. For this process, the catalyst Ni/MgAl2O4 was assumed [60].

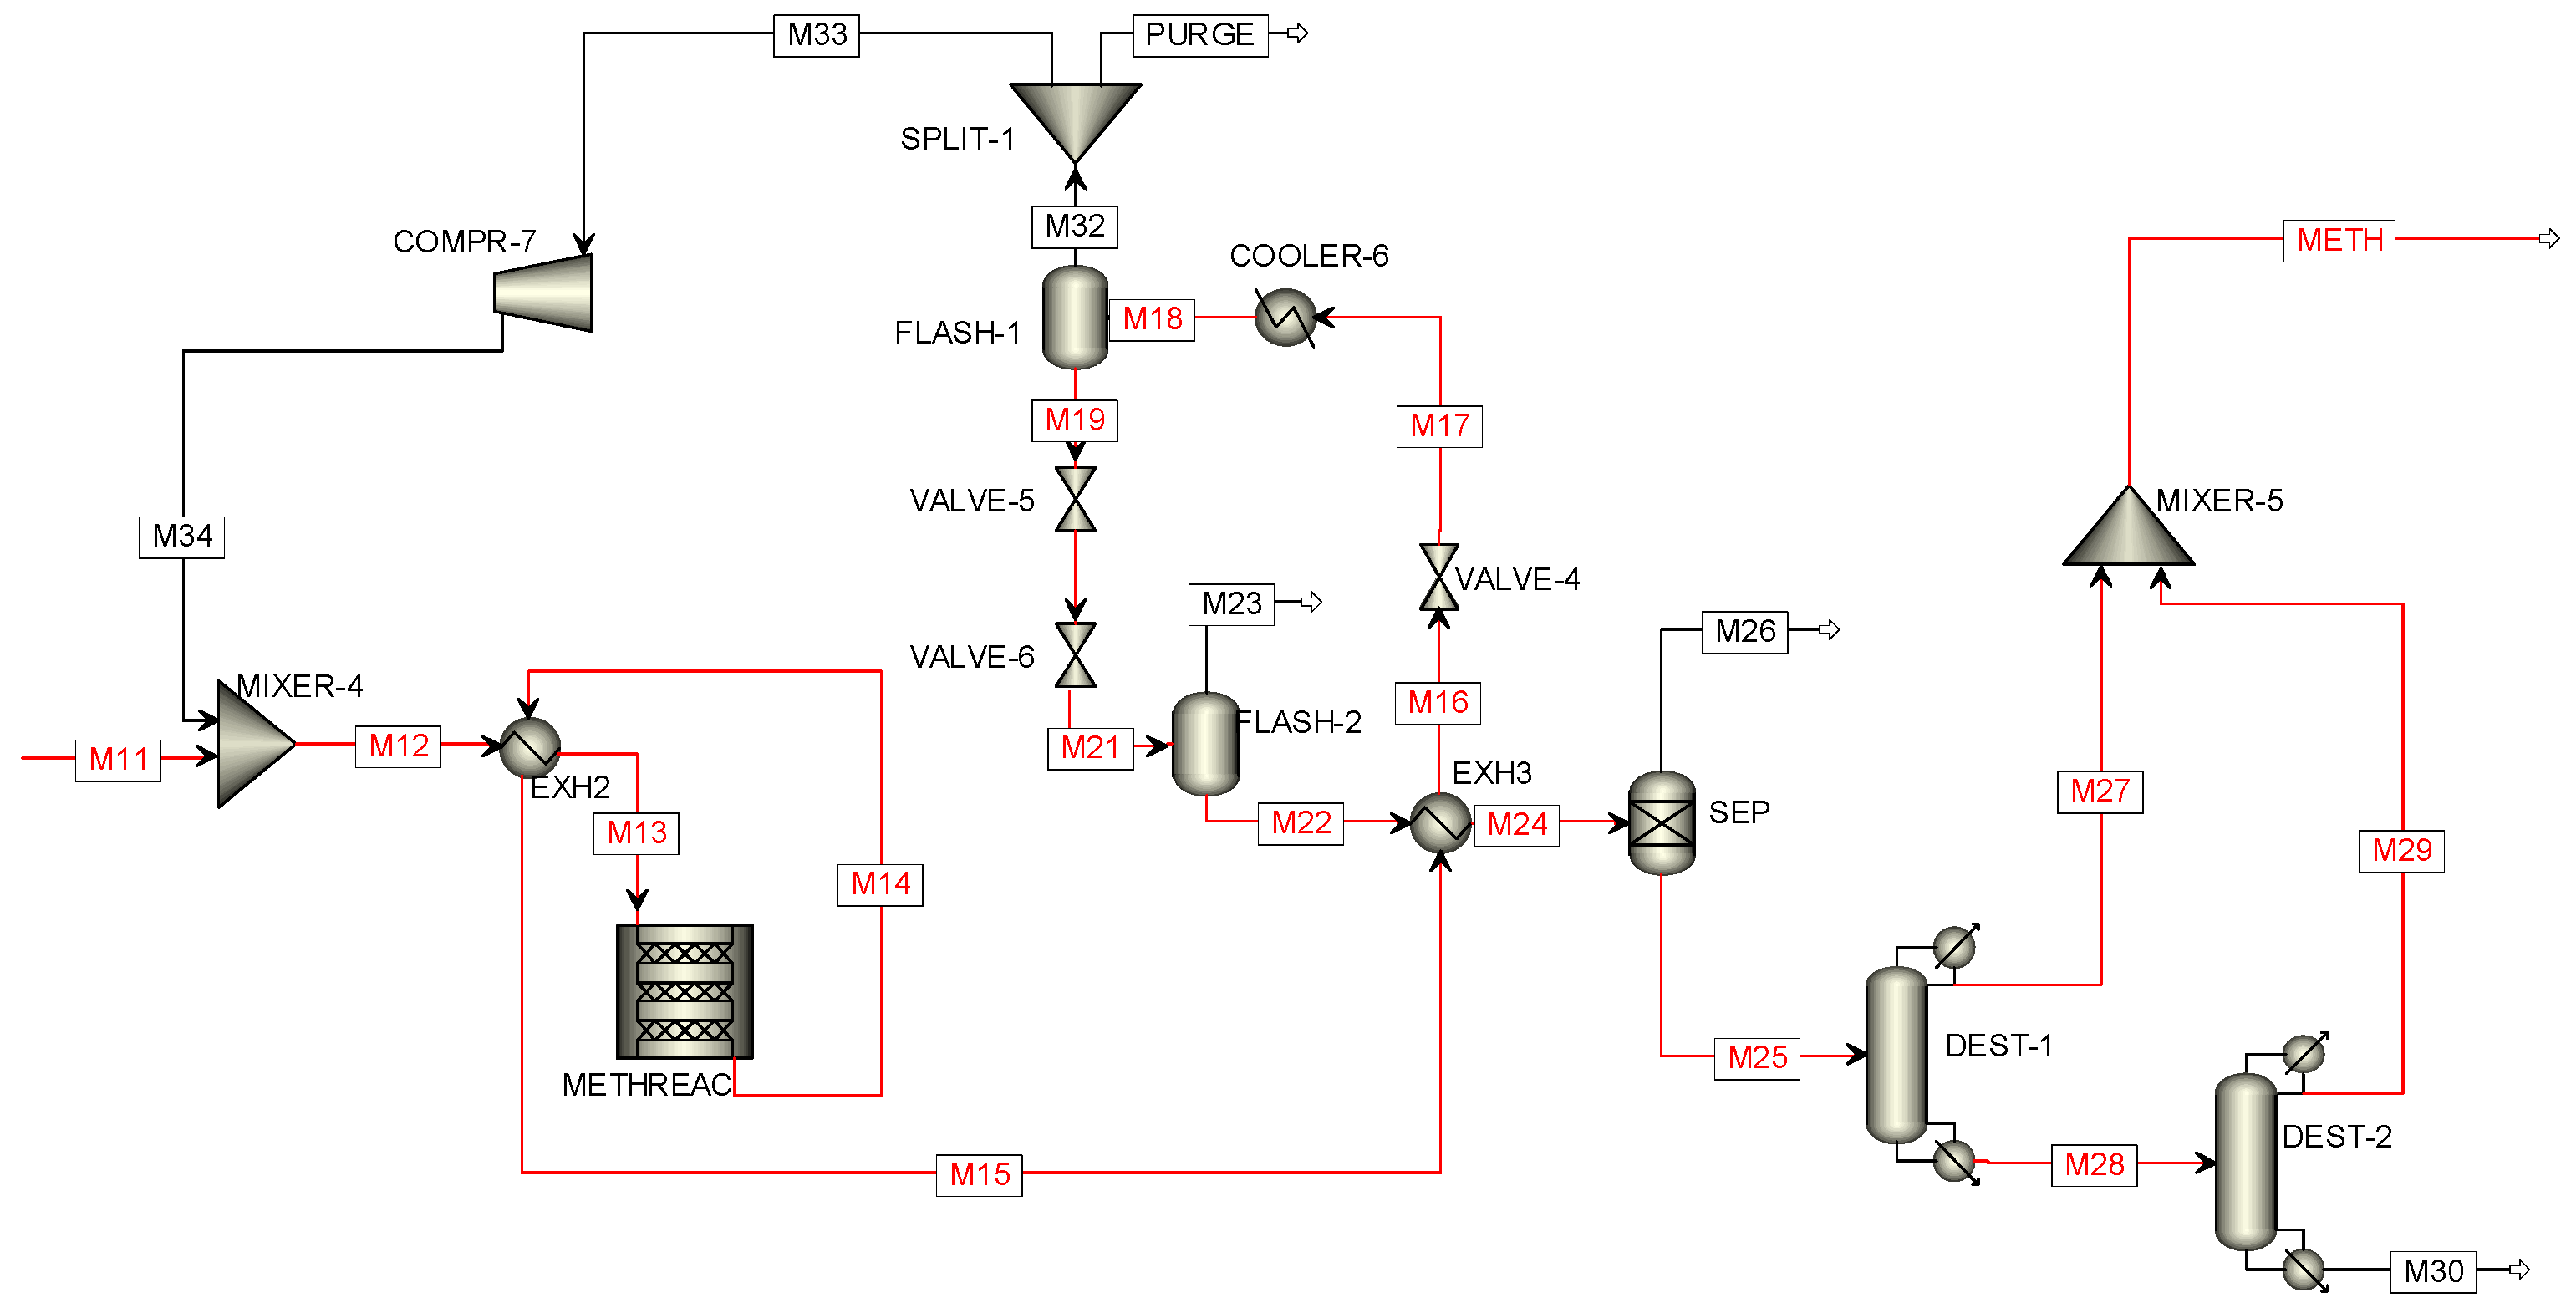
2.3.2. Direct Methanol Synthesis

Direct methanol synthesis by hydrogenation of CO2 is a chemical process in which CO2 and H2 are converted directly into methanol (CH3OH). The RPLUG reactor was used to simulate direct methanol synthesis. The kinetics of Graaf et al. [50] were used for the RPLUG reactor. The dimensions and specifications of the RPLUG reactor are shown in Table 5.
The process is divided into three sections: compression of the feedstocks (H2 and CO2) to the required pressure, methanol synthesis by CO2 hydrogenation in the RPLUG reactor, and separation of the methanol from the other components present in the reactor output stream.
The input streams of H2 (H2 in Figure 3) and CO2 (CO2 in Figure 3) need to be compressed to a pressure of 78 bar, which corresponds to the operating pressure of the reactor. The compression of CO2 (from 1.8 bar to 78 bar) takes place in four stages (streams M1–M7 in Figure 3), while the compression of H2 (from 6.7 bar to 78 bar) occurs in two stages (streams M8–M10 in Figure 3). After each compression stage, the stream needs to be cooled to a lower temperature before the next compression stage is initiated. After the final compression stage, there is no cooler as the reactor operates at a high temperature, so the streams M10 (Figure 3) and M7 (Figure 3) do not need to be cooled. The streams of compressed feedstock at the operating pressure of the reactor of 78 bar are then mixed in the mixer (MIXER-3 in Figure 3).
The stream of the compressed CO2-H2 mixture (M11 in Figure 3) is then fed into a mixer (MIXER-4 in Figure 4), where it is mixed with the recycle stream (M34 in Figure 4). The feedstock, mixed with the recycle stream (M12 in Figure 4), passes through the heat exchanger (EXH2 in Figure 4), where it is heated to the desired temperature before entering the reactor (METHREAC in Figure 4). The stream from the reactor (M14 in Figure 4) passes through the heat exchanger EXH2 (Figure 4), where part of the heat is used to heat the stream entering the reactor (M12 in Figure 4). After releasing heat, it passes through heat exchanger EXH3 (Figure 4), where it transfers part of its heat to stream M22 (Figure 4), which flows into the separator (SEP in Figure 4). The stream from the reactor (M16 in Figure 4) is then passed through the valve (VALVE-4 in Figure 4) and the cooler (COOLER-6 in Figure 4) before being sent into the gas-liquid separator (FLASH-1 in Figure 4). From the separator, the gas (M32 in Figure 4), which mainly consists of CO and H2, is sent through a splitter (SPLIT-1 in Figure 4), where part of the gas is released as a purge gas, while the remaining portion is recycled back into the process. The liquid (M19 in Figure 4) from the separator, which mainly contains methanol and water, is then directed through two valves (VALVE-5 and VALVE-6 in Figure 4), where its pressure drops before entering the second gas-liquid separator (FLASH-2 in Figure 4), where CO and H2 are further removed. The nearly pure stream (M22 in Figure 4) of methanol and water is passed through the heat exchanger EXH3 (Figure 4) into the separator (SEP in Figure 4), where the remaining volatile components present in stream M24 (Figure 4) are separated. The mixture (M25 in Figure 4) of pure methanol and water is then directed to the distillation column (DEST-1 in Figure 4), where the methanol (M27 in Figure 4) is separated in liquid distillate form from the mixture. Due to the high presence of methanol in the distillation residue (M28 in Figure 4), it is routed to the second distillation column (DEST-2 in Figure 4), where the methanol (M29 in Figure 4) is almost completely separated from the water (M30 in Figure 4). The distillates from the first (M27 in Figure 4) and second (M29 in Figure 4) distillation columns are then mixed in the mixer (MIXER-5 in Figure 4), yielding high-purity end product methanol (METH in Figure 4).

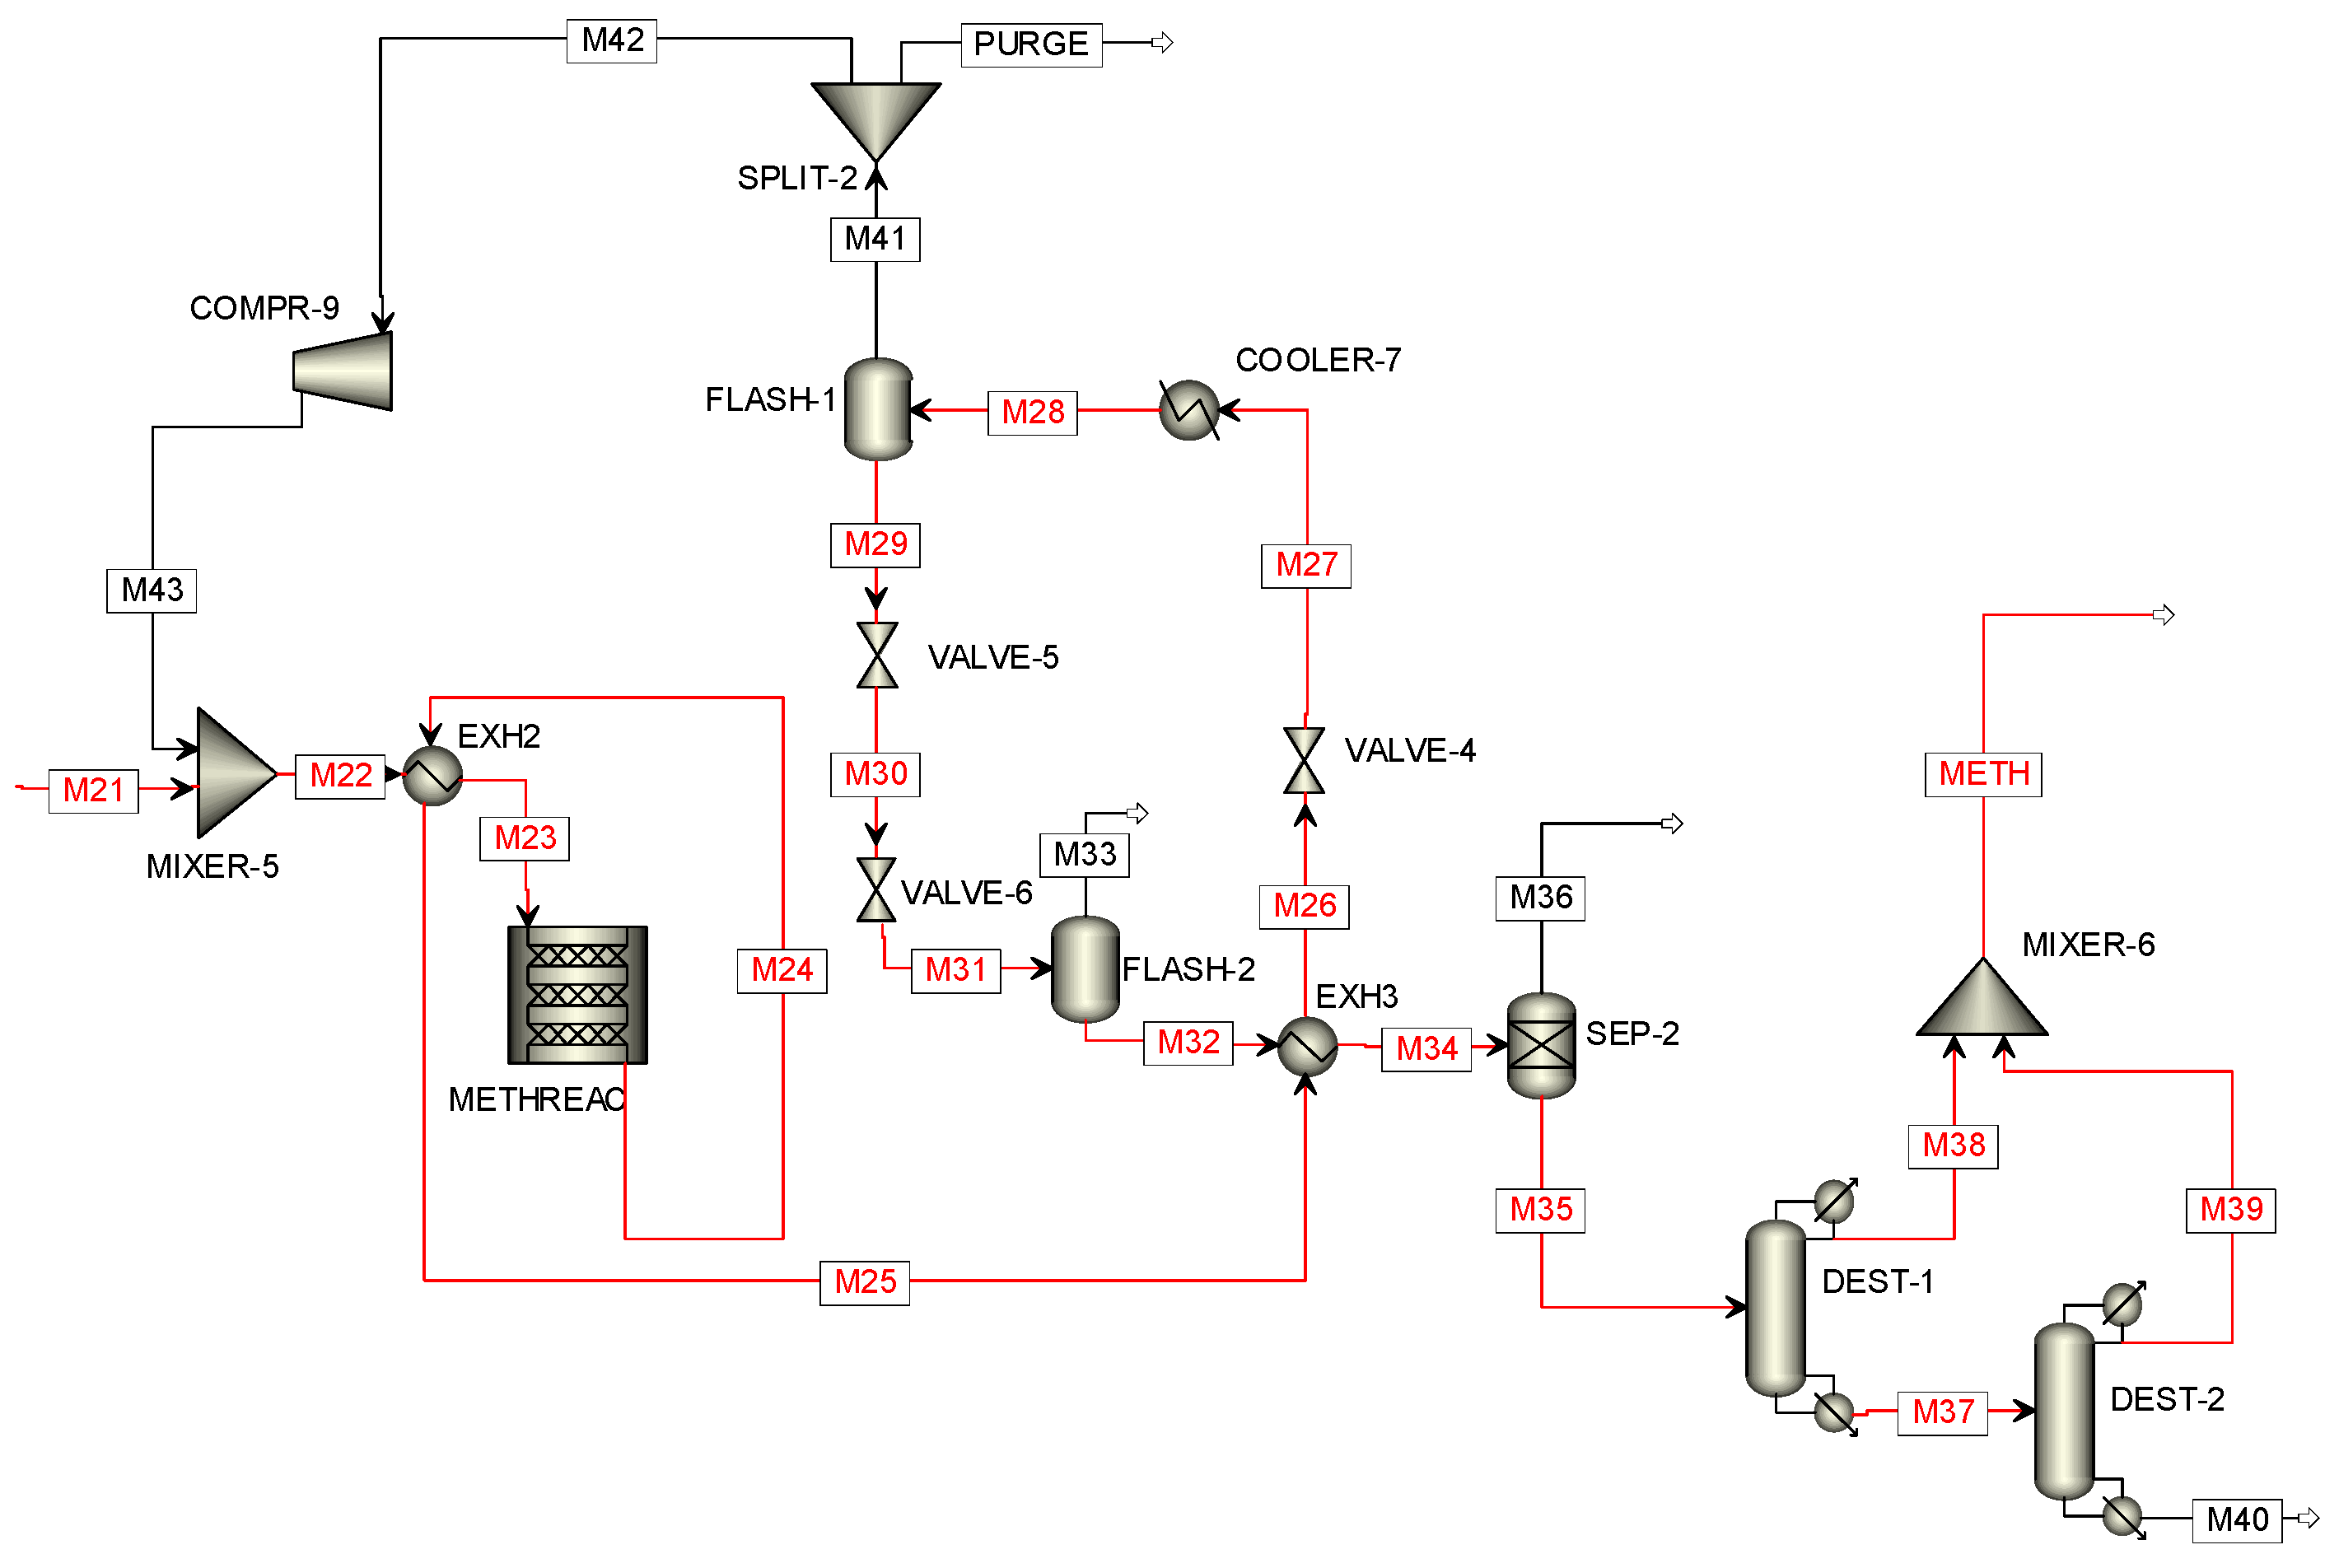
2.3.3. Two-Step Methanol Synthesis

The dimensions and specifications for the RWGS reactor are presented in Table 6.
The process is divided into various sections. Initially, the raw materials are compressed, followed by the formation of syngas from a portion of H2 and captured CO2. This is followed by further compression of the feed mixture to the operating pressure of the methanol synthesis reactor. After the methanol synthesis, the methanol is purified from other components present.
The Incoming CO2 stream needs to be partially converted into CO. Before conversion, it must be compressed to a pressure of 20 bar, which is achieved by three-step compression (stream CO2, M1–M5 in Figure 5). The compressed CO2 (M5 in Figure 5) is then combined in a mixer (MIXER-3 in Figure 5) with a portion of H2 (M7 in Figure 5), which is also compressed to 20 bar (streams H2, M6, and M7 in Figure 5). The optimal molar ratio for converting CO2 and H2 into syngas is 0.8 [60]. The stream (M8 in Figure 5) from the mixer (MIXER-3 in Figure 5) is then heated to 750 °C with a heater (HEATER-2 in Figure 5) and fed into the RWGS reactor (RWGS-REAC in Figure 5). The output stream (M10 in Figure 5) from the reactor is then directed to the SEP-1 separator (Figure 5), where water is separated from the syngas. The syngas (M11 in Figure 5) is then compressed to 78 bar and subsequently mixed in a mixer (MIXER-4 in Figure 5) with the remaining H2, also compressed to 78 bar.
From the mixer (MIXER-4 in Figure 5), the compressed mixture of H2, CO2, and CO is directed into a mixer (MIXER-5 in Figure 6), where it is combined with the recycle stream (M43 in Figure 6). The stream M22 (Figure 6) from the mixer then flows through the heat exchanger EXH2 (Figure 6) where it is heated to the desired temperature before entering the reactor (MEATHREAC in Figure 6) for methanol synthesis. The stream from the reactor (M24 in Figure 6) passes through the heat exchanger EXH2 (Figure 6) where it transfers heat to the incoming stream to the reactor (M22 in Figure 6). The stream from the reactor (M26 in Figure 6) is then routed through the valve (VALVE-4 in Figure 6) and cooler (COOLER-6 in Figure 6) to the gas-liquid separator (FLASH-1 in Figure 6). The gas stream (M42 in Figure 6), which is rich in CO and H2, separates from the liquid stream (M19 in Figure 6), which mainly contains methanol and water. After pressure reduction at the valves (VALVE-5 and VALVE-6 in Figure 6), the liquid stream (M29–M31 in Figure 6) enters a second separator (FLASH-2 in Figure 6), where CO and H2 are further removed. The stream (M32 in Figure 6) consisting of mostly water and methanol exchanges heat in EXH3 (Figure 6) and is then purified from the remaining volatile components in the separator (SEP-2 in Figure 6). The methanol-water mixture (M34 in Figure 6) is then distilled in column DEST-1 (Figure 6), where methanol (M38 in Figure 6) is separated as a liquid distillate. Due to the high methanol content in the residue (M37 in Figure 6), it is distilled again in column DEST-2 (Figure 6), where methanol (M39 in Figure 6) is almost completely separated from water (M40 in Figure 6). The distillates from both columns are combined in a mixer (MIXER-6 in Figure 6), resulting in a stream of high-purity methanol (METH in Figure 6).

2.4. Sensitivity Analysis

First, a direct and a two-stage methanol synthesis were carried out with a molar ratio of H2:CO2 of 3:1 at a constant reactor temperature of 284 °C. Two sensitivity analyses were then performed to assess the impact of changes in the input molar ratio and reactor temperature on the methanol yield.
In the first analysis, the molar feed of H2 was varied in the range of 5000 kmol/h to 7000 kmol/h (molar ratio H2:CO2 between 2:1 and 4:1) with a step of 50 kmol/h. In the second analysis, the reactor temperature was changed between 250 °C and 300 °C with a step of 5 °C.

2.5. Evaluation of Carbon Emissions, Electricity and Utility Costs

Using the Aspen Plus and Aspen Energy Analyzer programs, the expected operating costs of the plant were estimated based on the simulation. In Aspen Plus, the utilities used were first defined, as presented in Table 7. The appropriate utilities were then assigned to the individual process units: compressors received electricity (U-2), coolers were assigned cooling (U-1 or U-4), and heaters were assigned heating (U-3, U-5, or U-6), depending on their needs.
Predefined utilities integrated in Aspen Plus were used in this process. Utility consumption and carbon emissions under optimal conditions were evaluated using the Aspen Energy Analyzer, which maximized the integration of hot and cold streams for minimal energy consumption.

3. Results and Discussion

In this chapter, the simulation results for the individual parts of the process for direct and two-stage methanol synthesis (water electrolysis, CO2 capture, direct and two-stage methanol synthesis) are presented. For each part of the process, the key streams, final products, carbon emissions, utility consumption, and optimal consumption under the ideal use of heat exchangers are highlighted. In the methanol syntheses, the results of the sensitivity analyses are also presented. Lastly, a comparison between the synthesis paths is presented, along with a comparison of this study’s results in comparison with other studies.

3.1. CO2 Capture

3.1.1. Results of the CO2 Capture Simulation in Aspen Plus

The key streams from the CO2 capture simulation are presented in Table 8. The schematic of the entire process is shown in Figure 1. The data on all the streams present is included in Supplementary Materials Table S2.
FLUEGAS (Figure 1) is the input stream. The stream Z5 (Figure 1) represents the captured CO2 along with water vapor. CO2-OUT (Figure 1) represents the stream from the condenser. CO2 (Figure 1) represents the product, which is then used in the direct or two-stage methanol synthesis. The results indicate that 2000 kmol/h of pure CO2 is captured from 16,560 kmol/h of flue gas.

3.1.2. Results of Heat Integration, Utility Costs, and Carbon Emissions Analysis of CO2 Capture in the Aspen Energy Analyzer

The consumption of utilities in the CO2 capture simulation and its optimization using the Aspen Energy Analyzer were analyzed. The CO2 capture process includes one heat exchanger (EXH1 in Figure 1), one cooler (COOLER-1 in Figure 1), and a condenser (COND in Figure 1) that also functions as a cooler. Since two streams require cooling, it is not possible to reduce the utility consumption with additional heat exchangers, as only a cooling medium is needed in the CO2 capture process.
The energy consumption and its annual costs are presented in Table 9. The operation of the CO2 capture process requires 69.2 MW of cold utility and 0.60 MW of electrical power. The total costs for this energy requirement amount to 0.87 $M/a. This process produces 71,077 kg/h of carbon emissions.

3.2. Water Electrolysis

3.2.1. Results of the Water Electrolysis Simulation in Aspen Plus

The flowsheet diagram showcasing this process is shown in Figure 2. The data for the important streams are shown in Table 10. The data on all the streams present is included in Supplementary Materials Table S2.
The stream STACK-IN (Figure 2) represents the initial quantity of substances required to start the process. After the initiation, the quantity of water is maintained by the stream H2ODEFIC (Figure 2), which replenishes the water consumed during H2 production. The results indicate that 6433 kmol of water is consumed in one hour to produce 6000 kmol of pure H2.

3.2.2. Results of Heat Integration, Utility Costs, and Carbon Emissions Analysis of Water Electrolysis in the Aspen Energy Analyzer

The results of the analysis, including data on current energy consumption, optimized consumption, and potential savings, are presented in Table 11.
Additionally, the financial impact of optimization was calculated. The annual utility costs before and after optimization were determined, along with an evaluation of potential savings. The optimization of utility costs is shown in Table 12.
The results indicate that significant reductions in energy consumption can be achieved by carefully positioning heat exchangers and selecting appropriate cooling and heating media. Specifically, the optimization allows for a 9.28% reduction in consumption, equivalent to 76.4 MW. This reduction translates directly into cost savings of 3.35 M$/a. The process initially produces 155,752 kg/h of carbon emissions. With optimized heat integration, that could be reduced by 6.93%, resulting in carbon emissions of 144,952 kg/h.

3.3. Direct Methanol Synthesis

3.3.1. Results of the Direct Methanol Synthesis Simulation in Aspen Plus

Key streams along with their molar flow rates and component fractions are presented in Table 13. The data on all the streams present is included in Supplementary Materials Table S2.
From the table, it is evident that with a flow rate of 8000 kmol/h of the feed solution with a molar ratio of H2:CO2 of 3:1, 1983.8 kmol of methanol per hour is produced. The output product is of high purity, with a molar fraction of methanol of 0.9997. The feed stream entering the reactor contains, in addition to CO2 and H2, a smaller quantity of CO (0.03 molar fraction). The molar ratio of CO2:CO:H2 upon entering the reactor is 1:0.13:3.35, while at the reactor’s outlet, the molar fraction of CO increases while the molar fractions of CO2 and H2 decrease. This indicates that most of the produced methanol is formed from the reaction between CO2 and H2. This process produces 0.331 kmol of methanol per kmol of H2.

3.3.2. Results of Heat Integration, Utility Costs, and Carbon Emissions Analysis of Direct Methanol Synthesis in the Aspen Energy Analyzer

The analysis results, including data on current energy consumption, optimal consumption, and potential savings, are presented in Table 14.
Table 15 shows the financial evaluation of the optimization. The annual utility costs before and after optimization were calculated and the potential savings were assessed.
The table reveals that through thermal integration, energy requirements can be reduced by 39.4% or 58.2 MW. By reducing energy needs, 6.2 $M/a can be saved. The initial amount of carbon emissions is 22,728 kg/h. With optimal heat integration present, the carbon emissions could be reduced by 60.7%, resulting in carbon emissions of 8933 kg/h.

3.4. Two-Step Methanol Synthesis

3.4.1. Results of the Two-Step Methanol Synthesis Simulation in Aspen Plus

Table 16 provides an overview of key streams, including molar flows and component fractions. The data on all the streams present is included in Supplementary Materials Table S2.
From the table, it is evident that with a feed stream of 8000 kmol/h and a molar ratio of H2:CO2 at 3:1, the process produces 1957 kmol/h of methanol. The output product is of high purity, with a molar fraction of methanol at 0.9998. The feed stream entering the reactor contains CO2, CO, and H2. The molar ratio of the feed materials entering the reactor is CO2:CO:H2 = 1:0.9:5. In-stream M24 (Figure 6), which exits the reactor, a significant reduction in the molar fractions of CO2, CO, and H2 is observed. This suggests that a large portion of the CO2 is consumed during methanol synthesis, indicating that CO2 is the primary carbon source in methanol production. This process produces 0.326 kmol of methanol per kmol of H2.

3.4.2. Results of Heat Integration, Utility Costs, and Carbon Emissions Analysis of Two-Step Methanol Synthesis in the Aspen Energy Analyzer

The results of this optimization, including data on current and optimized energy consumption as well as potential savings, are summarized in Table 17.
Additionally, the annual costs of utilities before and after optimization were calculated, and potential savings were assessed. The results of annual utility costs based on the original and optimized energy needs are presented in Table 18.
After optimization, the total energy consumption was reduced by 80.2 MW. The total utility costs decreased by 7.7 M$/a. This process originally produced 33,367 kg/h of carbon emissions. With optimal heat integration, the carbon emissions could be reduced by 50.3%, resulting in emissions of 16,576 kg/h.

3.5. Sensitivity Analysis of the Direct and Two-Step Methanol Synthesis

Figure 7 displays the graph of methanol production as a function of the molar H2 feed rate for the direct and two-step methanol synthesis, respectively. The sensitivity analysis was conducted with H2 feed rates between 5000 and 7000 kmol/h, in steps of 50 kmol/h.
The graph shows that insufficient H2 feed negatively impacts methanol yield. The peak methanol yield occurs at an H2 feed rate of 6150 kmol/h for both synthesis paths. Beyond this point, increasing the H2 feed causes a slight decline in methanol yield.
To determine the optimal H2 input more precisely, the molar ratios of the raw materials (CO2, CO, and H2) entering the reactor were also compared, depending on the amount of H2 entering the system. Figure 8 presents a graph of the molar fractions of the inlet components of the methanol synthesis reactor as a function of the H2 feed rate.
Figure 8 indicates that at an H2 feed rate of 6150 kmol/h, which maximizes methanol production, the feed stream for the methanol synthesis reactor is dominated by H2 and CO2, with CO present in smaller quantities. It is also observed that increasing the H2 feed leads to its accumulation in the system, which is not optimal for process efficiency. The molar ratio of CO2:CO:H2 at a feed rate of 6150 kmol/h is 1:0.05:5.6. While this H2 feed rate provides the highest methanol production, the optimal H2 feed rate, based on the balance between methanol production and H2 feed, is 5950 kmol/h, giving a ratio of CO2:CO:H2 as 1:0.30:3.09. The ratio of produced methanol to H2 feed is 0.331, meaning that 1 kmol of H2 produces 0.331 kmol of methanol.
Figure 9 presents a graph of the molar fractions of the inlet components of the methanol synthesis reactor as a function of the H2 feed rate.
From Figure 9, it is evident that at an H2 input of 6150 kmol/h, which represents the maximum for methanol production, H2 predominates in the feed stream to the methanol synthesis reactor, while CO2 and CO are present in comparable amounts. It is also observed that as the amount of H2 input into the system increases, it starts to accumulate, which is not optimal for process efficiency. The molar ratio of CO2:CO:H2 at the optimal H2 input is 1:0.8:8.7. The highest ratio of methanol production to H2 input is achieved at a molar input of 5850 kmol/h of H2, which translates to a ratio of CO2:CO:H2 as 1:0.90:4.94. The ratio of produced methanol to H2 is 0.327, meaning that 1 kmol of H2 produces 0.326 kmol of methanol.
In addition to studying the effect of the H2 feed rate on methanol yield in direct and two-step synthesis, the impact of reactor temperature on methanol production was also examined. The sensitivity analysis for reactor temperature was conducted in the range of 250 to 300 °C, with steps of 5 °C. Figure 10 shows the graph of methanol production as a function of reactor temperature.
Figure 10 reveals that increasing reactor temperature results in higher methanol production. Up to a certain temperature, the production of methanol increases significantly. It is evident that in both processes, the increase in methanol production lessens after 270 °C. From that, we can conclude that both of the processes have an optimum temperature of around 270 °C.

3.6. Comparison of the Direct and Two-Step Methanol Synthesis Paths

In this chapter, we compared the direct and two-step methanol synthesis processes. The key points of comparison are shown in Table 19.
The direct methanol synthesis achieves a slightly higher yield of methanol (1983.8 kmol/h) as compared to the two-step process (1957 kmol/h). The direct synthesis produced 0.331 kmol of methanol per kmol of H2, while the two-step process produced 0.326 kmol of methanol per kmol of H2.
In terms of energy consumption, the direct synthesis requires less energy (147.9 MW) than the two-step process (175 MW) before optimization. Before optimization, the direct synthesis path produced 13.4 kmol of methanol/MW, while the two-step process produced 11.2 kmol of methanol/MW. The difference in energy consumption between the processes amounts to the direct synthesis requiring 3.2 M$/a less to operate. Energy optimization showed great possibilities to reduce energy needs and costs. Reducing the energy required by the direct synthesis by 39.4%, amounting to a reduction of 58.2 MW and 6.4 M$/a of costs. In the two-step process, the energy requirement is reduced by 45.8%, resulting in a reduction of 100.2 MW and 7.7 M$/a of costs. It is evident that the two-step synthesis benefits more from heat integration and optimization; nonetheless, it still requires more energy and costs more than direct synthesis. In terms of environmental impact, the direct synthesis produces less carbon emissions (22.728 kg/h) compared to the two-step process (33.367 kg/h).
The difference in energy requirements can be explained by the presence of the RWGS reactor in the two-step process. The RWGS reactor operates at a high temperature (750 °C), which requires additional heating and, subsequently cooling, resulting in higher carbon emissions. As a consequence of the RWGS reactor, additional process units are required; another cooler, heater, separation unit, and two compressors. Because of the extra need for the process units, we can assume that the capital needed for the realization of the two-step process would be higher than for the direct process. In terms of the catalyst needed for the processes, the methanol reactor requires the same amount of catalyst (Cu/ZnO/Al2O3) in the case of direct and two-step methanol synthesis. The RWGS reactor operates on a different catalyst (Ni/MgAl2O4). Since the amount of catalyst in the methanol reactor needed for both processes is the same, we can conclude that costs associated with the catalyst are higher for the two-step synthesis as it requires a different catalyst for the RWGS reaction. Overall, direct methanol synthesis shows advantages in terms of methanol yield, capital, and operating costs.

3.7. Comparison of Results and Model Validation

Table 20 provides a comparative analysis of simulation results for methanol production via the direct and two-step methanol synthesis processes. In the table is data on process parameters, catalyst for the methanol reactor, reactor feed composition, and amount of methanol produced.
This table compares the results of methanol production achieved in this study to those reported in other literature. The results from this study serve as a baseline for comparison. These simulations have similar process parameters and reactor molar feed; additionally, they all use a copper-based catalyst. The simulations presented in this study have similar methanol yield compared to those reported in the literature, albeit a little higher. This can be attributed to different factors, such as the difference in temperature and pressure. For the reactions in methanol synthesis (Equations (2)–(4)), higher pressure and lower temperatures are favorable. Compared to this study, Esmaili et al. [61] and Sollai et al. [62] achieved a lower yield for the direct synthesis process with the same catalyst but under milder conditions. Although lower temperatures should theoretically favor methanol synthesis, the lower pressures appear to have had a more significant negative impact on methanol yield.
Anicic et al. [47] obtained slightly lower yields using a Cu/ZnO/ZrO2 catalyst in both direct and two-step processes under less severe conditions, suggesting that a different catalyst can partially offset reduced operating parameters.
Sanchez et al. [56] validated the AspenPlus model for the alkaline water electrolysis system by comparing the simulation results with experimental data obtained from a test bench. Measurements of stack voltage, hydrogen production, and gas purity were collected to serve as the basis for validation. To quantify its accuracy, the model’s outputs were compared to the experimental results using root-mean-square (RMS) error analysis. The RMS error was approximately 5 mV per cell for stack voltage and less than 1% for both the Faraday efficiency and hydrogen-to-oxygen crossover (HTO), indicating excellent alignment with the observed data. Since our model is a simplified, scaled-up version of theirs, the results we gained from the simulation can be considered accurate.
Madeddu et al. [54] validate the AspenPlus model of CO2 capture by applying it to the absorption sections of two pilot-plant facilities with different packing and operating conditions. By analyzing the system’s fluid dynamics through the Peclet number, the model achieved accurate numerical solutions, meaning it successfully replicated experimental data. For the stripping sections of two additional facilities, the model also accurately described internal profiles and energy demands across all experimental conditions. These results demonstrated the model’s high accuracy and reliability, enabling its application to dynamic scenarios and industrial-scale design.

3.8. Future Directions

In this article, we have investigated and compared two pathways of methanol synthesis from green H2 and captured CO2. Both processes were simulated using Aspen Plus, followed by heat integration through the Aspen Energy Analyzer. The results of these simulations were analyzed and compared. To deepen the understanding of the feasibility of each pathway, further research should include a detailed economic analysis. This would involve estimating and comparing the investment of operating units. Additionally, a more thorough evaluation of operating costs is necessary. This should account for factors like catalyst costs, degradation rates, replacement frequency, maintenance expenses, and potential equipment malfunctions. Moreover, a comprehensive life cycle assessment (LCA) would provide valuable insights into the environmental impact and overall sustainability of these pathways. Another crucial area for future research is the intermittent nature of renewable energy sources and their impact on hydrogen production. Such variability could significantly influence methanol production and should be addressed through modeling and scenario analysis. Finally, to contextualize the findings, these methanol synthesis pathways should be compared to other P-t-X processes, such as producing methane, dimethyl ether, and Fischer–Tropsch fuels.

4. Conclusions

In this article, the potential of converting CO2 emissions into methanol, which serves as a significant alternative to methanol production from fossil fuels, was explored. Two distinct methods for methanol synthesis were focused on: direct and two-step synthesis. For CO2 capture, a process using monoethanolamine (MEA), a widely adopted technology for capturing CO2 from industrial flue gases, was employed. A flue gas stream with a flow rate of 16,560 kmol/h and a CO2 molar fraction of 0.14 was utilized, from which 2000 kmol/h of CO2 was captured. The H2 required for methanol synthesis was produced through alkaline electrolysis of water. To produce 6000 kmol/h of H2, 6433 kmol/h of water was used. The captured CO2 and the produced H2 served as the raw materials for methanol production via direct and two-step synthesis methods. In the direct synthesis, direct hydrogenation of CO2 to methanol was conducted, while in the two-step synthesis, CO2 was first converted to CO through the reverse water-gas shift (RWGS) reaction, followed by hydrogenation of the CO and CO2 mixture into methanol.
For the direct methanol synthesis simulation, an input stream with a molar ratio of H2:CO2 of 3:1 was utilized. The input stream to the reactor included a small amount of CO, resulting in a CO2:CO:H2 molar ratio of 1:0.13:3.35. The reactor operated at 284 °C and 78 bar. The simulation results indicate that, under these conditions, 1983.8 kmol/h of methanol (x = 0.9997) can be produced.
In the two-step methanol synthesis simulation, an identical input stream as in the direct synthesis was used; however, the reactor feed included a substantial amount of CO, resulting in a CO2:CO:H2 molar ratio of 1:0.9:5. This was due to the conversion of some CO2 into CO in the RWGS reactor. The RWGS reactor operated at a temperature of 750 °C and a pressure of 20 bar, while the methanol synthesis reactor operated at a temperature of 284 °C and a pressure of 78 bar. The simulation results showed that under these conditions, 1957 kmol/h of methanol (x = 0.9998) can be produced.
The sensitivity analysis revealed that the molar inflow of H2 and the reactor temperature significantly affect methanol production. To maximize methanol yield, a feed of 6150 kmol/h of H2 was found to be ideal. At this molar flow rate of H2, the direct synthesis pathway produced 1988 kmol/h of methanol, while the two-step pathway produced 1962 kmol/h. When comparing the amount of methanol produced with the required amount of H2, the optimal H2 feed differed for each process. The optimal feed rate for the direct synthesis was 5950 kmol/h, resulting in 1972 kmol/h of methanol production. In contrast, the two-step process had an optimal feed rate of 5850 kmol/h, yielding 1912 kmol/h of methanol. For both processes, the optimal temperature was approximately 270 °C.
By comparing both methods, it was found that direct methanol synthesis yields a 1.4% higher production of methanol, which is not a substantial amount. However, when comparing energy requirements, it can be seen that the direct synthesis of methanol requires a substantially lower amount of energy. The direct methanol synthesis required 147.9 MW of energy, whereas the two-step synthesis needed 175 MW. This difference indicates that direct synthesis consumes 27.1 MW less energy, resulting in operational cost savings of 2.2 M$/a. Besides the lesser energy requirements, the direct methanol synthesis process also produces lower carbon emissions (22,728 kg/h) as compared to the two-step methanol synthesis process (33,367 kg/h). In terms of capital requirements, the direct process is more cost-efficient, as it only requires a methanol synthesis reactor in contrast to the two-step process that requires both an RWGS reactor as well as several additional process units as a consequence of the RWGS reactor.

Supplementary Materials

The following supporting information can be downloaded at: https://www.mdpi.com/article/10.3390/pr12122843/s1, Table S1: Kinetic parameters and experimental coefficients of processes simulated in AspenPlus; Table S2: Flowrates of each simulation.

Author Contributions

Conceptualization, D.T.H., A.N. and M.B.; methodology, D.T.H., A.N. and M.B.; software, D.T.H. and M.B.; validation, D.T.H., A.N. and M.B.; investigation, D.T.H. and M.B.; data curation, D.T.H., A.N. and M.B.; writing—original draft preparation, D.T.H.; writing—review and editing, A.N. and M.B.; visualization, D.T.H.; supervision, A.N. and M.B. All authors have read and agreed to the published version of the manuscript.

Funding

The financial support from the Slovenian Research and Innovation Agency (program P2-0414 and PhD research fellowship for David Tian Hren). The authors acknowledge partial support from the Republic of Slovenia, the Ministry of Higher Education, Science, and Innovation, and the European Union—NextGenerationEU in the framework of the project HyBReED, which is part of the Slovenian Recovery and Resilience Plan. Views and opinions expressed are, however, those of the authors only and do not necessarily reflect those of the Republic of Slovenia, the Ministry of Higher Education, the European Union, or the European Commission. Neither the Republic of Slovenia, the Ministry of Higher Education, Science, and Innovation, the European Union, nor the European Commission can be held responsible for them.

Data Availability Statement

The original contributions presented in this study are included in the article/Supplementary Material. Further inquiries can be directed to the corresponding author.

Conflicts of Interest

The authors declare no conflicts of interest.

References

  1. Li, Y.; Hu, Y.; Chu, J.; Yao, Y.; Lv, H.; Xu, C. Investigation of renewable methanol production from CO2 hydrogeneration based on spectral splitting and heat integration. Fuel 2023, 352, 129041. [Google Scholar] [CrossRef]
  2. Van-Dal, É.S.; Bouallou, C. Design and simulation of a methanol production plant from CO2 hydrogenation. J. Clean. Prod. 2013, 57, 38–45. [Google Scholar] [CrossRef]
  3. Zhang, Z.; Borhani, T.N.G.; El-Naas, M.H. Carbon Capture. In Exergetic, Energetic and Environmental Dimensions; Elsevier: Amsterdam, The Netherlands, 2018; pp. 997–1016. [Google Scholar] [CrossRef]
  4. Leung, D.Y.C.; Caramanna, G.; Maroto-Valer, M.M. An overview of current status of carbon dioxide capture and storage technologies. Renew. Sustain. Energy Rev. 2014, 39, 426–443. [Google Scholar] [CrossRef]
  5. Mondal, M.K.; Balsora, H.K.; Varshney, P. Progress and trends in CO2 capture/separation technologies: A review. Energy 2012, 46, 431–441. [Google Scholar] [CrossRef]
  6. Blomen, E.; Hendriks, C.; Neele, F. Capture technologies: Improvements and promising developments. Energy Procedia 2009, 1, 1505–1512. [Google Scholar] [CrossRef]
  7. Figueroa, J.D.; Fout, T.; Plasynski, S.; McIlvried, H.; Srivastava, R.D. Advances in CO2 capture technology—The U.S. Department of Energy’s Carbon Sequestration Program. Int. J. Greenh. Gas Control. 2008, 2, 9–20. [Google Scholar] [CrossRef]
  8. Gibbins, J.; Chalmers, H. Carbon capture and storage. Energy Policy 2008, 36, 4317–4322. [Google Scholar] [CrossRef]
  9. Pfaff, I.; Kather, A. Comparative thermodynamic analysis and integration issues of CCS steam power plants based on oxy-combustion with cryogenic or membrane based air separation. Energy Procedia 2009, 1, 495–502. [Google Scholar] [CrossRef]
  10. Rao, A.B.; Rubin, E.S. A Technical, Economic, and Environmental Assessment of Amine-Based CO2 Capture Technology for Power Plant Greenhouse Gas Control. Environ. Sci. Technol. 2002, 36, 4467–4475. [Google Scholar] [CrossRef]
  11. Ma’mun, S.; Dindore, V.Y.; Svendsen, H.F. Kinetics of the Reaction of Carbon Dioxide with Aqueous Solutions of 2-((2-Aminoethyl)amino)ethanol. Ind. Eng. Chem. Res. 2007, 46, 385–394. [Google Scholar] [CrossRef]
  12. Veawab, A.; Aroonwilas, A.; Tontiwachwuthikul, P. CO2 absorption performance of aqueous alkanolamines in packed columns. ACS Div. Fuel Chem. Prepr. 2002, 47, 49–50. [Google Scholar]
  13. Göttlicher, G.; Pruschek, R. Comparison of CO2 removal systems for fossil-fuelled power plant processes. Energy Convers. Manag. 1997, 38, S173–S178. [Google Scholar] [CrossRef]
  14. Rackley, S.A. Membrane separation systems. In Carbon Capture and Storage; Elsevier: Amsterdam, The Netherlands, 2017; pp. 187–225. [Google Scholar] [CrossRef]
  15. Koj, J.C.; Wulf, C.; Zapp, P. Environmental impacts of power-to-X systems—A review of technological and methodological choices in Life Cycle Assessments. Renew. Sustain. Energy Rev. 2019, 112, 865–879. [Google Scholar] [CrossRef]
  16. Ince, A.C.; Colpan, C.O.; Hagen, A.; Serincan, M.F. Modeling and simulation of Power-to-X systems: A review. Fuel 2021, 304, 121354. [Google Scholar] [CrossRef]
  17. Dieterich, V.; Buttler, A.; Hanel, A.; Spliethoff, H.; Fendt, S. Power-to-liquid via synthesis of methanol, DME or Fischer–Tropsch-fuels: A review. Energy Environ. Sci. 2020, 13, 3207–3252. [Google Scholar] [CrossRef]
  18. Buffo, G.; Marocco, P.; Ferrero, D.; Lanzini, A.; Santarelli, M. Power-to-X and power-to-power routes. In Solar Hydrogen Production; Elsevier: Amsterdam, The Netherlands, 2019; pp. 529–557. [Google Scholar] [CrossRef]
  19. Yusuf, M.; Bazli, L.; Alam, M.A.; Masood, F.; Keong, L.K.; Noor, A.; Hellgardt, K.; Abdullah, B. Hydrogen production via natural gas reforming: A comparative study between DRM, SRM and BRM techniques. In Proceedings of the 2021 Third International Sustainability and Resilience Conference: Climate Change IEEE, Sakheer, Bahrain, 15–16 November 2021; pp. 155–158. [Google Scholar] [CrossRef]
  20. Midilli, A.; Kucuk, H.; Topal, M.E.; Akbulut, U.; Dincer, I. A comprehensive review on hydrogen production from coal gasification: Challenges and Opportunities. Int. J. Hydrogen Energy 2021, 46, 25385–25412. [Google Scholar] [CrossRef]
  21. Patlolla, S.R.; Katsu, K.; Sharafian, A.; Wei, K.; Herrera, O.E.; Mérida, W. A review of methane pyrolysis technologies for hydrogen production. Renew. Sustain. Energy Rev. 2023, 181, 113323. [Google Scholar] [CrossRef]
  22. Zoulias, E.; Varkaraki, E.; Lymberopoulos, N.; Christodoulou, C.; Karagiorgis, G. A Review on Water Electrolysis. Cyprus J. Sci. Technol. 2004, 4, 41–71. [Google Scholar]
  23. Yue, M.; Lambert, H.; Pahon, E.; Roche, R.; Jemei, S.; Hissel, D. Hydrogen energy systems: A critical review of technologies, applications, trends and challenges. Renew. Sustain. Energy Rev. 2021, 146, 111180. [Google Scholar] [CrossRef]
  24. Shiva Kumar, S.; Lim, H. An overview of water electrolysis technologies for green hydrogen production. Energy Rep. 2022, 8, 13793–13813. [Google Scholar] [CrossRef]
  25. Shiva Kumar, S.; Himabindu, V. Hydrogen production by PEM water electrolysis—A review. Mater. Sci. Energy Technol. 2019, 2, 442–454. [Google Scholar] [CrossRef]
  26. Henkensmeier, D.; Najibah, M.; Harms, C.; Žitka, J.; Hnát, J.; Bouzek, K. Overview: State-of-the Art Commercial Membranes for Anion Exchange Membrane Water Electrolysis. J. Electrochem. Energy Convers. Storage 2021, 18, 024001. [Google Scholar] [CrossRef]
  27. Hauch, A.; Küngas, R.; Blennow, P.; Hansen, A.B.; Hansen, J.B.; Mathiesen, B.V.; Mogensen, M.B. Recent advances in solid oxide cell technology for electrolysis. Science 2020, 370, eaba6118. [Google Scholar] [CrossRef] [PubMed]
  28. Varone, A.; Ferrari, M. Power to liquid and power to gas: An option for the German Energiewende. Renew. Sustain. Energy Rev. 2015, 45, 207–218. [Google Scholar] [CrossRef]
  29. Dell’Aversano, S.; Villante, C.; Gallucci, K.; Vanga, G.; Di Giuliano, A. E-Fuels: A Comprehensive Review of the Most Promising Technological Alternatives towards an Energy Transition. Energies 2024, 17, 3995. [Google Scholar] [CrossRef]
  30. Zhen, X.; Wang, Y. An overview of methanol as an internal combustion engine fuel. Renew. Sustain. Energy Rev. 2015, 52, 477–493. [Google Scholar] [CrossRef]
  31. Wasmus, S.; Küver, A. Methanol oxidation and direct methanol fuel cells: A selective review. J. Electroanal. Chem. 1999, 461, 14–31. [Google Scholar] [CrossRef]
  32. Malik, M.I.; Abatzoglou, N.; Achouri, I.E. Methanol to Formaldehyde: An Overview of Surface Studies and Performance of an Iron Molybdate Catalyst. Catalysts 2021, 11, 893. [Google Scholar] [CrossRef]
  33. Qian, Q.; Zhang, J.; Cui, M.; Han, B. Synthesis of acetic acid via methanol hydrocarboxylation with CO2 and H2. Nat. Commun. 2016, 7, 11481. [Google Scholar] [CrossRef]
  34. Adeoye, A.A.; Passarini, F.; De Maron, J.; Tabanelli, T.; Cavani, F.; Cespi, D. Methyl Methacrylate Production Processes: A Comparative Analysis of Alternatives Using the Life Cycle Assessment Methodology. ACS Sustain. Chem. Eng. 2023, 11, 17355–17370. [Google Scholar] [CrossRef]
  35. Modic, R.; Porschen, J.; Schoengen, A.; Wirges, R. Process for the Production of Dimethyl Terephthalate from P-xylene and Methanol. U.S. Patent 4,642,369, 10 February 1987. [Google Scholar]
  36. Yoshiro Ashina, M.F. Process for Producing Methylamines. U.S. Patent 4,485,261, 27 November 1984. [Google Scholar]
  37. Yandrapu, V.P.; Kanidarapu, N.R. Conceptual Design of Methyl Chloride Production Processes: A Review. Period. Polytech. Chem. Eng. 2022, 66, 341–353. [Google Scholar] [CrossRef]
  38. Maleki, A.; Bahadori, F. Simulation and multi-objective optimization of the dimethyl carbonate production process. Sci. Rep. 2023, 13, 16900. [Google Scholar] [CrossRef] [PubMed]
  39. Kim, S.; Douglas, P.L. Optimisation of Methyl Tert-Butyl-Ether (MTBE) Synthesis Processes using Aspen-Plus. Dev. Chem. Eng. Miner. Process. 2002, 10, 89–103. [Google Scholar] [CrossRef]
  40. Liu, G.; Hagelin-Weaver, H.; Welt, B. A Concise Review of Catalytic Synthesis of Methanol from Synthesis Gas. Waste 2023, 1, 228–248. [Google Scholar] [CrossRef]
  41. Gao, Y.; Wang, M.; Raheem, A.; Wang, F.; Wei, J.; Xu, D.; Song, X.; Bao, W.; Huang, A.; Zhang, S.; et al. Syngas Production from Biomass Gasification: Influences of Feedstock Properties, Reactor Type, and Reaction Parameters. ACS Omega 2023, 8, 31620–31631. [Google Scholar] [CrossRef]
  42. Wernicke, H.-J.; Plass, L.; Schmidt, F. Methanol Generation. In Methanol: The Basic Chemical and Energy Feedstock of the Future; Springer: Berlin/Heidelberg, Germany, 2014; pp. 51–301. [Google Scholar] [CrossRef]
  43. Iaquaniello, G.; Centi, G.; Salladini, A.; Palo, E.; Perathoner, S.; Spadaccini, L. Waste-to-methanol: Process and economics assessment. Bioresour. Technol. 2017, 243, 611–619. [Google Scholar] [CrossRef]
  44. Li, Y.; Nahil, M.A.; Williams, P.T. Hydrogen/Syngas Production from Different Types of Waste Plastics Using a Sacrificial Tire Char Catalyst via Pyrolysis–Catalytic Steam Reforming. Energy Fuels 2023, 37, 6661–6673. [Google Scholar] [CrossRef]
  45. Poto, S.; Vico van Berkel, D.; Gallucci, F.; Fernanda Neira d’Angelo, M. Kinetic modelling of the methanol synthesis from CO2 and H2 over a CuO/CeO2/ZrO2 catalyst: The role of CO2 and CO hydrogenation. Chem. Eng. J. 2022, 435, 134946. [Google Scholar] [CrossRef]
  46. Dimian, A.C.; Bildea, C.S.; Kiss, A.A. Methanol. In Applications in Design and Simulation of Sustainable Chemical Processes; Elsevier: Amsterdam, The Netherlands, 2019; pp. 101–145. [Google Scholar] [CrossRef]
  47. Anicic, B.; Trop, P.; Goricanec, D. Comparison between two methods of methanol production from carbon dioxide. Energy 2014, 77, 279–289. [Google Scholar] [CrossRef]
  48. Mbatha, S.; Everson, R.C.; Musyoka, N.M.; Langmi, H.W.; Lanzini, A.; Brilman, W. Power-to-methanol process: A review of electrolysis, methanol catalysts, kinetics, reactor designs and modelling, process integration, optimisation, and techno-economics. Sustain. Energy Fuels 2021, 5, 3490–3569. [Google Scholar] [CrossRef]
  49. Schwiderowski, P.; Ruland, H.; Muhler, M. Current developments in CO2 hydrogenation towards methanol: A review related to industrial application. Curr. Opin. Green Sustain. Chem. 2022, 38, 100688. [Google Scholar] [CrossRef]
  50. Portha, J.-F.; Parkhomenko, K.; Kobl, K.; Roger, A.-C.; Arab, S.; Commenge, J.-M.; Falk, L. Kinetics of Methanol Synthesis from Carbon Dioxide Hydrogenation over Copper–Zinc Oxide Catalysts. Ind. Eng. Chem. Res. 2017, 56, 13133–13145. [Google Scholar] [CrossRef]
  51. Samiee, L.; GhasemiKafrudi, E. Assessment of different kinetic models of carbon dioxide trans-formation to methanol via hydrogenation, over a Cu/ZnO/Al2O3 catalyst. React. Kinet. Mech. Catal. 2021, 133, 801–823. [Google Scholar] [CrossRef]
  52. Al-Kalbani, H.; Xuan, J.; García, S.; Wang, H. Comparative energetic assessment of methanol production from CO2: Chemical versus electrochemical process. Appl. Energy 2016, 165, 1–13. [Google Scholar] [CrossRef]
  53. Schmidt, O.; Gambhir, A.; Staffell, I.; Hawkes, A.; Nelson, J.; Few, S. Future cost and performance of water electrolysis: An expert elicitation study. Int. J. Hydrogen Energy 2017, 42, 30470–30492. [Google Scholar] [CrossRef]
  54. Madeddu, C.; Errico, M.; Baratti, R. CO2 Capture by Reactive Absorption-Stripping; Springer International Publishing: Cham, Switzerland, 2019. [Google Scholar] [CrossRef]
  55. AspenTech. Rate-Based Model of the CO2 Capture Process by MEA Using Aspen Plus. Available online: http://www.aspentech.com (accessed on 11 December 2023).
  56. Sánchez, M.; Amores, E.; Abad, D.; Rodríguez, L.; Clemente-Jul, C. Aspen Plus model of an alkaline electrolysis system for hydrogen production. Int. J. Hydrogen Energy 2020, 45, 3916–3929. [Google Scholar] [CrossRef]
  57. Ulleberg, O. Modeling of advanced alkaline electrolyzers: A system simulation approach. Int. J. Hydrogen Energy 2003, 28, 21–33. [Google Scholar] [CrossRef]
  58. Graaf, G.H.; Scholtens, H.; Stamhuis, E.J.; Beenackers, A.A.C.M. Intra-particle diffusion limitations in low-pressure methanol synthesis. Chem. Eng. Sci. 1990, 45, 773–783. [Google Scholar] [CrossRef]
  59. Rahimpour, M.R.; Arab Aboosadi, Z.; Jahanmiri, A.H. Synthesis gas production in a novel hydrogen and oxygen perm-selective membranes tri-reformer for methanol production. J. Nat. Gas Sci. Eng. 2012, 9, 149–159. [Google Scholar] [CrossRef]
  60. Santos, M.F.; Bresciani, A.E.; Ferreira, N.L.; Bassani, G.S.; Alves, R.M.B. Carbon dioxide conversion via reverse water-gas shift reaction: Reactor design. J. Environ. Manag. 2023, 345, 118822. [Google Scholar] [CrossRef]
  61. Esmaili, P.; Dincer, I.; Naterer, G.F. Development and analysis of an integrated photovoltaic system for hydrogen and methanol production. Int. J. Hydrogen Energy 2015, 40, 11140–11153. [Google Scholar] [CrossRef]
  62. Sollai, S.; Porcu, A.; Tola, V.; Ferrara, F.; Pettinau, A. Renewable methanol production from green hydrogen and captured CO2: A techno-economic assessment. J. CO2 Util. 2023, 68, 102345. [Google Scholar] [CrossRef]
Figure 1. Process flowsheet diagram of the CO2 capture process in Aspen Plus.
Processes 12 02843 g001
Figure 2. Process flowsheet of alkaline water electrolysis in Aspen Plus.
Processes 12 02843 g002
Figure 3. Part of the flowsheet diagram of direct methanol synthesis, where the compression of input raw material takes place.
Processes 12 02843 g003
Figure 4. Part of the process diagram for the direct methanol synthesis, where the synthesis of methanol and its separation take place.
Processes 12 02843 g004
Figure 5. Part of the process flowsheet for two-step methanol synthesis, where the compression of feedstock and the RWGS reaction takes place.
Processes 12 02843 g005
Figure 6. Part of the process flowsheet for two-step methanol synthesis, where methanol synthesis and its separation occurs.
Processes 12 02843 g006
Figure 7. Graph of methanol production dependence on molar H2 feed in direct and two-step methanol synthesis.
Processes 12 02843 g007
Figure 8. Graph of the dependence of the reactor inlet molar fractions on molar H2 feed in direct methanol synthesis.
Processes 12 02843 g008
Figure 9. Graph of the dependence of the reactor inlet molar fractions on molar H2 feed in two-step methanol synthesis.
Processes 12 02843 g009
Figure 10. Graph of the dependence of methanol production on reactor temperature in direct and two-step methanol synthesis.
Processes 12 02843 g010
Table 1. Reactions of electrolysis in acidic and alkaline conditions [24].
Acidic ConditionsAlkaline Conditions
AnodeH2O → 1/2O2 + 2H+ + 2e2OH → 1/2O2 + H2O + 2e
Cathode2H+ + 2e → H22H2O + 2e → H2 + 2OH
Table 2. Specification of the feed solution.
VariableValue
F [kmol/h]16,560
T [K]313.15
p [bar]1
xCO20.14
xH2O0.07
xN20.79
Table 3. Operating parameters for the STACK unit.
ParameterValueUnit
Tstack70°C
p6.7bar
P0.65GW
xH2O0.0111/
Table 4. Properties of the input streams STACK-IN and H2ODEFIC.
ParameterValue
Process FlowSTACK-INH2ODEFIC
F [kmol/h]728,3546433
T [°C]7025
p [bar]71
xH2O0.741
xKOH0.260
Table 5. Dimensions and specifications of the methanol synthesis reactor.
ParameterValue
Reactor typeReactor with specified temperature
T [°C]284
p [bar]78
l [m]2
d [m]1
Catalystyes
mCAT [kg]6000
ε0.4
Table 6. Dimensions and specifications for the RWGS reactor.
ParameterValue
Reactor typeReactor with specified temperature
T [°C]750
p [bar]20
l [m]12
d [m]0.1
Catalystyes
mCAT [kg]2.3552
ε0.528
Table 7. Utilities and their prices.
LabelTypePrice
U-1Cooling Water0.21 $/GJ
U-2Electricity0.0775 $/kWh
U-3Low-pressure Steam1.90 $/GJ
U-4Refrigerant 12.74 $/GJ
U-5Medium-pressure Steam2.20 $/GJ
U-6Fire heater4.25 $/GJ
Table 8. Data of key streams in the CO2 capture simulation.
StreamFLUEGASZ5CO2-OUTCO2
F [kmol/h]16,560427821442000
xCO20.1410.4780.9671
Table 9. Required energy and cost of utilities in the CO2 capture simulation.
UtilityRequired Energy [MW]Cost of Utilities [M$/a]
Cold Utility69.20.46
Electricity0.60.41
Σ69.80.87
Table 10. Data of key streams in the water electrolysis simulation.
StreamsSTACK- INH2-OUTH2ODEFICE2H2-PRODH2
F [kmol/h]728,354367,1816433628060296000
xH2O0.74310.728810.04460.00480
xH200.016400.95540.99511
Table 11. Energy requirements and potential savings in the water electrolysis simulation.
UtilityRequired Energy
[MW]
Optimized Energy
Required [MW]
Possible Energy
Savings [%]
Hot utilities650611.85.87
Cold utilities172.4143.222.15
Electricity0.165//
Σ822.47469.28
Table 12. Optimization of utility costs in the simulation of water electrolysis.
UtilityCost of Utilities [M$/a]Optimized Utility
Cost [M$/a]
Possible Monetary
Savings [%]
Hot utilities38.9736.685.88
Cold utilities1.870.9350.44
Electricity0.11//
Σ40.9637.618.18
Table 13. Data of key streams in the direct methanol synthesis simulation.
StreamM11M13M14M19M22METH
F [kmol/h]800089935015399239881983.8
xCO20.250.22290.00130.000300
xCO00.030.05570.000400
xH20.750.74670.1474000
xCH3OH000.39710.49820.49860.9997
Table 14. Energy requirements and potential savings in the direct methanol synthesis simulation.
UtilityRequired Energy
[MW]
Optimized Energy
Required [MW]
Possible Energy
Savings [%]
Hot utilities47.11829.1
Cold utilities75.546.429.1
Electricity25.3//
Σ147.989.739.4
Table 15. Optimization of utility costs in the direct methanol synthesis simulation.
UtilityCost of Utilities [M$/a]Optimized Utility
Cost [M$/a]
Possible Monetary
Savings [%]
Hot utilities5.82.851.5
Cold utilities3.90.4289.1
Electricity17.2//
Σ26.820.423.9
Table 16. Data of key streams in the two-step methanol synthesis simulation.
StreamM9M10M21M22M24M29M32METH
F [kmol/h]36003600716980384059316331571957
xCO20.55560.32480.16310.14580.00100.00040.00020
xCO00.23080.11590.13130.05760.00060.00010
xH20.44440.21370.72100.72250.16290.000900
xCH3OH0000.00040.49080.62890.62890.9998
Table 17. Energy requirements and potential savings in the two-step methanol synthesis simulation.
UtilityRequired Energy
[MW]
Optimized Energy
Required [MW]
Possible Energy
Savings [%]
Hot utilities69.529.457.7
Cold utilities81.441.349.3
Electricity24.1//
Σ17594.845.8
Table 18. Optimization of utility costs in the two-step methanol synthesis simulation.
UtilityCost of Utilities [M$/a]Optimized Utility
Cost [M$/a]
Possible Monetary
Savings [%]
Hot utilities9.74.652.6
Cold utilities30.487.6
Electricity16.4//
Σ2921.326.5
Table 19. Comparison of different parameters for the direct and two-step methanol synthesis processes.
ParameterDirect SynthesisTwo-Step Synthesis
Methanol synthesis [kmol/h]1983.81957
Ratio of methanol produced
[kmol of methanol/kmol of H2]
0.3310.326
Molar ratio [CO2:CO:H2]1:0.1:3.41:0.9:5
Required energy [MW]147.9175
Methanol produced per MW
[kmol of methanol/MW]
13.411.2
Cost of Utilities [M$/a]26.829
Optimized required energy [MW]89.794.8
Optimized Cost of Utilities [M$/a]20.421.3
Optimal H2 feed [kmol/h]59505850
Molar ratio at optimal H2 feed [CO2:CO:H2]1:0.30:3.091:0.90:4.94
Carbon emissions [kg/h]22,72833,367
Carbon emissions after optimization [kg/h]8.93316.576
CatalystCu/ZnO/Al2O3Cu/ZnO/Al2O3 and Ni/MgAl2O4
Table 20. Comparisons of our results with results from other literature.
TypeProcess
Parameters
Catalyst for
Methanol Reactor
Reactor Feed
[molar %]
kmol of Methanol Produced per kmol of H2Reference
Direct284 °C
78 bar
Cu/ZnO/Al2O3CO:2.90
CO2:22.32
H2:74.78
0.331This study
Direct220 °C
50 bar
Cu/ZnO/Al2O3CO2:30
H2:70
0.282Esmaili et al. [61]
Direct250 °C
16 bar
Cu/ZnO/ZrO2CO2:25
H2:75
0.301Anicic et al. [47]
Direct210 °C
65 bar
Cu/Zn/AlCO2:24.2
H2:75.8
0.302Sollai et al. [62]
Two-step284 °C
78 bar
Cu/ZnO/Al2O3CO:13.04
CO2:14.49
H2:72.46
0.326This study
Two-step250 °C
16 bar
Cu/ZnO/ZrO2CO:16.67
CO2:16.67
H2:66.67
0.324Anicic et al. [47]
Disclaimer/Publisher’s Note: The statements, opinions and data contained in all publications are solely those of the individual author(s) and contributor(s) and not of MDPI and/or the editor(s). MDPI and/or the editor(s) disclaim responsibility for any injury to people or property resulting from any ideas, methods, instructions or products referred to in the content.

