Article

Design and Testing of a Bionic Seed Planter Furrow Opener for Gryllulus Jaws Based on the Discrete Element Method (DEM)

1
The College of Engineering and Technology, Jilin Agricultural University, Changchun 130118, China
2
College of Biological and Agricultural Engineering, Jilin University, Changchun 130022, China
*
Author to whom correspondence should be addressed.
Processes 2024, 12(12), 2834; https://doi.org/10.3390/pr12122834
Submission received: 25 September 2024 / Revised: 25 November 2024 / Accepted: 2 December 2024 / Published: 11 December 2024
(This article belongs to the Section AI-Enabled Process Engineering)

Abstract

:
In addition to improving the efficacy of the furrow opener by ensuring consistent seeding depth, the gryllulus jaw geometry curve was integrated into the furrow opener. Soil particles were modeled using the DEM combined with the Hertz–Mindlin with JKR model, and simulation tests were conducted using the DEM corn stover model. Three geometric curves of gryllulus jaws were extracted. The effect of each curve and magnification on the manipulation results was clarified by the simulation test. Subsequently, field trials were conducted to evaluate the stability of the seeding depth of the bionic structure. The experiment showed that the No. 1 structure with a magnification of 1000 was the best, and the stability was 42.10% higher than that of the original structure. The results of this research can provide key structural and simulation parameters for the development of planter furrow openers with both efficient straw crushing and stable sowing depth functions, which is of great significance for the improvement of agricultural machinery.

1. Introduction

Many insects are characterized by strong biting abilities [1,2,3]. Among them, the biting power of gryllulus mainly depends on their strong mouth muscles and large gryllulus jaws. Gryllulus have large gryllulus jaws with good biting and cutting abilities. In view of this, this paper will investigate the bite characteristics of gryllulus from a bionic perspective. The seeding efficiency of the planter directly affects the economic efficiency of the farmer. In the past, researchers have focused mainly on the study of seed exclusion and fertilizer application techniques. For example, Wang et al. investigated the application of a precision sensing and control system in a maize fertilizer applicator, which can achieve high-precision and on-demand fertilizer application [4]. However, the furrow opener is also an important part of the planter [5], which directly affects the quality of sowing. At present, in agricultural operations, the handling of straw and soil often relies on the combined use of double disk openers. However, during the machining process, these openers fall short of effectively breaking up the straw. Typically, openers are in contact with the soil, while straw is usually situated on the surface or within shallow soil layers, and its distribution is rather uneven. Even when the furrow opener can manage to turn some straw into the soil, it merely relocates the straw instead of breaking it into smaller fragments effectively. In the case of straw that is overly long or thick, the furrow opener might only pull or squeeze it without fully pulverizing it. Consequently, the operational effectiveness of the no-till seeding furrow opener is compromised.
The discrete element method (DEM) is a numerical computational method used to compute a large number of particles and is commonly used to simulate soil tillage [6]. It allows the interaction between the tool and the soil to be analyzed from a microscopic point of view. Several studies have demonstrated the successful application of discrete element methods to the modeling of soil–tool interactions [7,8,9,10], obtaining mechanical behavior and motion information of agricultural machinery components, soil, and straw under specific conditions from a microscopic point of view [11,12,13], and the crushing effect under operating conditions [14,15,16,17,18,19]. For example, Liu et al. used a Hertz–Mindlin model with bonded particle contact to develop a two-layer bonded model of straw and a soil model, and conducted experiments using a furrow opener [20]. Zhu et al. modeled and analyzed straw–soil structural interactions using a discrete element model [21]. Thielke et al. modeled the compaction process of agricultural straw using a discrete element method [22]. However, the accuracy of discrete element calculation methods in terms of various contact and mechanical parameters is crucial. This study was carried out for the case of spring straw cover in black soil, which has fewer discrete element parameter studies and lower simulation accuracy.
The aim of this study was to extract the geometric curves of the gryllulus jaws and apply them to a disk furrow opener. The simulation modeling of soil particles was based on Hertz–Mindlin with JKR model and Standard Rolling Friction model, and a discrete elemental model of corn straw based on Hertz–Mindlin with bonding contact model. The effects of different geometric curves and magnifications on the operating effect were verified through simulation tests to determine the optimal structure. Subsequently, field trials were conducted to evaluate the final bionic structure by sowing depth stability. Through these works, the structural and simulation parameters were provided as a basis for the development of a planter furrow opener with efficient straw crushing and stabilized sowing depth functions.

2. Materials and Methods

2.1. Structural Bionics of Gryllulus Jaws

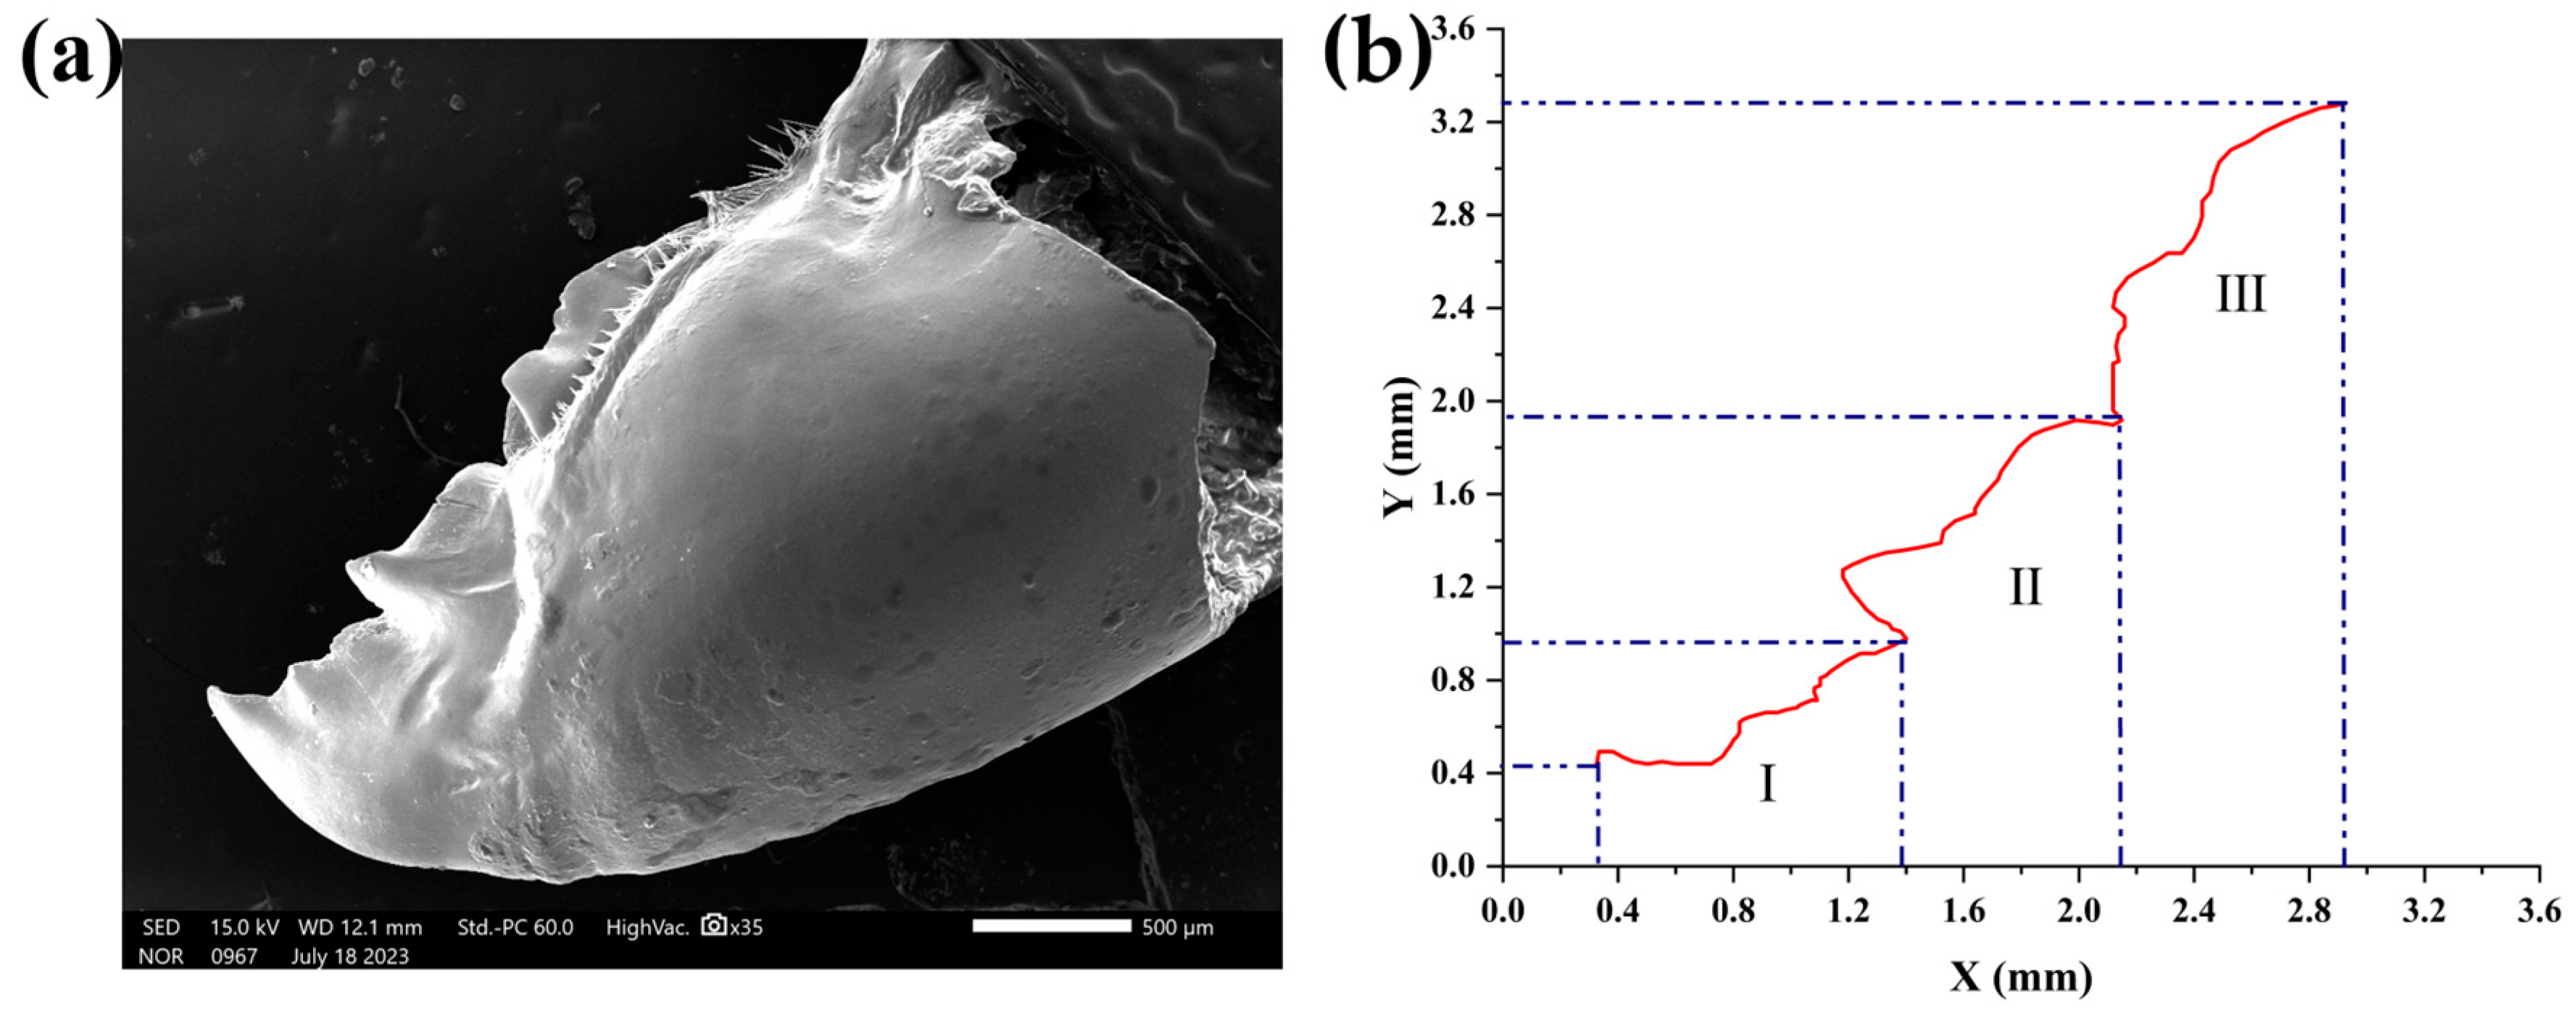
2.1.1. Structural Analysis

In the present study, a structural analysis was carried out on gryllulus jaws, and their morphology was photographed using SEM electron microscopy (Hitachi, Huai’an, China) as shown in Figure 1a. By performing Matlab 2023 image processing on the captured images, we extracted the curves of the gryllulus jaws and segmented them. Figure 1b illustrates the curves. The tooth marks were analyzed in three parts: the first segment is the anterior part of the gryllulus jaws, in which the teeth marks are raised in three places; the second segment is the middle of the gryllulus jaws, with the teeth marks raised in two places; and the third segment is the caudal portion of the gryllulus jaws with wavy teeth marks. The geometric parameters of each part were extracted for further analysis.

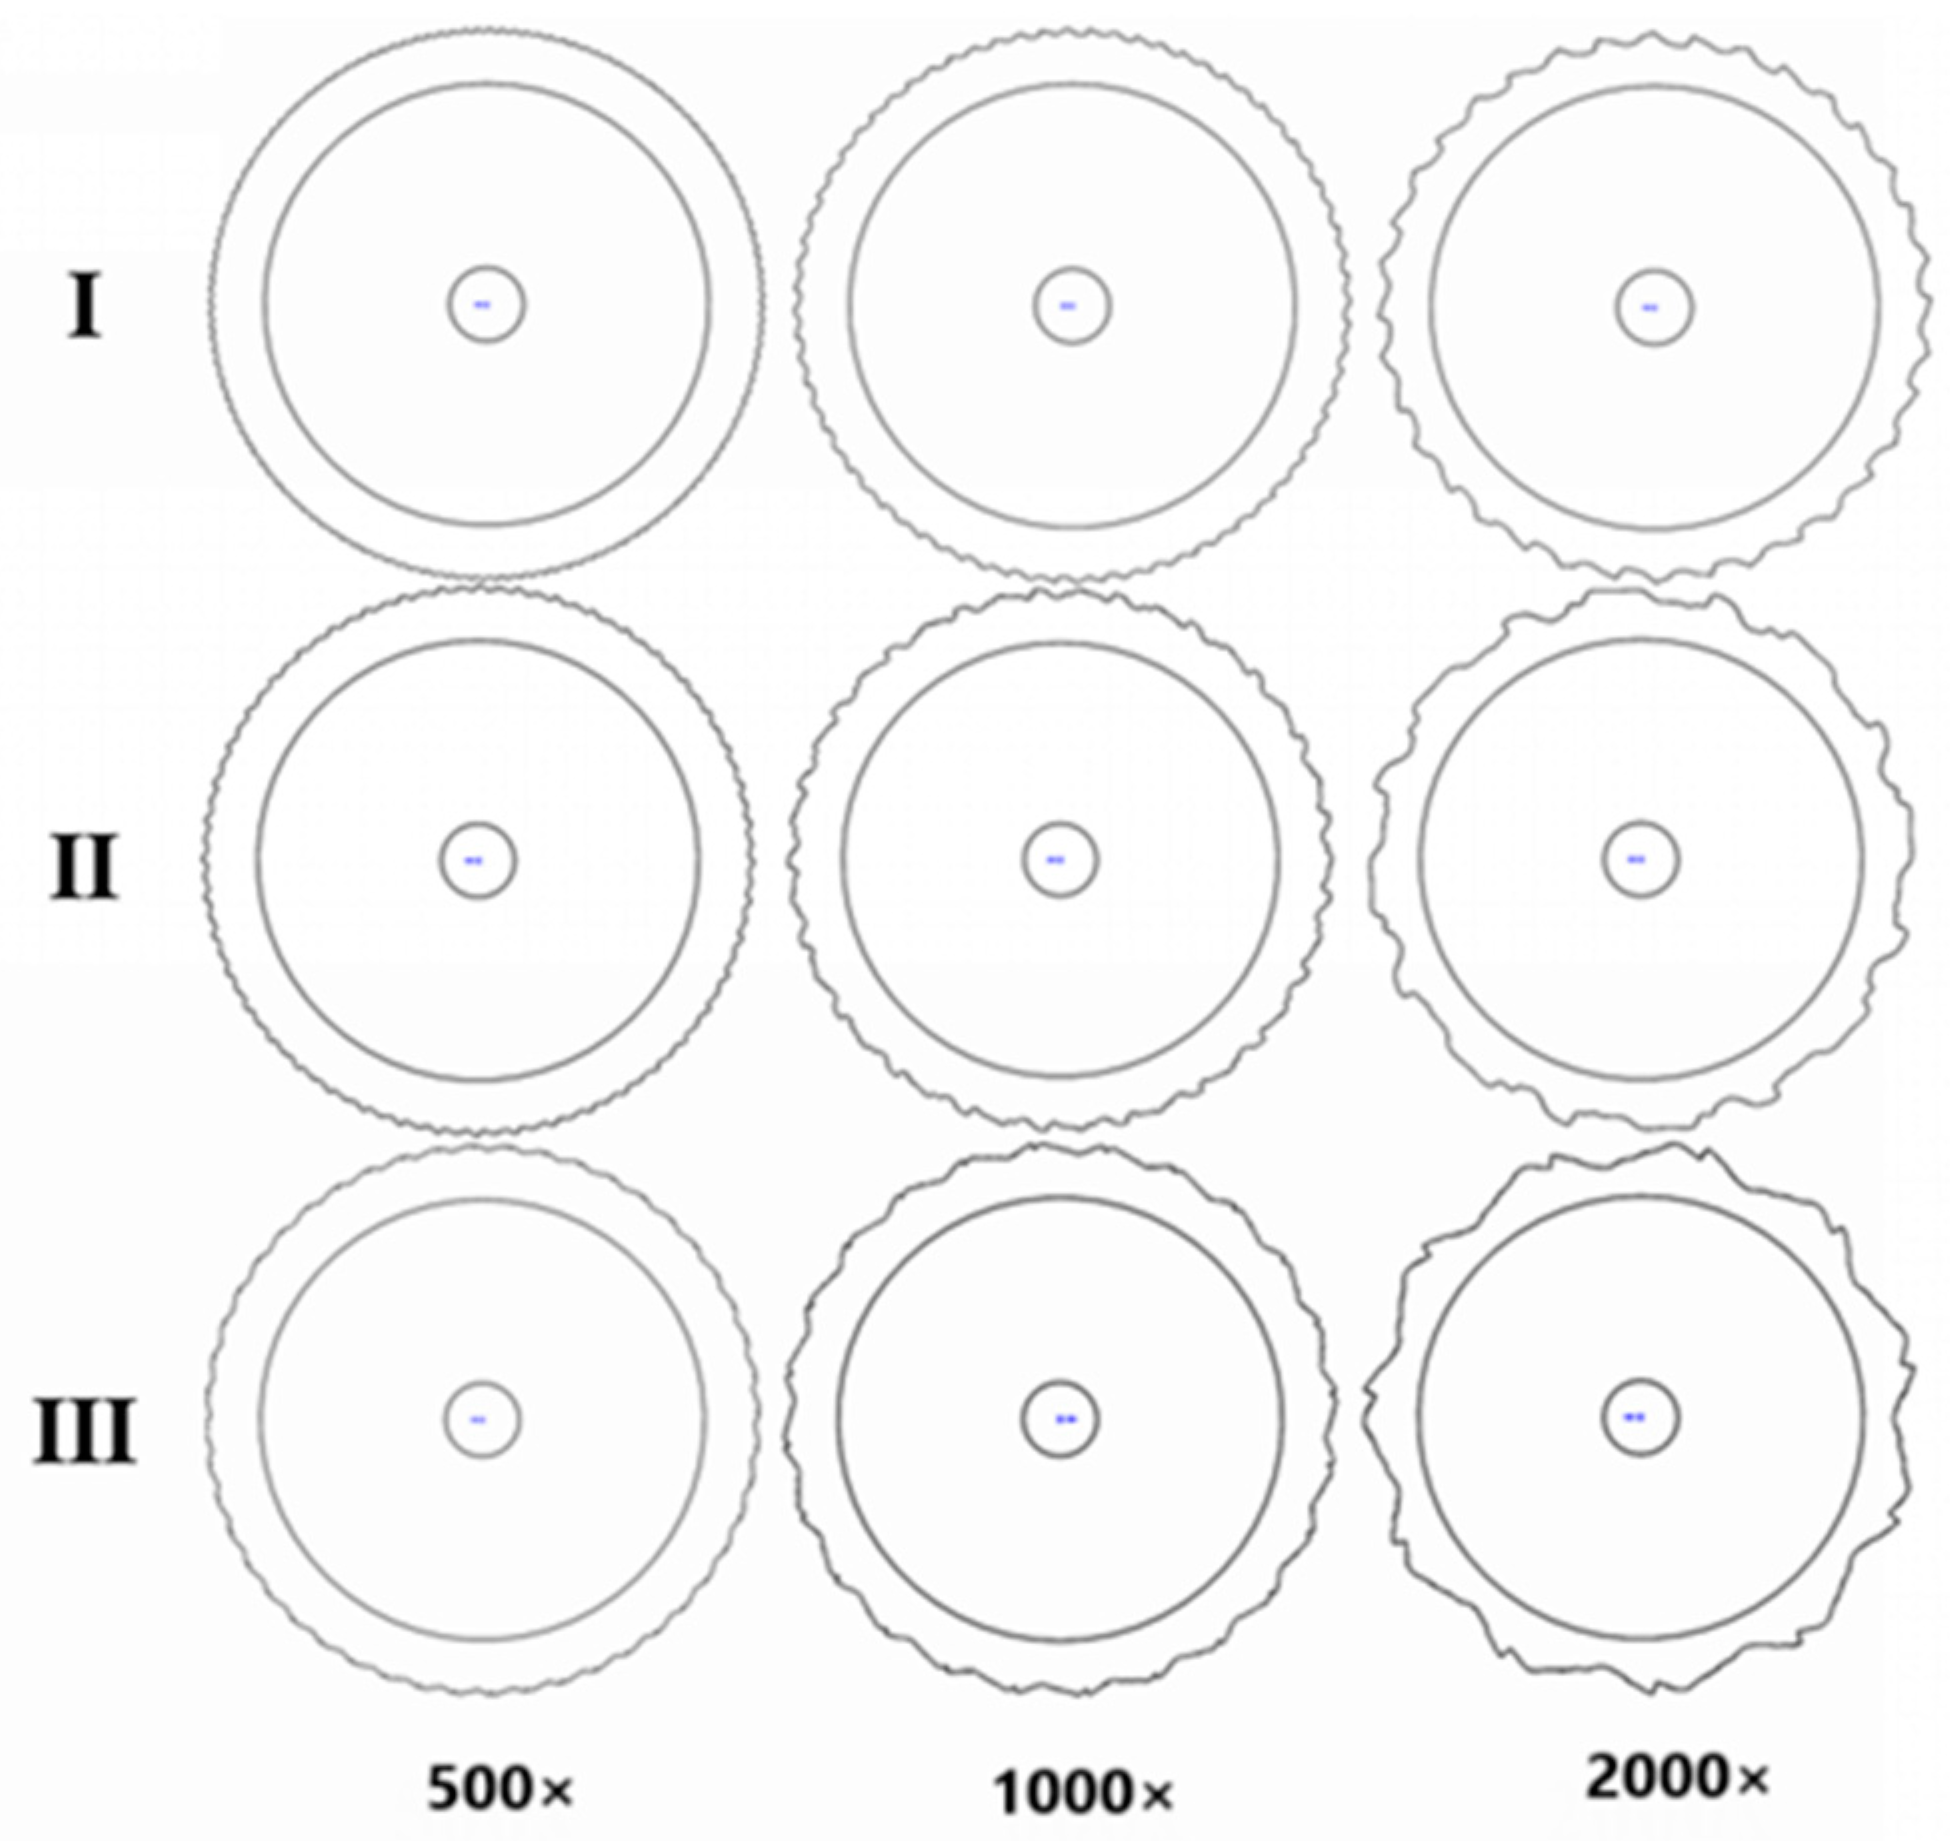
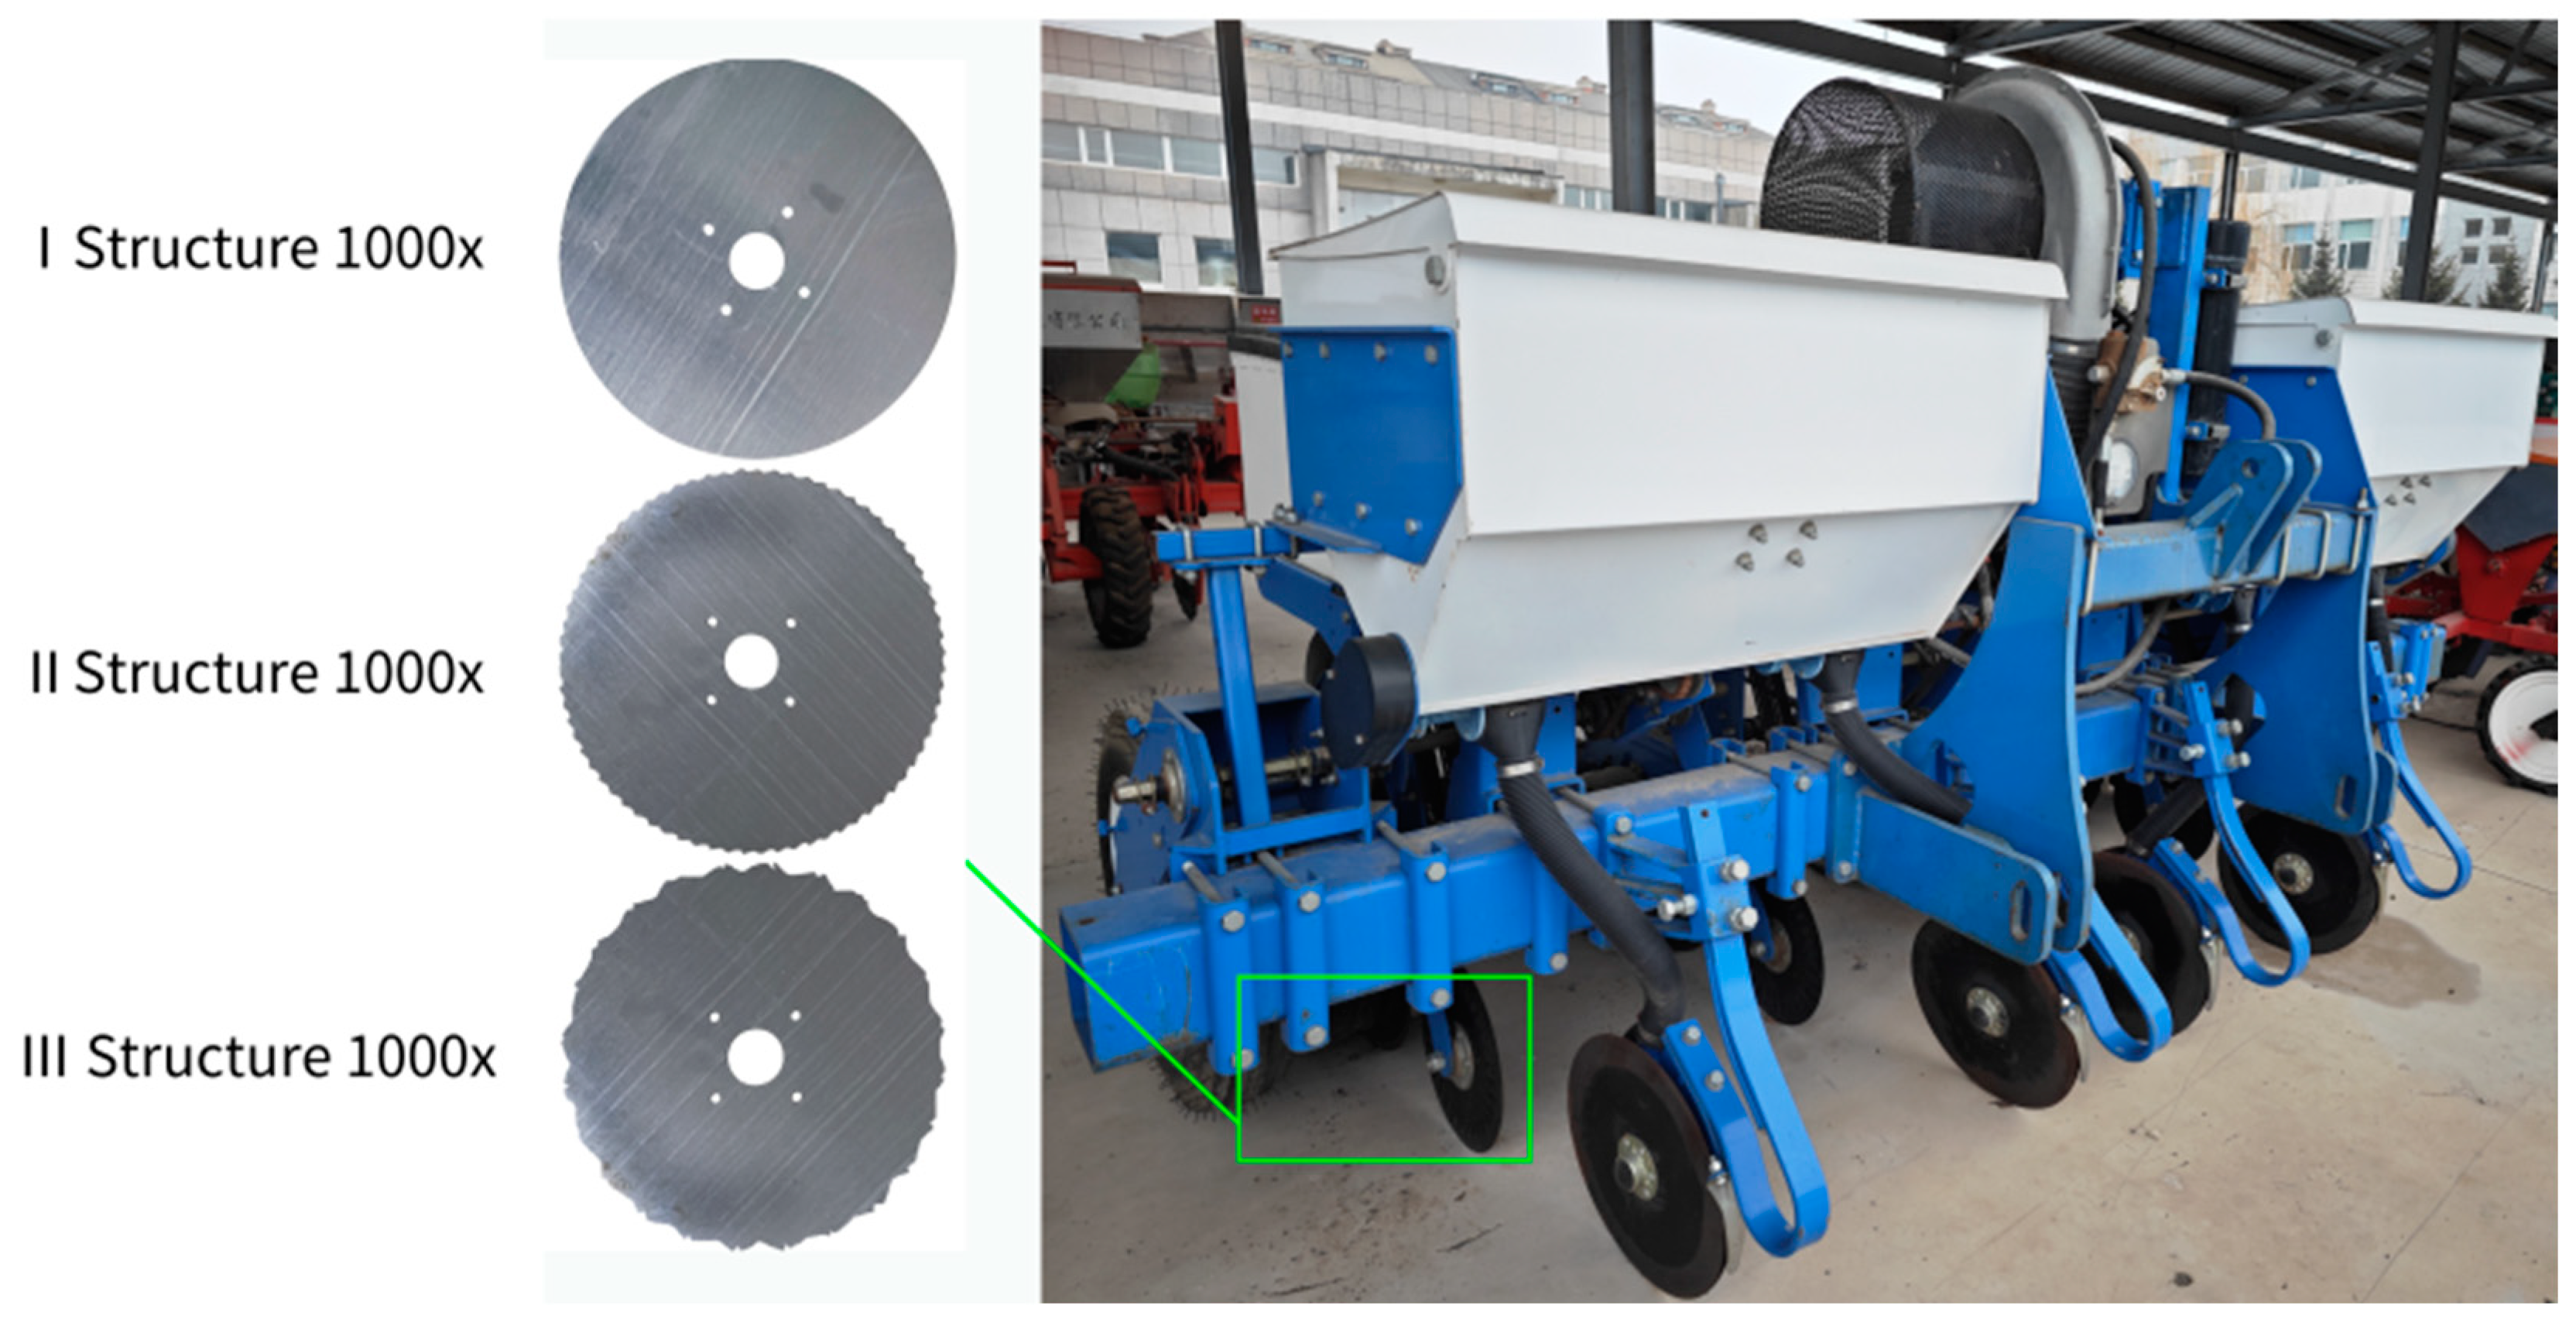
2.1.2. Contour Application

Gryllulus jaws were photographed at a magnification of 500 μm. In order to determine the bionic structure parameters during the working process of the furrow opener and select the optimal bionic structure parameters, this paper applies to its segmentation and amplification ratio. Each tooth mark was selected and magnified 500×, 1000×, and 2000× for comprehensive application. We applied it so that the highest point of the tine mark and the tangential direction were tangent to the furrow opener disk. Obtaining the profile application is shown in Figure 2.

2.2. Discrete Element Modeling of Test Materials

In this part, the EDEM discrete element modeling software version 2022 is adopted in the DEM framework, and the hardware configuration of the participating analog computer is Intel(R) Xeon(R) Gold 6226R CPU @ 2.90 GHz 2.89 GHz. The discrete element modeling of soil particles was carried out using the multi-ball method. The simulated particles were calculated according to mass, and the calculation time based on computer hardware configuration was all calculated using the CPU. The accuracy of the soil particle model is verified by a series of corresponding model parameter testing procedures and validation tests. In addition, the DEM model of multi-ball fragile straw is adopted.

2.2.1. Principles of Discrete Element Modeling

Hertz–Mindlin with JKR (Johnson–Kendall–Roberts) cohesion is a cohesion contact model that accounts for the influence of Vander Waals forces within the contact zone and allows the user to model strongly adhesive systems, such as dry powders or wet materials. In this model, the implementation of normal elastic contact force is based on the Johnson–Kendall–Roberts theory reported in (Johnson, Kendal, and Roberts, 1971) [23].
F J K R = 4 π γ E * a 3 / 2 + 4 E * 3 R * a 3
δ = a 2 R * 4 π γ a E *
Here, FJKR is the normal elastic contact force, E* is the equivalent Young’s modulus, and R* is the equivalent radius defined in the “Hertz–Mindlin (no slip) Contact Model” section, a is the contact radius, γ is the surface energy of the contact particle, and δ is the normal overlap amount [24].
The bonding contact model can be used to bond particles with a finite-sized “glue” bond. This bond can resist tangential and normal movement up to a maximum normal and tangential shear stress, at which point the bond breaks. Thereafter, the particles interact as hard spheres. This model is based on the work of Potyondy and Cundall (Potyondy and Cundall 2004 [24]). This model is particularly useful in modeling concrete and rock structures.
After the bonding bond is created at a certain point in time, we set the bonding force and moment to zero and find the superimposed increment of the bonding force and moment applied at each time step. The expression is given below:
F n = υ n S n A δ t
F t = υ t S t A δ t
M n = ω n S t J δ t
M t = ω t S n J 2 δ t
where Fn is the normal bonding force, N; Ft is the tangential bonding force, N; δt is the time step, s; Mn is the normal moment, N·m; Mt is the tangential moment, N·m; Sn is the normal stiffness, N/m3; St is the tangential stiffness, N/m3; υn is the normal velocity, m/s; υt is the tangential velocity, m/s; ωn is the normal angular velocity, rad/s; ωt is the tangential angular velocity, rad/s; A is the area of the particle contact region, m2, A = π R b 2 ; J is the moment of inertia, m4, J = 0.5 π R b 2 ; and Rb is the radius of the bonding bond, m.
When the normal stress σmax and tangential stress τmax of the bonded bond in the model reaches the critical value, the bonded bond produces damage with the following expression:
σ m a x < F n A + 2 M t J R b
τ m a x < F n A + M n J R b

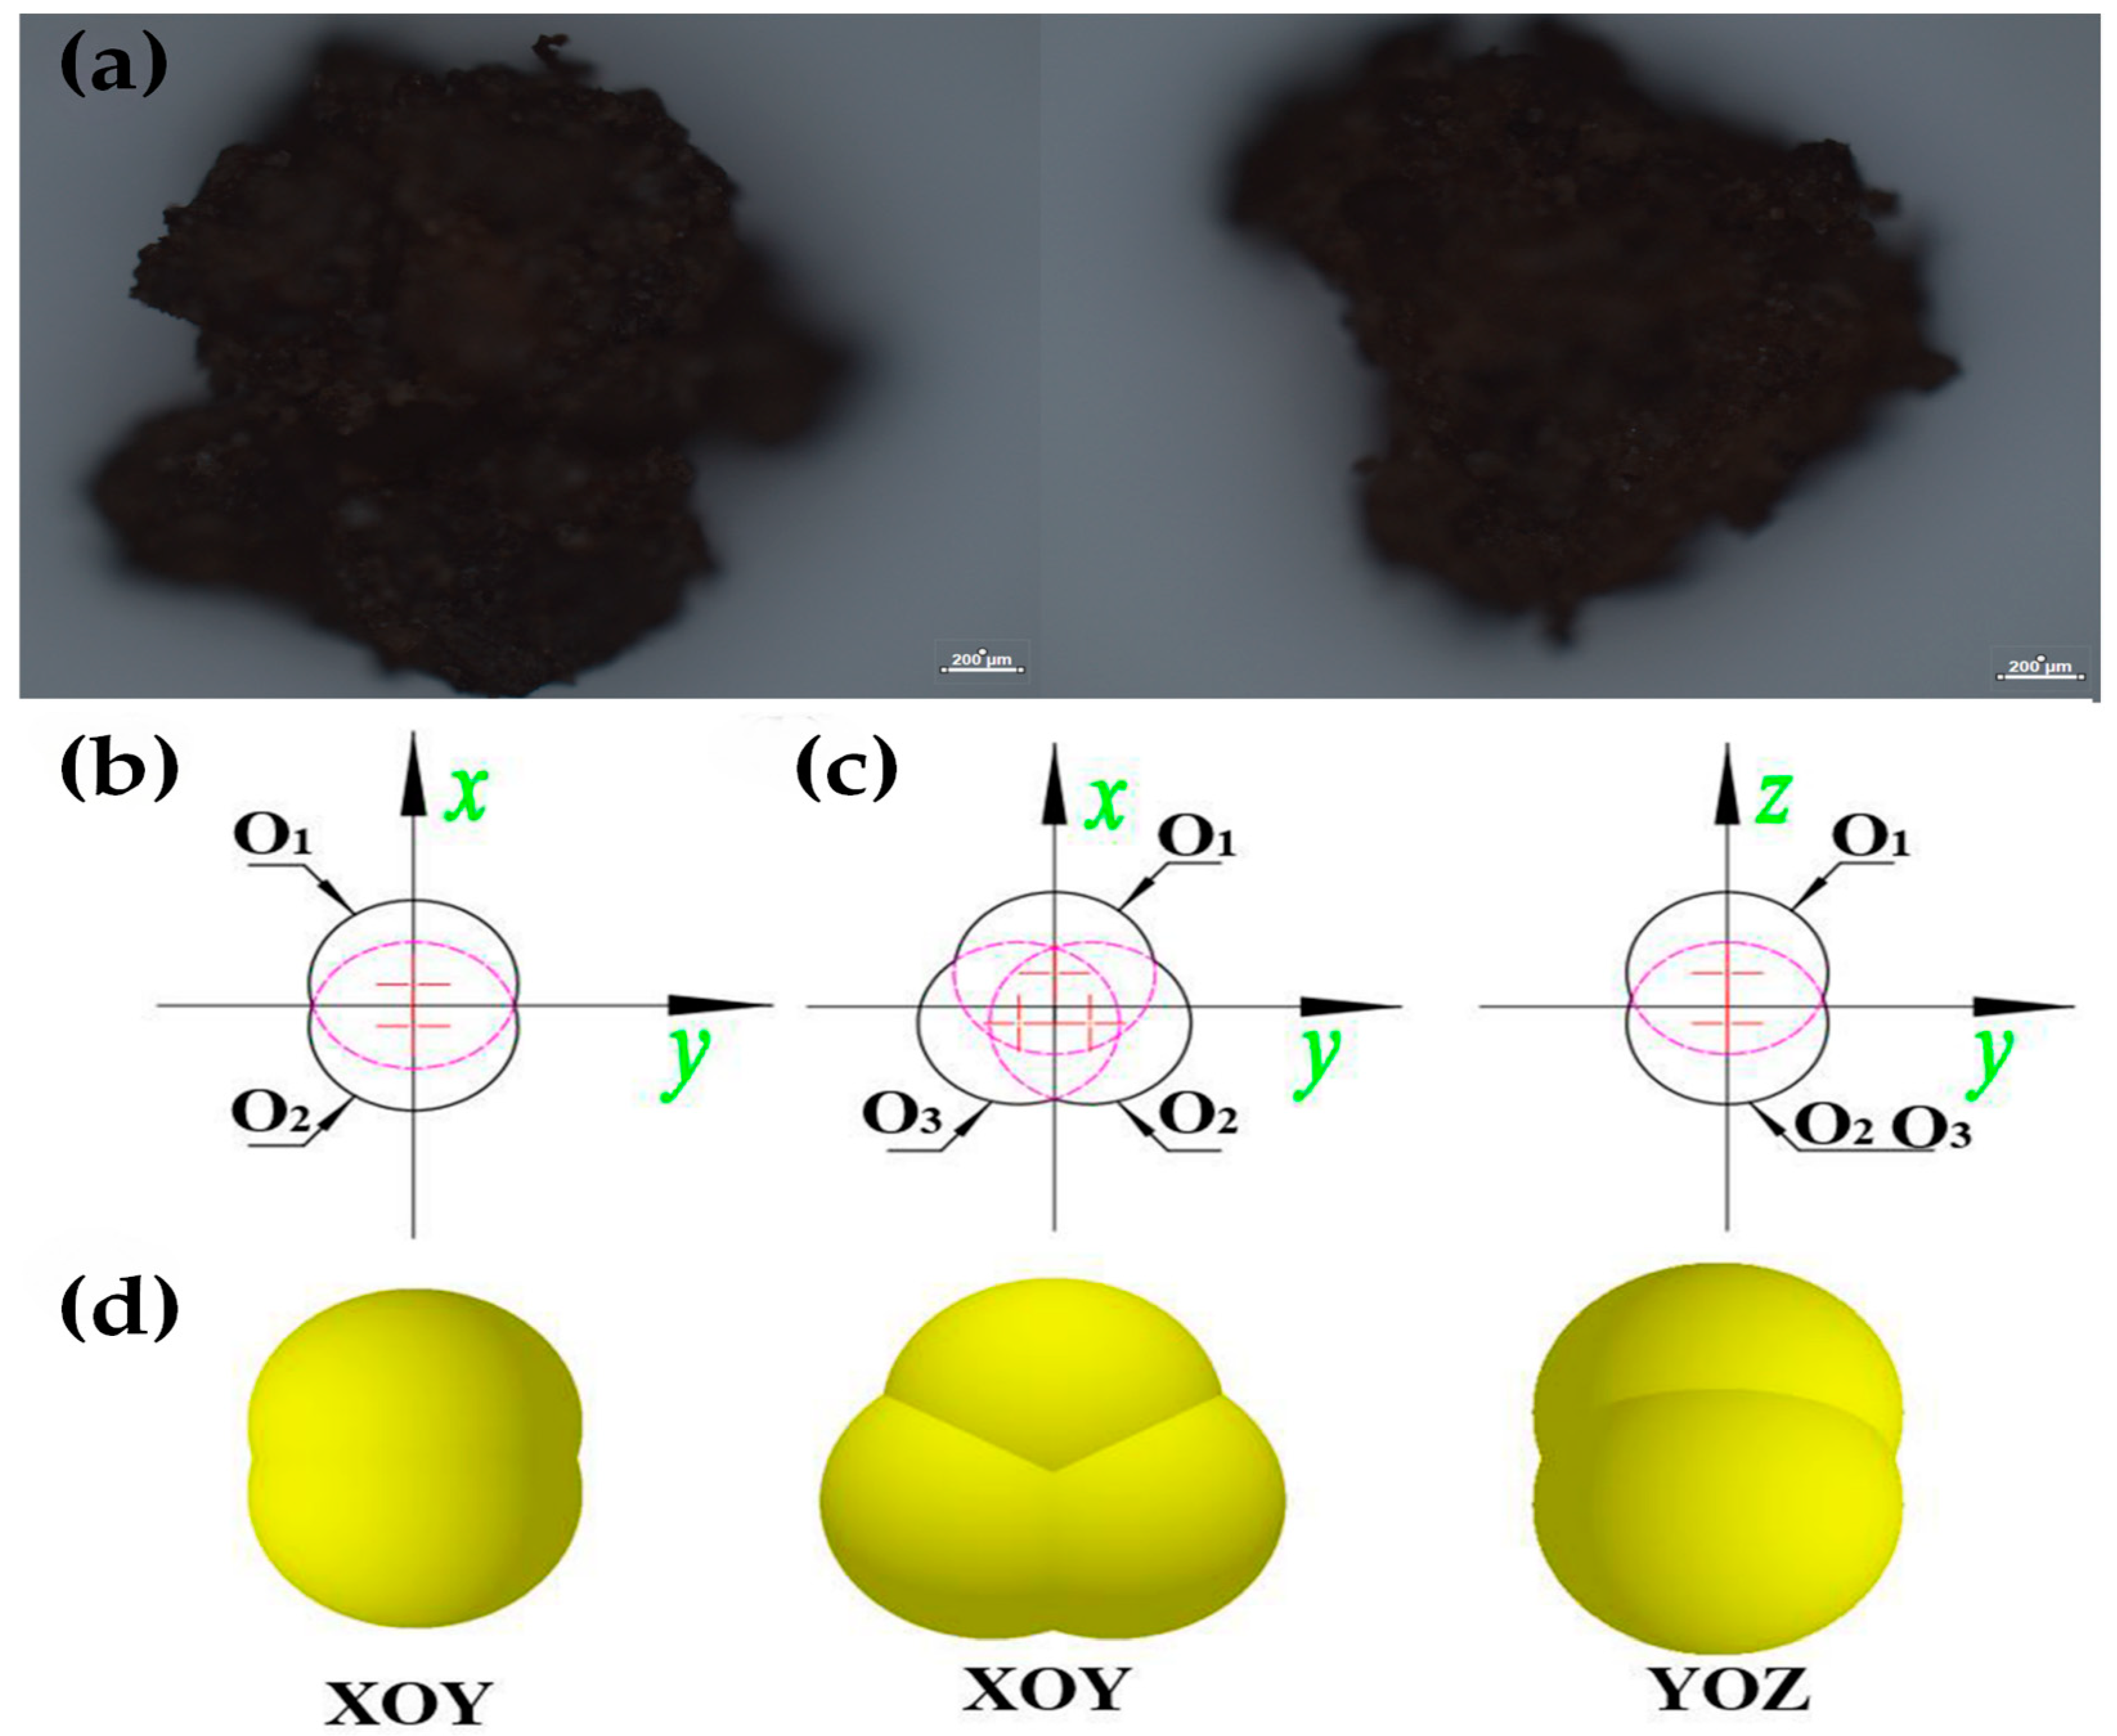
2.2.2. Discrete Element Modeling of Soil Materials

For the trencher operation, the contact between the wet and heavy soil in the spring is an important factor in the quality of the operation of the trencher. The stronger the machine of the furrow opener, the better the furrow opener operates. In order to further determine the structural parameters and optimal parameters of the bionic furrow opener, discrete element modeling is performed in this paper for soil.
It is worth noting that there are capillary forces between the particles of the soil due to the water content. These forces can be centered on friction and adhesion between particles. Therefore, the Hertz–Mindlin with JKR model is used in this paper to express its mechanical characteristics. In this paper, we searched various studies to obtain the basic parameters of black soil. A field soil capacity test was conducted, and the soil moisture content at the time of the test was 18.54%. Soil particle geometric parameter tests were conducted using soil grading sieves to determine the particle size and percentage of soil particles. The intrinsic parameters of the soil were tested. Preliminary tests showed that the intrinsic parameters of the soil were independent of the variable parameters of the particle model, while the contact parameters were highly correlated with these variable parameters. The moisture content of the soil was determined using a halogen moisture meter. The Poisson’s ratio of the soil was selected according to the ASAE standards [4,19]. The density of the soil was measured using the gravimeter method. The modulus of elasticity of the soil was determined by compression test using an electronic universal testing machine [13] as shown in Figure 3b. The static friction coefficients of the solid preservative particles on the outer and inner surfaces and between them and the wall surfaces (e.g., Plexiglas plate and galvanized steel) were measured using the inclined plane method [21,22,24] as shown in Figure 3d. The coefficients of recovery between the soils and between them and galvanized steel sheets were measured using the falling ball test [25] and drop test [26] with a high-speed camera, respectively, as shown in Figure 3c. Due to the non-spherical nature of soil particles, the final rolling friction coefficients are determined in this paper by stacking angle tests and simulation calibration methods [27,28,29,30,31,32,33,34]. The test and simulation processes are shown in Figure 3. Its parameters were finally obtained, as shown in Table 1.
In order to improve the simulation efficiency, the phenomenon of soil particle geometry clumping is concentrated. As shown in Figure 4a, Confocal Laser Scanning Microscope was used to photograph the shape of soil particles. The long particle and spherical particle were selected to build the model.
On the basis of the geometrical and mechanical parameter testing of the soil, in order to improve the simulation accuracy, this paper utilizes the multi-sphere method for soil particle modeling. The 2-sphere models and 3-sphere models were based on soil polygon states. In addition, a normal distribution was based on soil geometry. The multi-sphere model was constructed with 1.2 as the mean and 0.17 as the standard deviation for its population modeling case.
The 2-sphere model structure is shown in Figure 4b. With (0.5, 0, 0) as the center, we created a ball O1 with a radius of 2 mm, and we created a ball O2 symmetrically with the Y-axis, with the center distance of the two balls being 1 mm.
The 3-sphere model structure is shown in Figure 4c. With (0, 0, 0) as the center, we created a ball O1 with a radius of 2 mm; with (−0.71, 0.41, 0) as the center, we created a ball O2 with a radius of 2 mm; and with the X-axis symmetry of the ball O2, we created a ball O3, with the center distance between the two balls being 0.82 mm.
The final obtained DEM model of the particles is shown in Figure 4d.
After the corresponding particle model was established in the EDEM software, the normal distribution was selected, and the change in volume distribution was selected based on the particle size analysis results, where the mean was 0.98, the standard deviation was 0.379, the minimum soil model size ratio was 0.827, and the maximum soil model size ratio was 1.25. Other errors are small and ignored.
After the discrete element particles of the soil were modeled, the Hertz–Mindlin with JKR model and the Standard Rolling Friction model were used as the basis for the DEM parameter modeling analysis. In view of the adhesion of soil particles, the adhesion was verified by means of stacking angle tests, and the parameters of the soil JKR model were determined by means of stacking angle simulation tests. A funnel with a diameter of 200 mm and an outlet diameter of 40 mm was used, and a steel plate was placed 50 mm below it as a contact material. In addition, another steel plate was used to block the outlet, 150 g of soil was added to the funnel, and the plate was removed at a speed of 1 m/s. The soil was then removed from the funnel at a speed of 1 m/s and the plate was removed from the funnel at a speed of 1 m/s. The angle of soil accumulation on the contacting steel plate was determined. Calibration was carried out through simulation experiments to adjust the surface energy between the soil particles, and the specific value of the final test result machine was determined through comparison. The test and simulation processes are shown in Figure 5a.
In addition, the accuracy of surface energy between the soil particles in cohesive interactions was determined by using a tensile tester for volumetric processing, a cone filling test, and a corresponding simulation test. During the test, the cone shown in the figure was poured into the soil by means of a tensile testing machine to determine the pressure values. The same process was carried out through simulation to determine the accuracy of the results. The test and simulation processes are shown in Figure 5b. The surface energy between soil particles was determined to be 0.74 J/m3 after the above rigorous research process.

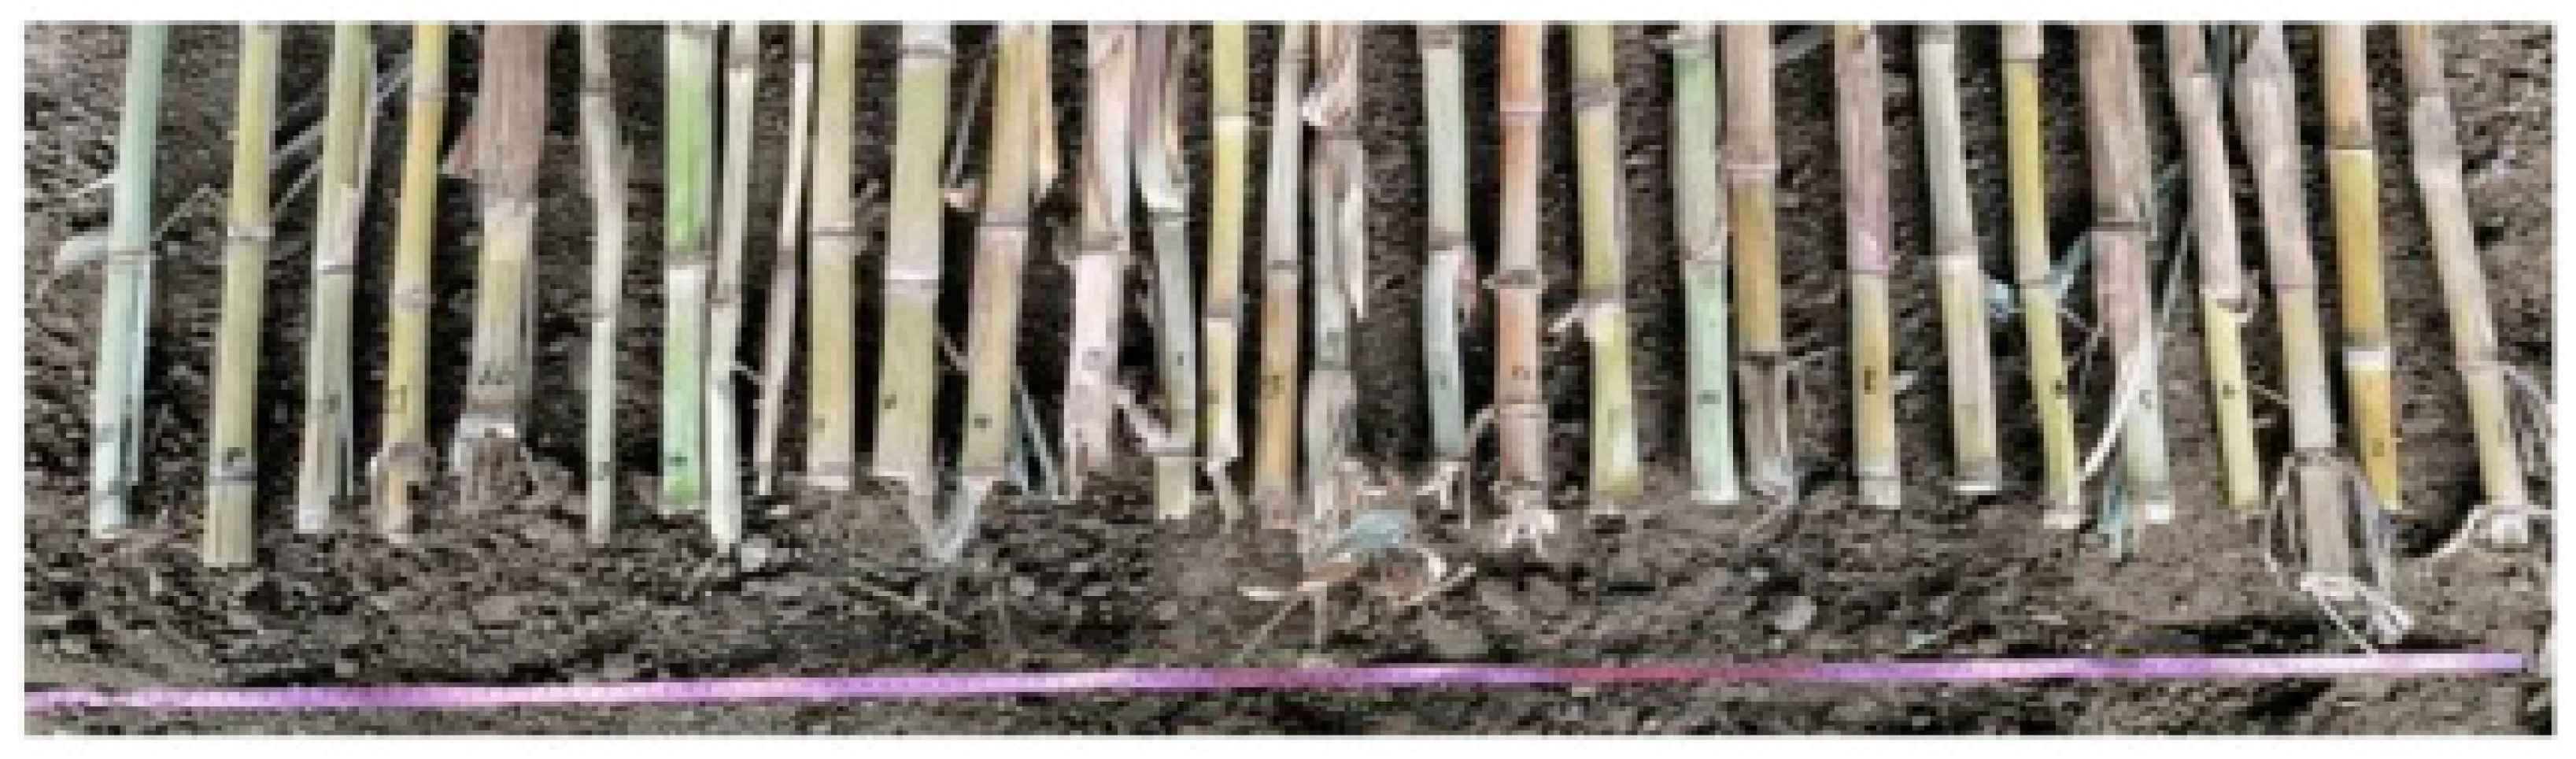
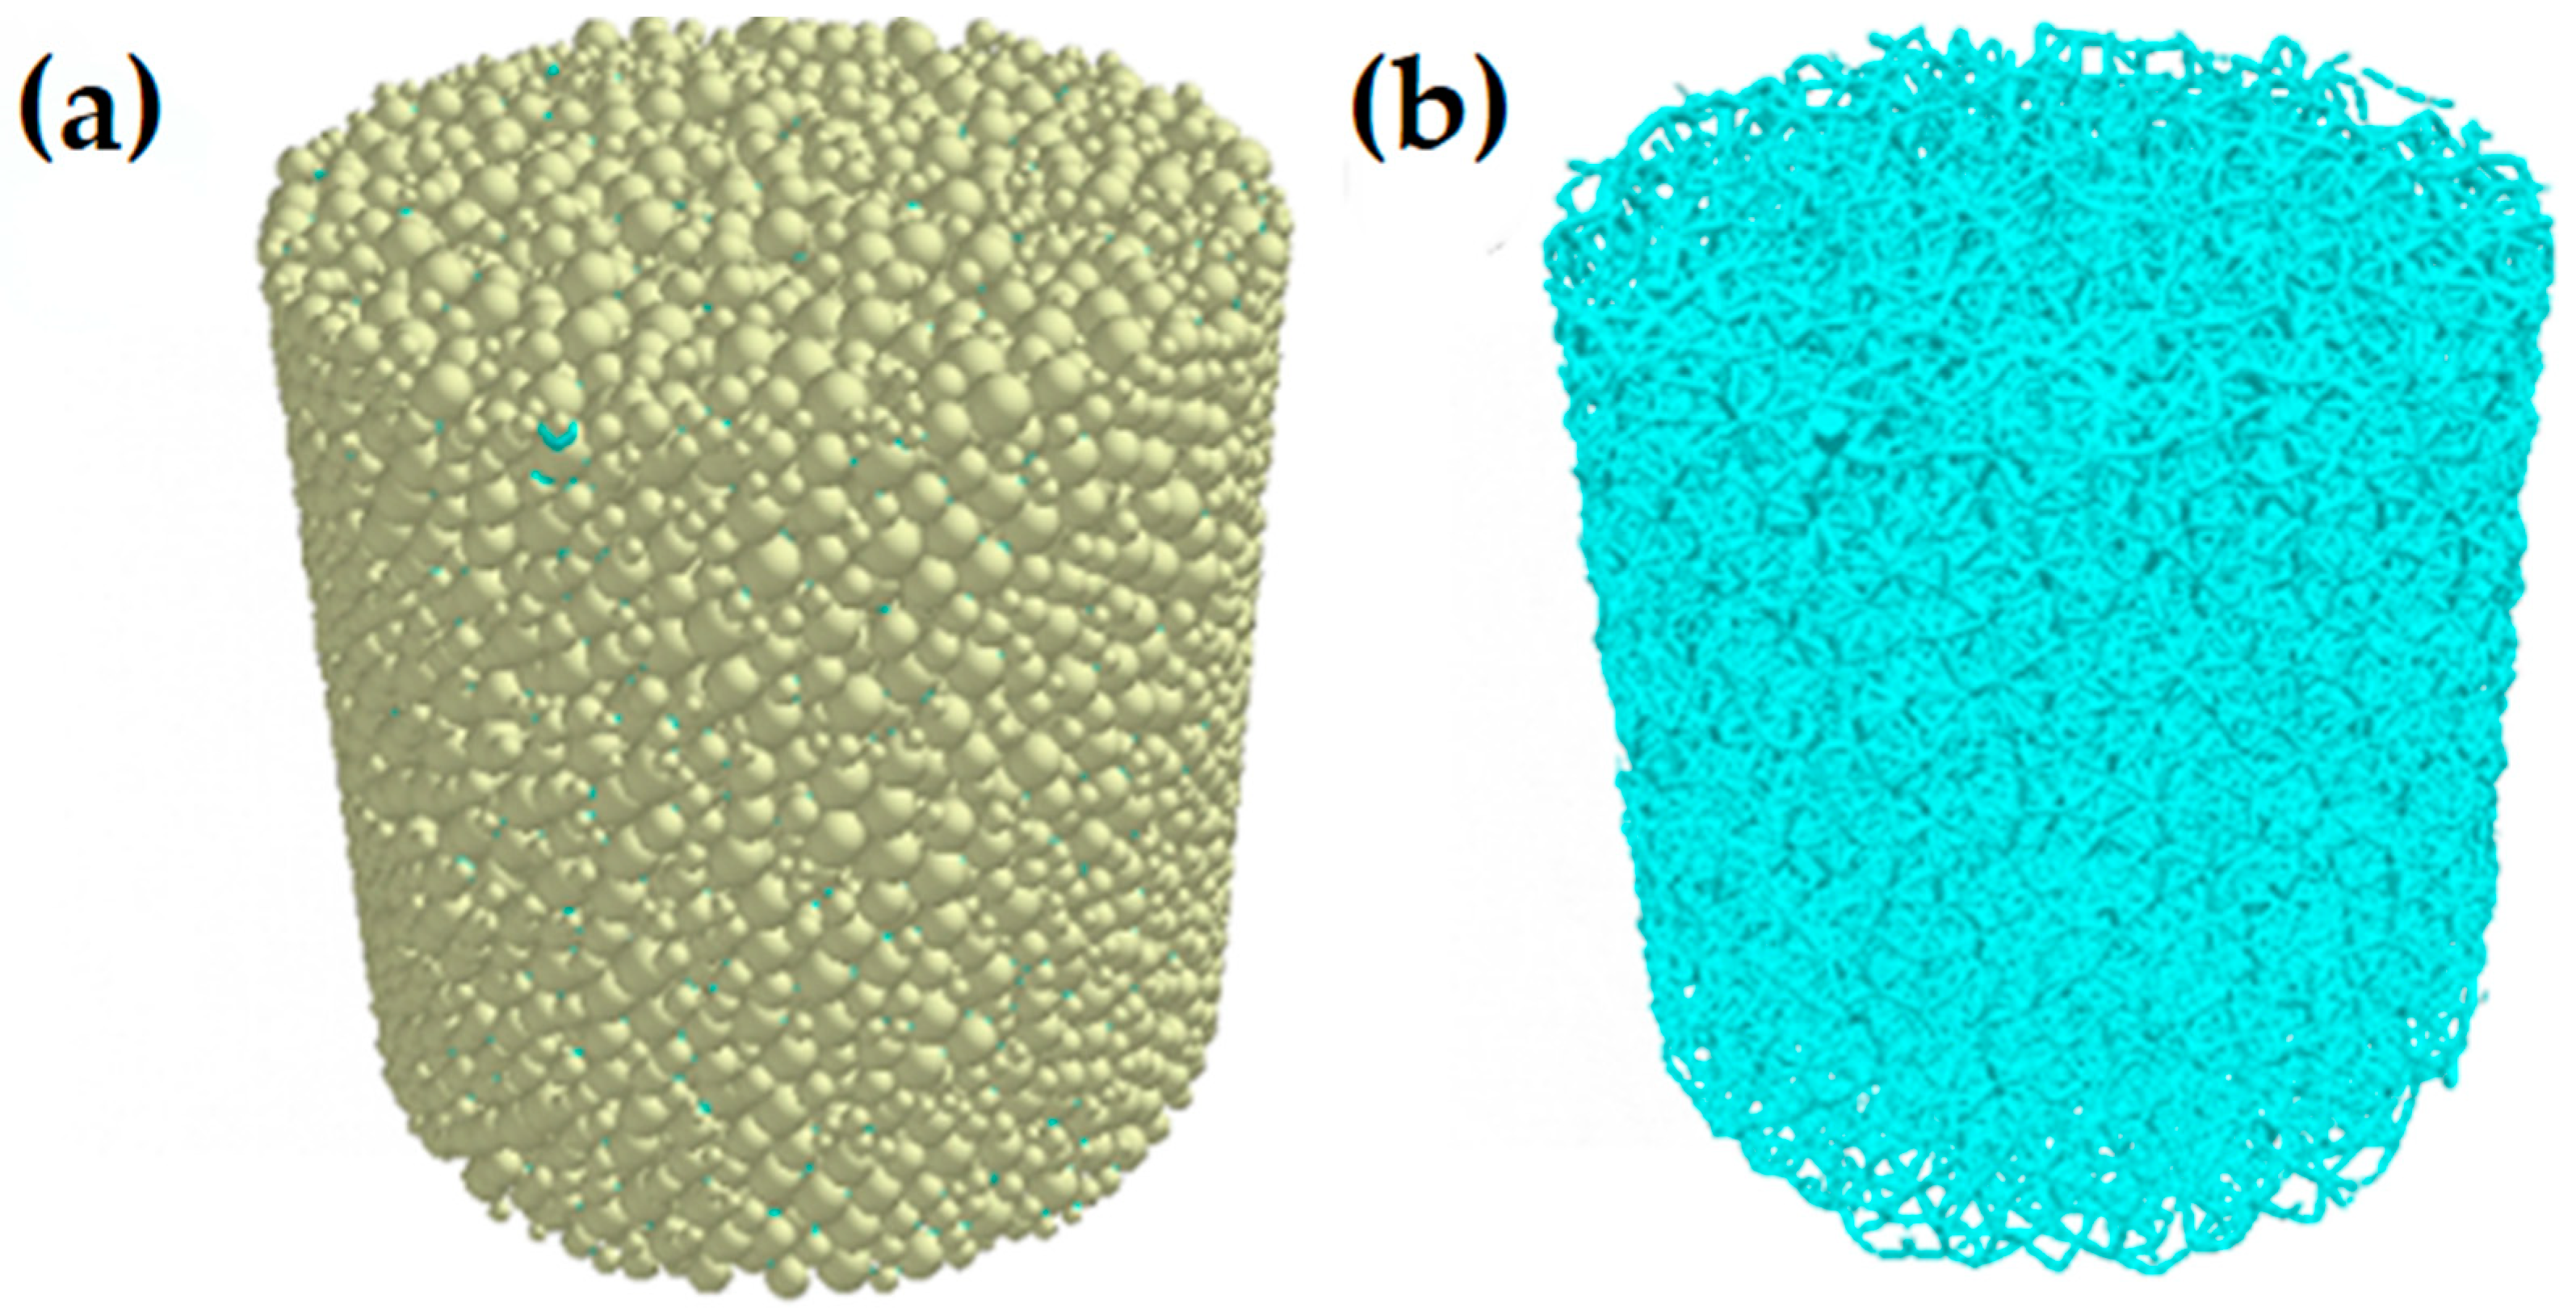
2.2.3. Straw Discrete Element Modeling

The other main object of the trencher’s work is the straw. In order to improve the machining simulation requirements, this paper utilizes the previous research to establish a mechanical model of straw and utilizes bonding for particle bonding to verify the operating effect of the bionic furrow opener. In this paper, 30 stalks were selected as shown in Figure 6. We measured their diameters and heights, and the average diameter and height of the stalks were 40 mm and 50 mm, respectively.
Based on the Hertz–Mindlin with bonding contact model to establish a discrete elemental model of straw, the establishment of geometric dimensions for the diameter of 40 mm, and the height of 50 mm straw model, set the radius of the stacked particles to 1 mm, the establishment of the diameter of 60 mm, the height of 100 particles plant, and the establishment of the inner diameter of 40 mm and height of 50 mm straw solid cavity space in the interior. The particle contact radius was 1 mm, normal stiffness per unit area was 9.361 × 10⁷ N/m3, shear stiffness per unit area was 9.845 × 10⁷ N/m3, Critical Normal Corresponding Force was 1 × 10⁸ Pa, and Critical Tangential Stress was 1 × 10⁸ Pa [23]. The modeling situation is shown in Figure 7. The other exposure parameters are shown in Table 2.

2.3. Optimization of Bionic Furrow Opener Parameters and Validation Test

In order to improve the efficiency of the optimization of the parameters of the bionic furrow opener, this paper analyses the working process of the furrow opener and determines the selection of the main working objects of the furrow opener, namely, soil and straw. We conducted simulation experiments through the EDEM software. EDEM is a computational software specifically designed for simulating and analyzing the behaviors of granular materials (such as plant fibers, soil, powders, sand, gravel, etc.). Based on the DEM, this software is used to solve the physical problems of granular materials and is widely applied in industries like agriculture, mining, and building materials [24,25]. Through the working characteristics of soil-cutting simulation test, soil seeding process simulation, straw-cutting simulation test, and straw seeding process simulation of four parts, after comprehensive screening to determine the final furrow opener structural parameters, we carried out the actual test comparisons to determine the bionic design optimal results.

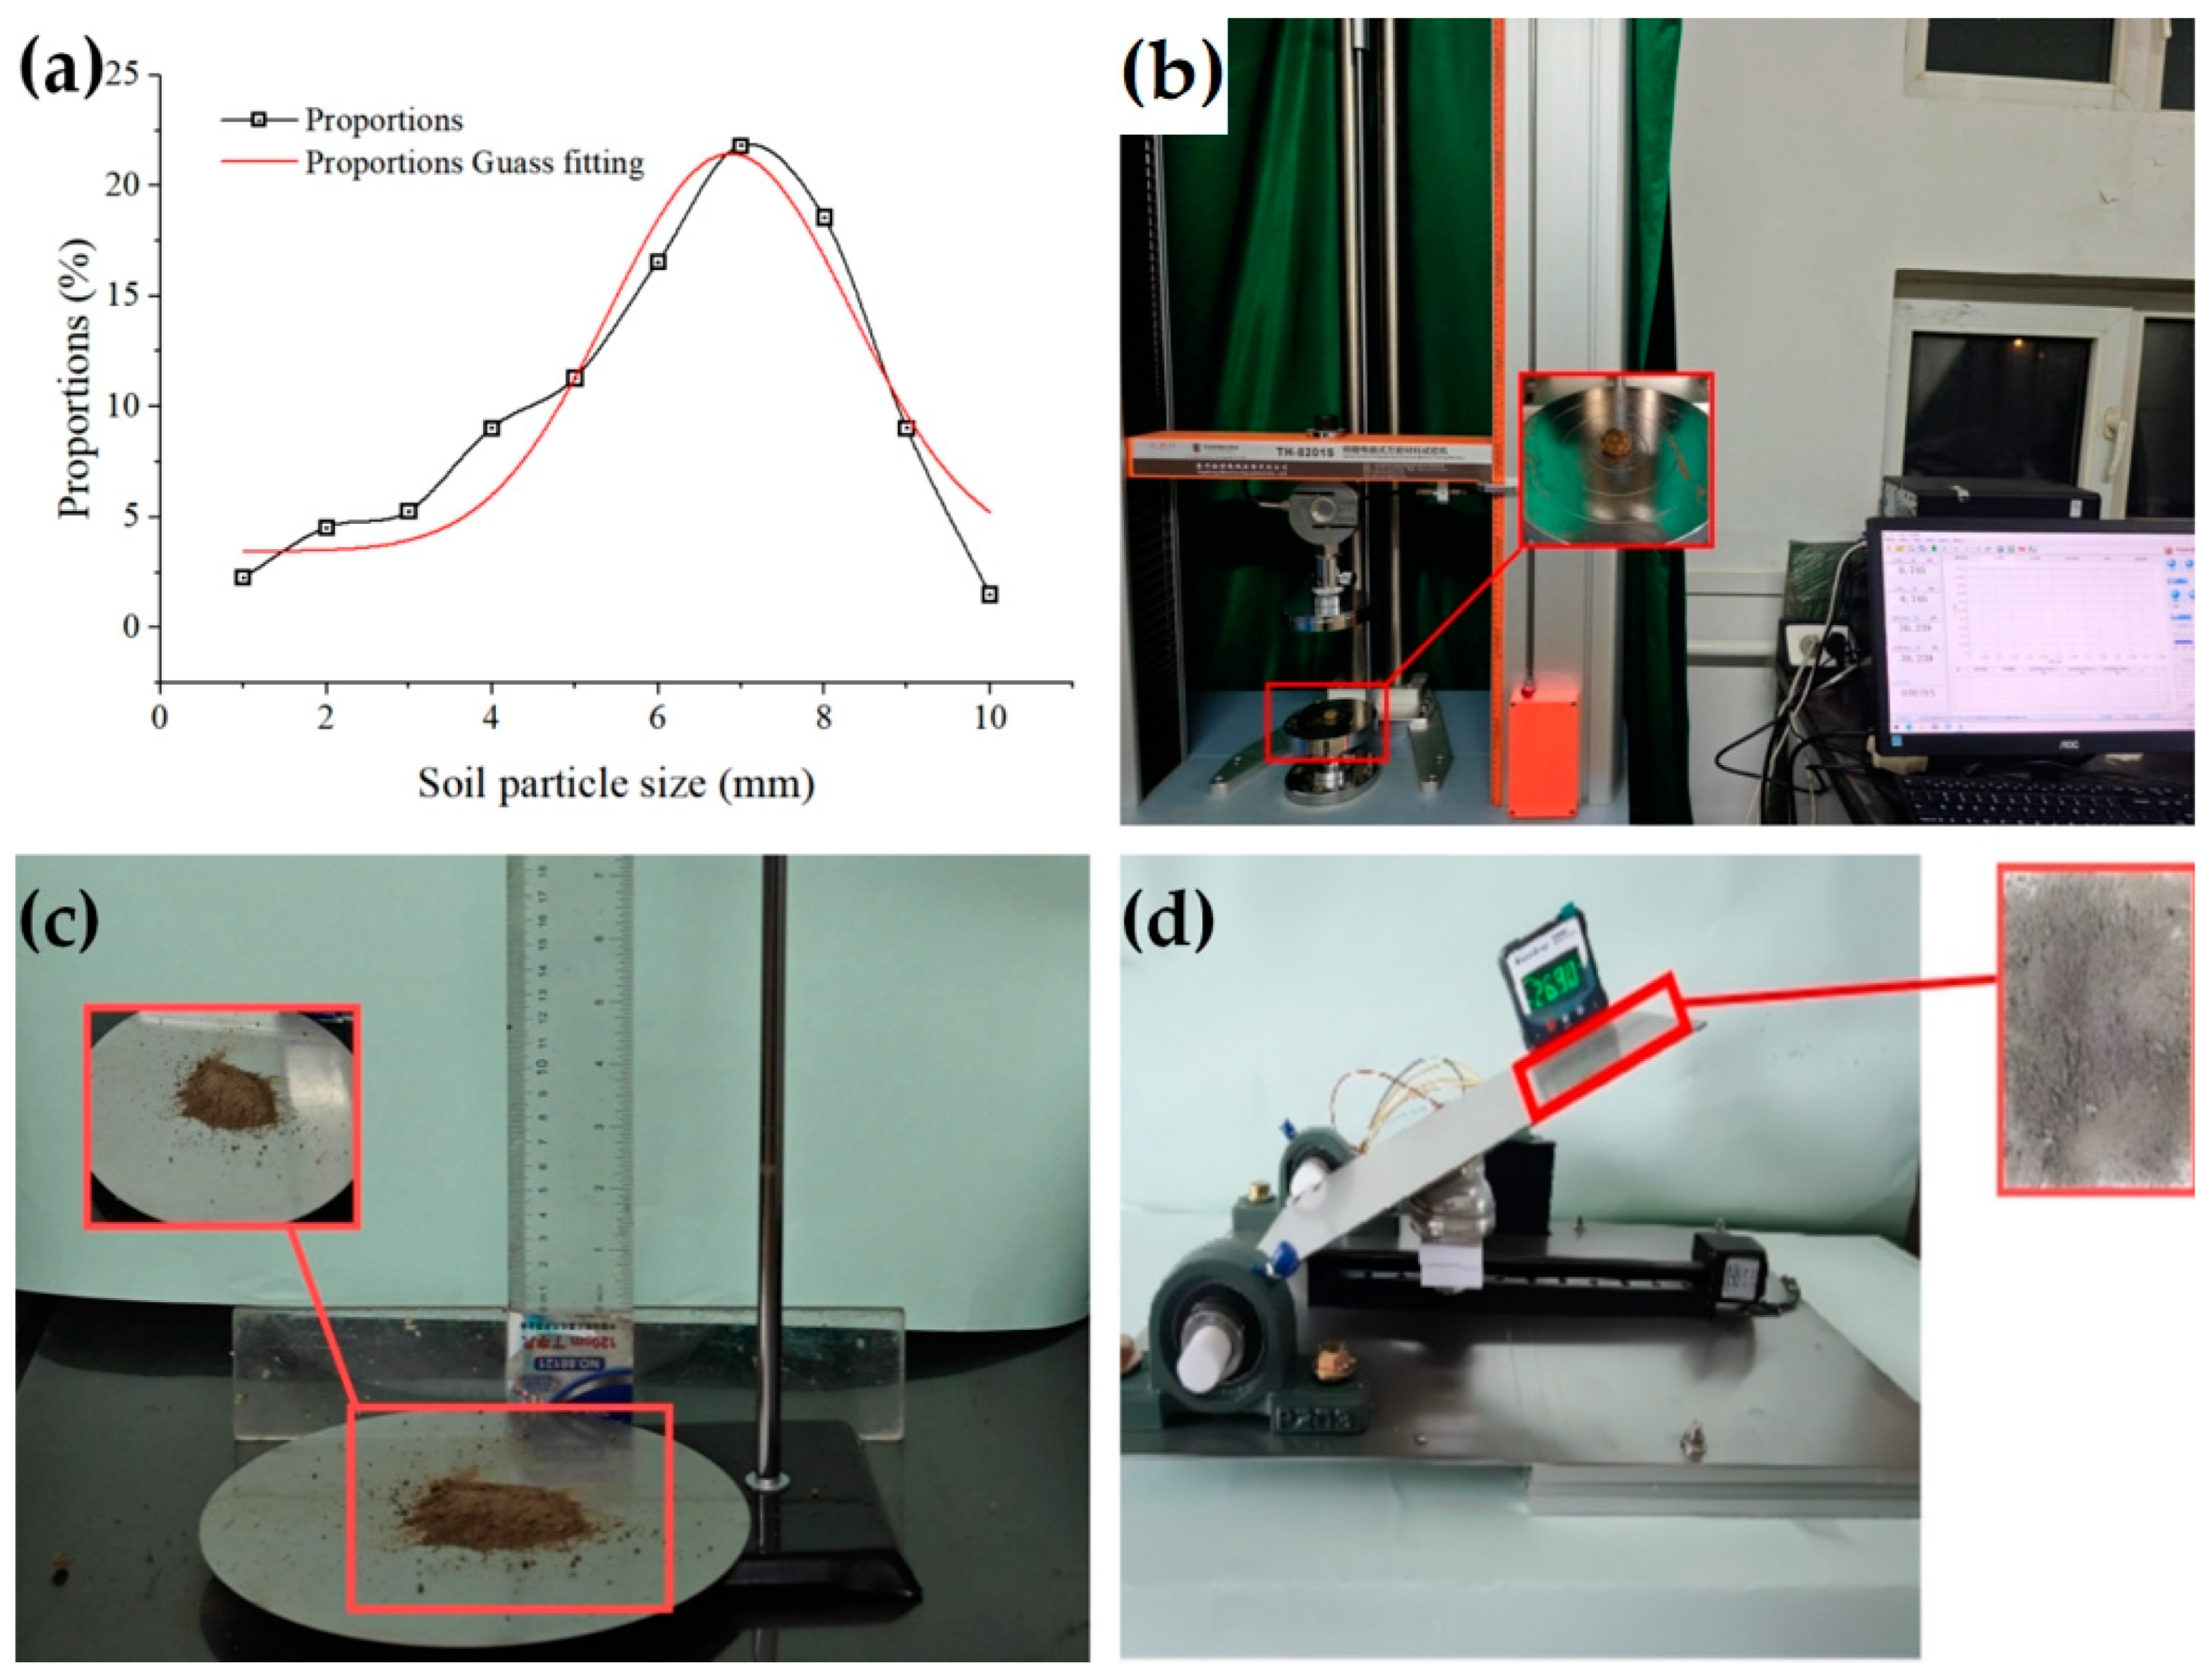
2.3.1. Soil Simulation Tests

In order to select and optimize the bionic furrow openers with different structural parameters, the soil adhesion mechanics model was used to analyze and establish the soil particles, and the physical mechanics model was set as Hertz–Mindlin with JKR. The specific parameters are shown in Table 1. In the simulation software, to create a volume of 300 mm × 50 mm × 100 mm for the rectangular body with no top cover, the contact material was stainless steel. We created a rectangular surface with dimensions of 295 mm × 45 mm at its top, and set this surface to a virtual state to create a particle factory where the particle plant generates a mass of 0.55 kg and the particle drop velocity is −2 m/s. For the establishment of compression plates with dimensions 295 mm × 45 mm × 10 mm, the contact material was stainless steel. The compression plate was set to drop and compress the soil particles to a height of 200 mm in 1.6 s and leave the compression surface quickly after 3 s of conformality. Based on the modeling of soil cutting, this paper conducts experiments for the bionic structure and the scale of enlargement. During the experiment, the furrow opener was set to cut the soil at a rate of speed decline according to the seeder’s rate of entry into the soil. We replaced the furrow openers with different ratio parameters. The simulation duration was 10 s. We determined the maximum force value of the particles. The test model is shown in Figure 8. Each set of tests was repeated three times.
On the basis of the soil-cutting test, we ensured that the other parameters were consistent and kept the furrow opener working at the same speed as the actual seeding speed. In this paper, 15 rpm, 46 rpm, and 78 rpm rotational speeds were added to the cutting process of the furrow opener disk, corresponding to 1 km/h, 3 km/h, and 5 km/h working speeds of the planter, ensuring its machining process and replacing furrow openers with different ratio parameters. The duration of the simulation was 10 s. The test model is shown in Figure 9. The maximum force value of the particles in the test was the test result and evaluation item, and each group of tests was repeated three times.

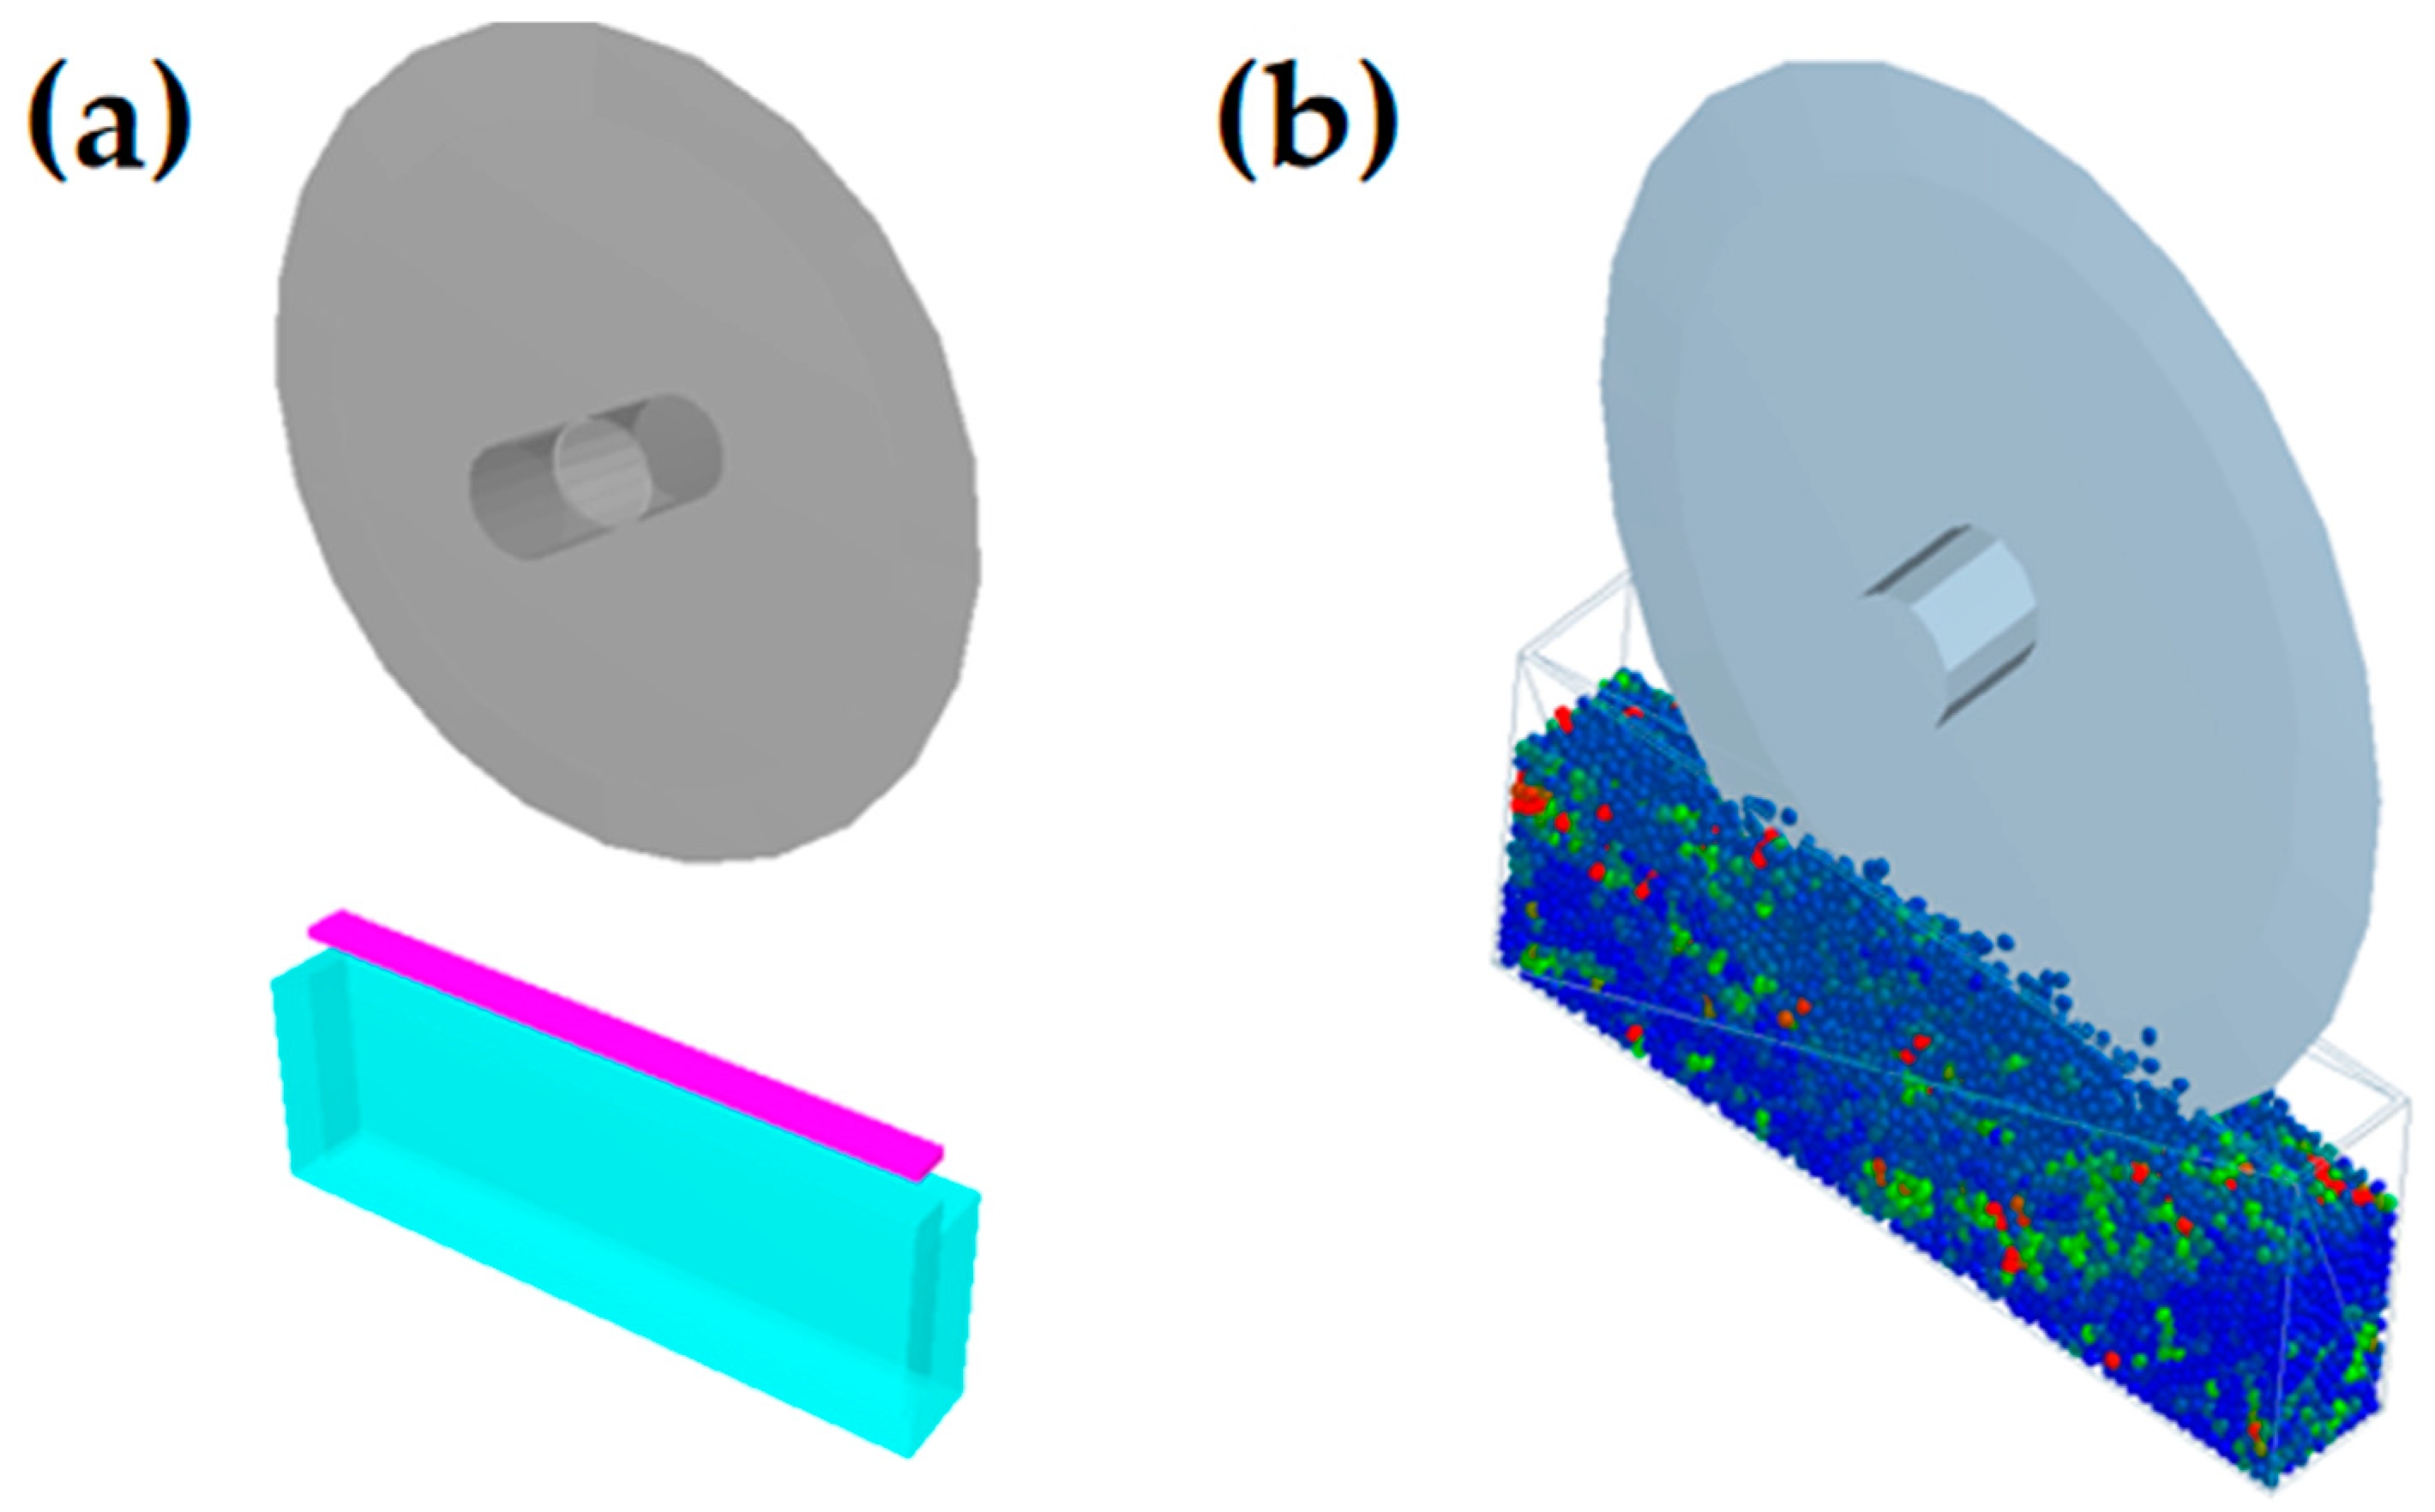
2.3.2. Straw Simulation Test

The simulation cutting test was based on the discrete element modeling of straw. Straws with a diameter of 40 mm and a length of 50 mm were modeled during the experiment. The simulation process started with particle generation, bonding key establishment, and connection. The simulation time for this step was 1.92 s. After generating the straw model, the pellet plant was deleted from the inner cavity of the straw support to create the support plate. After inputting the bionic furrow opener model, we set up the furrow opener cutting action with a cutting speed of 0.2 m/s. We conducted straw-cutting tests with different structural parameters. The simulation duration was 3 s, and each set of trials was repeated three times. The number of bond breaks was counted after the test as a result of the test and as an evaluation item. On the basis of the straw-cutting test, to ensure the consistency of other parameters, we added 15 rpm, 46 rpm, and 78 rpm rotation speeds to the furrow opener disk cutting process, corresponding to the 1 km/h, 3 km/h, and 5 km/h working speeds of the planter. To ensure its machining process, we replaced furrow openers with different proportional parameters. The simulation duration was 3 s. The experimental model is shown in Figure 10. The maximum number of bonding bond breaks was determined for the particles, and each set of experiments was repeated three times.

2.3.3. Field Trials

On the basis of the above tests, actual field tests of furrow openers were conducted for the two optimal bionic furrow opener structures obtained from the previous simulation experiments. After harvesting with the 4YZB-3 harvester in the fall, seeding trials were conducted in the spring to determine the degree of uniformity of furrow opening by the opener. In the test, the working speed was set to 5 km/h through the specific opener in the case of the straw mulching opener operating effect and the stability of the depth of the open furrow.
The trial was conducted in Changchun, Jilin Province. The soil moisture content on the day of the test was 18.32%. The temperature was 17 °C. The moisture content of the straw was 17.4%. The tests were conducted during the course of the experiment using a type of planter. We removed planter mulchers and ballast wheels. We determined how well the bionic furrow opener works by changing the furrow opener blades. The experimental procedure is shown in Figure 11. We measured trenching depth after the operation and determined the stability of the trenching depth.

3. Test Results and Discussions

3.1. Soil Simulation Test Results and Analysis

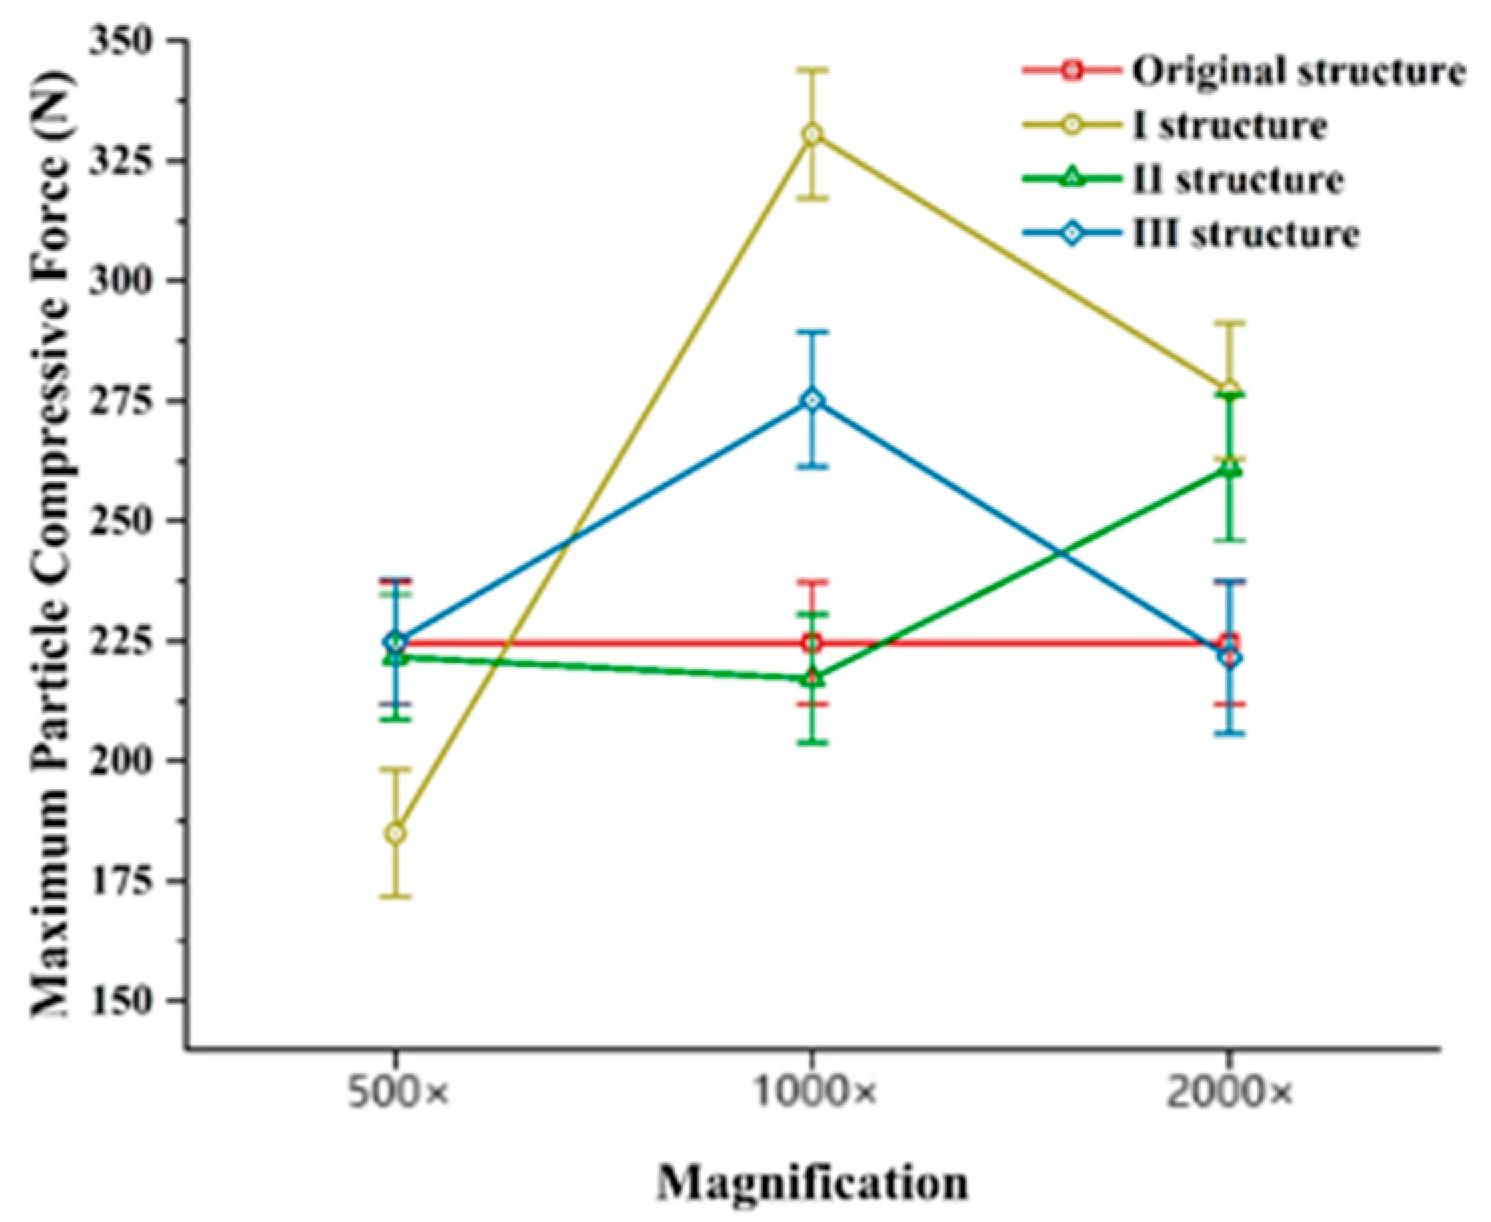
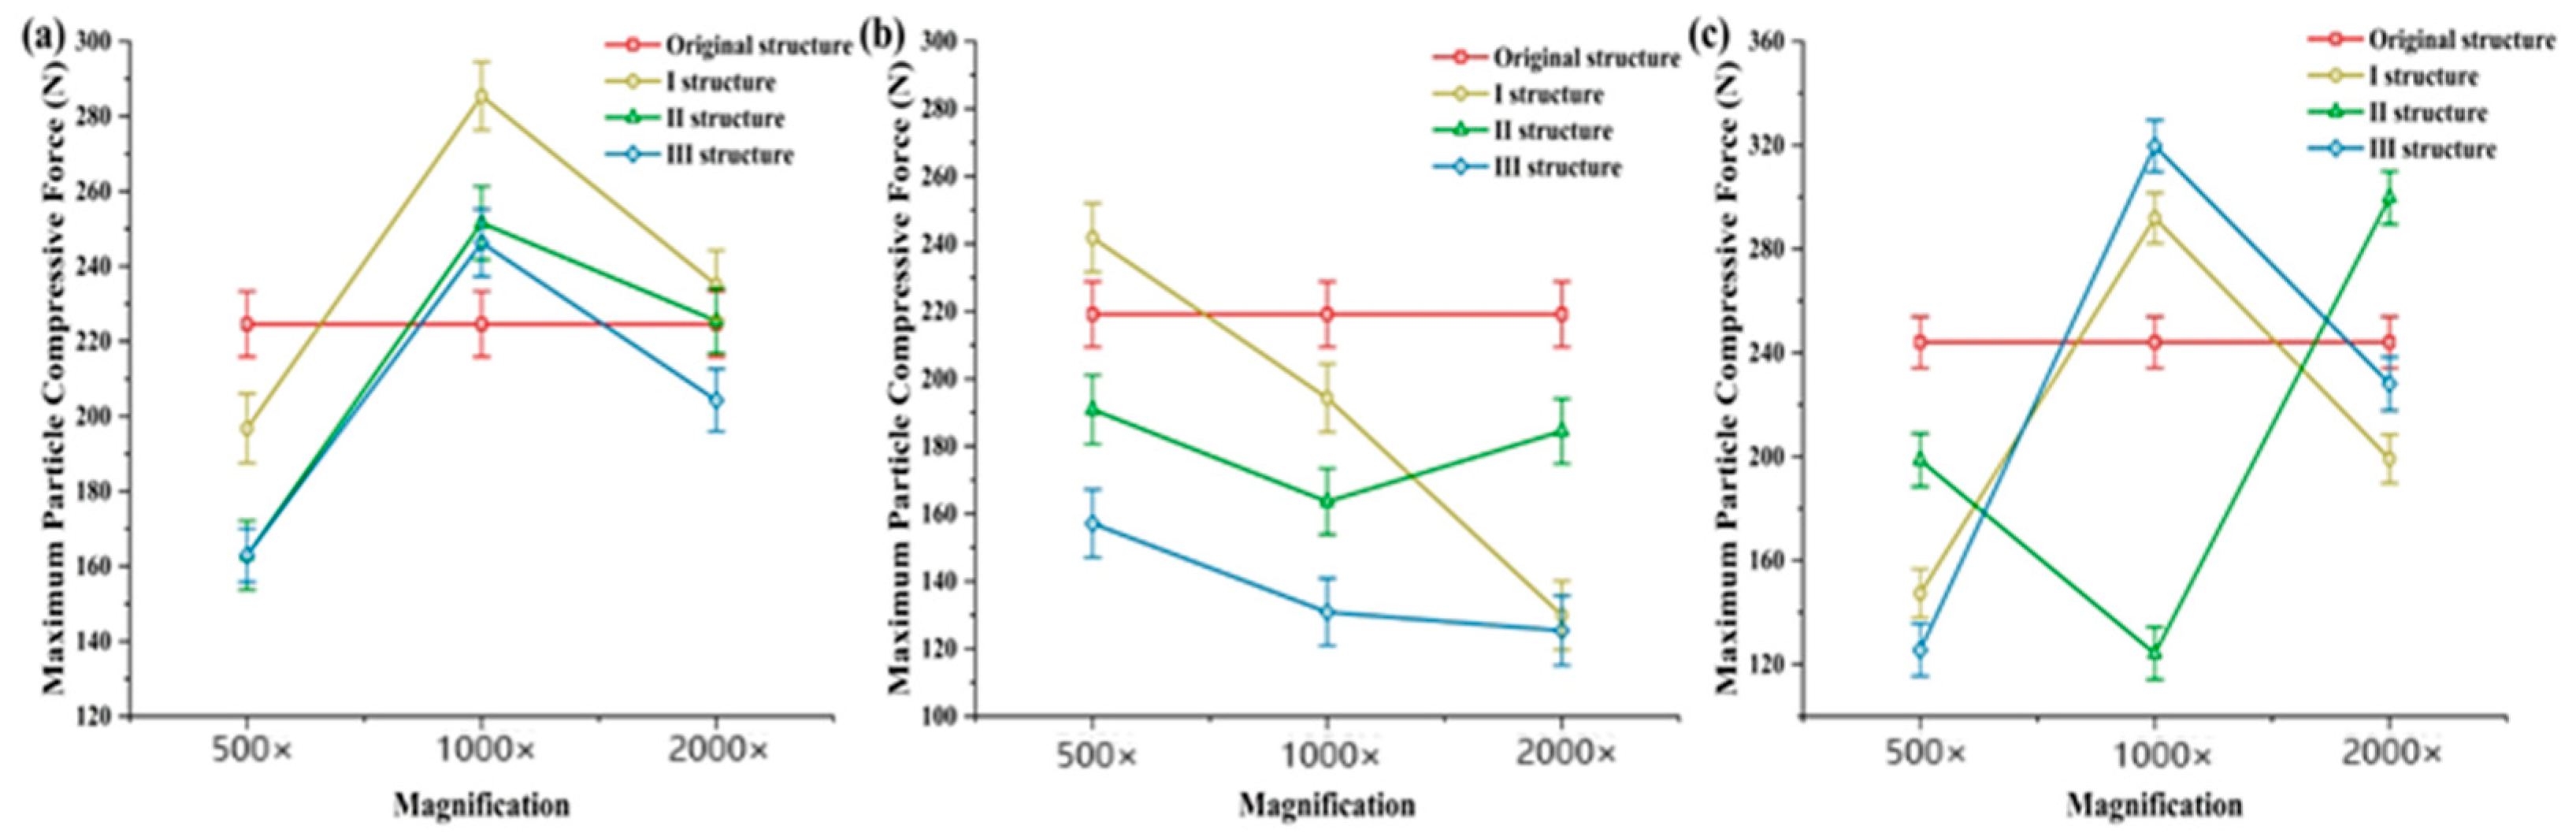
3.1.1. Soil Simulation Cutting Test Results

The results of the soil simulation cutting test are shown in Figure 12. In the case of the original structure, the particles were subjected to a maximum force of 224.57 N, with an error of 12.71 N; the No. 1 structure, with the increase in the multiplicity of the soil force, first increased and then decreased, during which the particles were subjected to a maximum force of 330.61 N, with an error of 13.27 N. Structure No. 2 showed a trend of decreasing and then increasing soil forces with increasing multiplicity, with a maximum force of 261.14 N on the particles and an error of 15.20 N. Structure No. 3 had the same trend as structure 1, but its total soil force was much smaller than structure 1, which had a maximum soil particle force of 275.29 N and an error of 14.01 N. In the case of the same magnification, at 500 magnification, it was the highest force for the original structure; at 1000 magnification the highest force for the No. 1 structure; and at 2000 magnification the highest force for the No. 1 structure.
In addition to the above, the adhesive effect of the soil makes the resistance of the particles more pronounced during the process of entering the soil. In order to ensure the working efficiency of the seeder during the working process, the soil seeding process needs to be simulated separately.

3.1.2. Soil Simulation Seeding Process Simulation Results

The results of the soil simulation seeding process simulation are shown in Figure 13a. Where the figure shows a seeder working at 1 km/h, the soil is subjected to a relatively small machining force during the slow seeding process. The original structure of the soil was subjected to a machining force size of 224.58 N, and the other structures showed a trend of increasing and then decreasing, in the multiplication rate of 1000, to reach the highest value of the soil machining force; when the multiplication rate was 500, the three structures of the soil machining force were lower than the original structure. The maximum value of soil machining force for structure No. 1 was 285.38 N with an error of 9.11 N. The maximum value of the soil machining force of structure No. 2 was 251.53 N with an error of 9.77 N. The maximum value of soil machining force for structure No. 3 was 246.23 N with an error of 8.98 N. In the case of the same magnification, the highest at 2000 magnification was the No. 1 structure; at 1000 magnification, the highest was the No. 1 structure; and at 500 magnification, the highest was the original structure, and this structure was found to have a more pronounced error situation between the No. 1 and No. 3 structures, with the maximum error of the No. 1 structure being 10.23 N, and that of the No. 3 structure being 10.33 N.
The simulation results of the soil simulation seeding process are shown in Figure 13b, where the working speed of the seeder is 3 km/h. In the process of medium-speed seeding, the original structure soil was subjected to a machining force magnitude of 244.05 N with an error of 9.91 N. All other structures were lower than the original except structure No. 1 which had a 500 multiplier. Structure No. 1 showed a steady downward trend; the situation was on a downward trend, with a multiplication rate of 500 to reach the highest value of soil machining force 214.81 N, and the error was 10.23 N. The No. 2 structure was in the trend state of decreasing and then increasing, and its maximum machining force reached 190.88 N at the multiplication rate of 500, with an error of 10.21 N. Structure No. 3 was on a decreasing trend, and its maximum machining force reached 157.13 N at a maximum machining force multiplier of 500, with an error of 10.11 N. In the case of the same magnification, the highest was the original structure at 2000 magnification and 1000 magnification, and the highest was the No. 1 structure at 500 magnification.
The simulation results of the soil simulation seeding process are shown in Figure 13c, where the graph shows the working speed of the seeder at 5 km/h. During high-speed seeding, the soil is subjected to higher machining forces. The original structural soil was subjected to a machining force of 244.05 N with an error of 9.91 N. The No. 1 structure showed an increasing and then decreasing trend, and the highest value of soil machining force was reached at a multiplication rate of 1000, with a machining force of 291.91 N and an error of 9.71 N. The No. 2 structure was in the state of descending and then ascending, and its maximum machining force reached 299.70 N at a multiplication rate of 2000, with an error of 10.21 N. Structure No. 3 had a rising and then falling trend, and its machining force was 319.66 N at a maximum machining force the multiplication rate of 1000, with an error of 9.98 N. At the same magnification, the highest was up to structure No. 2 at 2000 magnification, up to structure No. 3 at 1000 magnification, and up to the original structure at 500 magnification.

3.1.3. Analysis of Soil Simulation Test Results

In soil simulation cutting experiments, different structures have different cutting effects on the soil. Of these, structure No. 1 performed relatively well. It may be because the geometry of the front end of the gryllulus jaw structure is more favorable to the cutting process. Under the action of different magnifications, the fluctuation in the geometry of the 2000 magnification is too obvious, resulting in poor results. The more excellent the 1000 magnification case, the more likely the structures of structure No. 1 and structure No. 3 are than the original structure to produce a large impact on the results, and the structure of structure No. 1 and structure No. 3 have the same trend. In addition to this, in the two-thousand magnification case, the surface undulations are too small and close to the original structure, thus making the magnitude of the cutting force close to the original structure. And, due to the bionic effect of the structure, it makes its error situation more obvious, much larger than the original structure, but its error range is not more than 1.5 times that of the original structure, which is in line with the requirements of the stability of the work in the actual production. However, in the process of cutting the furrow openers, the cutting action is weaker while the dicing action is stronger, which means that without analyzing its circumferential motion, it is possible that the linear motion of the cutting only affects the furrow opener’s work of entering the soil and has no effect on the others. Therefore, in the process of entering the soil, it is recommended to use the 1000 magnification bionic furrow opener with the No. 1 structure and No. 2 structure.
In the soil simulation seeding process simulation, the seeding simulation process of slow, medium, and high speed was realized by setting different working speeds of the seeder. In the comparison of the experimental results, in the slow-speed seeding, all the bionic structures appeared to have a better machining force at 1000 magnification, and at 2000 magnification, only the No. 1 structure produced a better operating effect than the original structure. In the medium-speed seeding process, only structure No. 1 appeared superior to the original operating results at 500 magnification, and all the other structures had different trends, so the results were not good when it was a medium-speed seeding process. In the high-speed seeding process, the 2000 magnification of structure No. 2 exceeded the original structure, and the 1000 magnification of both structure No. 1 and structure No. 3 exceeded the original structure, but the trend of structure No. 2 was not quite the same as the other two cases, which may be due to the fact that the stability of structure No. 2 is poor in high-speed situations.
Under the analysis of the simulation results of the soil, the performance of structures No. 1 and No. 3 is excellent and the error situation is less in their simulation analysis, while the simulation error of structure No. 2 is large and the stability of the structure when working is poor, and the trend is not the same as the other structures, which is not in line with the experimental expectations.

3.2. Straw Simulation Test Results and Analysis

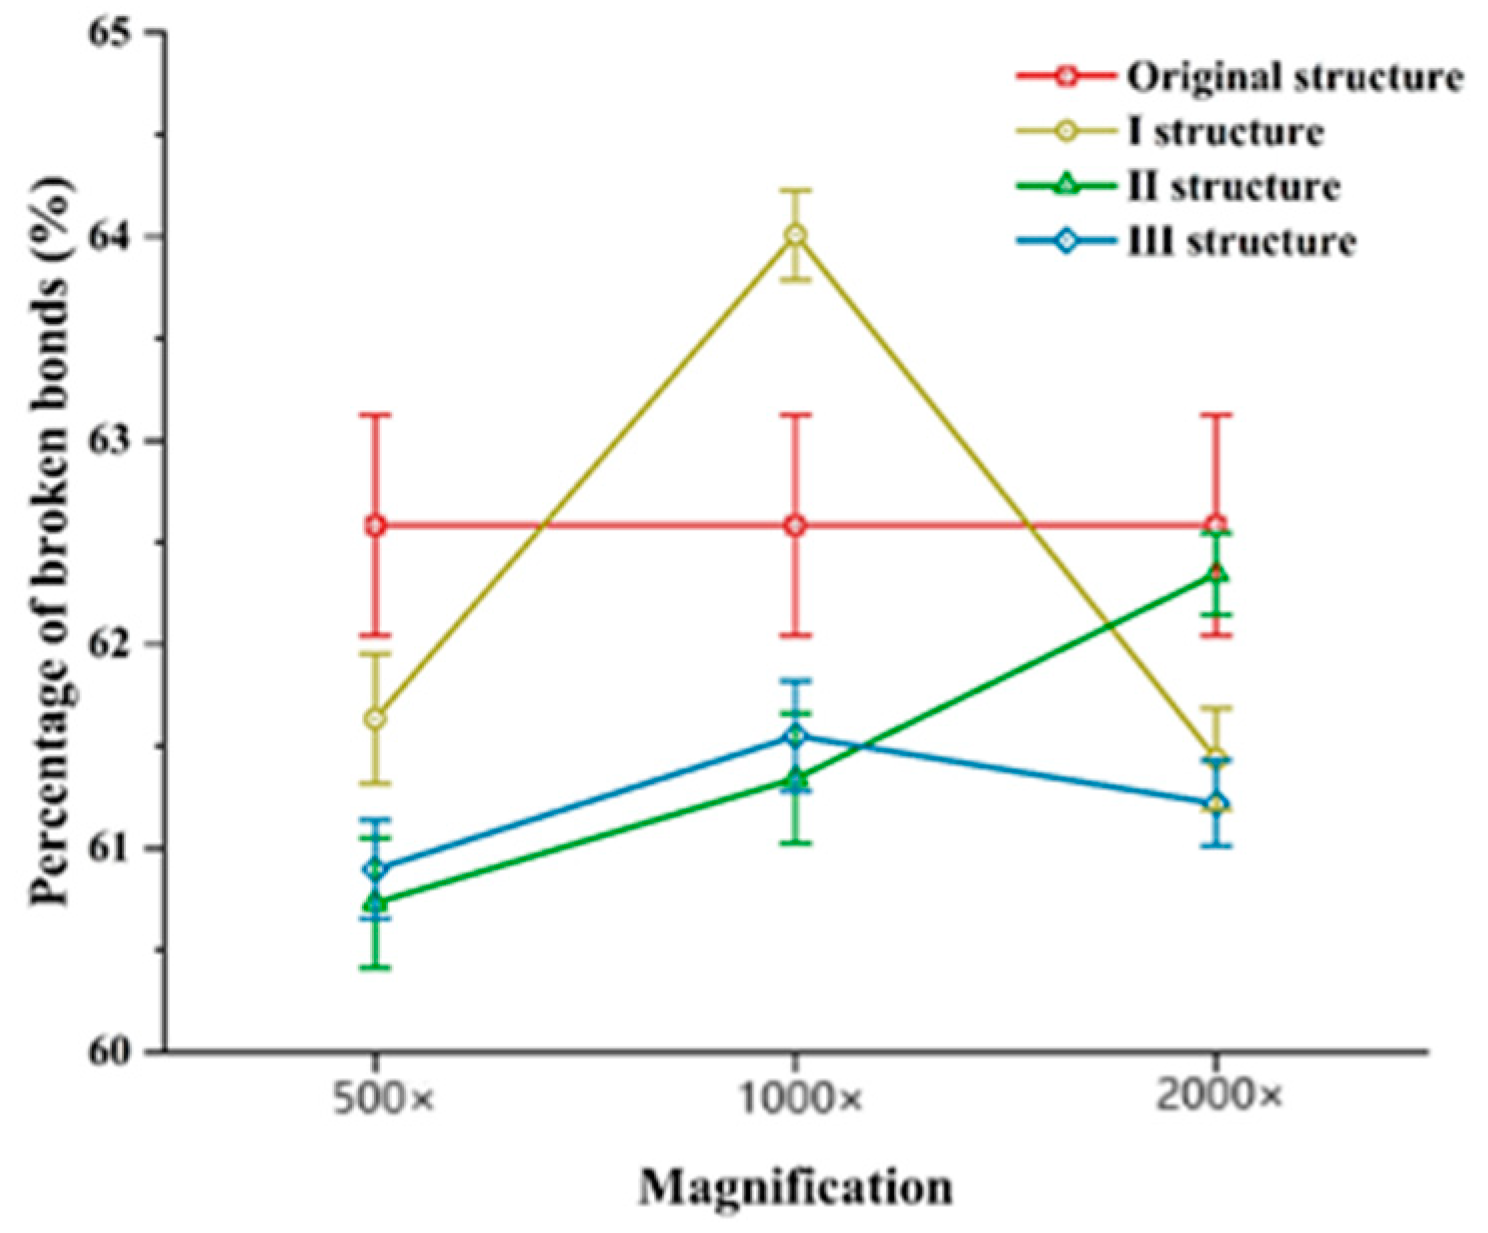
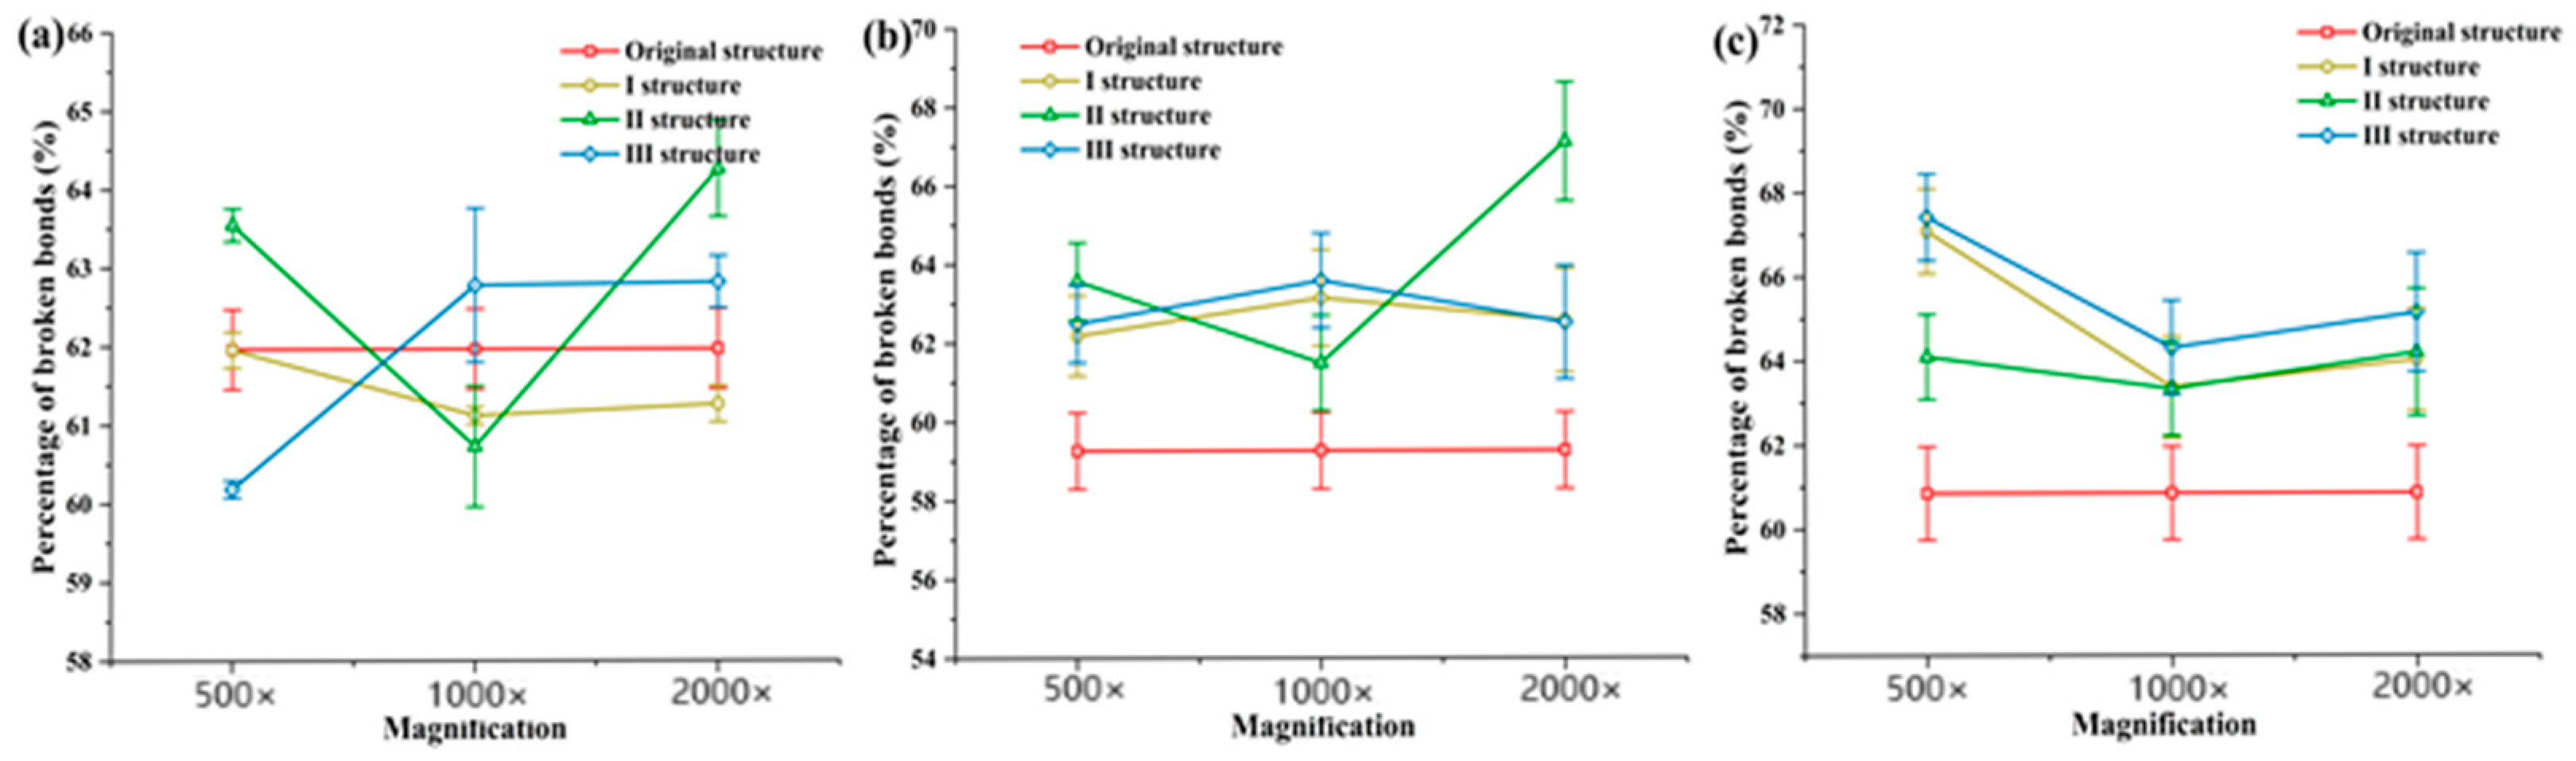
3.2.1. Straw Simulation Cutting Test Results

The results of the straw simulation cutting test are shown in Figure 14. Among them, the original structure bonding bond breakage rate reached 62.58%, with an error of 0.54%, while for the other structures, except for No. 1 structure, the 1000 magnification rate was lower than the original structure breakage rate, in which the No. 1 structure was on a firstly rising and then declining trend, with the maximum breakage rate reaching 64.01%, with an error of 0.22%, and the structure No. 2 had a decreasing trend with increasing magnification. Its maximum breakage rate was 62.35% with an error of 0.20%, and structure No. 3 had a trend of rising and then falling, with a maximum breakage rate of 61.55% and an error of 0.27%. Under the same multiplication rate, the original structure had the best breakage rate in the 2000 multiplication rate; structure No. 1 in the 1000 multiplication; and in the 500 multiplication, the original structure had the best breakage rate. In addition to that, the error of the structure was very large due to the specificity of the bonding bond. The main reason for the above conclusions is that in the absence of rotary action, the furrow opener is only in the soil situation, and the machining effect for straw is not good, which confirms the importance of the rotary action of the disk furrow opener for the effect of furrow opening. In order to further determine the operating effect of the bionic furrow opener in this paper, seeding process simulation for straw was carried out.

3.2.2. Straw Simulation Seeding Process Simulation Results

The results of the straw simulation seeding process simulation are shown in Figure 15, in which Figure 15a shows the working speed of the seeder at 1 km/h. In the process of slow seeding, the breakage of straw was more obvious, in which the original structure caused the breakage rate to be 61.96%, with an error of 0.51%, and the other structures were higher than the original structure. The No. 1 structure showed a decreasing trend, and the multiplication rate was 500, which caused the maximum value of breakage rate to be 61.95% with an error of 0.23%. Structure No. 2 had an upward and then downward trend, and its maximum breakage was reached at a multiplier of 2000 with a breakage rate of 64.25% and an error of 0.61%. Structure No. 3 had an upward trend and, at a multiplier of 2000, reached its maximum breakage rate of 62.81% with an error of 0.33%. In the case of the same magnification, the highest was the No. 2 structure at 2000 magnification, the highest was the No. 3 structure at 1000 magnification, and the highest was the No. 2 structure at 500 magnification. However, due to the problem of the working speed of the furrow opener, it led to a smaller rate of lifting breakage than the cutting action, which was analyzed for different speeds in order to further improve the simulation accuracy.
The simulation results of the straw simulation seeding process are shown in Figure 15b, where the graph shows the working speed of the seeder 3 km/h. In the process of medium-speed seeding, the straw suffered a relatively small breakage. Among them, the original structure caused a breakage rate of 59.26% with an error of 0.97%. The other structures were higher than the original structures. Structure No. 1 had a tendency to rise and then fall, and the maximum breakage rate of 63.14% was reached at a magnification of 1000, with an error of 1.22%. Structure No. 2 had a tendency to fall and then rise, and the maximum breakage rate of 67.09% was reached at a multiplication of 2000 magnification with an error of 1.51%. Structure No. 3 had a tendency to rise and then fall, and the maximum breakage rate of 67.09% was reached at a magnification of 1000 magnification with an error of 1.51%. Structure No. 3 had a tendency to rise and then fall. At a magnification of 1000, it reached its maximum breakage of 63.58% with an error of 1.20%. For the same magnification, structure No. 2 was the highest at 2000 magnification, structure No. 3 at 1000 magnification, and structure No. 2 at 500 magnification.
The simulation results of the straw simulation seeding process are shown in Figure 15c, where the graph shows the working speed of the seeder 5 km/h. In the process of high-speed seeding, the straw was subjected to more moderate breakage. The original structure caused a breakage rate of 60.85% with an error of 1.11%. The other structures were higher than the original structure. Structure No. 1 had a downward and then upward trend, and reached its maximum breakage rate of 67.07% at a multiplier of 500, with an error of 1.01%. Structure No. 2 had a downward and then upward trend, and reached its maximum breakage rate of 64.18% at a multiplier of 2000, with an error of 1.57%. Structure No. 3 had a downward and then upward trend, and reached its maximum breakage rate of 64.18% at a multiplier of 500, with an error of 1.57%. Structure No. 3 had a downward and then upward trend, and reached its maximum breakage rate of 67.41% at a multiplier of 500, with an error of 1.03%. At the same multiplicity, structure No. 3 was at its maximum.

3.2.3. Analysis of Straw Simulation Test Results

The results of the simulation and cutting experiments for straw were different from the simulation experiments for soil. The simulation experiment with straw mainly utilized the percentage of bond breakage to determine. During the cutting experiment, all the results were lower than the original structure except for the 1000 magnification result of structure No. 1, which was higher than the original structure. It was proven that when the straw was laid on the ground state, only the No. 1 structure performed better when the seeder encountered the straw during the soil entry operation. In the process of analysis, it was found that the bionic structure had a higher error on the straw breakage rate, which may be due to the fact that the straw undergoes a machining motion during the bonding bond formation process, and the irregularity of its geometrical structure leads to this phenomenon.
In the straw simulation seeding process simulation, the straw crushing is more obvious in the slow-speed sowing process. Bonding bond crushing reached up to 64.25%, and its error was larger, with the highest error of 0.61%. In the process of its analysis, in the case of low speed, the trend caused by the three structures was different, in which the best performance was the 2000 magnification of the No. 2 structure, proving that the bionic structure is more unstable in the process of low-speed work. In the medium-speed seeding process, all three structures were better than the original structure. Among them, No. 1 and No. 3 structures had the same trend; No. 2 structure was different from others; and No. 1 and No. 3 structures had a more stable crushing rate, especially at 1000 magnification. During the high-speed seeding process, all the structures had the same trend; they were in the trend of decreasing and then increasing. Especially, the results of No. 1 and No. 3 structures were excellent.
On the basis of this analysis, combined with soil seeding process simulation, this paper decides to select 1000 magnification of No. 1 and No. 3 structures for the final selection process and to judge the field operation effect of No. 1 and No. 3 with actual tests in the field.

3.3. Field Trial Results and Analysis

3.3.1. Field Trial Results

As shown in Figure 16, the field test was conducted on the basis of the original structure, No. 1 1000 magnification structure and No. 3 1000 magnification structure, and the mean value of the sowing depth of the original structure was 35.70 mm, with a standard deviation of 7.74 mm, greater volatility and poor stability, with the maximum sowing depth of 65.20 mm and the minimum sowing depth of 23.40 mm; the mean value of sowing depth of the No. 1 structure was 36.15 mm, with a standard deviation 6.99 mm, greater volatility, poor stability, the maximum sowing depth was 46.5 mm, the minimum sowing depth is 26.90 mm; and the average value of the sowing depth of the No. 3 structure is 39.38 mm, standard deviation was 3.89 mm, the maximum sowing depth was 47.70 mm, the minimum sowing depth was 32.40 mm, low volatility, good stability, determined by Gauss function fitting analysis; the coefficient of determination of R2 > 0.90, and the test results are in line with the requirements of normal distribution.

3.3.2. Analysis of Field Trial Results

Under the results of the field test, keeping the other variables as consistent as possible, the fluctuation of the original structure during furrowing was obvious. This is because the original structure is not able to effectively crush the straw when it is covered with straw. Moreover, when the straw is in the surface state, the original structure’s blade is smooth, which cannot be grasped and crushed in time, resulting in straw slippage and the weakening of the cutting effect. The fluctuation of structure No. 1 is lower than the original structure, and the stability is strong because the bionic structure improves the grasping and cutting effect of the straw because its structure has strong grasping and cutting abilities, and the phenomenon of normal distribution is concentrated in a region. The fluctuation of the number three structure is obvious, but according to its zone, the problem of its bionic structure leads to the weakening of the working stability, and the sowing depth coverage area is wider relative to the number one structure. Therefore, under the comprehensive analysis, Structure No. 1 is better, with a 42.10% increase in stability over the original structure.

4. Conclusions

In this paper, a bionic study of the structure of the gryllulus jaw tooth scar was applied to a disk furrow opener, and the optimal structure was determined by analyzing it through a relevant discrete element model. The conclusions are obtained as follows:
(1)
By extracting the structure of gryllulus ‘jaw tooth marks, tooth marks No. 1, No. 2, and No. 3 were extracted, and 500, 1000, and 2000 magnifications were selected to be applied to disk furrow openers.
(2)
Simulation models of soil particles were established based on Hertz–Mindlin with the JKR model and the Standard Rolling Friction model. And, the discrete element model of corn straw was established based on the Hertz–Mindlin with bonding contact model, and the relevant parameters of the model were determined.
(3)
Bionic furrow opener structure analysis using soil and straw discrete meta-model, cutting, and seeding process simulation; determining the strength of force applied by the structure through the maximum value of force of the soil simulation test; determining the ability of the structure to break the straw through the maximum value of bonding bond breaking percentage of straw simulation test; and obtaining the 1000 magnification of the No. 1 and No. 3 structures, which are more excellent through the test.
(4)
On the basis of simulation tests, field tests were carried out using a type of planter, and it was determined that the No. 1 structure with 1000 magnification was the optimal structure, and the stability of the structure was improved by 42.10% compared with the original structure.

Author Contributions

Conceptualization, X.J. and X.W.; methodology, X.W. and S.Y.; software, X.W. and Y.Y.; validation, X.W. and S.Y.; investigation, X.J. and C.L.; resources, X.J. and T.X.; visualization, X.W. and X.J.; writing—original draft preparation, T.X.; funding acquisition, X.J. and T.X. All authors have read and agreed to the published version of the manuscript.

Funding

This study was supported by the National Natural Science Foundation of China (52165031) and by the Science and Technology Development Plan Project of Jilin province (No. 20200402008NC).

Data Availability Statement

The original contributions presented in the study are included in the article, further inquiries can be directed to the corresponding author.

Conflicts of Interest

The authors declare that they have no known competing financial interests or personal relationships that could have appeared to influence the work reported in this paper.

References

  1. Zhu, H.; Wang, D.; He, X.; Shang, S.; Zhao, Z.; Wang, H.; Tan, Y.; Shi, Y. Study on Plant Crushing and Soil Throwing Performance of Bionic Rotary Blades in Cyperus esculentus Harvesting. Machines 2022, 10, 562. [Google Scholar] [CrossRef]
  2. Liu, Z.; Wang, T.; Liu, S.; Yan, X.; Zhao, H.; Wu, X.; Zhang, S. Design and Experimental Study of a Bionic Blade for Harvesting the Wild Chrysanthemum Stem. Agriculture 2023, 13, 190. [Google Scholar] [CrossRef]
  3. Gronenberg, W.; Hölldobler, B. Jaws that snap: Control of mandible movements in the ant Mystrium. J. Insect Physiol. 1998, 44, 241–253. [Google Scholar] [CrossRef]
  4. Wang, B.; Wang, Y. Research on accurate perception and control system of fertilization amount for corn fertilization planter. Front. Plant Sci. 2022, 13, 1074945. [Google Scholar] [CrossRef] [PubMed]
  5. Zhang, C.; Xia, J. Design and experiment of the slip-shear cutting combined straw returning blade based on discrete element method. Int. Agric. Eng. J. 2018, 27, 112–119. [Google Scholar]
  6. Tekeste, M.Z.; Balvanz, L.R. Discrete element modeling of cultivator sweep-to-soil interaction: Worn and hardened edges effects on soil-tool forces and soil flow. J. Terramechanics 2019, 82, 1–11. [Google Scholar] [CrossRef]
  7. Katinas, E.; Chotěborský, R. Wear modelling of soil ripper tine in sand and sandy clay by discrete element method. Biosyst. Eng. 2019, 188, 305–319. [Google Scholar] [CrossRef]
  8. Karpman, E.; Kövecses, J. Discrete element modelling for wheel-soil interaction and the analysis of the effect of gravity. J. Terramechanics 2020, 91, 139–153. [Google Scholar] [CrossRef]
  9. Zhang, C.; Xu, J. Three-dimensional DEM tillage simulation: Validation of a suitable contact model for a sweep tool operating in cohesion and adhesion soil. J. Terramechanics 2023, 108, 59–67. [Google Scholar] [CrossRef]
  10. Barr, J.B.; Ucgul, M. Simulating the effect of rake angle on narrow opener performance with the discrete element method. Biosyst. Eng. 2018, 171, 1–15. [Google Scholar] [CrossRef]
  11. Hang, C.; Gao, X. Discrete element simulations and experiments of soil disturbance as affected by the tine spacing of subsoiler. Biosyst. Eng. 2018, 168, 73–82. [Google Scholar] [CrossRef]
  12. Sadek, M.; Chen, Y. Characterization of the shear properties of hemp fiber and core using the discrete element method. Trans. ASABE 2011, 54, 2279–2285. [Google Scholar] [CrossRef]
  13. Jalali, S.; Aschheim, M.; Hammer, M.; Donahue, K.J.W.D. Seismic Design Factors and Allowable Shears for Strawbale Wall Assemblies. 2013. Available online: https://ecobuildnetwork.org/wp-content/uploads/2024/12/Seismic-Design-Factors-and-Allowable-Shears-for-Strawbale-Wall-Assemblies.September.26.2013.pdf (accessed on 24 September 2024).
  14. Zhong, J.Q.; Tao, L.M. Determination and interpretation of parameters of double-bud sugarcane model based on discrete element. Comput. Electron. Agric. 2022, 203, 107428. [Google Scholar] [CrossRef]
  15. Zhang, S.; Zhao, H. Discrete element modeling and shear properties of the maize stubble-soil complex. Comput. Electron. Agric. 2023, 204, 107519. [Google Scholar] [CrossRef]
  16. Zhang, T.; Zhao, M. A discrete element method model of corn stalk and its mechanical characteristic parameters. BioResources 2020, 15, 9337. [Google Scholar] [CrossRef]
  17. Fang, M.; Yu, Z. Friction coefficient calibration of corn stalk particle mixtures using Plackett-Burman design and response surface methodology. Powder Technol. 2022, 396, 731–742. [Google Scholar] [CrossRef]
  18. Fallahi, S.; Raoufat, M.H. Row-crop planter attachments in a conservation tillage system: A comparative study. Soil Tillage Res. 2008, 98, 27–34. [Google Scholar] [CrossRef]
  19. Zhao, H.; Huang, Y. Applications of discrete element method in the research of agricultural machinery: A review. Agriculture 2021, 11, 425. [Google Scholar] [CrossRef]
  20. Liu, L.; Wang, X. Determination and verification of parameters for the discrete element modelling of single disc covering of flexible straw with soil. Biosyst. Eng. 2023, 233, 151–167. [Google Scholar] [CrossRef]
  21. Zhu, H.B.; Qian, C.; Bai, L.Z.; Li, H.; Mu, D.L.; Li, J.J. Optimization of discrete element model of corn stalk based on Plackett-Burman design and response surface methodology. J. China Agric. Univ. 2021, 26, 221–231. [Google Scholar]
  22. Thielke, L.; Kemper, S. Simulation of agricultural processes using the discrete element method. Mech. Agric. Conserv. Resour. 2015, 61, 10–13. [Google Scholar]
  23. Johnson, K.L.; Kendall, K.; Roberts, A.A.D. Surface energy and the contact of elastic solids. Proc. R. Soc. Lond. A Math. Phys. Sci. 1971, 324, 301–313. [Google Scholar] [CrossRef]
  24. Potyondy, D.O.; Cundall, P.A. A bonded-particle model for rock. Int. J. Rock Mech. Min. Sci. 2004, 41, 1329–1364. [Google Scholar] [CrossRef]
  25. Jiang, M.; Zhang, A.; Shen, Z. Granular soils: From DEM simulation to constitutive modeling. Acta Geotech. 2020, 15, 1723–1744. [Google Scholar] [CrossRef]
  26. Mousaviraad, M.; Tekeste, M.Z. Systematic calibration and validation approach for discrete element method (DEM) modeling of corn under varying moisture contents (MC). J. ASABE 2024, 67, 259–274. [Google Scholar] [CrossRef]
  27. Coskun, M.B.; Yalcin, I.; Ozarslan, C. Physical properties of sweet corn grain (zea mays saccharata sturt.). J. Food Eng. 2006, 74, 523–528. [Google Scholar] [CrossRef]
  28. USA, American Society of Agricultural Engineers. Compression Test of Food Materials of Convex Shape, ASAE Standards 2002: Standards Engineering Practices; American Society of Agricultural Engineers: St. Joseph, MI, USA, 2002; Volume 49, pp. 592–599. [Google Scholar]
  29. Wang, X.M.; Yu, J.Q.; Lv, F.Y.; Wang, Y.; Fu, W. A multi-sphere based modelling method for maize grain assemblies. Adv. Powder Technol. 2017, 28, 584–595. [Google Scholar] [CrossRef]
  30. Wang, L.J.; Zhou, W.X.; Ding, Z.J.; Li, X.X.; Zhang, C.G. Experimental determination of parameter effects on the coefficient of restitution of differently shaped maize in three-dimensions. Powder Technol. 2015, 284, 187–194. [Google Scholar] [CrossRef]
  31. Hlosta, J.; Zurovec, D.; Rozbroj, J.; Ramirez-Gomez, A.; Necas, J.; Zegzulka, J. Experimental determination of particle-particle restitution coefficient via double pendulum method. Chem. Eng. Res. Des. 2018, 135, 222–233. [Google Scholar] [CrossRef]
  32. Gonzalez-Montellano, C.; Fuentes, J.M.; Ayuga-Tellez, E.; Ayuga, F. Determination of the mechanical properties of maize grains and olives required for use in dem simulations. J. Food Eng. 2012, 111, 553–562. [Google Scholar] [CrossRef]
  33. Yan, D.X.; Yu, J.Q.; Wang, Y.; Zhou, L.; Yu, Y.J. A general modelling method for soybean grains based on the discrete element method. Powder Technol. 2020, 372, 212–226. [Google Scholar] [CrossRef]
  34. Zhou, L.; Yu, J.Q.; Wang, Y.; Yan, D.X.; Yu, Y.J. A study on the modelling method of maize-grain particles based on the discrete element method. Powder Technol. 2020, 374, 353–376. [Google Scholar] [CrossRef]
Figure 1. Structural analysis of gryllulus jaws and results. (a) Electron microscopy results, and (b) the case of the curve.
Processes 12 02834 g001
Figure 2. Bionic furrow opener profile applications.
Processes 12 02834 g002
Figure 3. Soil parameter test and simulation processes. (a) Soil particle size, (b) compression test, (c) falling ball test, and (d) Slope test.
Processes 12 02834 g003
Figure 4. Multi-sphere modeling of soil particles. (a) Single soil particle, (b) 2-sphere models, and (c) 3-sphere models. (d) Corresponding 3D models.
Processes 12 02834 g004
Figure 5. Soil parameter test and simulation processes. (a) Stacking angle tests, and (b) cone penetration tests.
Processes 12 02834 g005
Figure 6. Straw size measurement.
Processes 12 02834 g006
Figure 7. Multi-sphere modeling of straw. (a) Particle model, and (b) bonding model.
Processes 12 02834 g007
Figure 8. Soil model machining test model. (a) Simulation model, and (b) machining test process.
Processes 12 02834 g008
Figure 9. Soil model cutting test model.
Processes 12 02834 g009
Figure 10. Straw bonding model tests. (a) Straw discrete element particle cutting test. (b) Bonding bond cutting test.
Processes 12 02834 g010
Figure 11. Field experiments with furrow openers.
Processes 12 02834 g011
Figure 12. Soil-cutting test results.
Processes 12 02834 g012
Figure 13. Soil seeding process simulation results. (a) Rotation speed of 15, (b) rotation speed of 46, and (c) rotation speed of 78.
Processes 12 02834 g013
Figure 14. Straw bonding model machining test results.
Processes 12 02834 g014
Figure 15. Straw bonding model seeding process simulation results. (a) Rotation speed of 15, (b) rotation speed of 46, and (c) rotation speed of 78.
Processes 12 02834 g015
Figure 16. Experimental results of the field furrow opener experiment.
Processes 12 02834 g016
Table 1. Simulation parameters for soil particles and geometric modeling [21].
ParametersValue
Density of soil, kg/m31300
Permissible soil weight, kg/m31028
Poisson’s ratio for soil0.37
Shear modulus of soil, Pa1 × 108
Coefficient of recovery between soils0.336
Coefficient of static friction between soils0.212
Coefficient of rolling friction between soils0.417
Coefficient of recovery between soil and 45 steel0.112
Coefficient of static friction between soil and 45 steel0.252
Coefficient of rolling friction between soil and 45 steel0.157
Table 2. Simulation parameters of the straw geometric model [21].
ParametersValue
Straw density, kg/m3470
Poisson’s ratio for straw0.4
Shear modulus of straw, Pa1.7 × 106
Coefficient of recovery between straw and 45 steel0.663
Coefficient of static friction between straw and 45 steel0.226
Coefficient of rolling friction between straw and 45 steel0.119
Disclaimer/Publisher’s Note: The statements, opinions and data contained in all publications are solely those of the individual author(s) and contributor(s) and not of MDPI and/or the editor(s). MDPI and/or the editor(s) disclaim responsibility for any injury to people or property resulting from any ideas, methods, instructions or products referred to in the content.

