Article

Experimental Study on the Stress Sensitivity Characteristics of Wave Velocities and Anisotropy in Coal-Bearing Reservoir Rocks

1
School of Energy Science and Engineering, Henan Polytechnic University, Jiaozuo 454003, China
2
College of Energy and Materials Engineering, Taiyuan University of Science and Technology, Taiyuan 030024, China
3
School of Resources and Environment, Henan Polytechnic University, Jiaozuo 454003, China
4
School of Safety Science and Engineering, Henan Polytechnic University, Jiaozuo 454003, China
5
School of Big Data and Computer Science, Shanxi Institute of Science and Technology, Jincheng 048000, China
*
Authors to whom correspondence should be addressed.
Processes 2024, 12(12), 2819; https://doi.org/10.3390/pr12122819
Submission received: 4 November 2024 / Revised: 27 November 2024 / Accepted: 6 December 2024 / Published: 9 December 2024

Abstract

:
As the effective stress in coal-bearing reservoirs changes, the elastic wave velocities, stress sensitivity, and anisotropic characteristics of coal rocks exhibit certain variations. Therefore, this study selected samples from the same area (sandstone, mudstone, and anthracite) and conducted experiments on their transverse wave velocities (Vs) and longitudinal wave velocities (Vp) and wave velocity ratios in three directions (one perpendicular and two parallel to the layering), using the RTR-2000 testing system under loading pressure conditions. The results indicate that the longitudinal and transverse wave velocities of the coal rock samples show a phase-wise increase with rising pressure. The wave velocities and wave velocity ratios of sandstone, mudstone, and anthracite demonstrate certain anisotropic characteristics, with an overall trend of decreasing anisotropy strength that stabilizes over time. The anisotropic characteristics of the longitudinal wave velocities in sandstone and mudstone are stronger than those of the transverse wave velocities, whereas in anthracite, the anisotropic characteristics of the transverse wave velocities are stronger than those of the longitudinal wave velocities. Thus, it can be concluded that Vp is a sensitive parameter for detecting the anisotropic characteristics of sandstone and mudstone, while Vs serves as a sensitive parameter for detecting the anisotropic characteristics of anthracite.

1. Introduction

Nowadays, with the development of traditional energy and the increasing range and depth of coal, oil, and gas resource extraction, the difficulty of energy development is growing. Therefore, the exploration and development of complex coal-bearing reservoirs have gradually attracted significant attention from the international community, and resource distribution and resource potential have become hot topics of research. Particularly, in stable tectonic zones, the stress field in reservoirs is mainly controlled by changes in burial depth [1,2], and the reservoir stress field mainly shows stable vertical variation [3]. Firstly, the burial depth of reservoirs in the basin slope zone gradually increases from the edge to the center of the basin, leading to an increase in stress. In areas with strong tectonic activity, the reservoirs are greatly influenced by the intensity of horizontal tectonic stress, and large gradients of horizontal tectonic stress affect the reservoirs. Secondly, there are zones of abrupt change in the regional horizontal tectonic stress field, specifically high horizontal stress gradient zones. Thus, investigating the response characteristics of elastic waves in reservoirs to the stress field is of great theoretical and practical significance for geophysical exploration of coal-bearing reservoirs in the stress field environment.
Since the 1960s, numerous scholars have begun to correlate the stress deformation of rocks with changes in their acoustic properties, conducting extensive experimental research and theoretical analysis on the propagation characteristics of sound waves in porous media, ref [4,5] particularly focusing on the variations in loading stress fields. Research on the dynamic response mechanisms of elastic waves in sandstone, mudstone, and anthracite is essential for achieving spatiotemporal dynamic exploration of conventional and unconventional reservoir properties [6,7]. Seismic and acoustic logging are important methodological techniques in the field of elastic wave exploration for oil and gas. By analyzing the propagation laws of sound waves within geological bodies, these techniques are used to determine parameters such as the location, thickness, and porosity of oil and gas layers, revealing their mineralogical distribution [8]. Many scholars have compared similar reservoirs (sandstone, mudstone) and examined the distribution of rock stress during processes such as fracturing and drilling [9,10]. They found that variations in reservoir stress due to changes in depth lead to differences in the characteristics of elastic wave velocities and attenuation responses, highlighting the sensitivity of elastic waves to the stress experienced by coal rock. It has been concluded that the wave velocity of coal rock responds to increasing stress [11,12,13,14]. Temperature significantly affects the wave velocity of coal rock, with different types and metamorphic degrees of coal rock exhibiting varying degrees of temperature influence. Coal rock with a relatively loose internal structure and higher porosity is more noticeably affected by temperature [15,16]. The elastic wave response characteristics of rocks and coal—important components of geological bodies—show multifaceted changes influenced by moisture content. Moisture content also has a significant and complex impact on the acoustic wave velocity of rocks and coal. In some sandstones with higher porosity, a lower moisture content may lead to a more pronounced decrease in wave velocity. This is because the process of water filling the pores disrupts the originally stable structural system, making the propagation path of sound waves more tortuous and increasing energy dissipation. However, when moisture content is higher, water can play a certain “coupling” role, enhancing the overall continuity of the rock, which may cause the wave velocity to increase [17]. Coal (reservoir) layers, due to their unique dual porosity and organic soft rock framework structure, inevitably exhibit unconventional response characteristics in their elastic waves. The layering and fractures also have a certain impact on wave velocity. Through acoustic wave detection of coal rock fractures and different coal rank samples, it has been observed that the P-wave velocity tends to increase with the density of macro fractures [18,19,20]. Previous research has been limited to single rock layers or single types of waves, and there remains insufficient theoretical and practical understanding of the ultrasonic longitudinal and transverse wave velocities and anisotropic characteristics of coal reservoir systems under loading conditions. Therefore, it is necessary to strengthen experimental comparative studies and analyses of the wave velocity characteristics and overall anisotropy of coal reservoir systems (sandstone, mudstone, anthracite). It is particularly important to investigate the mechanisms behind the differences in wave velocities and anisotropy of coal reservoir systems under uniaxial loading conditions in different directions and to analyze the reasons behind these phenomena.
Elastic waves (seismic and acoustic logging) are used to investigate unconventional reservoirs (such as coalbed methane and shale gas), taking conventional sandstone reservoirs as a comparison. This study delves into the response characteristics of elastic waves to in situ stress in coal-bearing reservoirs [21,22], and conducts research on the anisotropy of wave velocities, thereby proposing elastic wave sensitivity parameters related to in situ stress for various reservoirs. By exploring the mechanism of elastic wave responses to the in situ stress field in reservoirs, this research provides a theoretical basis for using elastic waves to detect and invert the in situ stress field of reservoirs.
In light of this, this paper intends to conduct simulated experimental schemes on the differences and anisotropy of elastic waves in coal-bearing reservoirs under different uniaxial loading conditions. The study will simulate the elastic wave velocity and response characteristics under different confining pressures (increased burial depth) or elevated effective stress conditions, specifically focusing on the sensitivity of elastic waves to the stress experienced by the reservoir, aiming to obtain the pressure sensitivity of wave velocities among coal-bearing reservoirs. This will facilitate the ability to distinguish between sandstone, mud shale, and anthracite reservoirs using the characteristics of elastic waves in the future. This research will provide robust experimental and theoretical support for accurately evaluating the physical properties of unconventional shale gas and coalbed methane reservoirs using elastic wave exploration methods, as well as effectively indicating the stress state experienced by the reservoirs. It holds significant foundational theoretical research value and practical guiding significance.

2. Sample Preparation and Experimental Methods

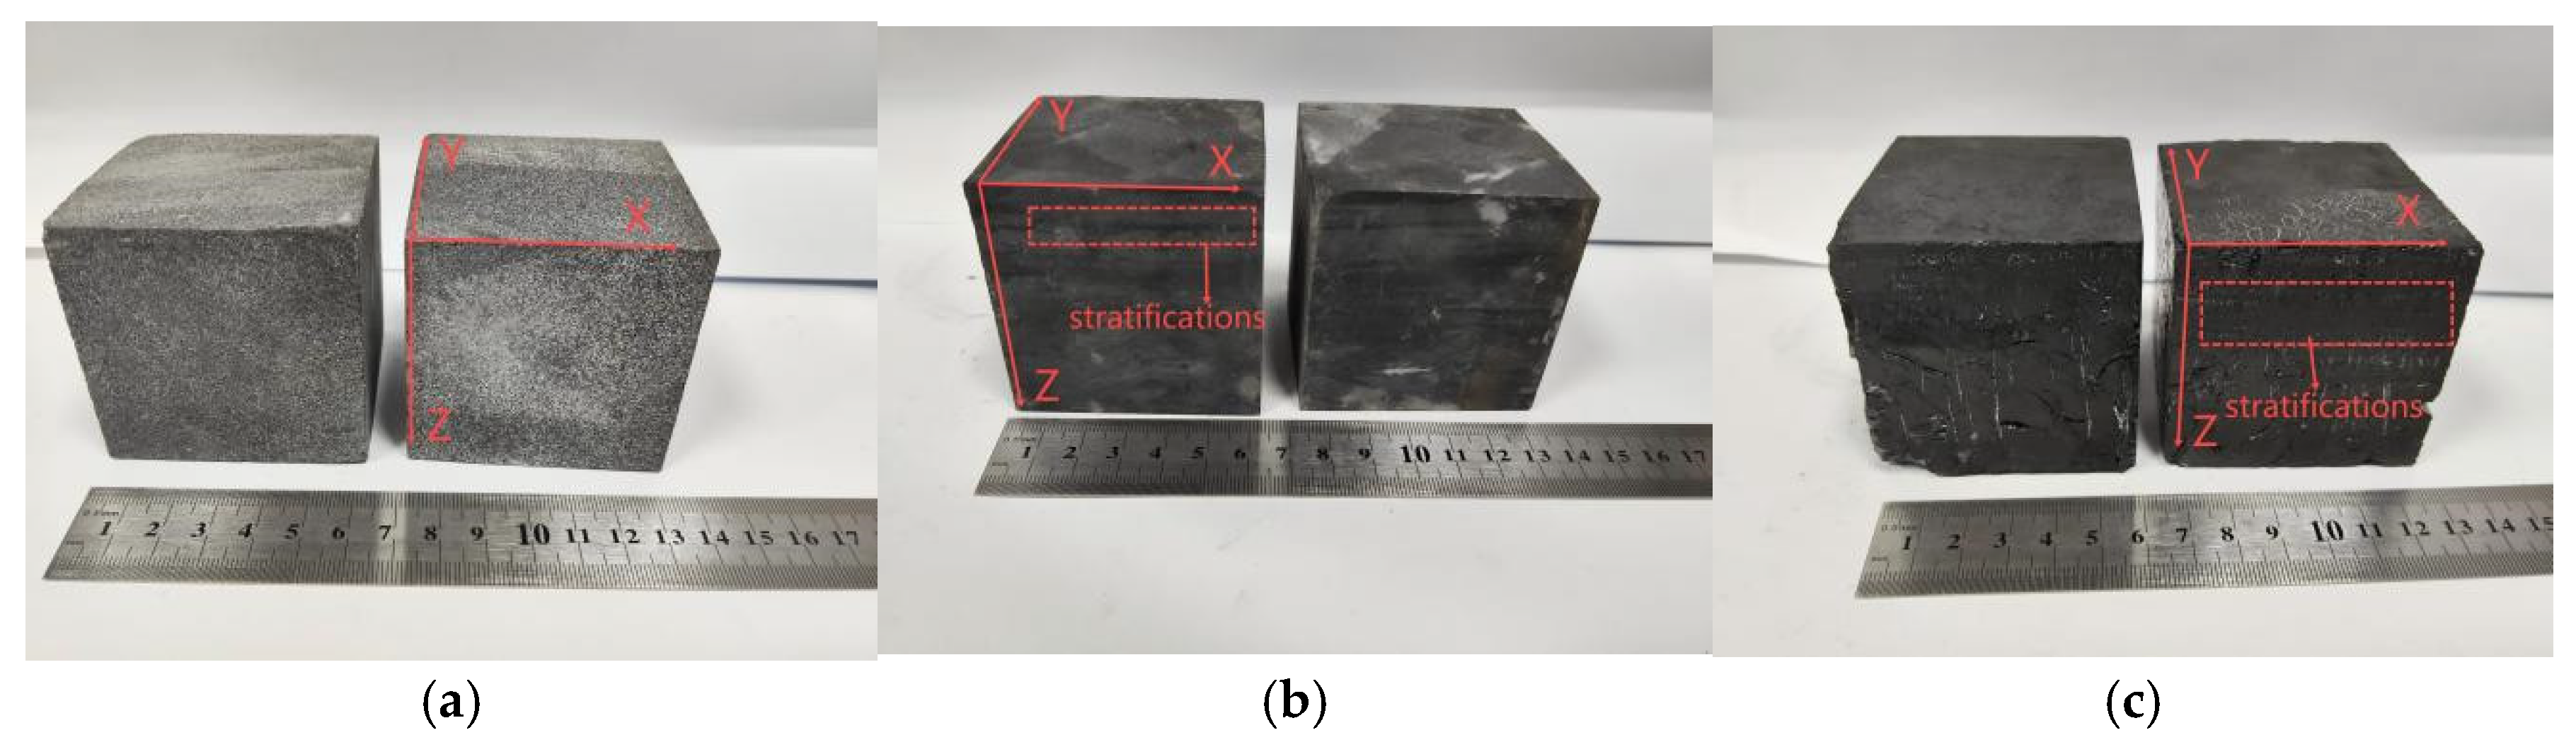
2.1. Rock Sample Collection and Specimen Preparation

The Qinshui Basin is a major coal-bearing basin in North China, containing multiple coalbed methane development strata. Its southeastern region is a typical demonstration area for high-rank coalbed methane development, recognized as one of the regions with a high concentration of coalbed methane resources, significant development potential, and the highest degree of development. The samples analyzed in this study were taken from the 3# coal seam at the 2307 coal face of the Sihe Mine in the southeastern part of the Qinshui Basin. After sampling the top and bottom strata of the extracted coal seam, rock samples (sandstone, mud shale, and anthracite) were prepared into cubes with a side length of 60 mm. The layering and joint fractures of the experimental rock samples were considered. It is evident that there are physical property differences among coal and shale samples along three orthogonal directions on the layering surface. (For sandstone, the two orthogonal directions parallel to the main fracture surface are designated as the X and Y directions, while the direction perpendicular to the main fracture surface is designated as the Z direction; for mud shale and anthracite, the two directions parallel to the layering are labeled as the X and Y directions, and the vertical direction relative to the layering is labeled as the Z direction). The samples were processed into block shapes in three directions to explore their anisotropy. The prepared samples are shown in Figure 1, and specific information about the rock samples can be found in Table 1.
At the same time, to measure the elastic stress–strain range of each rock sample, a set of standard cylindrical rock samples (50 mm in height and 25 mm in diameter) is required, consisting of one sandstone sample and two coal samples taken from three directions, labeled X/Y/Z, respectively, for preliminary testing. Since each type of sample comes from the same sampling point, it is assumed that their physical properties are consistent. The methods for controlling experimental conditions such as humidity are as follows: the rock samples collected from the surrounding rock must undergo changes in in situ humidity and other conditions during the collection and processing phases. Therefore, to ensure consistent moisture conditions for all sample types during testing, the processed rock samples are uniformly exposed to natural air conditions for a period of time (seven days, in this experiment). Subsequently, the samples are placed in a drying oven for 48 h, followed by another seven days of natural placement in an indoor environment to ensure that their moisture conditions are consistent with the indoor conditions. The cylindrical specimens are only used to test the maximum yield pressure (Pmax) but not for the wave velocity test.

2.2. Experimental Instruments and Equipment

In this experiment, the RTR-2000 high-pressure rock triaxial dynamic testing system from GCTS, Tempe, AZ, USA, was utilized, as shown in Figure 2a. The system is equipped with a complete rock ultrasonic pulse measurement experimental system—the ULT-200 ultrasonic testing system module. The principle of the ultrasonic module is illustrated in Figure 2b. The ultrasonic testing system consists of a pulse signal generator, ultrasonic transducer, amplifier, counter, and oscilloscope. The ultrasonic longitudinal and transverse wave probes used in this experiment both have a fundamental frequency of 1 MHz, as shown in Figure 2c. Notably, this system integrates a set of piezoelectric crystals (transducers) for ultrasonic P-waves and S-waves into a high-temperature and high-pressure resistant pressure head. By combining the ultrasonic probes with the pressure head, synchronous testing of the ultrasonic longitudinal and transverse waves of the rock sample during simulated pressure loading is achieved. These data are then used to invert the mechanical properties of three types of reservoir rocks.

2.3. Main Experimental Methods and Procedures

2.3.1. Main Experimental Method

The ultrasonic measurement method employs the travelling wave propagation–pulse transmission technique [23]. To ensure good coupling between the sample and the transducer, honey is used as a coupling agent, applying an appropriate amount of petroleum jelly or honey on both the top and bottom ends of the coal sample as well as on the transducer to ensure good contact. The overall measurement system error is controlled to be less than 1%; however, considering the complexity and difficulty of coal sample preparation and measurement, the systematic testing error is maintained within 3%. The wave speed is defined as the ratio of the sample length to the travel time (initial arrival time) of the ultrasonic wave passing through the sample. The velocities of longitudinal and transverse waves can be calculated using Equations (1) and (2).
V p = L t p t 0  
V s = L t s t 0
In the formula: Vp is the longitudinal wave velocity (m/s); Vs is the transverse wave velocity (m/s); L is the distance between the centers of the transmitting and receiving transducers (the size of the coal sample) (m); t P is the time taken by the longitudinal wave to travel through the sample (s); t s is the time taken by the transverse wave to travel through the sample (s); t 0 is the zero delay of the instrument system (s). The initial arrival times of the longitudinal and transverse waves ( t P , t s ) for sandstone and mud shale can be directly read from the measured waveform. However, the development of internal (micro) fractures in anthracite not only causes transverse wave splitting but also leads to wave mode conversion and multiple reflections of seismic waves, making it generally difficult to accurately read the initial arrival of transverse waves. The “polarization filtering method” proposed by Jianli Zhang [24] is used to pick up the initial arrival of transverse waves in coal. At the beginning of the testing experiment, without installing the sample, the two probes need to be directly connected, allowing the acoustic wave transmitter and receiver to make contact, thus obtaining the unattenuated longitudinal and transverse wave sub-waves. At this moment, the zero delay of the acoustic wave of the instrument system ( t 0 ) can be obtained.
First, for each block sample, a set of tests for longitudinal and transverse waves under normal pressure is conducted in the X/Y/Z individual directions. The article discusses the selection of SH waves, which propagate parallel to the layering, for S-wave testing. During the experiment, it is necessary to adjust the testing conditions for the orthogonal polarization of the S waves to obtain a stronger shear wave signal. The specific steps are as follows: when conducting acoustic wave testing on anthracite coal, at the first pressure point (0.5 MPa) during the initial phase of the acoustic wave experiment, the sound waves are measured. By rotating the block sample, the direction in which the receiver obtains the maximum energy observed (at this point, the propagation direction of the shear wave signal emitter and receiver is parallel to the layering direction). The sample is then fixed, and the acoustic wave testing is carried out under load.
Next, for the prepared cylindrical rock samples, only uniaxial compression tests are performed to obtain the stress–strain curve characteristics and compressive strength levels [25] under uniaxial loading conditions for each type of rock sample (in all directions); this allows for determining the elastic deformation range and yield point. The turning point where the rate of change of the displacement curve begins to slow down (the yield point before failure) is identified as the maximum axial loading pressure point (denoted as Pmax) for the rock sample in that direction. Based on the recorded travel times of the transmitted longitudinal and transverse waves through the rock samples, the corresponding pressure points’ longitudinal and transverse wave speeds (Vp, Vs) in three orthogonal directions under uniaxial loading conditions are used to calculate the anisotropic parameters of the rock samples. After obtaining the experimental data, further filtering analysis is carried out and the obtained waveforms are extracted. The final wave velocity experimental results were obtained using block coal rock samples. The stress–strain of the block samples was not tested. The specific experimental process is shown in the following Figure 3.

2.3.2. Main Experimental Steps

(1).
Uniaxial loading experiments were conducted on cylindrical samples, gradually and slowly increasing the axial pressure until the samples failed. This produced stress–strain curves for each type of coal rock sample and determined their compressive strength. The stress–strain curves were analyzed to ascertain the elastic deformation range and yield point (Pmax) of the coal rock samples selected. Specific testing information for the Pmax of the measured rock samples is presented in Table 2.
(2).
For each direction, tests of transverse and longitudinal wave velocities were performed on the rock samples under atmospheric pressure, obtaining the wave speed information of the tested samples at this stage.
(3).
For each rock sample, the X direction was selected as the first testing direction. Starting from the initial loading pressure point of 0.5 MPa, axial pressure loading was applied to the sample with an incremental pressure of 0.5 MPa. Each pressure point was stabilized for 1 min. before performing ultrasonic tests to acquire waveform data of the longitudinal and transverse transmitted waves under that pressure state. The pressure was then increased to the next pressure point, and the ultrasonic testing process was repeated until Pmax was reached or approached.
(4).
The above steps were repeated, sequentially conducting loading-ultrasonic experiments in the Y and Z directions. At this point, the experimental testing of one sample was completed. The same procedures were repeated to complete the uniaxial loading-ultrasound measurement experiments for each rock sample in the three orthogonal directions.

3. Experimental Results

Based on the loading tests conducted on cylindrical samples, the stress–strain curves for each type of rock sample are shown in Figure 4, Figure 5 and Figure 6, along with the maximum axial yield points listed in Table 2.
According to the stress–strain curves, acoustic wave testing can be performed on block coal rock during loading. However, to avoid sample failure during the block loading process, the actual loading pressure is slightly lower than the failure pressure.
Through ultrasonic measurement experiments conducted under uniaxial loading conditions, the longitudinal and transverse wave velocities (Vp, Vs) of rock samples in three directions, as well as the wave velocity ratio (Vp/Vs, denoted as r), can be obtained.
Overall, for sandstone measured when the loading pressure P is in the range of 0.5 to 50 MPa, Vp ranges from 3900 to 5300 m/s. Vs ranges from 2600 to 3400 m/s, and r ranges from 1.45 to 1.6. For mud shale measured when the loading pressure P is in the range of 0.5 to 36 MPa, Vp ranges from 3990 to 5050 m/s. Vs ranges from 2660 to 3350 m/s, which is comparable to the range of longitudinal and transverse wave velocities measured for sandstone; r ranges from 1.41 to 1.91. For anthracite measured when the loading pressure P is in the range of 0.5 to 12 MPa, Vp ranges from 2330 to 2500 m/s. Vs ranges from 1190 to 1400 m/s; r ranges from 1.76 to 1.98. It is evident that the longitudinal and transverse wave velocities of anthracite are significantly lower than those of sandstone and mud shale, while r is notably higher.
The range of wave velocities of rock samples in relation to pressure changes is presented in Table 3, and specific wave velocity test results are illustrated in Figure 7, Figure 8 and Figure 9. For the three types of coal rock samples, as the uniaxial loading pressure increases, the longitudinal and transverse wave velocities show a trend of initial increase followed by stability. The growth rate of sandstone wave velocities is the highest, significantly surpassing that of mud shale and anthracite. Both also demonstrate that the sensitivity of longitudinal wave velocity to pressure is stronger than that of transverse wave velocity. It can also be clearly observed that the wave velocities in the Z direction (perpendicular to the bedding) are lower than those in the other two directions. The average rate of change of sandstone Vp with increasing pressure (AVp/AP) is much greater than that of mud shale and anthracite, with mud shale being second and anthracite being the lowest.

4. Analysis and Discussion of Experimental Results

4.1. Ultrasonic Response Characteristics of Rocks Under Normal Pressure Conditions

Under atmospheric pressure conditions, ultrasonic measurements were carried out on three types of rock with a testing frequency of 1 MHz. The results of the longitudinal wave velocity (Vp) and shear wave velocity (Vs) tests for the three types of rock samples are presented in Table 4.
At atmospheric pressure (0.5 MPa), the Vp of sandstone ranges from 3900 to 4400 m/s, and the Vs ranges from 2650 to 2950 m/s; for mud shale, the Vp ranges from 3950 to 4850 m/s, and the Vs ranges from 2600 to 3300 m/s; for anthracite, the Vp ranges from 2300 to 2450 m/s, and the Vs ranges from 1150 to 1400 m/s. According to the relationship between wave speeds and density shown in Figure 10, it is obvious that the Vp and Vs of anthracite are significantly lower than those of sandstone and mud shale. Moreover, since the density of anthracite is much lower than that of other rock samples, and the Vp and Vs of mud shale are slightly higher than those of the corresponding sandstone with similar density, this illustrates the characteristic low wave speed and low acoustic impedance of anthracite. This indicates that there is a substantial difference in wave speed between lithologies with significant density differences. Given the noticeable acoustic impedance differences usually present between surrounding rocks (such as sandstone and mud shale), it is feasible to identify the presence of underground coal seams through sonic wave exploration.
Despite the relatively small density differences, the wave speeds of both sandstone and mud shale still show discrepancies, suggesting that there may not necessarily be a strong positive correlation between wave speeds and density. This is because, among rock samples with similar densities, internal structures such as fractures become the primary factors affecting wave speed. Therefore, it can be considered that the microstructural differences between different types of coal rock samples are one of the reasons for the varying characteristics of wave velocity.
Figure 10 and Figure 11 also indicate that there is a good positive correlation between Vp and Vs for each type of rock sample. It is clear that there are certain differences in the longitudinal wave speeds (Vp) or shear wave speeds (Vs) in the three orthogonal directions for each rock sample. The Vp and Vs in the direction perpendicular to the layering (Z direction) are the lowest. The average speeds in the three directions for each rock sample are generally close to the intermediate speed. Overall, the differences in Vs in the three directions for the three types of coal rock are smaller than those of Vp, indicating that the measured Vs of the rock samples generally shows weaker anisotropy compared to Vp. Among them, mud shale has much higher Vp and Vs in the X/Y directions than in the Z direction, followed by anthracite, while sandstone has the lowest due to the layered structures, fractures, and other interfacial structures present in mud shale and anthracite. Meanwhile, the microstructural differences between different coal rock samples and in different directions also control the variability in wave speed characteristics.
Figure 10 and Figure 11 also indicate that there is a good positive correlation between Vp and Vs for each type of rock sample. It is clear that there are certain differences in the longitudinal wave speeds (Vp) or shear wave speeds (Vs) across the three orthogonal directions for each rock sample. The Vp and Vs in the direction perpendicular to the layering (Z direction) are the lowest. The average speeds across the three directions for each rock sample are generally close to the intermediate speed. Overall, the differences in Vs across the three directions for the three types of coal rock are smaller than those of Vp, indicating that the measured Vs of the rock samples generally exhibits weaker anisotropy compared to Vp. Among them, the velocity of longitudinal and transverse waves in mud shale is significantly higher in the X/Y directions compared to the Z direction, followed by anthracite, while sandstone exhibits the lowest velocities. This is attributed to the layered and fractured interfaces developed within the mud shale and anthracite. In summary, the differences in wave velocity between different coal rocks are influenced not only by the layering structure but also by the internal fracture structures in different directions (perpendicular to layering/parallel to layering), which are also one of the reasons for the differences in longitudinal and transverse wave velocities.

4.2. Influence Characteristics of Loading Pressure on Wave Velocity Magnitude

4.2.1. Sandstone

Figure 7 clearly shows that both Vp and Vs in sandstone exhibit a marked staged increase with rising pressure (P) in all directions, and that within the same direction, Vp and Vs follow similar trends. In the initial stage of increasing loading pressure, the rate of wave velocity increase is relatively rapid, and then the rate gradually slows down, with wave velocities increasing in a nearly linear manner and approaching a stable maximum value with some fluctuations. This is consistent with the stress–strain behavior of rocks under uniaxial loading conditions. Based on the typical stress–strain [26] relationship of rocks under uniaxial compression (pre-failure region), it is understood that the early loading phase corresponds to the compaction stage of the rock, during which many internal micro-cracks close, and the distance between sandstone particles reduces, resulting in a faster rate of wave velocity increase. As pressure continues to rise, the rock’s compressibility diminishes and enters the elastic deformation stage, where the amplitude of wave velocity increase gradually decreases, trending towards the theoretical wave speed of the rock framework. This is because, under uniaxial loading, the porosity of the sandstone is compressed, leading to tighter contact between sandstone particles. Moreover, with further increases in pressure, internal micro-cracks gradually close, reducing porosity and contributing to greater densification of the rock. The maximum increase in longitudinal and transverse wave speeds of sandstone under pressure does not exceed 899 m/s and 454 m/s, respectively, while the highest average rate of change in pressure does not exceed 18 m/s/MPa and 9.5 m/s/MPa. Thus, the wave speed of sandstone exhibits strong sensitivity to pressure, with the measured Vp and Vs in various directions displaying a good quadratic correlation with P overall (correlation coefficients exceeding 90%) or a piecewise linear relationship. The critical pressures for the staged changes in wave speeds of both rock samples are mostly located around 15 MPa and 35 MPa.
The change characteristics of the sandstone wave speed ratio (r) with pressure is shown in Figure 12. It can be observed that during the loading process, the ratio r also exhibits a staged increase with rising loading pressure in all directions of sandstone, similar to the trend seen in wave speed. However, the relationship curve between r and P is not strictly monotonically increasing; r shows significant local fluctuations, especially around 15 MPa and 40 MPa, where the fluctuations are quite pronounced.
Sandstone is typically a heterogeneous material, containing various mineral compositions, particle sizes, and pore structures internally. Under uniaxial loading pressure, the stress distribution in different areas is uneven, leading to varying degrees of change in the rock structure across different regions.
During the initial loading phase, the pores and microcracks within the sandstone gradually become compacted. In this process, the propagation speeds of both longitudinal and transverse waves increase; however, due to the differing sensitivity of these waves to microcracks, the ratio of longitudinal to transverse wave speeds may fluctuate. As the loading pressure increases, the porosity of the coal rock gradually decreases, and the magnitude of change diminishes, causing the wave speed ratio to stabilize. Nevertheless, the local structural variations present in different directions can affect the propagation speeds of longitudinal and transverse waves in the rock, resulting in fluctuations in the longitudinal-to-transverse wave speed ratio.
As seen in Table 3, within the bearing pressure range before failure, the average change rate of Vp with respect to pressure increase (AVp/AP) is significantly higher than that of Vs (AVs/AP). As P increases, r also demonstrates a characteristic of significant increase and high average change rate. This indicates notable differences in the effects of loading pressure on wave speed among different directions of sandstone. The above results collectively demonstrate that the influence of loading pressure on sandstone Vp is more pronounced than on Vs, indicating that sandstone Vp is more sensitive to loading pressure.

4.2.2. Mud Shale

Under uniaxial loading conditions, the velocities of both compressional (Vp) and shear (Vs) waves in mud shale exhibit a slow, staged increase with rising pressure (P) in the same direction. This behavior is similar to that observed in sandstone, although the average values of Vp and Vs in mud shale are slightly higher, with a lower rate of increase in wave velocities. The effect of loading pressure on wave velocity is significantly diminished in mud shale. The maximum increases in longitudinal and transverse wave velocities under pressure do not exceed 302 m/s and 121 m/s, respectively, with the highest average rates of change in pressure not exceeding 10.1 m/s/MPa and 4.4 m/s/MPa. Therefore, in comparison to sandstone, the influence of loading pressure on the wave velocities of mud shale is notably weakened, and wave velocities generally display a lower sensitivity to loading pressure.
The wave velocity ratio characteristics of mud shale under uniaxial loading conditions can be observed in Figure 13. In comparison with the growth pattern of wave velocity ratios (r) in sandstone, the overall trend of r in mud shale shows a similar slow increase or stability, with values being more stable than those in sandstone, exhibiting only slight fluctuations between 10 MPa and 30 MPa. It can be seen from Table 3 that the average rate of change of Vp with increasing pressure (AVp/AP) is consistently higher than that of Vs (AVs/AP). Thus, the impact of loading pressure on Vp in mud shale is more pronounced than on Vs, indicating that Vp in mud shale has a stronger sensitivity to loading pressure. This is because longitudinal waves are mainly influenced by the framework and pores of the mud shale, and as pressure increases, the speed of longitudinal waves increases more rapidly. In contrast, transverse waves primarily propagate through the rock framework and are less affected by the pore structure, resulting in a relatively slower increase in velocity. During the experiment, as axial pressure increased, the fractures in mud shale closed, pores were compressed, and permeability decreased. However, significant differences in the influence of loading pressure on wave velocities between mud shale and sandstone can be attributed to differences in lithological composition and structure, with mud shale having a denser internal structure and lower porosity compared to sandstone.

4.2.3. Anthracite

In the uniaxial loading pressure range, the velocities of P-waves (Vp) and S-waves (Vs) in anthracite increase gradually with rising pressure, tending towards a stable value. Compared to sandstone and mud shale, anthracite has the smallest bearing pressure range before failure, at only 12 MPa. The influence of loading pressure on the velocities of longitudinal and transverse waves in anthracite is also relatively weak; under pressure, the maximum increases in the longitudinal and transverse wave speeds are no more than 81 m/s and 24 m/s, respectively, with the highest average rates of change in pressure being only 8.1 m/s/MPa and 2.4 m/s/MPa. In anthracite, compared to sandstone, the sensitivity of both longitudinal wave velocity and shear wave velocity to loading pressure is significantly lower. Mud shale exhibits similar characteristics to anthracite in this regard, as its sensitivity to pressure is also weaker than that of sandstone. The primary reason for this difference lies in the relatively dense internal structure of anthracite and mud shale, which is mainly composed of small pore structures. In contrast, sandstone is primarily made up of sand grains and cementing materials, characterized by larger pore spaces, resulting in greater compressibility. Additionally, the relatively low content of cementing materials in sandstone is another important factor contributing to its larger pores.
Additionally, the degree of cementation in anthracite and mud shale is generally low, resulting in weaker bonding forces between particles; under uniaxial loading pressure, such weakly cemented structures make deformation relatively easier. The considerable presence of layering and micro-cracks within anthracite and mud shale significantly affects wave speed even without loading. During the loading process, changes such as closure and compression of these layers and micro-cracks are relatively complex, and the influence of pressure on wave speed is not as direct and obvious as it is in sandstone, leading to less variation in wave speed for anthracite and mud shale, in contrast to the larger changes observed in sandstone.
As loading pressure increases, the wave speed characteristics of anthracite, illustrated in Figure 14, show an overall slow upward trend. Moreover, the average rate of change of Vp with increasing pressure (AVp/AP) is significantly higher than that of Vs, indicating that the effect of loading pressure on Vp in anthracite is more pronounced than on Vs, demonstrating that Vp in anthracite exhibits greater sensitivity to loading pressure.
In summary, based on the wave speed measurement results of sandstone, mud shale, and anthracite, it can be concluded that the low-density anthracite has the lowest bearing capacity and both longitudinal and transverse wave speeds. The sensitivity of the wave speeds of mud shale and anthracite to loading pressure are comparable, but both are significantly weaker than that of sandstone. Among the three types of reservoir rocks, the sensitivity of Vp in all three directions to loading pressure is stronger than that of Vs. These rock physical properties can provide a theoretical basis and a constructive idea for the identification of the lithology of the three rock layers using elastic wave technology.

4.2.4. Dynamic Elasticity Parameters

Since the coal rock samples tested in this paper are all block samples, it is not possible to derive stress–strain relationships or dynamic elasticity parameters. However, to explore the relationship between the mechanical elasticity parameters of the three types of coal rock samples and pressure under loading conditions, the dynamic elasticity parameters can be calculated based on the measured longitudinal and transverse wave velocities and density of the rocks [27]. The calculation formulas for dynamic elasticity parameters are provided in Equations (3)–(5).
E = 9Kμ/(3K + μ)
μ = ρVs2
K = ρ(Vp2 − 4/3Vs2)
E—Young’s modulus, in the one-dimensional case, is the proportional constant of the ratio of stress to strain, representing a measure of an object’s resistance (or deformation) to applied forces. μ—shear modulus, is the proportional constant for the shear strain that occurs under shear stress, expressed as F = μφ, where its physical significance is to resist shear strain; liquids do not exhibit shear strain, thus μ = 0. K—bulk modulus, is the proportional constant of stress to strain for an object under hydrostatic pressure. It pertains to the entire volume of the object under force; when the hydrostatic pressure is P, and the object undergoes a relative volume change θ, then P = −, where the negative sign indicates that an increase in pressure results in a decrease in volume. Therefore, the bulk modulus reflects the compressive properties of the object. Based on the previously measured longitudinal and shear wave velocities (Vp, Vs), the results of the dynamic elastic mechanical parameters (Young’s modulus, shear modulus, bulk modulus) of sandstone samples in various directions under uniaxial loading conditions, as a function of loading pressure, are illustrated in Figure 15, Figure 16 and Figure 17.
With the increase in loading pressure, the Young’s modulus, shear modulus, and bulk modulus of the three types of coal rock masses all show a certain degree of increase. However, the dynamic elastic parameters of sandstone exhibit a characteristic of phased increase, with a rapid rise in the early stage, followed by a slowdown and gradual stabilization, which is consistent with the variation characteristics of wave velocity. This can be attributed to the gradual compression and closure of rock pores and cracks under the action of loading pressure, leading to a gradual increase in dynamic elastic mechanical parameters that tend toward the inherent elastic mechanical properties of the rock framework. In contrast, the dynamic elastic parameters of mud shale and anthracite show a slow increase that gradually stabilizes, which is also consistent with the variation characteristics of wave velocity. This can similarly be attributed to the compaction effect of loading pressure on shale. It can be observed that the variation amplitude of dynamic elastic mechanical parameters of mud shale and anthracite significantly decreases with changes in pressure, while the influence of loading pressure on the dynamic elastic mechanical parameters of anthracite is relatively minimal, showing a generally weak sensitivity to loading pressure, with sensitivity decreasing in order.
This is because sandstone is primarily composed of sand grains and cementing materials. Under pressure, the contact between sand grains becomes tighter, and the pores are gradually compacted. Initially, there are many pores and micro-cracks, making the material easily deformable, resulting in a smaller Young’s modulus. As pressure reduces the pores, the material becomes denser, enhancing its ability to resist tensile or compressive deformation, thus increasing the Young’s modulus. Due to the larger pore space in sandstone, the compression of pores under pressure enhances the material’s ability to resist volumetric changes. As pressure increases, the volumetric strain (relative volume change) decreases. As the Young’s modulus, shear modulus, and bulk modulus increase, both the longitudinal wave velocity and transverse wave velocity also increase. This is because the increase in these moduli indicates an increase in material stiffness, allowing elastic waves to propagate faster through the material.
The internal structure of mud shale is relatively dense, primarily composed of small pore structures, but it still possesses a certain degree of compressibility. Pressure reduces the distance between clay mineral particles and organic matter within the mud shale, leading to a tighter arrangement and enhanced resistance to deformation, resulting in an increase in Young’s modulus. The adjustment of the microscopic structure within the mud shale enhances the bonding force between particles, making relative displacement more difficult under shear forces, thereby increasing the shear modulus. Pressure compresses the pores within the mud shale, enhancing its ability to resist volumetric changes. Although the pores in mud shale are relatively small, under sufficient pressure, the volumetric strain will still decrease, leading to an increase in bulk modulus. Similarly to sandstone, based on the relationship between wave velocity and bulk modulus, the increase in bulk modulus reflects an enhancement in the material’s elastic properties, resulting in faster propagation speeds of longitudinal and transverse waves in mud shale.
The internal structure of anthracite is dense and contains a significant amount of aromatic carbon structures. Under pressure, the interactions between these structures are enhanced, and slight changes in bond lengths and angles between atoms may occur, increasing the material’s overall ability to resist tensile or compressive deformation, thus increasing Young’s modulus. The dense structure of anthracite stabilizes its internal microscopic structure under pressure, enhancing its resistance to shear deformation as pressure increases, which leads to an increase in shear modulus. Although the compressibility of anthracite is relatively low, under the action of pressure, its internal small pores and inter-molecular gaps will still be compressed, enhancing its ability to resist volumetric changes, resulting in an increase in bulk modulus. The changes in these moduli of anthracite reflect a tighter internal structure and improved elastic properties, facilitating the propagation of elastic waves, thereby increasing wave velocity.

4.3. Influence Characteristics of Loading Pressure on Wave Velocity Anisotropy

To explore the anisotropic characteristics of longitudinal and transverse wave velocities (Vp, Vs) and the velocity ratio (r) in different directions for three types of coal rock samples, a pair of anisotropic factors, A and a, are defined; the calculation methods are detailed in Equations (6) and (7). Here, Max, Min, and Med represent the maximum, minimum, and average values of Vp (or Vs or r) in three directions, respectively. A larger value of A or a indicates a greater difference in the target values between the corresponding two directions, which means the anisotropic characteristics are more pronounced; conversely, smaller values indicate less distinction. The calculation results of the anisotropic factors for coal rock samples are presented in Table 5.
A = M a x M i n M a x
a = M a x M e d M a x

4.3.1. Sandstone

Under loading conditions, by substituting sandstone longitudinal and transverse wave velocity equations (Equations (2) and (3)), the anisotropic factors of Vp, Vs, and r for the rock samples measured in three directions can be obtained. The results are shown in Figure 18 and Table 5. Within the loading pressure range of 0.5 MPa to 46 MPa, the values of A(Vp) for sandstone range from 0.084 to 0.123, a(Vp) from 0.012 to 0.053, A(Vs) from 0.059 to 0.115, a(Vs) from 0.000 to 0.025, A(r) from 0.004 to 0.045, and a(r) from 0.001 to 0.024. It is evident that the wave velocities and velocity ratios of the measured sandstone exhibit a certain degree of anisotropic characteristics, with anisotropic indicators generally being less than 0.15 and varying with changes in loading pressure. The anisotropic characteristics of sandstone under uniaxial loading conditions are illustrated in Figure 18. It can be observed that the anisotropic characteristics of wave velocity and velocity ratio in sandstone show clear regularity. During the loading process, A(Vp), a(Vp), A(Vs), a(Vs), A(r), and a(r) of sandstone (especially A) generally exhibit a decreasing trend and tend to stabilize. This is because, in addition to differences in mineral composition, the anisotropy of rock physical properties is largely caused by differences in the distribution of internal pore and fracture structures within the rock. As the loading pressure gradually increases, the pore and fracture space in three directions of the sandstone tends to compress or close, reducing structural differences. Consequently, the differences in wave velocity (or velocity ratio) caused by pore and fracture structural differences also gradually decrease, and ultimately, the wave velocities (or velocity ratios) in the three directions will tend to reach a stable anisotropic state, which is solely attributed to inherent anisotropy caused by differences in mineral composition.
However, as shown in Figure 18, the anisotropic factors of wave velocity and velocity ratio do not exhibit an ideal monotonically decreasing trend with increasing pressure; instead, their variation process exhibits certain volatility, especially with the wave velocity ratio anisotropic factor showing more pronounced fluctuations. Within the range of loading pressure, the Vp anisotropic factor of sandstone (especially A) is generally larger than that of the corresponding Vs, indicating that the anisotropic characteristics of longitudinal wave speed are stronger than those of transverse wave speed. This suggests that the longitudinal wave speed (Vp) is a sensitive parameter that can be utilized to detect the anisotropic characteristics of sandstone physical properties.

4.3.2. Mud Shale

The measurement values of wave speed for mud shale under uniaxial loading conditions can be used to calculate the anisotropic factors of longitudinal and shear wave speeds (Vp, Vs) and the wave speed ratio (r), as shown in Figure 19 and Table 5. Within the loading pressure range of 0.5 MPa to 36 MPa, mud shale A exhibits Vp values between 0.144 and 0.182, a(Vp) values between 0.014 and 0.051, A(Vs) values between 0.161 and 0.176, a(Vs) values between 0 and 0.015, A(r) values between 0.006 and 0.064, and a(r) values between 0 and 0.026.
It is evident that the wave speed and wave speed ratio anisotropic characteristics of the measured mud shale are quite pronounced, and the anisotropic factors of mud shale Y2 are significantly higher than those of sandstone. The anisotropic features of mud shale wave speed and wave speed ratio also display certain regularities with respect to pressure; during the pressure loading process before failure, the overall changes in mud shale A(Vp), a(Vp), A(Vs), a(Vs), A(r), and a(r) are not significant, proving to be more stable than sandstone with relatively smooth fluctuations. From the aforementioned wave speed analysis, it can be determined that the effect of loading pressure on the magnitude of mud shale wave speed is generally weaker compared to sandstone. Therefore, in comparison with sandstone, the variation in anisotropic factors for mud shale wave speed and wave speed ratio is generally minor, and the anisotropic characteristics are clearly less influenced by loading pressure. The anisotropic features of mud shale wave speed and wave speed ratio exhibit generally low sensitivity to loading pressure [28].
Compared to sandstone, the anisotropic factor values for the longitudinal wave speed in mud shale are notably higher. Furthermore, the A values for longitudinal and shear wave speeds are typically much greater than the corresponding a values, indicating that in one direction of the shale, the longitudinal and shear wave speed values are significantly lower than those in the other two orthogonal directions. This is primarily due to the typical layering structure of shale, where the wave speed values in the direction perpendicular to the layering plane are markedly lower than those in the two orthogonal directions parallel to the layering plane. Consequently, the A values greatly exceed the a values. This characteristic can serve as a theoretical basis for utilizing elastic wave exploration to identify the rock properties of mud shale, shale, and other rocks with distinct layering structures. The longitudinal wave speed (Vp) can be used as a sensitive parameter to detect the anisotropic characteristics of the physical properties of shale.

4.3.3. Anthracite

The measurements of the sound velocities of anthracite under uniaxial loading conditions allow for the calculation of the anisotropy factors of longitudinal wave speed (Vp), shear wave speed (Vs), and wave speed ratio (r), as shown in Figure 20 and Table 5. Within the loading pressure range of 0.5 MPa to 12 MPa, the values for anthracite are as follows: Vp ranges from 0.021 to 0.044, a(Vp) ranges from 0.001 to 0.015, A(Vs) ranges from 0.108 to 0.127, a(Vs) ranges from 0.001 to 0.007, A(r) ranges from 0.086 to 0.096, and a(r) ranges from 0.082 to 0.092. It is evident that the measured velocities of anthracite and the wave speed ratio exhibit anisotropic characteristics, showing significant differences compared to sandstone and mud shale. The anisotropy factors (A, a) for the longitudinal wave velocity (Vp) and wave speed ratio (r) of anthracite are markedly lower than those for corresponding mud shale, while being similar to those of sandstone. In contrast, the anisotropy factor A for shear wave velocity (Vs) of anthracite is significantly greater than that of sandstone, but comparable to that of mud shale.
The anisotropy factor A for the longitudinal and shear wave velocities of anthracite is generally much larger than the corresponding a factor, indicating that in one direction (Z direction, which is perpendicular to the bedding), both the longitudinal and shear wave velocities are much lower than in the other two directions. Anisotropic characteristics are prominently exhibited in the directions perpendicular and parallel to the bedding, and the ultrasonic response characteristics in each direction are consistent. This can be attributed to the layered structure developed in anthracite, where the wave speed values in the vertical direction to the bedding planes are significantly lower than those in the two orthogonal directions parallel to the bedding planes. However, overall, this characteristic of anthracite is slightly weaker than that of mud shale, suggesting that the layered structure of mud shale has a greater impact on its wave speed anisotropic characteristics.
The presence of a layered structure in mud shale leads to significant differences in its physical properties in different directions. Along the plane of the layering, the particles within the mud shale are disposed in a relatively organized fashion. When waves travel in this orientation, they experience diminished resistance and are able to propagate with relative rapidity. Conversely, in the direction orthogonal to the layering, the particle arrangement is perturbed, giving rise to a more intricate propagation pathway, augmented resistance, and, as a corollary, a deceleration in wave velocity. The layered structure also exerts an influence on the elastic characteristics of mud shale. Owing to the existence of the layering, parameters such as the elastic modulus and Poisson’s ratio exhibit variability in diverse directions; in the direction parallel to the layering, the elastic modulus might be elevated, thereby promoting an augmentation in wave speed, while in the direction perpendicular to the layering, the elastic modulus is diminished, leading to a commensurate reduction in wave speed.
The layered structure is customarily accompanied by a directional configuration of micro-cracks and pores. These micro-cracks and pores are capable of impinging on wave propagation, engendering marked discrepancies in propagation velocities in disparate directions. In the direction parallel to the layering, micro-cracks and pores may be relatively scarce or manifest a particular distribution pattern, yielding a less pronounced effect on wave speed; nonetheless, in the direction perpendicular to the layering, micro-cracks and pores may be more concentrated, instigating a significant diminution in wave speed, thereby accentuating the conspicuous impact of the layered structure of mud shale on its anisotropic wave speed traits.
Mud shale is principally constituted of clay minerals and quartz, which typically possess greater hardness and a more compact structure. In contradistinction, anthracite is predominantly composed of carbon and exhibits a relatively porous and friable structure. The compact mineralogical architecture of mud shale engenders a lower impedance to wave propagation, permitting more expeditious transmission. In anthracite, the porous structure precipitates scattering and dissipation of wave energy, culminating in a reduction in wave speed; consequently, the wave speed of mud shale is considerably higher than that of anthracite.
Within the loading pressure range, the Vs anisotropy factors (A, a) for anthracite are generally larger than the corresponding Vp factors, indicating that the anisotropic characteristics of shear wave velocity are stronger than those of longitudinal wave velocity. It is evident that shear wave velocity (Vs) is a sensitive parameter that can be used to detect the physical property anisotropic characteristics of anthracite, exhibiting very high anisotropic intensity. This is in contrast to the sensitivity parameter for sandstone and mud shale, which is the longitudinal wave velocity (Vp).
In summary, compared to sandstone and mud shale, the transverse wave velocity (Vs) of anthracite exhibits significant anisotropic characteristics. The reasons for this are as follows: transverse waves, due to their polarization characteristics, are influenced by multiple factors during propagation in anisotropic media, such as the distribution, size, and orientation of fractures, leading to more complex propagation behaviors. In contrast, longitudinal waves have propagation directions that align with their vibration directions, making them relatively simpler and less affected by fractures. The velocity of transverse waves is highly sensitive to changes in the spatial distribution of fractures. The presence of fractures alters the propagation paths of transverse waves, which may lead to phenomena such as scattering and refraction, thereby affecting the speed of transverse wave propagation. Additionally, when transverse waves pass through differently distributed fractures, their propagation paths and vibrations are disrupted to varying extents. Thus, the speed of transverse waves is particularly sensitive to changes in the spatial distribution of fractures [29]. Fractures can induce splitting phenomena in transverse waves, and, potentially, further division can occur. This undoubtedly increases the complexity of the wave propagation process [30]. Transverse waves with different polarization directions may propagate through fractures at various speeds and in various directions, resulting in splitting. Under specific conditions, re-splitting may also occur, primarily manifesting as transverse wave splitting phenomena [31,32]. Even further splitting may arise, which is an important characteristic of the anisotropy of elastic wave velocities in rocks.
Given that transverse waves are more sensitive to anisotropic media with fractures than longitudinal waves, analyzing transverse wave velocity anisotropy can provide insights into the distribution, direction, and density of fractures. For instance, within a certain range, the degree of transverse wave velocity anisotropy in fractured media increases with the density and width of the fractures [33,34]. Thus, utilizing seismic transverse wave anisotropy can yield information on the anisotropic characteristics of reservoirs and the development and distribution of fractures, which is of significant importance for the exploration and research of fractured oil and gas reservoirs [35,36].
Because coal is classified as a soft sedimentary rock, it is very sensitive to stress. Compared to mud shale, the widespread development of numerous (micro) fracture structures, in addition to bedding structures, is another key factor in its anisotropy [37]. Therefore, coal seams can be viewed as a type of fractured reservoir. Due to the high sensitivity of transverse waves to anisotropic media with fractures, the anisotropic characteristics of the transverse wave velocity (Vs) of anthracite with numerous (micro) fractures are significantly more pronounced than those of its longitudinal wave velocity (Vp). It is evident that longitudinal wave velocity (Vp) is the more sensitive parameter for detecting the anisotropic characteristics of sandstone and mud shale, while transverse wave velocity (Vs) is the more sensitive parameter for detecting the anisotropic characteristics of anthracite. This provides both experimental and theoretical foundations for further research utilizing the seismic transverse wave anisotropic characteristics in exploring the development of fractures in coalbed methane reservoirs.

5. Conclusions

This study conducted triaxial loading acoustic wave experiments on sandstone, mud shale, and anthracite in the southeastern part of the Qinshui Basin. By comparing the sensitivity of longitudinal and transverse wave velocities to stress, as well as the anisotropic characteristics of these three types of coal rocks under normal pressure and uniaxial loading conditions, the following conclusions were drawn:
(1).
In different directions, the longitudinal wave velocity (Vp), transverse wave velocity (Vs), and wave velocity ratio of sandstone, mud shale, and anthracite all exhibit a distinct stage-wise increase with rising pressure. During the initial phase of pressure increase, the rate of wave velocity increase is rapid, but it gradually slows down and approaches a stable maximum value (theoretical rock skeleton wave velocity). This phenomenon aligns with the stress–strain behavior of rocks prior to yielding and failure under uniaxial loading conditions. The wave velocity of anthracite is relatively low, and compared to sandstone, the sensitivity of mud shale and anthracite wave velocities to loading pressure is reduced. Among the three types of reservoir rocks, Vp is generally more sensitive to loading pressure than Vs, indicating that Vp can serve as a good elastic wave indicator for predicting in situ stress states.
(2).
During the pressure loading process, the measured wave velocities and wave velocity ratios of sandstone, mud shale, and anthracite display certain anisotropic characteristics, with an overall trend of weakening and stabilizing anisotropy. The anisotropic features of wave velocities and wave velocity ratios in mud shale are stronger than those in sandstone. Conversely, the anisotropic strength of the longitudinal wave velocity (Vp) and wave velocity ratio in anthracite is significantly lower than that of mud shale, while the transverse wave velocity (Vs) demonstrates a very high degree of anisotropy. However, the sensitivity of the anisotropy of wave velocities and wave velocity ratios in mud shale and anthracite to loading pressure is relatively weak.
(3).
The anisotropic characteristics of the longitudinal wave velocity in sandstone and mud shale are stronger than those of the transverse wave velocity, whereas the anisotropic characteristics of the transverse wave velocity in anthracite are stronger than those of the longitudinal wave velocity. This is due to the higher sensitivity of transverse waves to anisotropic media with fractures. Layering structure is the primary factor contributing to the anisotropy of sandstone and mud shale, while in anthracite, the presence of numerous (micro-)fractures, in addition to layering structure, is another significant factor influencing its anisotropy.

Author Contributions

The concept was created by Z.Z., X.X. and J.L. The methodology was developed by Z.Z., X.X. and J.L. The writing—original draft was by Z.Z., L.X., X.X. and J.L. The formal analysis was completed by Z.Z., K.J. and Z.X. The investigation was the responsibility of Y.X. and D.Z., Z.Z., X.X. and J.L. reviewed and revised the manuscript. All authors have read and agreed to the published version of the manuscript.

Funding

This research is supported by the National Natural Science Foundation of China (Xiaokai Xu; 41904118, Kuo Jian; 42102218); Open Research Fund of the Key Laboratory of “Structure and Oil and Gas Resources” of the Ministry of Education (Xiaokai Xu; Grant No. TPR-2019-05).

Data Availability Statement

The original contributions presented in the study are included in the article; further inquiries can be directed to the corresponding authors.

Acknowledgments

We thank the students of Henan Polytechnic University and Jianqiang Han of the Institute of Acoustics, Chinese Academy of Sciences for their support for this experiment.

Conflicts of Interest

The authors declare no conflict of interest.

References

  1. Zhang, Z.G.; Qin, Y.; You, Z.J.; Yang, Z.B. Distribution Characteristics of In Situ Stress Field and Vertical Development Unit Division of CBM in Western Guizhou, China. Nat. Resour. Res. 2021, 30, 3659–3679. [Google Scholar] [CrossRef]
  2. Li, M.; Li, M.J.; Pan, J.N.; Gao, D.; Cao, Y.X. Coalbed methane accumulation, in-situ stress, and permeability of coal reservoirs in a complex structural region (Fukang area) of the southern Junggar Basin, China. Front. Earth Sci. 2023, 10, 1076076. [Google Scholar] [CrossRef]
  3. Markov, A.; Markov, M.; Levin, V.; Jarillo, G.R. Electromagnetic field excitation during the scattering of an acoustic wave on an inhomogeneity in a poroelastic medium. Int. J. Eng. Res. Sci. 2013, 182, 103784. [Google Scholar] [CrossRef]
  4. Khosrow, N.; Tayfun, B. Pore-scale investigation of immiscible displacement process in porous media under high-frequency sound waves. J. Fluid Mech. 2011, 680, 336–360. [Google Scholar] [CrossRef]
  5. Buishvili, T.; Kekutia, S.; Tkeshelashvili, O.; Tkeshelashvili, L. Theory of sound propagation in superfluid-filled porous media. Phys. Lett. A 2002, 300, 672–686. [Google Scholar] [CrossRef]
  6. Pothana, P.; Garcia, E.F.; Ling, K. Effective Elastic Properties and Micro-mechanical Damage Evolution of Composite Granular Rocks: Insights from Particulate Discrete Element Modelling. Rock Mech. Rock Eng. 2024, 57, 6567–6611. [Google Scholar] [CrossRef]
  7. Pothana, P.; Ifrene, G.; Ling, K. Stress-Dependent Petrophysical Properties of the Bakken Unconventional Petroleum System: Insights from Elastic Wave Velocities and Permeability Measurements. Fuels 2023, 4, 397–416. [Google Scholar] [CrossRef]
  8. Pothana, P.; Ifrene, G.; Ling, K. Integrated Petrophysical Evaluation and Rock Physics Modeling of Broom Creek Deep Saline Aquifer for Geological CO2 Storage. Fuels 2024, 5, 53–74. [Google Scholar] [CrossRef]
  9. Li, Q.; Li, Q.; Wang, F.; Wu, J.; Wang, Y. The Carrying Behavior of Water-Based Fracturing Fluid in Shale Reservoir Fractures and Molecular Dynamics of Sand-Carrying Mechanism. Processes 2024, 12, 2051. [Google Scholar] [CrossRef]
  10. Li, Q.; Li, Q.; Han, Y. A Numerical Investigation on Kick Control with the Displacement Kill Method during a Well Test in a Deep-Water Gas Reservoir: A Case Study. Processes 2024, 12, 2090. [Google Scholar] [CrossRef]
  11. Zheng, L.J.; Zhang, Z.P.; Peng, Y.; Ai, T.; Zhang, R.; Ren, L. Stress wave propagation law and dynamic elastic parameters of marble with different occurrence depth. Res. Explor. Lab. 2020, 39, 9–13. [Google Scholar] [CrossRef]
  12. Cheng, Y.; Song, Z.P.; Jin, J.F.; Chang, X.X.; Yuan, W. Variation of p-wave velocity and stress wave amplitude in sandstone under static stress. J. Yangtze River Sci. Res. Inst. 2018, 35, 115–119. [Google Scholar] [CrossRef]
  13. Zheng, G.P.; Zhao, X.D.; Liu, J.P.; Li, Y.H. Experimental study on change in acoustic wave velocity when rock is loading. J. Northeastern Univ. Nat. Sci. 2009, 30, 1197–1200. [Google Scholar] [CrossRef]
  14. Guo, F.; Yang, X.D.; Guo, L.; Lai, S.H. Multi-attribute Probabilistic Neural Network Reservoir Prediction Based on Mudstone Acoustic Time Difference Decompaction Correction. Energy Explor. Exploit. 2024, 42, 82–102. [Google Scholar] [CrossRef]
  15. Wang, P.; Xu, J.Y.; Liu, S.; Liu, S.H. Mechanical properties and ultrasonic time-frequency characteristics of thermally damaged sandstone. Chin. J. Rock Mech. Eng. 2014, 33, 1897–1904. [Google Scholar] [CrossRef]
  16. Kong, B.; Zhong, J.; Wei, J. Study on sound wave kinematic characteristics and temperature sensing mechanism during the warming process of loose coals. Energy 2024, 307, 132753. [Google Scholar] [CrossRef]
  17. Si, W.P.; Di, B.R.; Wei, J.X.; Li, Q. Experimental study of water saturation effect on acoustic velocity of sandstones. J. Nat. Gas Sci. Eng. 2016, 33, 37–43. [Google Scholar] [CrossRef]
  18. Hu, S.; Liu, W.N.; Liu, Y.M.; Liu, K. Acoustic logging response law in shales based on petrophysical model. Pet. Sci. 2022, 19, 2120–2130. [Google Scholar] [CrossRef]
  19. Guo, J.; Chen, C.M.; Cai, G.B.; Wen, H.; Li, S. Exploring Acoustic Wave Propagation and Equivalent Path in Quasi-Porous Medium of Loose Coal Mass. Nat. Resour. Res. 2024, 33, 389–403. [Google Scholar] [CrossRef]
  20. Wang, Y.; Xu, X.K.; Zhang, Y.G. Ultrasonic elastic characteristics of six kinds of metamorphic coals in China under room temperature and pressure conditions. Chin. J. Geophys. 2016, 59, 2726–2738. [Google Scholar] [CrossRef]
  21. Zhang, Y.L.; Liu, L.; Du, J.G. Research progress of rock wave velocity under high temperature and high pressure. Chin. J. Geophys. 2023, 38, 1999–2022. [Google Scholar] [CrossRef]
  22. Jana, A.; Stuedlein, A.W. Dynamic in Situ Nonlinear Inelastic Response of a Deep Medium Dense Sand Deposit. J. Geotech. Geoenviron. Eng. 2021, 147, 04021039. [Google Scholar] [CrossRef]
  23. Jiang, P.; Apfel, E.R. Measuring the frequency-dependent ultrasonic attenuation of liquids with a pulse transmission method. J. Acoust. Soc. Am. 2005, 89, 1971. [Google Scholar] [CrossRef]
  24. Zhang, J.L.; Wang, Y.; Zhang, Y.G. Application of shear wave polarization method in ultrasonic measurement of coal samples. J. China Coal. Soc. 2013, 38, 1220–1226. [Google Scholar] [CrossRef]
  25. Wang, C.; Yuan, X.P.; Wang, K.W. Constitutive equation of loading-induced elastic-plastic damage of coal and sandstone. Coal. Geol. Explor. 2017, 45, 105–111. [Google Scholar] [CrossRef]
  26. Chen, P.; Wang, E.; Chen, X.; Zhen, T.L.; Zhong, H.L.; Rong, X.S. Regularity and mechanism of coal resistivity response with different conductive characteristics in complete stress–strain process. Int. J. Min. Sci. Technol. 2015, 25, 779–786. [Google Scholar] [CrossRef]
  27. Chen, Y.; Huang, T.F. Rock Phys; Peking University Press: Beijing, China, 2001. [Google Scholar]
  28. Nikolenko, P.V.; Shkuratnik, V.L.; Chepur, M.D. The effect of limestone porosity on the velocity of p- and s-waves under mechanical and thermal loading. J. Min. Sci. 2021, 56, 695–705. [Google Scholar] [CrossRef]
  29. Bai, J.J.; Si, S.H.; Kang, Y.L.; Chen, M.J.; You, L.J.; Tao, L.; Zhu, Q.J. Investigation on the propagation characteristic of shale ultrasonic in the stress loading procedure. Prog. Geophys. Chin. 2022, 37, 2351–2363. [Google Scholar] [CrossRef]
  30. Lei, J. Impact of anisotropic and inhomogeneous medium on measuring seismic shear-wave splitting. Chin. Sci. Bull. 2017, 62, 2619–2629. (In Chinese) [Google Scholar] [CrossRef]
  31. Xu, H.; Yu, Q.Z.; Liu, J.P.; Xiao, H.J.; Cheng, F. Study on the propagation characteristics of seismic waves perpendicular to the earth-rock dam axis. Soil. Dyn. Earthquake. Eng. 2024, 186, 108907. [Google Scholar] [CrossRef]
  32. Zang, H.L.; Feng, M.; An, M.J. Evaluation and determination of anisotropic parameters using multiple shear-wave splitting analysis methods. Chin. J. Geophys. 2023, 66, 3258–3272. [Google Scholar] [CrossRef]
  33. Xu, T.; Ai, Y.S.; Wu, C.L.; Chen, L.; Fan, E.B.; Li, L.; Dong, W.Y. Subduction-Induced Asthenospheric Flow Around the Songliao Basin in NE China Revealed by Shear Wave Splitting Measurements of Dense Seismic Arrays. J. Geophys. Res. Solid Earth 2023, 128, e2022JB026075. [Google Scholar] [CrossRef]
  34. Wang, Y.; Li, C.H. Investigation of the P- and S-wave velocity anisotropy of a Longmaxi formation shale by real-time ultrasonic and mechanical experiments under uniaxial deformation. J. Pet. Sci. Eng. 2017, 158, 253–267. [Google Scholar] [CrossRef]
  35. Wei, J.X.; Zhao, J.G.; Shuai, D.; Di, B.B.; Qin, S.Y. Estimations of P- and S-wave velocities and anisotropy from measurements on artificial fractured samples. Explor. Geophys. 2018, 83, MR107–MR121. [Google Scholar] [CrossRef]
  36. Shi, P.D.; Yuan, S.Y.; Wang, T.Y.; Wang, Y.Y.; Liu, T. Fracture Identification in a Tight Sandstone Reservoir:A Seismic Anisotropy and Automatic Multisensitive Attribute Fusion Framework. IEEE Geosci. Remote Sens. Lett. 2018, 15, 1525–1529. [Google Scholar] [CrossRef]
  37. Wang, B.; Li, W.; Lu, J.; Jin, W.J.; Hu, S. Study on acoustic logging response of fractured reservoirs using a novel equivalent medium model. Acta Geophys. 2022, 6, 2695–2704. [Google Scholar] [CrossRef]
Figure 1. Experimental sample diagram: (a) Sandstone; (b) Mud shale; (c) Anthracite.
Processes 12 02819 g001
Figure 2. Experimental equipment and system schematic diagram: (a) GCTS triaxial testing system; (b) Schematic diagram of ULT-200 ultrasonic testing system; (c) High-temperature resistant pressure head integrated with longitudinal and transverse wave dual probes.
Processes 12 02819 g002
Figure 3. Flow chart of the experimental thought process.
Processes 12 02819 g003
Figure 4. Stress–strain curve diagram of sandstone.
Processes 12 02819 g004
Figure 5. Stress–strain curve diagram of mud shale. (a) 36 MPa; (b) 30 MPa.
Processes 12 02819 g005
Figure 6. Stress–strain curve diagram of anthracite: (a) 12 MPa; (b) 10 MPa.
Processes 12 02819 g006
Figure 7. Graph of longitudinal and shear wave velocities of sandstone under uniaxial loading: (a) Longitudinal wave velocity of sandstone under loading; (b) Transverse wave velocity of sandstone under loading.
Processes 12 02819 g007
Figure 8. Longitudinal and transverse wave velocity diagrams of mud shale uniaxial loading: (a) Longitudinal wave velocity of mud shale with pressure; (b) Transverse wave velocity of mud shale with pressure.
Processes 12 02819 g008
Figure 9. Graph of longitudinal and transverse wave velocities of anthracite under uniaxial loading: (a) Longitudinal wave velocity of anthracite under loading; (b)Transverse wave velocity of anthracite under loading.
Processes 12 02819 g009
Figure 10. Graph of the mean characteristics of coal rock sample density and wave velocity.
Processes 12 02819 g010
Figure 11. Characteristics of P-wave and S-wave velocities of coal rock samples.
Processes 12 02819 g011
Figure 12. Sandstone wave velocity ratio under uniaxial loading conditions.
Processes 12 02819 g012
Figure 13. Wave velocity ratio of mud shale under uniaxial loading conditions.
Processes 12 02819 g013
Figure 14. Wave velocity ratio of anthracite under uniaxial loading conditions.
Processes 12 02819 g014
Figure 15. Characteristic diagrams of dynamic elastic mechanical parameters of sandstone: (a) Young’s modulus; (b) Shear modulus; (c) Bulk modulus.
Processes 12 02819 g015aProcesses 12 02819 g015b
Figure 16. Characteristic diagrams of dynamic elastic mechanical parameters of mud shale: (a) Young’s modulus; (b) Shear modulus; (c) Bulk modulus.
Processes 12 02819 g016aProcesses 12 02819 g016b
Figure 17. Characteristic diagrams of dynamic elastic mechanical parameters of anthracite: (a) Young’s modulus; (b) Shear modulus; (c) Bulk modulus.
Processes 12 02819 g017aProcesses 12 02819 g017b
Figure 18. Anisotropic characteristic diagram of sandstone under uniaxial loading conditions: (a) Characteristic diagram of anisotropic factors of sandstone S1; (b) Characteristic diagram of anisotropic factors of sandstone S2.
Processes 12 02819 g018
Figure 19. Anisotropic characteristic diagram of mud shale under uniaxial loading conditions: (a) Characteristic diagram of anisotropic factors of mud shale Y1; (b) Characteristic diagram of anisotropic factors of mud shale Y2.
Processes 12 02819 g019aProcesses 12 02819 g019b
Figure 20. Anisotropic characteristic diagram of mud shale under uniaxial loading conditions:(a) Characteristic diagram of anisotropic factors of anthracite M1; (b) Characteristic diagram of anisotropic factors of anthracite M2.
Processes 12 02819 g020aProcesses 12 02819 g020b
Table 1. Statistical table of sample information.
Test SampleSide Length (mm)Quality/m
(g)
Density/ρ
(g/cm3)
XYZ
S162.0962.1762.05630.32.631
S262.556361.98642.62.631
Y162.056261.53618.82.614
Y262.661.6862.11624.82.605
M162.1562.662.2361.71.495
M262.6562.8663.48372.11.488
Table 2. Maximum axial yield point Pmax of specimen.
SandstoneMud ShaleAnthracite
SamplePmax(MPa)SamplePmax(MPa)SamplePmax(MPa)
XYZXYZXYZ
S1464646Y1363636M1121212
S2503850Y2303030M2101010
Table 3. Characteristic information of wave velocity of coal and rock samples changing with pressure.
SamplePressure Range
(MPa)
Vp
(m/s)
Vs
(m/s)
rAV
(m/s)
AVs (m/s) A V p A P
(m/s/MPa)
A V s A P
(m/s/MPa)
S10.5~463927~51742857~32891.45~1.58 635 ~ 802 718.5 262 ~ 438 350 13.8 ~ 17.4 15.6 5.7 ~ 9.5 7.6
S20.5~503948~52132695~33361.45~1.6 643 ~ 899 771 257 ~ 454 355.5 12.9 ~ 18 15.4 5.1 ~ 9.1 7.1
Y10.5~363995~49802664~33331.48~1.53 132 ~ 248 190 86 ~ 121 103.5 3.7 ~ 6.9 5.3 2.4 ~ 3.4 2.9
Y20.5~303981~50482610~32951.41~1.59 231 ~ 302 266.5 117 ~ 133 125 7.7 ~ 10.1 8.9 3.9 ~ 4.4 4.2
M10.5~122330~24941196~13881.76~1.97 58 ~ 76 67 18 ~ 23 20.5 4.8 ~ 6.3 5.6 1.5 ~ 1.9 1.7
M20.5~102351~24941211~13851.76~1.98 76 ~ 81 78.5 16 ~ 24 20 7.6 ~ 8.1 7.9 1.6 ~ 2.4 2
Note: The first row in the table is the minimum~maximum value, and the second row is the average value.
Table 4. Characteristics table of normal pressure P-wave and S-wave velocities of coal and rock.
SampleVp (m/s)Vs (m/s)ρ/g/cm3
XYZAverageXYZAverage
S14373 4288 3927 419629152852268628182.631
S2431442573948417328822864269528142.631
Y1477348443995453732153229266430362.614
Y2481545694141450831623163261029782.605
M1240024362330238913601370119613091.495
M2241024182351239313621361121113111.488
Table 5. Anisotropy information of wave velocity and wave velocity ratio of coal and rock samples changing with pressure.
SamplePressure Range
(MPa)
A(Vp)a(Vp)A(Vs)a(Vs)A(r)a(r)
S10.5~46 0.093 ~ 0.123 0.111 0.014 ~ 0.053 0.034 0.079 ~ 0.112 0.095 0.006 ~ 0.025 0.014 0.004 ~ 0.042 0.025 0.001 ~ 0.024 0.013
S20.5~50 0.084 ~ 0.122 0.109 0.012 ~ 0.038 0.027 0.059 ~ 0.115 0.086 0 ~ 0.007 0.004 0.004 ~ 0.045 0.029 0.007 ~ 0.04 0.025
Y10.5~36 0.148 ~ 0.182 0.167 0.014 ~ 0.023 0.019 0.162 ~ 0.176 0.166 0.002 ~ 0.015 0.009 0.006 ~ 0.025 0.143 0 ~ 0.02 0.009
Y20.5~30 0.144 ~ 0.173 0.152 0.037 ~ 0.051 0.045 0.161 ~ 0.176 0.167 0 ~ 0.004 0.002 0.053 ~ 0.064 0.06 0.002 ~ 0.026 0.017
M10.5~12 0.041 ~ 0.044 0.043 0.007 ~ 0.015 0.012 0.121 ~ 0.127 0.124 0.005 ~ 0.007 0.006 0.086 ~ 0.094 0.09 0.082 ~ 0.087 0.084
M20.5~10 0.021 ~ 0.028 0.023 0.001 ~ 0.003 0.003 0.108 ~ 0.113 0.111 0.001 ~ 0.003 0.002 0.088 ~ 0.096 0.091 0.084 ~ 0.092 0.089
Note: The first row in the table is the minimum~maximum value, and the second row is the average value.
Disclaimer/Publisher’s Note: The statements, opinions and data contained in all publications are solely those of the individual author(s) and contributor(s) and not of MDPI and/or the editor(s). MDPI and/or the editor(s) disclaim responsibility for any injury to people or property resulting from any ideas, methods, instructions or products referred to in the content.

