Article

Study on the Influence of Geological Parameters of CO2 Plume Geothermal Systems

1
CNOOC (China) Limited Hainan Branch, Haikou 570100, China
2
CNOOC South China Sea Oil and Gas Energy Academician Workstation, Haikou 570312, China
3
College of Petroleum Engineering, Yangtze University, Wuhan 430100, China
*
Author to whom correspondence should be addressed.
Processes 2024, 12(12), 2808; https://doi.org/10.3390/pr12122808
Submission received: 8 October 2024 / Revised: 29 November 2024 / Accepted: 6 December 2024 / Published: 8 December 2024

Abstract

:
At present, there are relatively few studies on the exploitation of geothermal resources in depleted high-temperature gas reservoirs with carbon dioxide (CO2) as the heat-carrying medium. Taking the high-temperature gas reservoir of the Huangliu Formation in the Yingqiong Basin as the research object, we construct an ideal thermal and storage coupling model of a CO2 plume geothermal system using COMSOL6.2 software to conduct a sensitivity analysis of geological parameters in the operation of a CO2 plume geothermal system. The simulation results show that, compared with medium- and low-temperature reservoirs, a high-temperature reservoir exhibits higher fluid temperature in the production well and a higher heat extraction rate owing to a higher initial reservoir temperature but has a shorter system operational lifetime; the influence of the thermal conductivity of a thermal reservoir on the CO2 plume geothermal system is relatively minor, being basically negligible; and the thinner the thermal reservoir is, the faster the fluid temperature in the production well decreases and the shorter the thermal breakthrough time. These findings form a basis for selecting heat extraction areas for CO2 plume geothermal systems and also provide a theoretical reference for future practical CO2 plume geothermal system projects.

1. Introduction

In recent years, substantial emissions of carbon dioxide greenhouse gasses have resulted in an escalating issue of global warming, characterized by rising sea levels and an increase in the frequency of extreme weather events. Geological storage of carbon dioxide and the advancement of geothermal energy are crucial methods for reducing carbon dioxide emissions, contributing to the mitigation of global warming [1,2,3,4,5]. The CO2 Plume Geothermal System (CPGS) is a device that integrates CO2 geological sequestration with geothermal energy production. The method utilizes CO2 as the heat transfer medium, designates the natural hypertonic reservoir as the target reservoir, and accomplishes the dual objectives of extracting deep geothermal resources and the geological storage of CO2 through the extraction of geothermal energy using CO2 [6].
The CPGS was originally suggested for use in deep, high-temperature brackish water formations or decommissioned high-temperature oil reservoirs, where low-temperature carbon dioxide is injected into various sedimentary reservoirs, including deep brackish water and oil-water formations, subsequently generating hot carbon dioxide for power generation [7,8,9,10,11,12,13]. Tian et al. [13] formulated a two-dimensional model that accounts for the non-homogeneity of cover parameters and highlighted the impact of non-homogeneous cover on CO2 fugitive emissions. Bu et al. [14] developed a two-dimensional numerical model to investigate the influence of highly porous and permeable faults on the reservoir interior, discovering that such faults impact CO2 transport and spatial distribution, thereby enhancing CO2 storage within the reservoir. Feng et al. [15] employed a two-dimensional reservoir model to examine the influence of various reservoir physical parameters on the thermal extraction rate, suggesting that reservoirs with high temperature and high permeability are preferable for the establishment of CPGSs. Xu et al. [16,17] demonstrated by numerical simulations of wellbore reservoir coupling that the benefits of CO2 as a working fluid are more pronounced in low-permeability, low-temperature reservoirs than in water. Garapati et al. [18] examined the influence of multilayered inhomogeneous reservoirs on CPGS and concluded that the mass fraction of CO2 generated is predominantly influenced by the high-permeability layer and its location within the reservoir. Moreover, as the permeability of the reservoir diminishes, the efficiency of heat extraction correspondingly declines. In conclusion, deep saline and oil-water reservoirs, together with other sedimentary reservoirs, provide abundant geothermal resources, extensive heat exchange areas, and secure geological conditions, rendering the CO2 injection heat extraction technique highly applicable.
There are fewer studies on using CO2 as a heat-carrying medium in high-temperature depleted gas reservoirs. Additionally, no systematic study has examined how the heat extraction performance of Carbon Dioxide Plume Geothermal Systems (CPGSs) changes under varying geological conditions in such reservoirs. Research is also lacking on the ability of basin CO2 plume geothermal systems to extract geothermal heat, the rate of heat extraction, and other related aspects. Therefore, this article collects, organizes, and analyzes field data from the Huangliu Formation of the Yingqiong Basin’s depleted gas reservoirs. It uses COMSOL numerical simulations for assistance. The study focuses on the Huangliu Formation of the Yinggehai Basin, which is saturated with carbon dioxide. It quantitatively analyzes the impacts of initial temperature, thermal conductivity, specific heat capacity, and the thickness of the thermal storage on the system’s long-term heat recovery performance. This research builds on prior studies to provide a theoretical reference for future practical engineering of the CPGS.

2. Modeling

2.1. Geological Conditions in the Study Area

The natural thermal reservoir of the Huangliu Formation of the Yingqiong Basin was taken as the object of study. It has a thermal reservoir thickness of ~100 m, a reservoir burial depth of 3000 m, a reservoir temperature of 150 °C, and a pressure of ~30 MPa. The Yingqiong Basin has relatively complete Cenozoic strata, comprising strata of the Ledong, Yingqiong, and Huangliu formations in turn from the top down [19]. The geothermal reservoir covers complete caprock and bedrock, which prevents CO2 spillage during operation of the CPGS.

2.2. Control Equations and Performance Evaluation Equations for Geometric Models

The full coupling between the reservoir and the temperature and seepage fields was successfully realized by using Darcy’s law and the porous media heat transfer module in the COMSOL6.2 software. The flow heat transfer control equation of the reservoir is as follows:
The CO2 continuity equation in porous media is
( φ S ρ ) t + ( ρ u ) = q
the flow satisfies Darcy’s law,
u = K μ ( p ρ g )
and the united energy conservation equation for the two phases (i.e., gas and rock) within a rock is given by
C s ρ s T s t = λ s 2 T s + w
where is the rock porosity, S is the CO2 saturation, ρ is the CO2 density (in kg/m3), u is the CO2 velocity (in m/s), q is the source–sink term of CO2 (in kg·m3/s), t is time (in seconds), p is the CO2 fluid pressure (in pascals), K is the effective permeability of CO2 (in m2), K is the permeability of CO2 (in m2), Cs is the specific heat of the rock mass (in J/(kg·K)), ρ s is the density of the rock mass (in kg/m3), Ts is the temperature (in kelvins), λs is the thermal conductivity of the rock mass (in W/(m·K)), μ is the fluid viscosity (in Pa·s), and w is the heat source within the rock mass (in W/m3).
This study assessed the heat extraction performance of CPGS by analyzing the heat extraction rate and the degree of reservoir extraction. The heat extraction rate G (measured in watts) is determined using [20].
G = F p r o ( h p r o h i n j )
where Fpro is the mass flow rate of CO2 (in kg/s), hpro is the enthalpy of CO2 in the production well (in J/kg), and hinj is the enthalpy of CO2 in the injection well (in J/kg). The (dimensionless) degree of reservoir extraction (η) represents the ratio of energy extracted from the reservoir area to its original stored energy; it is calculated using
η = V s ρ s C p , s ( T i T ( t ) ) d V V s ρ s C p , s ( T i T i n ) d V × 100 %
where Vs is the volume of the fractured reservoir area (in m3), ρ s is the density of the reservoir rock (in kg/m3), Cp,s is the isobaric heat capacity of the reservoir rock (in J/(kg·°C), Ti is the original temperature of the reservoir (in °C), and Tin is the injection temperature (in °C).

2.3. Mesh Generation and Parameter Setting

The computer specifications are Processor Intel(R) Core(TM) i5-8300H CPU @ 2.30 GHz 2.30 GHz; Machine with RAM 16.0 GB (15.9 GB available) System type 64-bit operating system and an x64-based processor (Wuhan, China). A comprehensive CPGS model was developed utilizing the geological features of the high-temperature gas reservoir in the designated area (model dimensions are illustrated in Figure 1, encompassing the injection well shot hole section, production well shot hole section, cap rock, reservoir, and bedrock). The most critical step in the numerical simulation process is to prepare a suitable mesh with acceptable accuracy. This article adopts the free-section tetrahedral grid to divide the calculation area and focuses on refining the grid around the wellbore due to the small size of the wellbore. The sparseness of the grid division has a large impact on the numerical calculation results, and the numerical simulation results are meaningful only when the increase in the number of grids does not have much impact on the calculation results, so this paper ensures the reliability of the numerical calculation results through the verification of grid irrelevance. In this article, simulations were conducted for five different grid quantities, mainly by encrypting the model with coarser, regular, finer, and ultra-fine cell sizes in the grid in the COMSOL6.2 software, including 30,000, 110,000, 230,000, 300,000, and 440,000, and the results of the calculations were validated in comparison with those of the run for 50 years at a time step of 0.5 a. The results of the simulations are shown in Figure 1. Table 1 gives the temperatures and times when the system is run for 50 years at different numbers of grids; as can be seen from the table, the temperature at the outlet of the modeled production wells for 50 years tends to stabilize when the number of grids is greater than 229,423, and the temperature at the outlet of the modeled production wells varies when the number of grids is less than 229,423. Therefore, the number of meshes divided for the model in this paper is 229,423, which is appropriate and proves the reliability of meshing.
At the onset of the model, the cap rock temperature adheres to the geothermal gradient distribution of the research area, while the reservoir temperature is set at 150 °C. The upper and lower boundaries of the model are designated as flow-free and possess an adiabatic condition. Furthermore, the model dimensions and thermophysical characteristics of the cap rock, bedrock, and reservoir are established as indicated in Table 2.

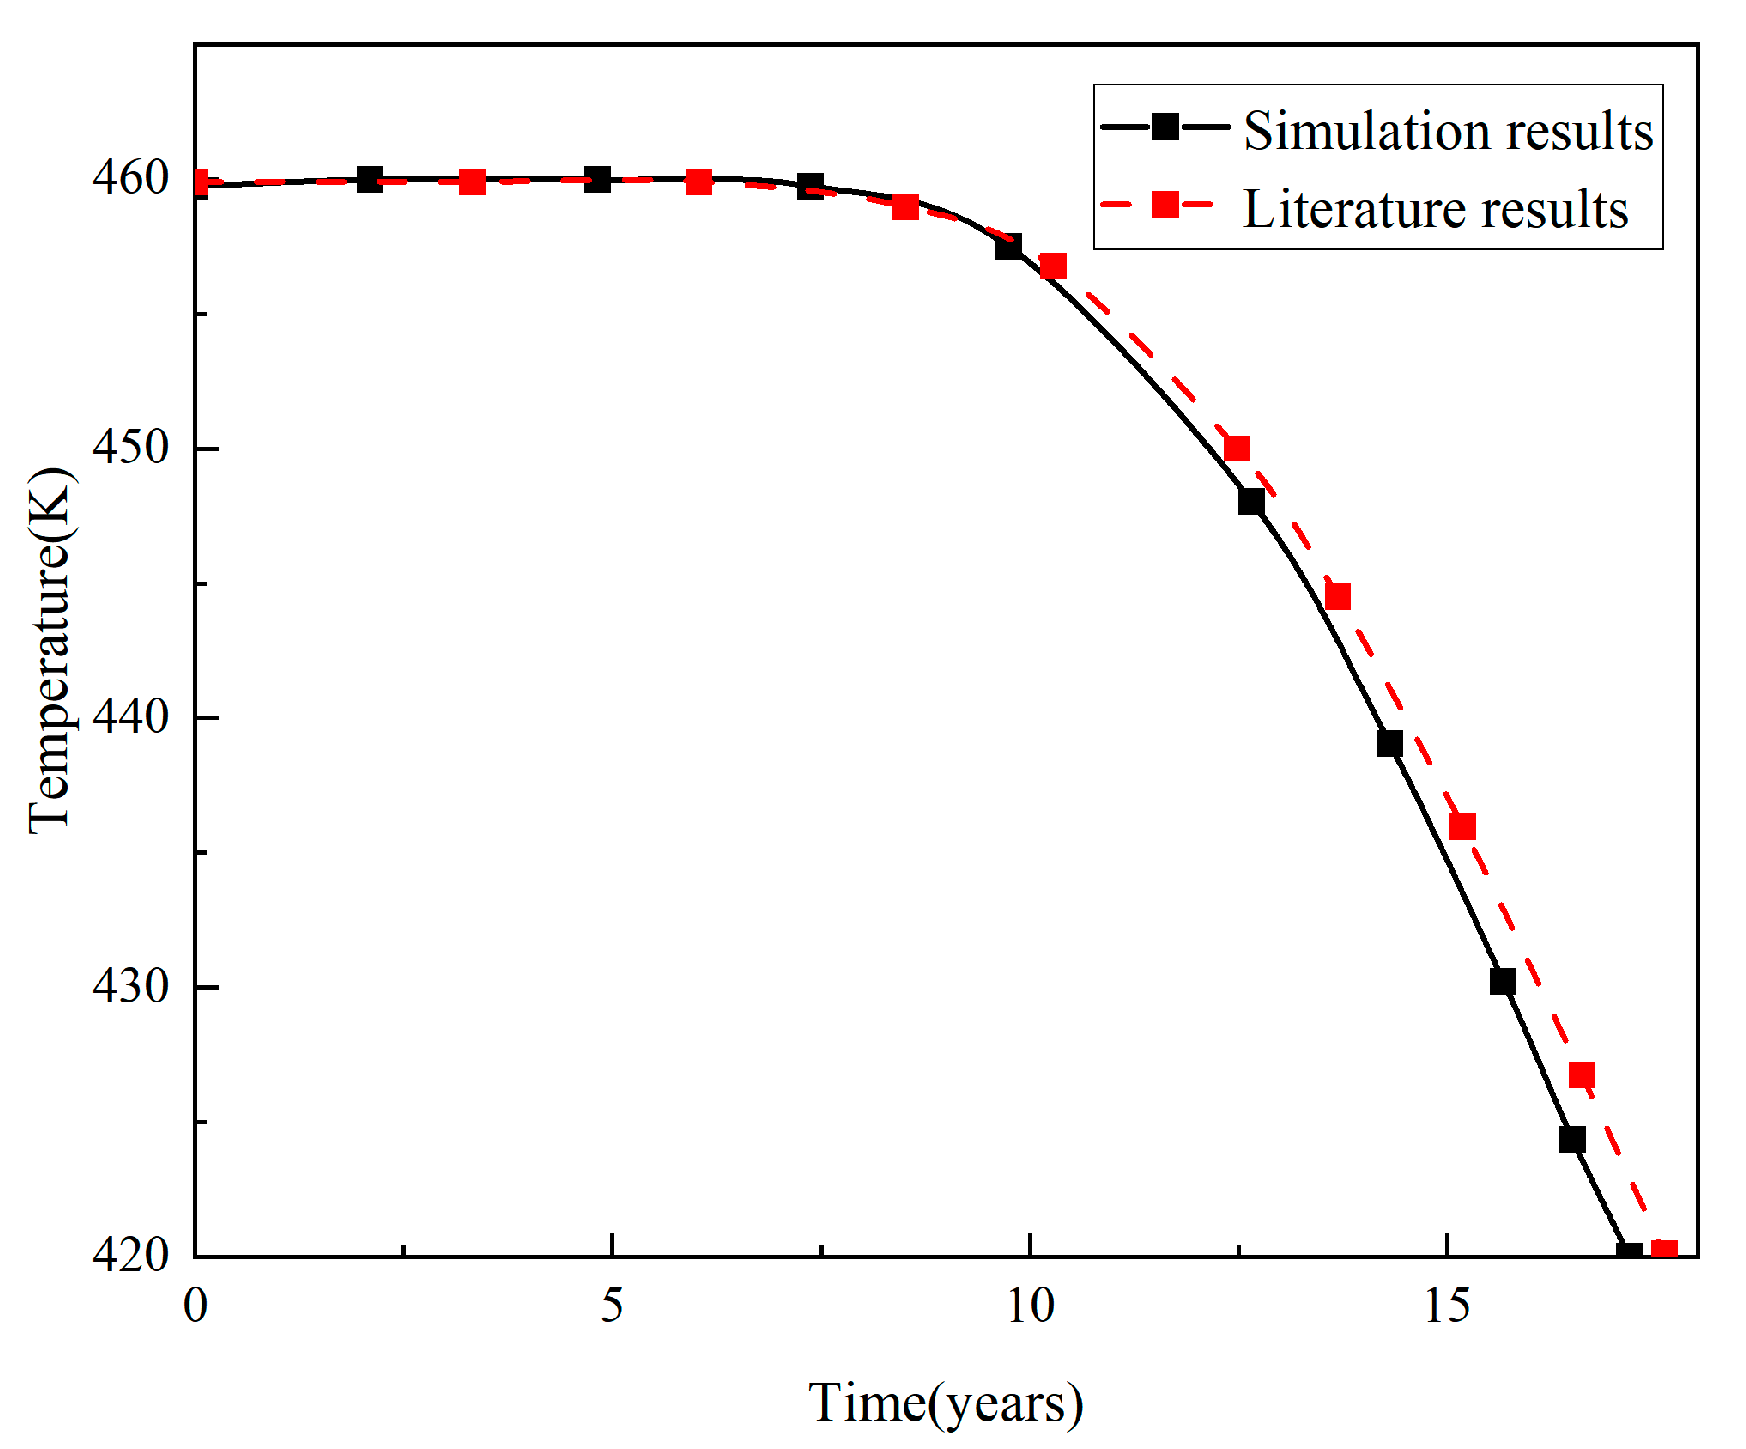
2.4. Numerical Calculations and Model Validation

The study utilizes COMSOL Multiphysics numerical analysis software for multi-physics fields to solve the mathematical model. The PDE module was utilized to formulate each of the specified equations, the interpolation function was employed to delineate the physical property parameters of CO2, and the model was validated to confirm the accuracy of the numerical computations.
Cao et al. streamlined the artificial reservoir featuring EGS fracture architecture into a thermal reservoir characterized by homogeneous porous media and conducted numerical simulations of the CO2-EGS thermal extraction process [7], accounting for variations in the physical attributes of CO2. In the literature, the model divides the subsurface portion of the EGS into three subregions with different properties: (i) injection and production wells with open flow channel characteristics; (ii) thermal reservoirs with porous media characteristics; and (iii) rock bodies surrounding thermal reservoirs with negligible permeability. The literature model does not take into account the effect of reservoir initial water, and the system circulating fluid is only single-phase CO2. The article uses the production well extraction temperature as a standard of comparison, and under the conditions set in the literature, it takes about 17.2 years to reduce the temperature of the production fluid to 420 K. The circulating fluid in this paper is also only single-phase CO2, and by setting the model in this paper with the same initial and boundary conditions as in the literature, it takes about 17.6 years for the modeled production fluid temperature to be lowered to 420 K. Examination of the deviations between the literature and the simulation records reveals that some of them are higher, at about 0.64%. In summary, it can be concluded that the simulation results of the article coincide with the results of the literature, proving that the model developed in this paper is accurate and reliable, this is shown in Figure 2.

3. Sensitivity Analysis of Geological Parameters

During CO2 extraction of geothermal heat, the fluid temperature of the production well (defined as the exit temperature of the injection section) and the rate of heat extraction are critical metrics for assessing the efficacy of heat extraction from the CPGS’s thermal storage. This article presents numerical simulation studies of CO2-saturated high-temperature gas reservoirs and conducts sensitivity analyses of geological parameters for CPGS thermal reservoirs, focusing on the fluid temperature of production wells, the heat recovery rates, and the timing of thermal breakthrough, defined as a decrease of 1 °C in the fluid temperature of production wells. The impact of several parameters, including starting reservoir temperature, thermal conductivity, specific heat capacity, and thickness of the thermal reservoir, on the long-term heat recovery performance of CPGS thermal reservoirs was examined comprehensively.

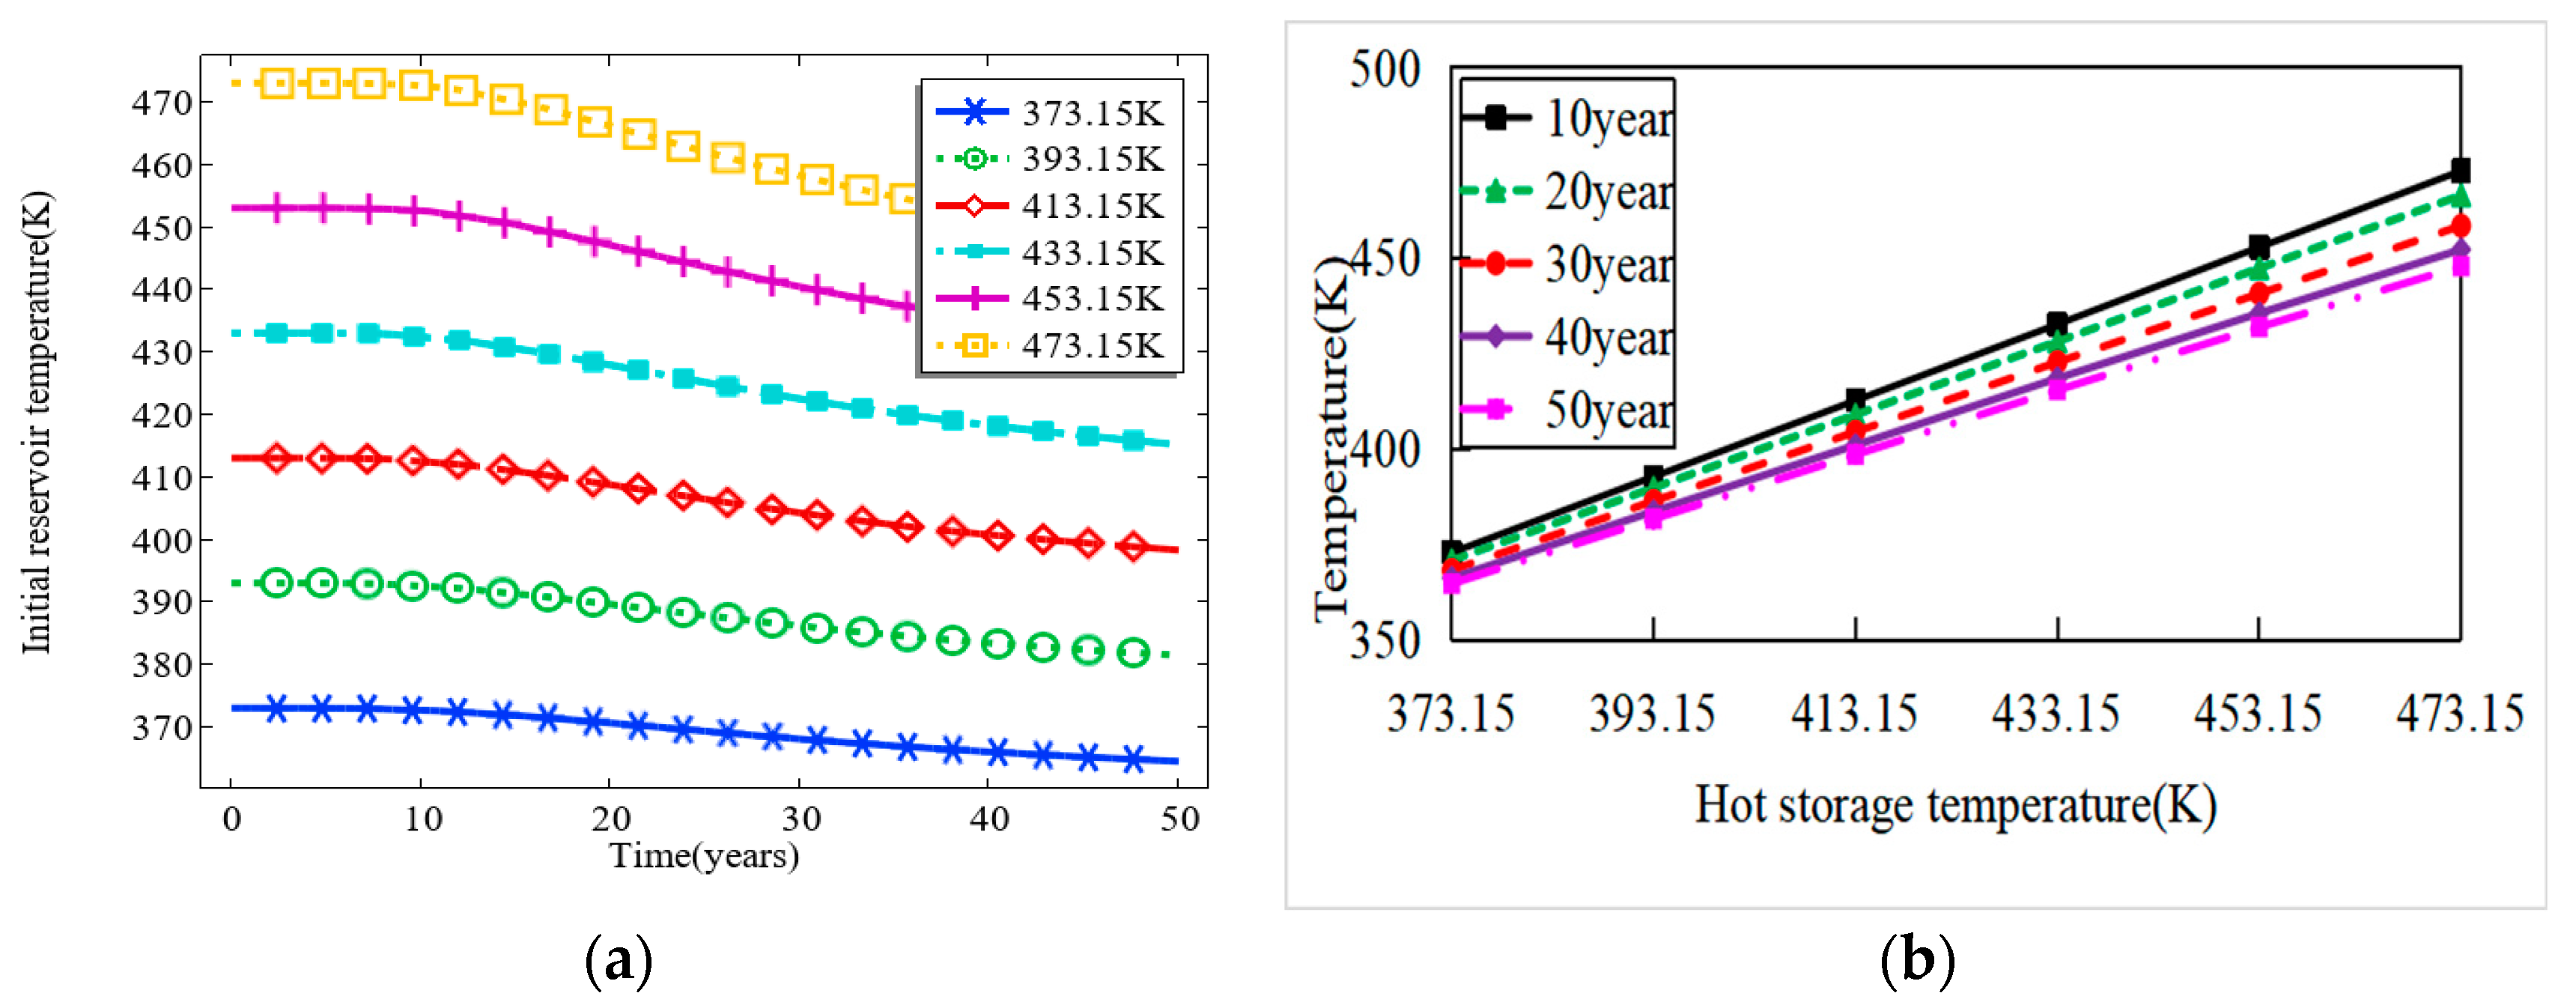
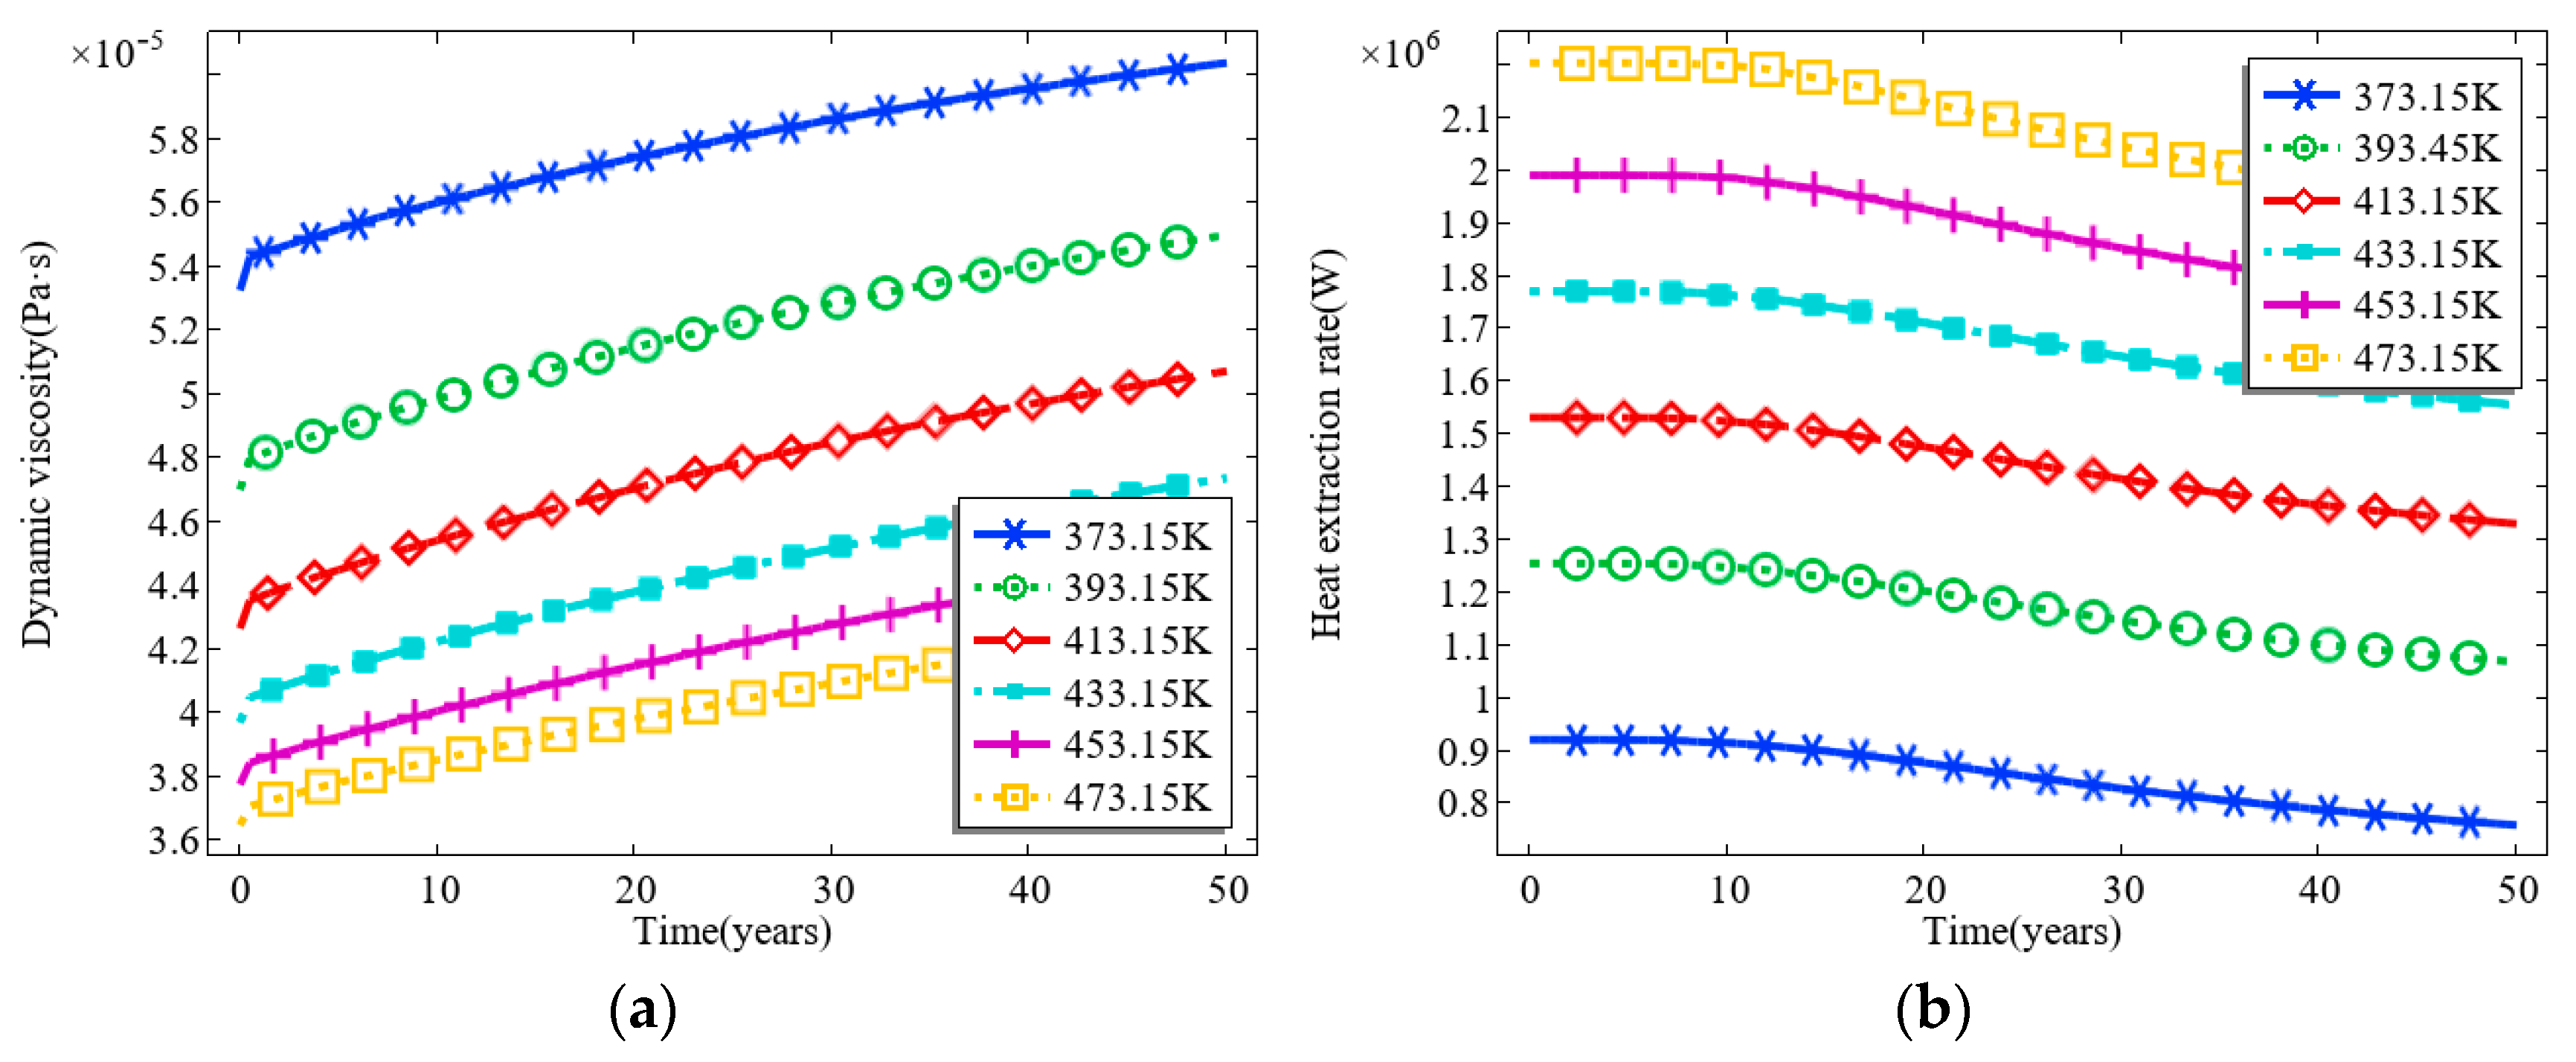
3.1. Effect of Initial Temperature of the Thermal Reservoir

We performed simulations to examine the influence of the thermal reservoir’s initial temperature on the fluid temperature in the production well and the heat extraction rate, utilizing six scenarios with initial temperatures of 373.15, 393.15, 413.15, 433.15, 453.15, and 475.15 K. In the simulation, only the initial temperature of the thermal reservoir was modified to establish the correlations between the heat extraction rate and the fluid temperature in the production well, as illustrated in Figure 3. The figure illustrates that an increase in the reservoir’s starting temperature correlates with a rise in both the fluid temperature in the production well and the heat extraction rate. As the initial temperature of the reservoir rises from 373.15 to 475.15 K, the fluid temperature in the production well escalates from 372.80 to 472.68 K, and the heat extraction rate surges from 0.915 × 10⁶ to 2.199 × 10⁶ W following a decade of CPGS operation; after 50 years of CPGS operation, the fluid temperature in the production well rises from 364.64 K to 447.71 K, and the heat extraction rate escalates from 0.759 × 10⁶ W to 1.93 × 10⁶ W. The total rise in the system’s heat extraction rate is substantial during both operational periods. The research indicates that the heat extraction efficiency of the CPGS is significantly correlated with the reservoir’s initial temperature. Consequently, increasing the initial temperature of the reservoir will positively influence the long-term heat extraction of the CPGS. Thus, the starting temperature of the reservoir serves as a crucial determinant for identifying a future heat extraction zone.
Figure 3a illustrates that the initial temperature of the thermal reservoir minimally influences the thermal breakthrough time; however, once thermal breakthrough occurs, a higher initial reservoir temperature correlates with a more rapid decline in the temperature of the production fluid. Figure 4a illustrates the temporal fluctuation in CO2’s dynamic viscosity in the reservoir at various beginning temperatures. The higher the initial reservoir temperature, the bigger the temperature differential between the CO2 and the reservoir, resulting in a reduced dynamic viscosity of the flowing CO2 within the reservoir. The increased fluidity of the CO2 in the reservoir correlates with an elevated heat extraction rate of the system, hence enhancing the heat energy absorbed by the CO2 from the reservoir. The higher the initial temperature of the reservoir, the more rapidly the temperature of the production fluid diminishes [21,22]. As can be seen in Figure 3b, the outlet temperature tends to increase as the initial temperature of the thermal storage increases. When the initial temperature of the thermal storage increased from 373.15 K to 473.15 K, the exit temperature of the production well increased from 372.80 K to 472.68 K in 10 years of operation, and the exit temperature of the production well increased from 364.64 K to 447.71 K in 50 years of operation, both of which were high overall increases. Heat recovery performance is directly related to the initial temperature of the thermal storage, so exploring thermal storage with higher initial temperature has a positive effect on long-term heat recovery.
Figure 4b illustrates the fluctuation in the heat extraction rate about the initial temperature of the thermal reservoir. The illustration indicates that the system’s heat extraction efficiency is significantly influenced by the initial temperature of the thermal reservoir. As the reservoir’s initial temperature rises, the rate of heat extraction from the reservoir increases correspondingly. Consequently, a thermal reservoir with an elevated beginning temperature enhances the system’s heat extraction efficiency.

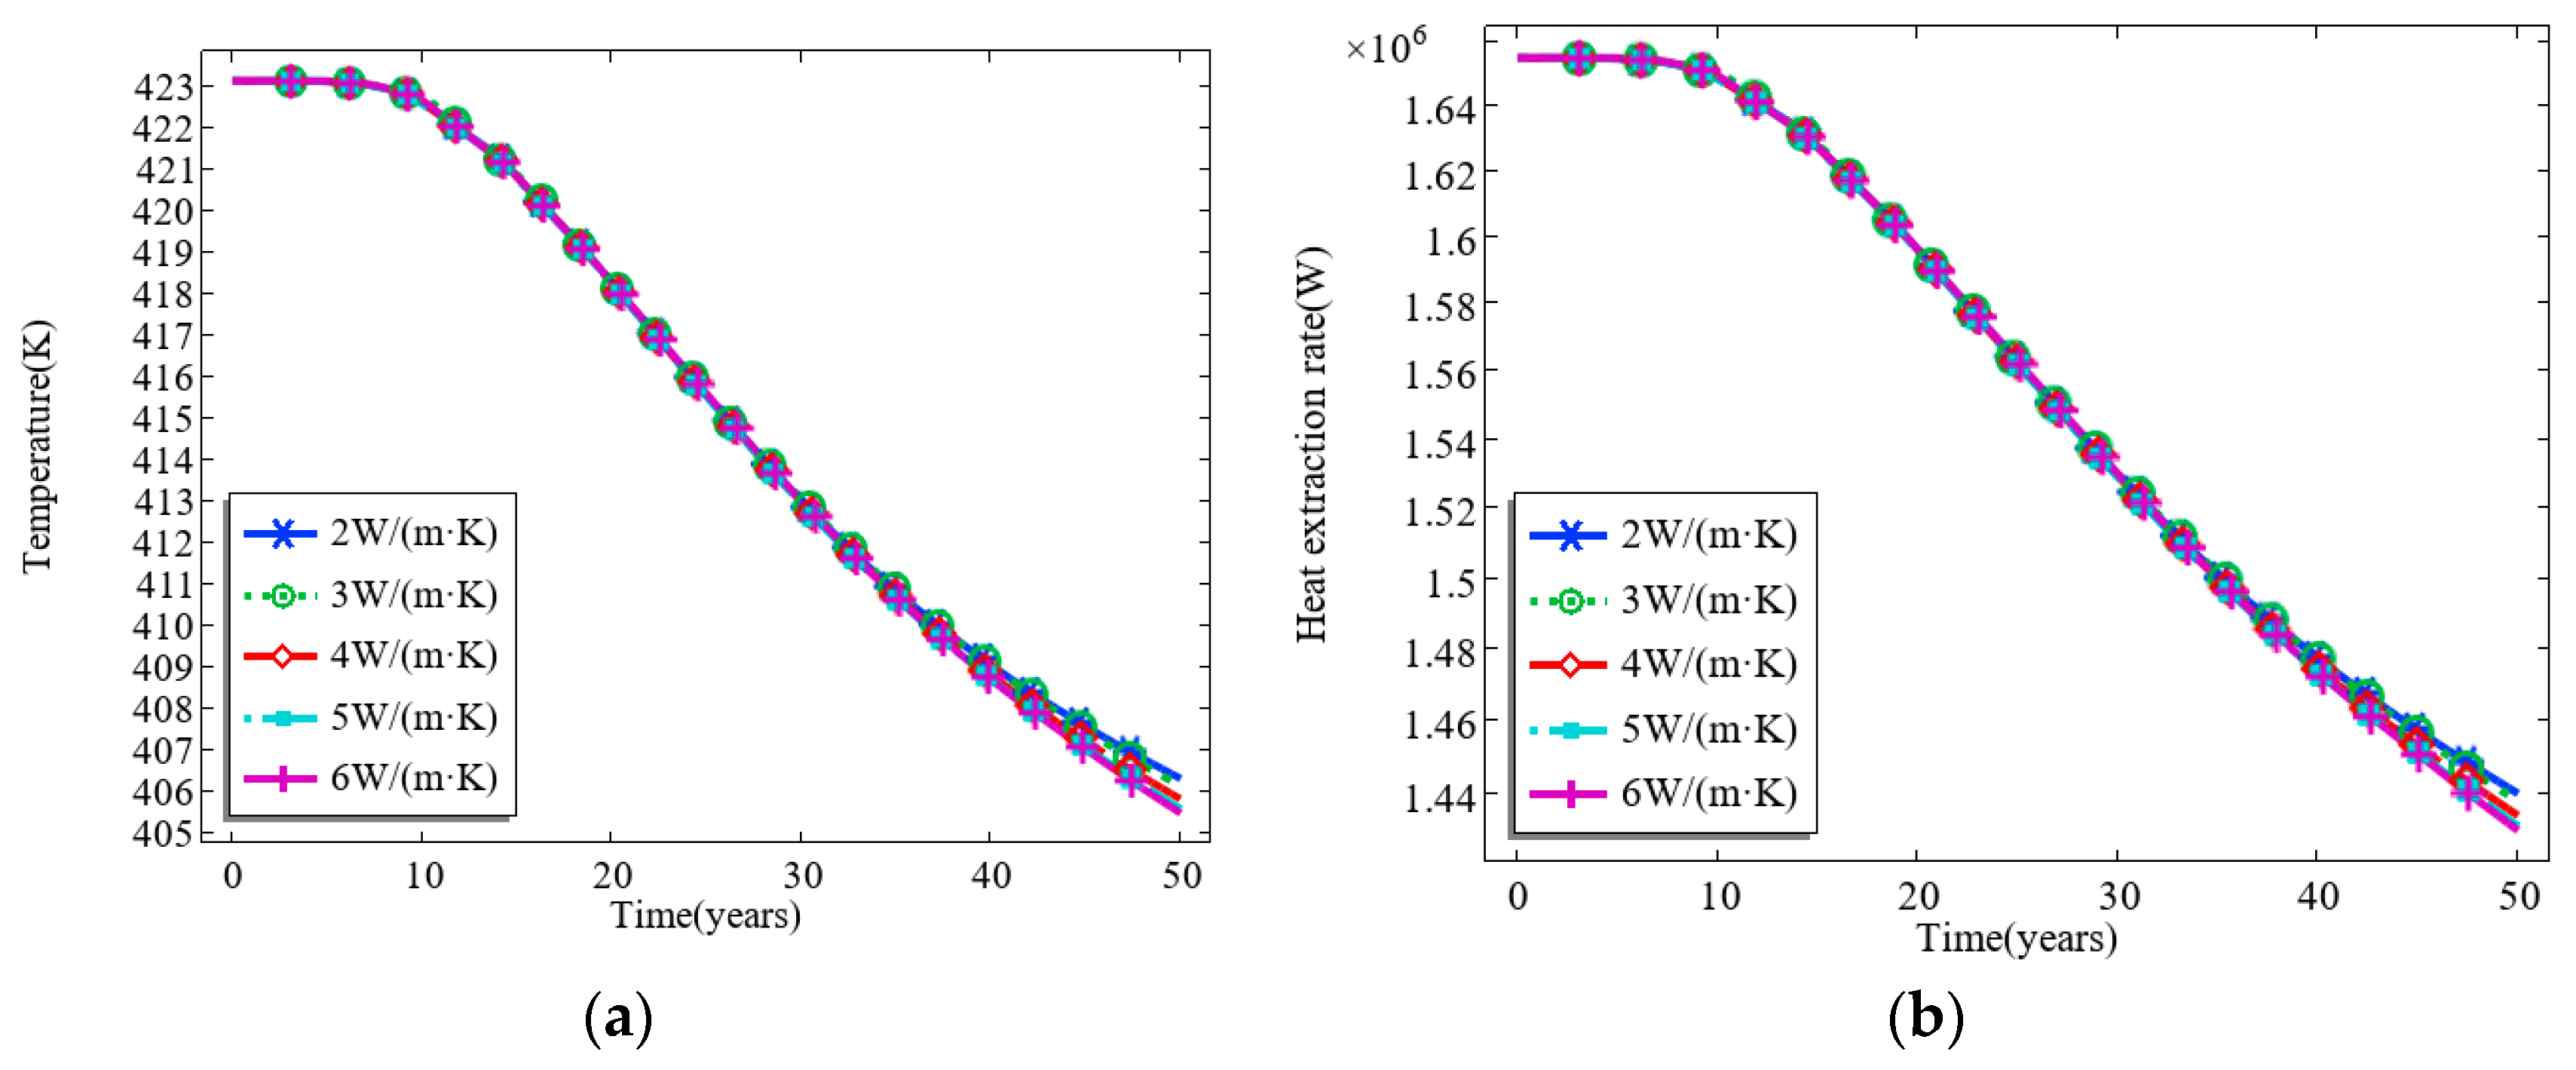
3.2. Effect of the Thermal Conductivity of the Thermal Reservoir

We conducted simulations to examine the impact of the thermal conductivity of a thermal reservoir on the heat extraction rate and fluid temperature in a production well utilizing five scenarios with thermal conductivity values of 2, 3, 4, 5, and 6 W/(m·K). In the simulation, only the thermal conductivity of the thermal reservoir was altered to establish the correlations between the heat extraction rate and the fluid temperature in the production well, as illustrated in Figure 5.
As the thermal conductivity rises from 2 to 6 W/(m·K), the fluid temperature in the production well escalates from 422.64 to 422.69 K, and the heat extraction rate advances from 1.6489 × 10⁶ to 1.6496 × 10⁶ W following a decade of system operation; after 50 years of system operation, the fluid temperature in the production well diminishes from 406.31 K to 405.47 K, and the heat extraction rate declines from 1.4403 × 10⁶ W to 1.4302 × 10⁶ W. Overall, both the heat extraction rate and the fluid temperature in the production well diminish with prolonged system operating time; additionally, a lower thermal conductivity of the thermal reservoir correlates with a lesser reduction in outlet temperature and heat extraction rate. With the thermal conductivity of the thermal reservoir at 2 W/(m·K), the fluid temperature in the production well diminishes by 10.9%, and the heat extraction rate declines by 12.6% after a period of 10 to 50 years of system operation. With a thermal conductivity of 6 W/(m·K), the fluid temperature in the production well diminishes by 11.5%, and the heat extraction rate declines by 13.3% throughout a system operation period of 10 to 50 years. These decreases occur because the thermal conductivity of the thermal reservoir rock mass increases, allowing heat to be more readily conducted to the injected low-temperature CO2, which leads to a more rapid decline in the temperature of the thermal reservoir and the fluid temperature in the production well. Nevertheless, the disparity in thermal conductivity of the thermal reservoir exerts a negligible influence on exploitation [23].

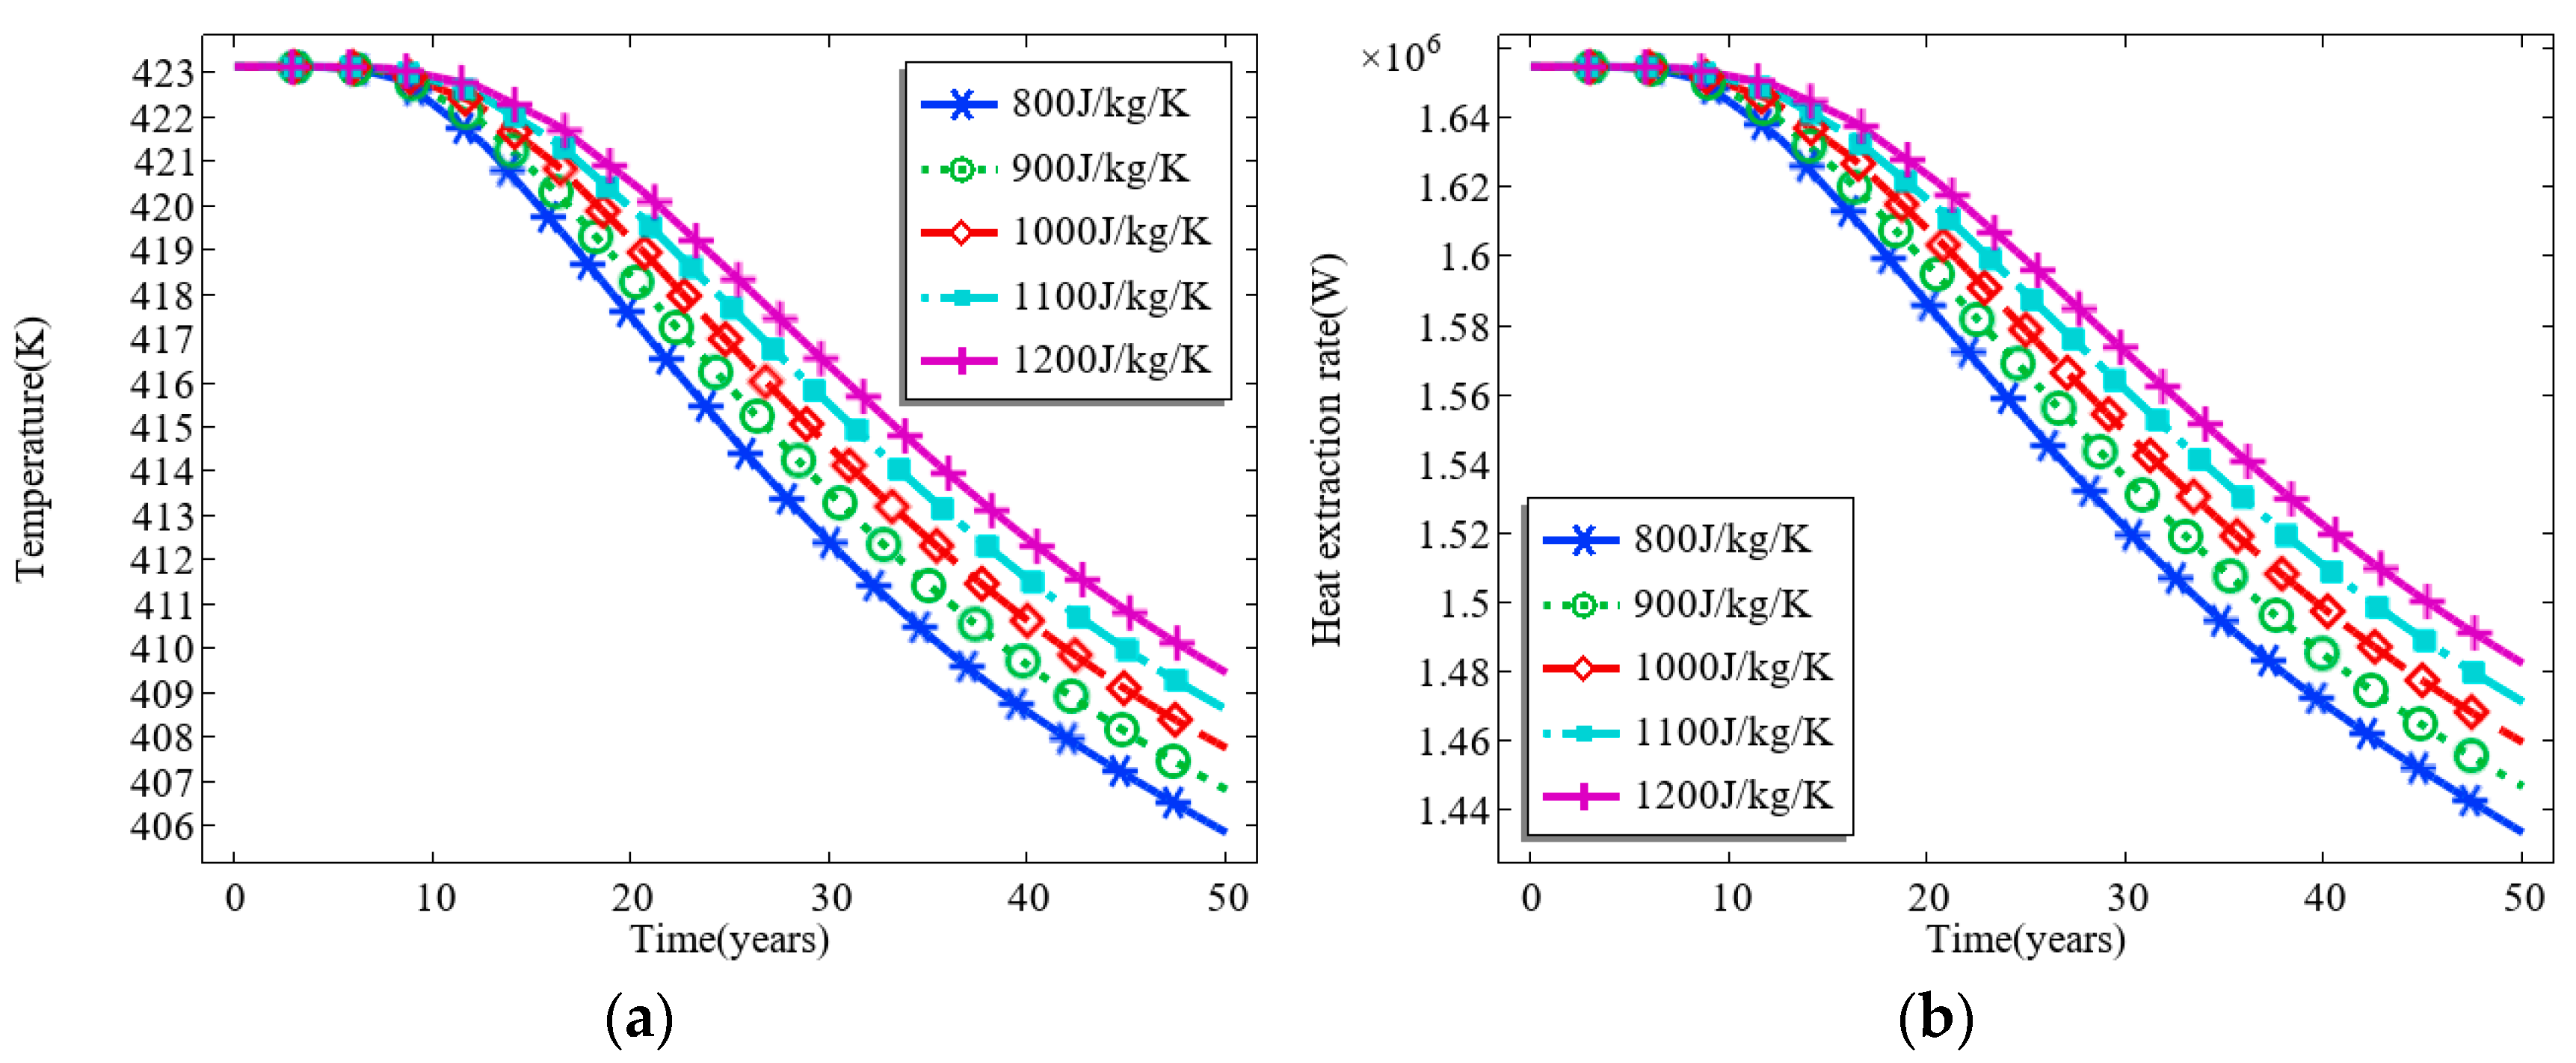
3.3. Effect of the Specific Heat Capacity of the Thermal Reservoir

We conducted simulations to examine the influence of the thermal reservoir’s specific heat capacity on the heat extraction rate and fluid temperature in the production well, utilizing five examples with specific heat capacities of 800, 900, 1000, 1100, and 1200 J/(kg·K). In the simulation, only the specific heat capacity of the thermal reservoir was modified to establish the correlations between the heat extraction rate, the fluid temperature in the production well, and the specific heat capacity of the thermal reservoir rock, as illustrated in Figure 6. The figures indicate that, as the specific heat capacity of the thermal reservoir increases, it releases greater heat energy per unit temperature. Consequently, the temperature of the injected CO2 rises more significantly, resulting in a higher fluid temperature in the production well, an extended operational lifespan of the reservoir, and an enhanced heat extraction rate [24,25].

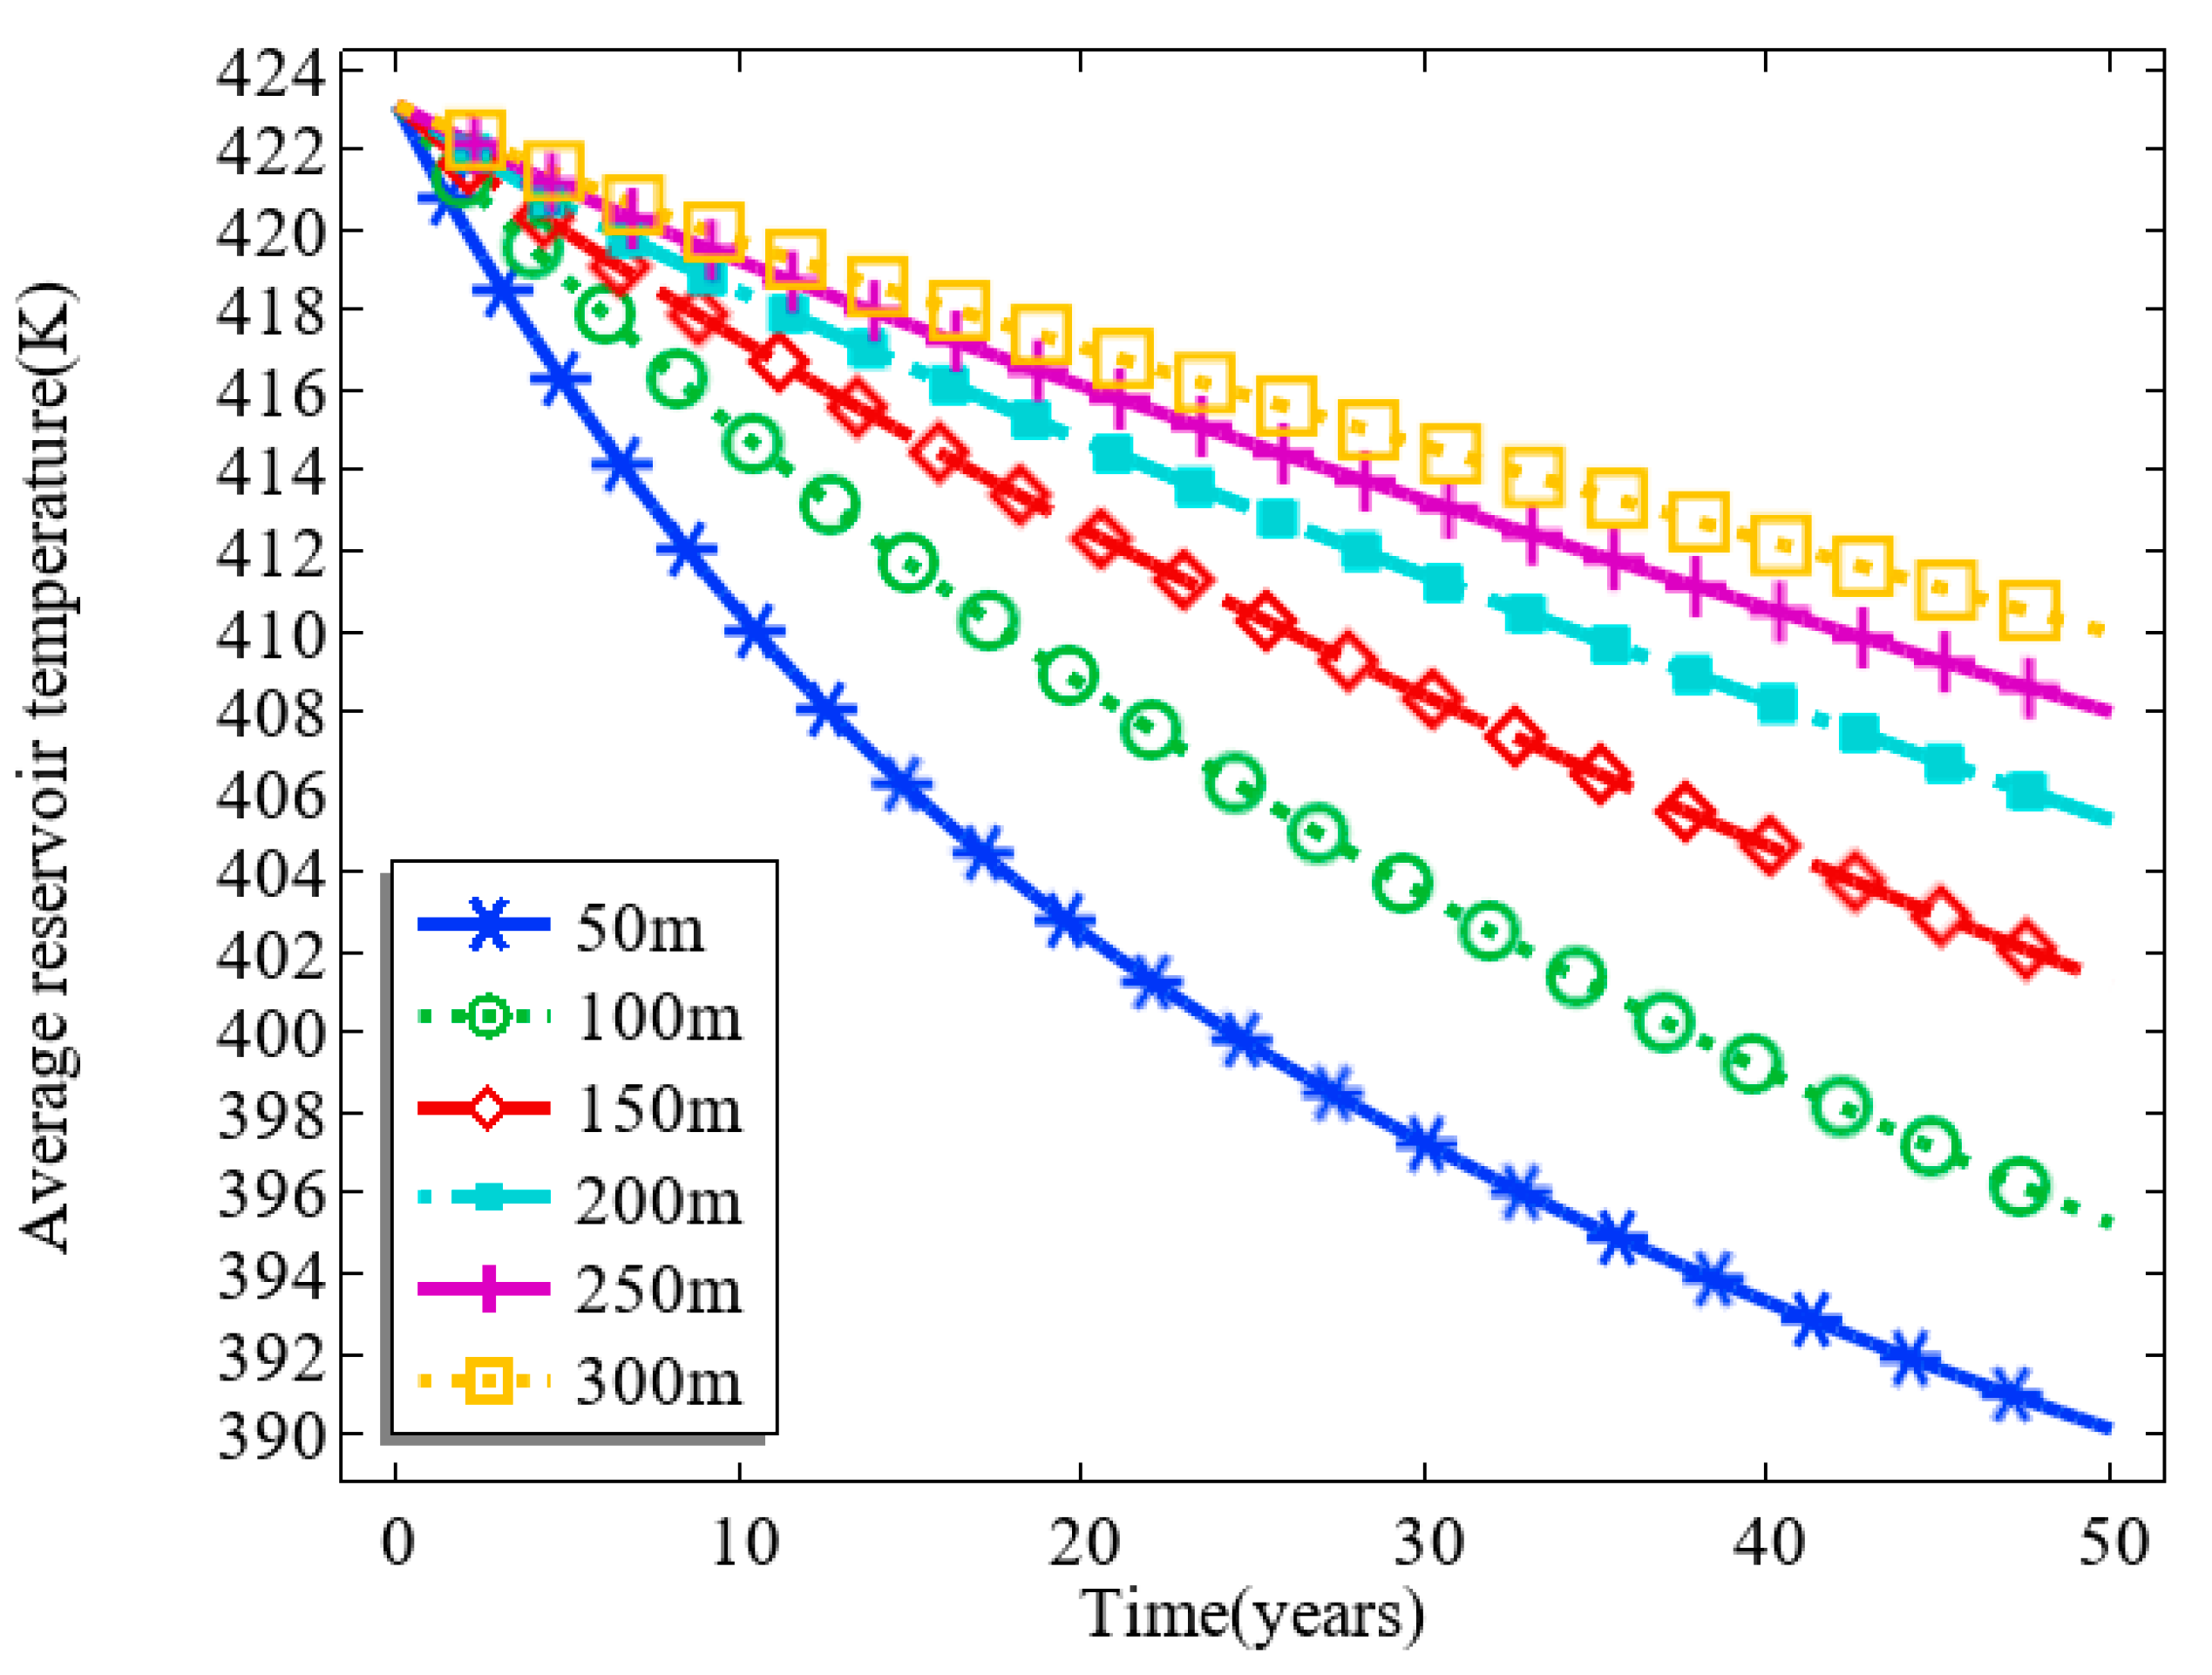
3.4. Effect of the Thickness of the Thermal Reservoir

To investigate the effect of the thermal reservoir’s thickness on CO2 heat extraction, we set six different thermal reservoir thicknesses (i.e., 50, 100, 150, 200, 250, and 300 m) with all other parameters remaining unchanged, with the perforation section within the thermal reservoir always being located at the center of the thermal reservoir. Figure 7a shows the graph of the fluid temperature in the production well over time at different thermal reservoir thicknesses.
From Figure 7a, it can be seen that the fluid temperature in the production well decreases with the increase in operation time at different thermal reservoir thicknesses. However, the thinner the thermal reservoir is, the faster the fluid temperature in the production well decreases. When the thickness of the thermal reservoir is 50 m, after 50 years of system operation, the fluid temperature in the production well is 390.31 K, which is 21.89% lower than the output temperature in the stable production period. In contrast, when the thickness of the thermal reservoir is 300 m, after 50 years of system operation, the fluid temperature in the production well is 420.43 K, which is only 1.81% lower than the output temperature in the stable production period. The thickness of the thermal reservoir is closely related to its thermal capacity, and a thicker thermal reservoir usually has a greater thermal capacity, which means it can store more thermal energy. Therefore, with other conditions remaining unchanged, the thicker the thermal reservoir is, the longer the stable operation time of the CPGS and the greater the stability of the system [26,27]. At the same time, it can be seen that in the shot hole section length of 50 m, the reservoir thickness from 50 m to 250 m changed the thermal storage development effect significantly; when the thickness is greater than 250 m, the increase in the thickness of the thermal storage development effect is almost unchanged. Therefore, the controllable thickness of the thermal reservoir is 250 m when the length of the perforation section is 50 m.
Figure 7b illustrates the fluctuation in thermal breakthrough time of the CPGS across various thermal reservoir thicknesses. The thickness of the thermal reservoir directly correlates with an extended thermal breakthrough period. The thermal breakthrough occurs in 9 years when the thickness of the thermal reservoir is 50 m. With a thermal reservoir thickness of 300 m, the thermal breakthrough period extends to 31.5 years.
Figure 7a shows the temperature of the fluid in the production well, and Figure 8 shows the temperature of the thermal reservoir over time. Thermal reservoirs usually consist of a large number of rocks that have a high heat capacity and thermal conductivity. As a result, the overall temperature of the thermal reservoir does not change significantly even though supercritical CO2 flows through the thermal reservoir and absorbs heat. Due to its mobility and high heat transfer efficiency, supercritical CO2 is able to rapidly transfer heat from the rock to the fluid. However, this efficient heat transfer does not mean that the overall temperature of the reservoir will drop rapidly. On the contrary, due to the large heat capacity and good thermal conductivity of the reservoir, it is able to maintain a relatively stable average temperature.
Figure 8 shows the variation in the average temperature of the thermal reservoir over time at different thermal reservoir thicknesses. It can be seen that the thinner the thermal reservoir is, the faster its average temperature decreases and the greater proportion of geothermal resources in the reservoir will be extracted. From the temperature field diagram (Figure 9) at different thermal reservoir thicknesses (i.e., 50, 100, 150, 200, 250, and 300 m), it can be seen more intuitively that the thinner the thermal reservoir is, the larger the area of the low-temperature region, and, naturally, the average temperature of the reservoir will also be lower. The thicker the thermal reservoir is, the more stable the system-provided thermal fluid output will be, and there will be no great drop in the fluid temperature in the production well caused by too rapid a decrease in the temperature of the thermal reservoir [27].
To demonstrate more visually the effect of heat extraction by CO2 at different reservoir thicknesses, Figure 10 shows the variation in the extraction degree of the reservoir with time at different thicknesses. The extraction degree of the reservoir increases with time because, at the start of the operation of a plume geothermal system, the extraction degree of the thermal reservoir is usually very low, as the thermal reservoir takes some time to transfer thermal energy to the geothermal fluid, and the temperature of the thermal reservoir drops relatively slowly. At this stage, the geothermal system may provide relatively little heat. As time progresses, the temperature of the thermal reservoir begins to decrease, while the extraction degree of the reservoir gradually increases. However, for the same operation time, as the thickness of the thermal reservoir increases, the extraction degree of the reservoir decreases. In contrast, a thicker thermal reservoir needs more time to transfer thermal energy; therefore, the extraction degree is usually lower for the same amount of time [26]. This trend is a consequence of the law of heat conduction, which states that the velocity of heat propagation in a substance is related to its thermal conductivity and heat capacity. A thicker thermal reservoir needs more time to transfer heat energy and therefore has a lower extraction degree.

4. Conclusions

Relying on the heat-flow coupling model, the article provides an in-depth discussion on how the geological parameters affect the system’s heat recovery effectiveness during the heat recovery process of a CO2 plume geothermal system. Based on the specific research conditions, we draw the following conclusions:
  • The increase in the initial temperature of the thermal storage significantly increases the fluid temperature and the rate of heat recovery in the production well; however, the service life of the thermal storage at these high temperatures is shortened compared to that of the medium and low temperature thermal storage. In contrast, the thermal conductivity of thermal storage has a negligible to almost negligible effect on the heat extraction process. On the other hand, the increased specific heat capacity of the thermal storage means that the thermal storage is able to release more heat energy per unit of temperature change. This directly leads to a more significant increase in the temperature of the injected CO2, which in turn increases the temperature of the fluid in the production well, extends the operational life of the reservoir, and increases the rate of heat recovery.
  • A reduction in thermal storage thickness accelerates the drop in production fluid temperature and shortens the time to thermal breakthrough. Therefore, when selecting reservoirs for geothermal extraction, thicker reservoirs should be prioritized to ensure long-term heat recovery effectiveness. In addition, the length of the shot hole section is a key factor in determining the controllable thickness of thermal reservoir development. Under the initial conditions of this study, the thickness of the thermal reservoir that can be effectively controlled and developed reaches 250 m when the length of the shot hole section is set at 50 m.
  • Going forward, when CO2 is used as a heat-carrying medium for heat recovery from high temperature gas reservoirs, the key metrics for site selection will focus on the initial temperature, specific heat capacity, and thickness of the thermal reservoir. These parameters are essential to ensure the efficiency and sustainability of the heat recovery process.

Author Contributions

Conceptualization, J.S.; investigation, H.Z.; data collation, Y.Z.; methodology, Y.L.; writing, Q.Z.; supervision, M.F. All authors have read and agreed to the published version of the manuscript.

Funding

This study was supported by the National Natural Science Foundation of China (Youth) project “Mechanism of fracture network formation caused by cross-scale damage evolution of natural fractures in hot dry rocks under multi-cycle hydraulic injection” (42302286) and by Hainan Provincial Academician Innovation Platform Scientific Research Project Funding.

Data Availability Statement

The datasets generated and analyzed during the current study are available from the corresponding author on reasonable request.

Conflicts of Interest

Authors Jifeng Song, Huaan Zheng, Yuxia Zhou, Yukai Liang and Qianyi Zeng were employed by the company CNOOC (China) Limited Hainan Branch. The remaining authors declare that the research was conducted in the absence of any commercial or financial relationships that could be construed as a potential conflict of interest.

References

  1. Rubin, E.; De Coninck, H. IPCC special report on carbon dioxide capture and storage. In TNO (2004) Cost Curves for CO2 Storage, Part; Cambridge University Press: Cambridge, UK, 2005; Volume 2, p. 14. [Google Scholar]
  2. Global Status of CCS: Targeting Climate Change; Global CCS Institute: Docklands, Australia, 2019.
  3. Townsend, A.; Raji, N.; Zapantis, A. The Value of Carbon Capture and Storage (CCS); Global CCS Institute: Docklands, Australia, 2020. [Google Scholar]
  4. Zinsalo, J.M.; Lamarche, L.; Raymond, J. Injection strategies in an enhanced geothermal system based on discrete fractures model. Appl. Therm. Eng. 2020, 169, 114812. [Google Scholar] [CrossRef]
  5. Ezekiel, J.; Kumbhat, D.; Ebigbo, A.; Adams, B.M.; Saar, M.O. Sensitivity of reservoir and operational parameters on the energy extraction performance of combined CO2-egr–cpg systems. Energies 2021, 14, 6122. [Google Scholar] [CrossRef]
  6. Borgia, A.; Pruess, K.; Kneafsey, T.J.; Oldenburg, C.M.; Pan, L. Simulation of CO2-EGS in a fractured reservoir with salt precipitation. Energy Procedia 2013, 37, 6617–6624. [Google Scholar] [CrossRef]
  7. Cao, W.; Chen, J.; Jiang, F. Numerical simulation of the influence of working fluid variables on EGS thermal mining process. J. Jilin Univ. (Earth Sci. Ed.) 2015, 45, 1180–1188. [Google Scholar]
  8. Zhang, L.; Pei, J.J.; Ren, S.R. Heat mining capacity and energy utilization efficiency of SCCO2-HDR geothermal system. Renew. Energy Resour. 2014, 32, 114–119. [Google Scholar]
  9. Randolph, J.B.; Saar, M.O. Coupling geothermal energy capture with carbon dioxide sequestration in naturally permeable, porous geologic formations: A comparison with enhanced geothermal systems. In Proceedings of the Geothermal Resources Council Annual Meeting 2010 Geothermal, Sacramento, CA, USA, 24–27 October 2010; pp. 401–405. [Google Scholar]
  10. Zhang, L.; Ezekiel, J.; Li, D.; Pei, J.; Ren, S. Potential assessment of CO2 injection for heat mining and geological storage in geothermal reservoirs of China. Appl. Energy 2014, 122, 237–246. [Google Scholar] [CrossRef]
  11. Cao, W.; Huang, W.; Chen, J.; Li, Z.; Jiang, F. Numerical study on the heat extraction performance of enhanced geothermal systems with a well-fracture-reservoir combined model. Renew. Energy 2023, 202, 370–380. [Google Scholar] [CrossRef]
  12. Liu, G.; Pu, H.; Zhao, Z.; Liu, Y. Coupled thermo-hydro-mechanical modeling on well pairs in heterogeneous porous geothermal reservoirs. Energy 2019, 171, 631–653. [Google Scholar] [CrossRef]
  13. Tian, H.; Pan, F.; Xu, T.; McPherson, B.J.; Yue, G.; Mandalaparty, P. Impacts of hydrological heterogeneities on caprock mineral alteration and containment of CO2 in geological storage sites. Int. J. Greenh. Gas Control. 2014, 24, 30–42. [Google Scholar] [CrossRef]
  14. Bu, F.; Xu, T.; Wang, F.; Yang, Z.; Tian, H. Influence of highly permeable faults within a low-porosity and low-permeability reservoir on migration and storage of injected CO2. Geofluids 2016, 16, 769–781. [Google Scholar] [CrossRef]
  15. Feng, G.; Li, J.; Xu, T. Effect of reservoir physical parameters on heat extraction rate in carbon dioxide plume geothermal system. Renew. Energy 2013, 31, 85–92. [Google Scholar]
  16. Xu, T.; Feng, G.; Hou, Z.; Tian, H.; Shi, Y.; Lei, H. Wellbore–reservoir coupled simulation to study thermal and fluid processes in a CO2-based geothermal system: Identifying favorable and unfavorable conditions in comparison with water. Environ. Earth Sci. 2015, 73, 6797–6813. [Google Scholar] [CrossRef]
  17. Xu, T.; Pruess, K.; Apps, J. Numerical studies of fluid-rock interactions in enhanced geothermal systems (EGS) with CO2 as working fluid. In Proceedings of the Thirty-Third Workshop on Geothermal Reservoir Engineering, Stanford, CA, USA, 28–30 January 2008. [Google Scholar]
  18. Garapati, N.; Randolph, J.B.; Valencia, J.L.; Saar, M.O. CO2-plume geothermal (CPG) heat extraction in multi-layered geologic reservoirs. Energy Procedia 2014, 63, 7631–7643. [Google Scholar] [CrossRef]
  19. Zhang, G.; Wu, K.; Fan, C. Calculation and significance of rock mechanical parameters of deep reservoirs in key areas of Yingqiong Basin. Geol. J. Chin. Univ. 2021, 27, 616–624. [Google Scholar]
  20. Yuan, A. Research on Heat Transfer Characteristics of Enhanced Geothermal System Based on Heat-Flow Coupling; Anhui Jianzhu University: Hefei, China, 2023. [Google Scholar]
  21. Qu, Z.; Zhang, W.; Guo, T. Influence of geological parameters and bedding fractures on geothermal productivity based on COMSOL. Prog. Geophys. 2017, 32, 2374–2382. [Google Scholar]
  22. Singh, H.K.; Chandrasekharam, D.; Raju, N.J. Geothermal energy potential in relation to black carbon reduction and CO2 mitigation of Himalayan geothermal belt—A review. Geothermics 2024, 119, 102962. [Google Scholar] [CrossRef]
  23. Huang, Y.; Kong, Y.; Cheng, Y. Evaluating the long-term sustainability of geothermal energy utilization from deep coal mines. Geothermics 2023, 107, 102584. [Google Scholar] [CrossRef]
  24. Rajabi, M.M.; Chen, M.; Bozorgpour, A. Stochastic techno-economic analysis of CO2-circulated geothermal energy production in a closed reservoir system. Geothermics 2021, 96, 102202. [Google Scholar] [CrossRef]
  25. Song, G. Multi-Field Coupling Mechanism and Optimization of Heat Extraction Performance of EGS Circulating Injection and Production in Hot Dry Rock; China University of Petroleum (Beijing): Beijing, China, 2023. [Google Scholar]
  26. Xiao, X.; Li, W.; Gong, P. Study on the CO2-EGS coupling model of the porosity of hot dry rock. Energy Sci. Eng. 2024, 12, 2992–3007. [Google Scholar] [CrossRef]
  27. Zhang, T. Study on the Flow Heat Transfer Law of Heat Extraction Working Fluid in Deep Geothermal Single Fracture; China University of Petroleum (Beijing): Beijing, China, 2023. [Google Scholar]
Figure 1. Schematic diagram of a CPGS model.
Processes 12 02808 g001
Figure 2. Production fluid temperature comparison results.
Processes 12 02808 g002
Figure 3. (a) Temporal variation in fluid temperature within the production well at various initial thermal reservoir temperatures. (b) Fluctuations in fluid temperature and heat exchange efficiency in the production well relative to the original thermal reservoir temperature.
Processes 12 02808 g003
Figure 4. (a) Temporal variation in CO2 dynamic viscosity in the reservoir at various beginning temperatures. (b) Plot of heat extraction rate versus initial thermal reservoir temperature.
Processes 12 02808 g004
Figure 5. (a) Fluctuation of fluid temperature in relation to the thermal conductivity of thermal storage within production wells. (b) The rate of heat extraction in relation to the thermal conductivity of the thermal reservoir.
Processes 12 02808 g005
Figure 6. (a) Fluctuation of fluid temperature in relation to the specific heat capacity of thermal storage within production wells. (b) Fluctuation of heat extraction rate in relation to the specific heat capacity of thermal storage.
Processes 12 02808 g006
Figure 7. (a) Temporal variation in fluid temperature in production wells across varying thermal storage thicknesses. (b) Variation in thermal breakthrough time of the CPGS with varying thermal storage thicknesses.
Processes 12 02808 g007
Figure 8. Variation in the average temperature of a thermal reservoir with time at different reservoir thicknesses.
Processes 12 02808 g008
Figure 9. Variation in the temperature field at different thermal reservoir thicknesses.
Processes 12 02808 g009
Figure 10. Variation in the extraction degree of a thermal reservoir with time at different reservoir thicknesses.
Processes 12 02808 g010
Table 1. Grid independence verification results.
Number of MeshesOutlet Temperature/KRunning Time/s
35,824422.57610
115,283422.89819
229,423423.151026
303,415423.151249
440,819423.151807
Table 2. Initial parameter of the model.
ParameterValueParameterValue
Reservoir thickness100 mThicknesses of caprock and bedrock100 m
Initial reservoir temperature 150 °CPorosity of caprock and bedrock0.05
Specific heat capacity of the reservoir900 J/(kg · °C)Density of caprock and bedrock2800 kg/m3
Density of the reservoir2600 kg/m3Thermal conductivity of caprock and bedrock3 W/(m · °C)
Thermal conductivity of the reservoir2.5 W/(m · °C)Permeability of caprock and bedrock0.01 mD
Porosity of the reservoir0.155Specific heat capacity of caprock and bedrock1000 J/(kg · °C)
Geothermal gradient0.0398 °C/mLength of injection–production perforation section50 m
Surface temperature25 °CInjection production well spacing250 m
Injection temperature55 °CInjection–production well diameter0.3 m
Injection rate10 kg/s
Disclaimer/Publisher’s Note: The statements, opinions and data contained in all publications are solely those of the individual author(s) and contributor(s) and not of MDPI and/or the editor(s). MDPI and/or the editor(s) disclaim responsibility for any injury to people or property resulting from any ideas, methods, instructions or products referred to in the content.

