Article

Conceptual Design of Simulation-Based Approach for Robotic Automation Systems: A Case Study of Tray Transporting

1
Agricultural Science Research Institute, Chungnam National University, Daejeon 34134, Republic of Korea
2
Department of Biosystems Machinery Engineering, Chungnam National University, Daejeon 34134, Republic of Korea
3
Food Safety and Distribution Research Group, Korea Food Research Institute, Wanju 55365, Republic of Korea
*
Authors to whom correspondence should be addressed.
Processes 2024, 12(12), 2791; https://doi.org/10.3390/pr12122791
Submission received: 13 November 2024 / Revised: 2 December 2024 / Accepted: 4 December 2024 / Published: 6 December 2024
(This article belongs to the Special Issue Feature Papers in the "Food Process Engineering" Section)

Abstract

:
This study investigated the application of robotic automation in food manufacturing, focusing on enhancing tray transporting operations through a simulation-based approach. The findings primarily focused on bakery production but also demonstrate broader applicability to other sectors that involve repetitive and labor-intensive tasks. The researchers analyzed worker fatigue and limited productivity associated with manual tray handling. To evaluate these issues, simulations were conducted for two scenarios (Case A and Case B), applying robotic automation systems at different stages of production. Key performance indicators (throughput and utilization rates) were analyzed to assess improvements in process efficiency and reductions in worker strain. The results showed that robotic automation significantly increased throughput by 83.7% in simpler processes and by 27.1% in more complex ones, highlighting the impact of task complexity on automation effectiveness. Workforce demands decreased and demonstrated the potential of automation to alleviate physical strain in repetitive tasks. Simulations provided insights into workflow optimization, confirming their value as reliable tools for planning and refining automation strategies. The proposed framework offers a flexible and scalable solution for enhancing efficiency and consistency in manufacturing. Future research should apply similar approaches to other industries and explore the integration of human and robotic labor to further optimize safety, productivity, and cost effectiveness.

1. Introduction

The food industry utilizes a wide variety of processing methods. Even for the production of the same product, methods differ depending on each company’s unique recipes and conditions. To produce a uniform taste and quality, the food industry has enhanced automated processes by integrating advanced technologies, accelerating the digital transformation of automation [1]. Key technological elements in food technology for automated processes include robotics and simulation, which have attracted significant attention in Industry 4.0 [2,3]. Robotics has proven to be a valuable tool in addressing the operational demands of modern food processing environments [4]. Robots vary in structure, ranging from Cartesian robots, which move along a single axis, to more complex multi-joint robots capable of executing intricate process trajectories designed by operators [5]. Articulated robots have been commonly used to provide a wide range of operations and high flexibility [6]. These robots have been increasingly integrated with existing equipment or employed in challenging work environments, replacing human workers to enhance operational efficiency [7].
By transitioning to robotic automation systems, food manufacturing companies aim to develop flexible manufacturing processes capable of accommodating small-quantity production across a variety of products [8]. However, robots lack the intelligence and flexibility to independently respond to changes in dynamic environments, making extensive programming necessary for effective integration into manufacturing processes [9]. Robots have primarily been applied in labor-intensive and challenging processes to achieve this flexibility, such as handling and palletizing heavy materials—tasks that have typically been avoided by workers due to physical demands [10,11]. Various types of robots have been used to identify product positions for packaging and to apply palletizing for packed boxes [12]. After implementing robotic systems, companies have reported a reduction in the need to handle heavy boxes, thereby decreasing health risks for workers [13]. Robotic automation systems have also been adopted in meat processing [14]. Additionally, a study found that by using vision technology and two robots to pick and place pizzas, each robot was able to supply up to 80 pizzas per packaging line [15].
Despite these advancements, a report by the International Federation of Robotics (IFR) indicated that the deployment rate of industrial robots in the food and beverage sector was the lowest among other industries [16]. This limitation was largely due to the complexity of standardizing robotic applications across various food processing methods and compatibility issues between different platforms. For small- and medium-sized enterprises (SMEs), several factors created additional challenges in adopting robotic automation systems. Financial costs and perceived risks were significant concerns for these companies. In addition, they faced specific requirements related to hygiene, worker safety, productivity, and ease of operation, which further complicated the adoption process. Companies that decided to implement robotic automation aimed to minimize both the transition period and potential errors that might arise after installation. They also focused on reducing any production losses during the downtime caused by this transition.
Simulation is one of the critical decision-making methods widely used to analyze potential issues. This approach helps validate any potential difficulties that might arise when modifying process lines before implementation [17]. Simulation allows companies to proactively test and confirm changes within a virtual environment. A range of computer-aided design (CAD) and simulation tools have been utilized to support this process. Discrete event simulation (DES) is one of the notable process simulation techniques that can diagnose bottlenecks by accurately predicting when specific events will occur in the processes [18]. Simulation has allowed companies to optimize production processes by analyzing factors such as equipment utilization, material flow and labor efficiency [19,20]. As conventional 2D logic-based process simulations have enabled 3D visualization, it has become easier for both companies and individuals to understand simulation results. As a range of commercial programs is available, it is essential to select software that best fits specific operational needs [21]. For instance, improvements in automation solutions have been proposed using Tecnomatix Plant Simulation within industrial plant factories [22]. The food industry has also used simulation to demonstrate potential process improvements, emphasizing its importance in food manufacturing. One application area that has employed simulation to improve production efficiency and reduce costs is the bakery production line. Simulation of the bakery line allowed one study to identify issues within existing production systems and propose two improvement scenarios, which were expected to reduce future design time and costs [23]. The study also employed various algorithms within the simulation to optimize production diversity, minimize process delays, and demonstrate the potential for reducing energy consumption [24,25]. In Finland, a bakery production line was enhanced through the application of collaborative robots along with modeling and simulation techniques [26]. Technological advancements have led to the emergence of the digital twin (DT) model, which enables complex real-world data to be represented digitally [27,28]. In plant simulation, virtual reality (VR) applications in virtual spaces now support system production and training processes [29]. Tecnomatix commercial software has been used to optimize production processes, evaluate the economic impact of investments including associated risks [30], and develop digital twin systems for real-time monitoring [31].
This study addresses gaps in the current literature regarding the practical application of robotic automation in bakery SMEs. While prior research has focused on robotics and simulation in large-scale operations, this study emphasizes the challenges and opportunities in smaller, resource-constrained environments. By integrating simulation-based tools and applying them to repetitive tray handling tasks, this study demonstrates their potential to enhance productivity and reduce worker strain in bakery production lines.
However, the food industry is largely composed of SMEs and faces significant challenges in implementing DT technology [32,33]. Although extensive research has been conducted on simulations and robotics, studies demonstrating their practical effectiveness in the food industry remain limited. Although this study focuses on optimizing tray transporting in bakery production, the simulation-based approach and robotic automation techniques used are also applicable to other industries with repetitive and labor-intensive tasks. Examples include packaging, automotive assembly, and logistics. These industries face challenges such as process bottlenecks and resource optimization, which can be addressed using insights from simulation tools like SIEMENS Plant Simulation. These tools provide flexibility in configuring workflows and improve operational consistency, making them suitable for various production environments.
This study provides a novel perspective on applying robotic automation systems to address the specific challenges faced by bakery SMEs. Unlike previous works that focused on large-scale environments, this study aims to validate the practicality of automation in small-scale production processes. The findings emphasize the role of simulation-based tools in enhancing productivity, operational consistency, and worker safety. The main purpose of this study was to demonstrate the effectiveness of robotic applications in bakery SMEs through simulations of two similar processes that have traditionally been performed by human workers. The selected processes involve transferring trays of freshly produced doughnuts from storage racks to a glazing station and relocating trays of finished products for packaging. This study emphasized the difference between manual processes and the implementation of a robot application system. Key performance indicators (KPIs) were applied to evaluate the improvements. Robots were implemented in each process where worker tasks involved repetitive movements. The simulation models identified worker fatigue and evaluated the robotic automation, which could serve as an effective improvement strategy. This study aimed to predict the productivity potential and assess these projections in practical application cases using simulation models. A virtual commissioning simulation framework was tested to conduct virtual operational tests, removing the need for physical equipment production or on-site implementation. To support this study, discrete event simulation (DES)-based tools, including Tecnomatix Process Simulation and Plant Simulation, were utilized to improve line productivity and address the digitalization challenges faced by SMEs.

2. Materials and Methods

Two similar cases were chosen for this study: the initial process of supplying food material and the final step before packaging. Both processes involved the use of racks and trays. Case A represented the process of supplying trays to the manufacturing line, while Case B involved placing completed products onto racks and transferring the trays to a holding rack in preparation for the packaging stage. Modeling and simulation were utilized to evaluate the robotic automation of the production line for each case. A virtual production environment was designed to replicate the original workplace conditions. This setup enabled us to compare manual operations and a robot-applied system. Facility layout, tray and rack equipment, and the shared workspace between humans and robots were considered as factors for simulation. Commercial simulation software tools were employed to analyze worker overload in the existing manual process and evaluate the impact of robotic automation on operational efficiency.

2.1. Methodology Description

Simulation serves as a key decision-making tool for modeling and optimizing manufacturing processes. Many companies use it to determine whether to invest in new production lines or enhance existing processes by introducing new machinery. Specific procedures and approaches were followed to design and test the simulation effectively [34,35]. Process analysis began with the collection of data from the existing production site. Information regarding the site dimensions, production volumes, and workforce input was gathered to incorporate into the simulation results for the current production environment. The collected data supported the simulation analysis in identifying the issues related to worker overload. The production output and number of workers involved in each manual process were calculated. Simulations incorporating robotic implementation were conducted to evaluate improvements over the existing manual process. Based on the measured and restructured site data, suitable robots were selected to improve efficiency through targeted enhancements.
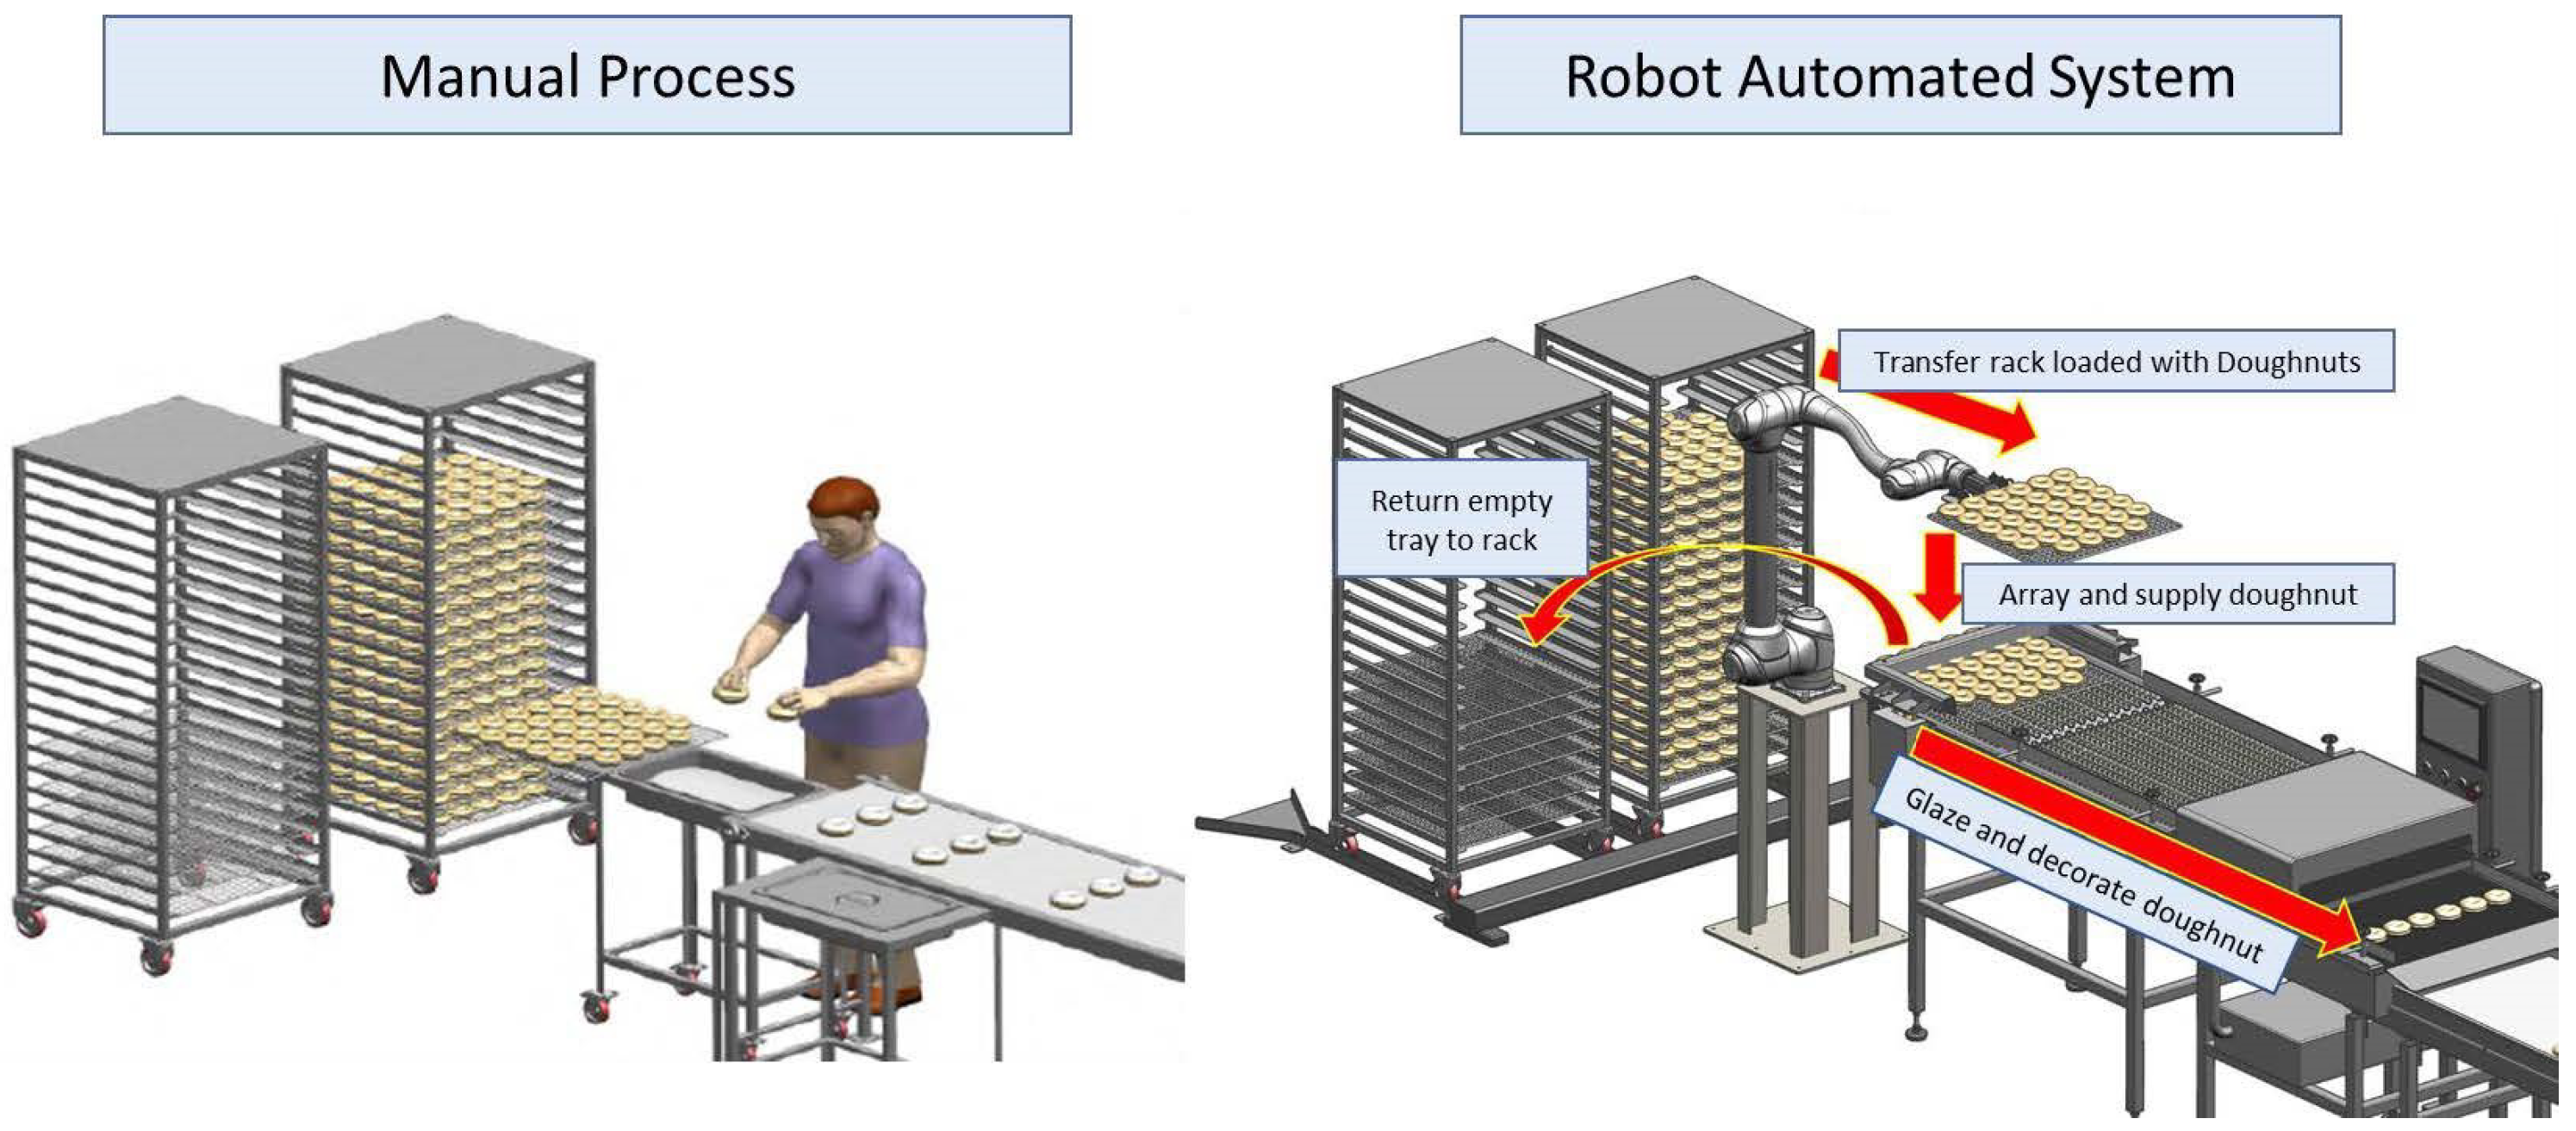
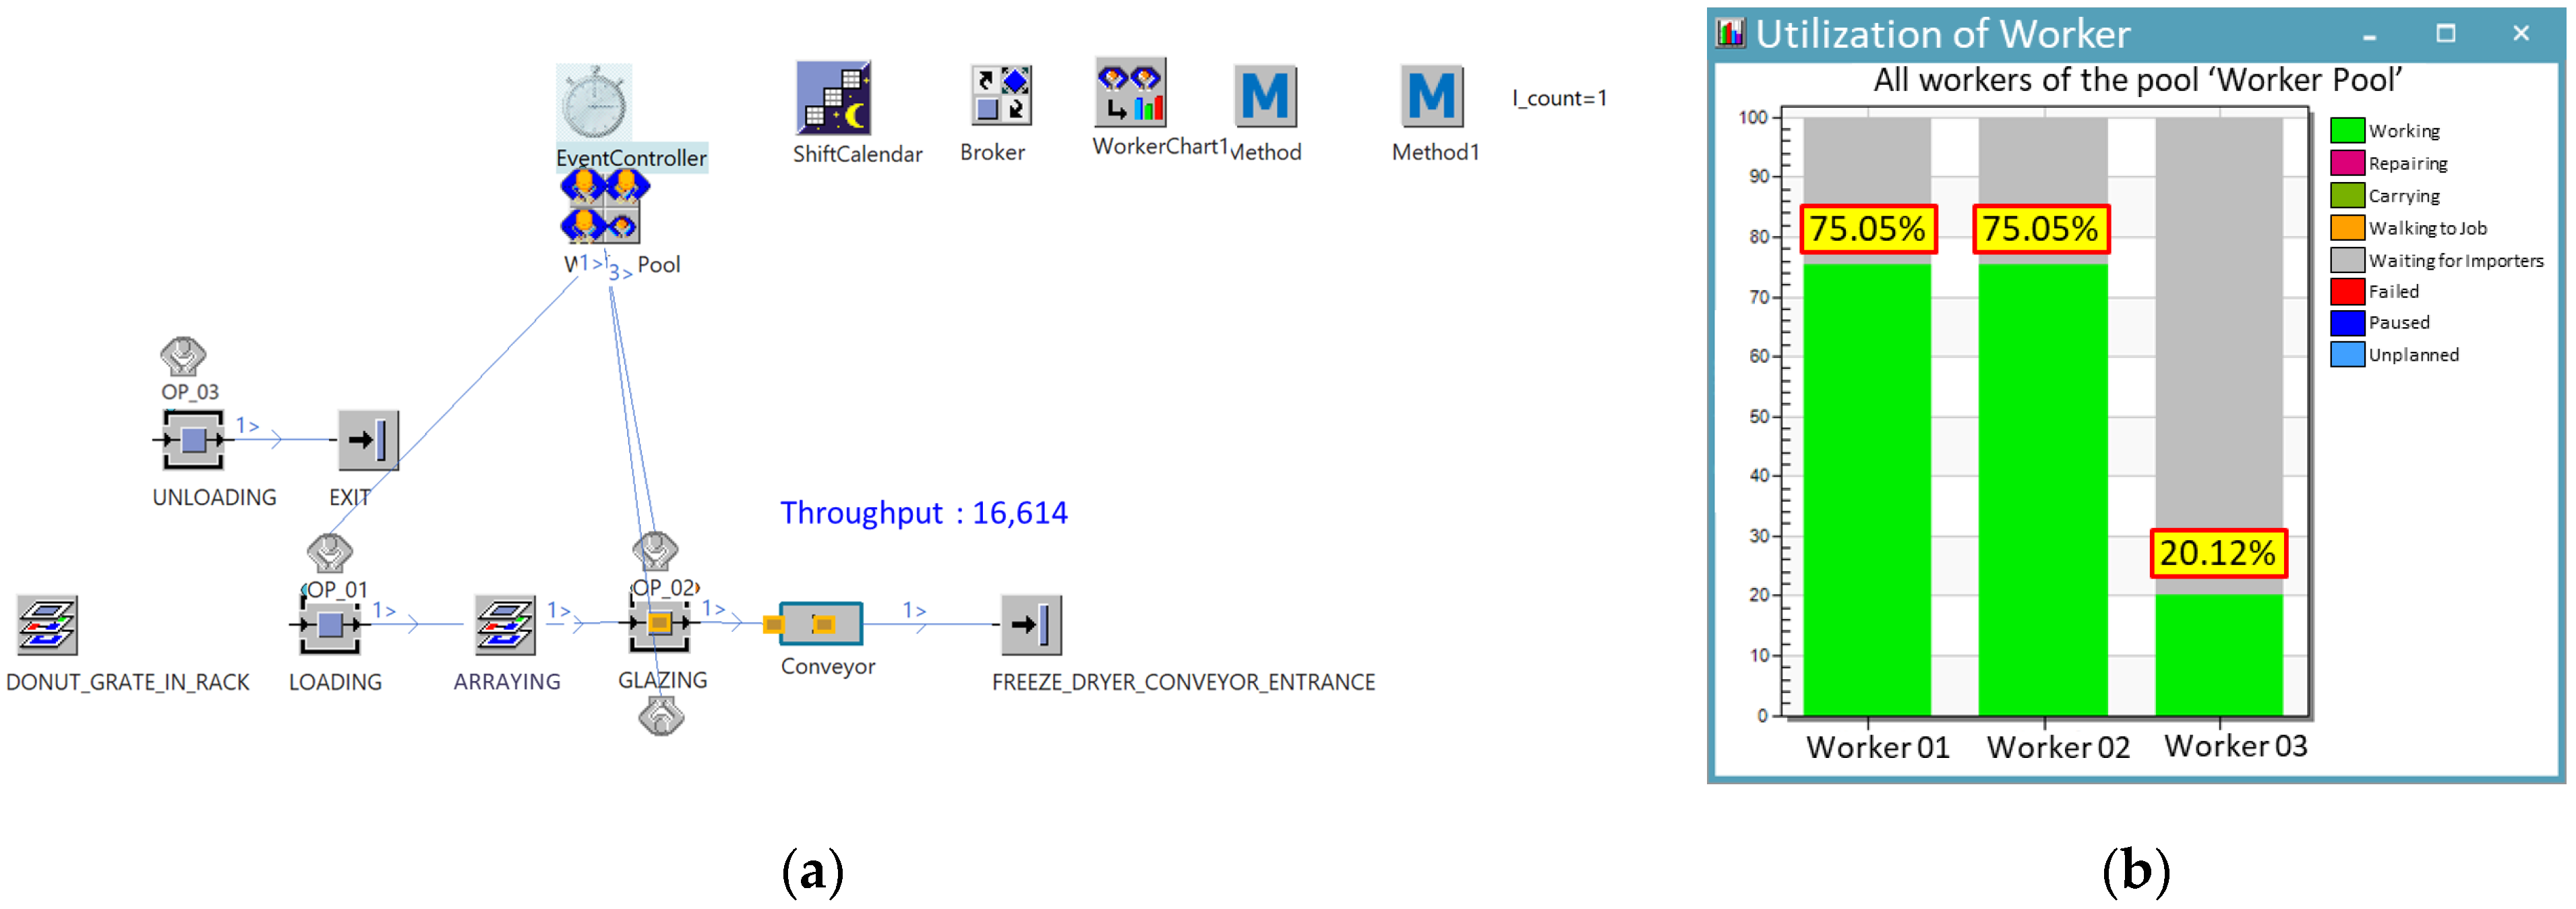
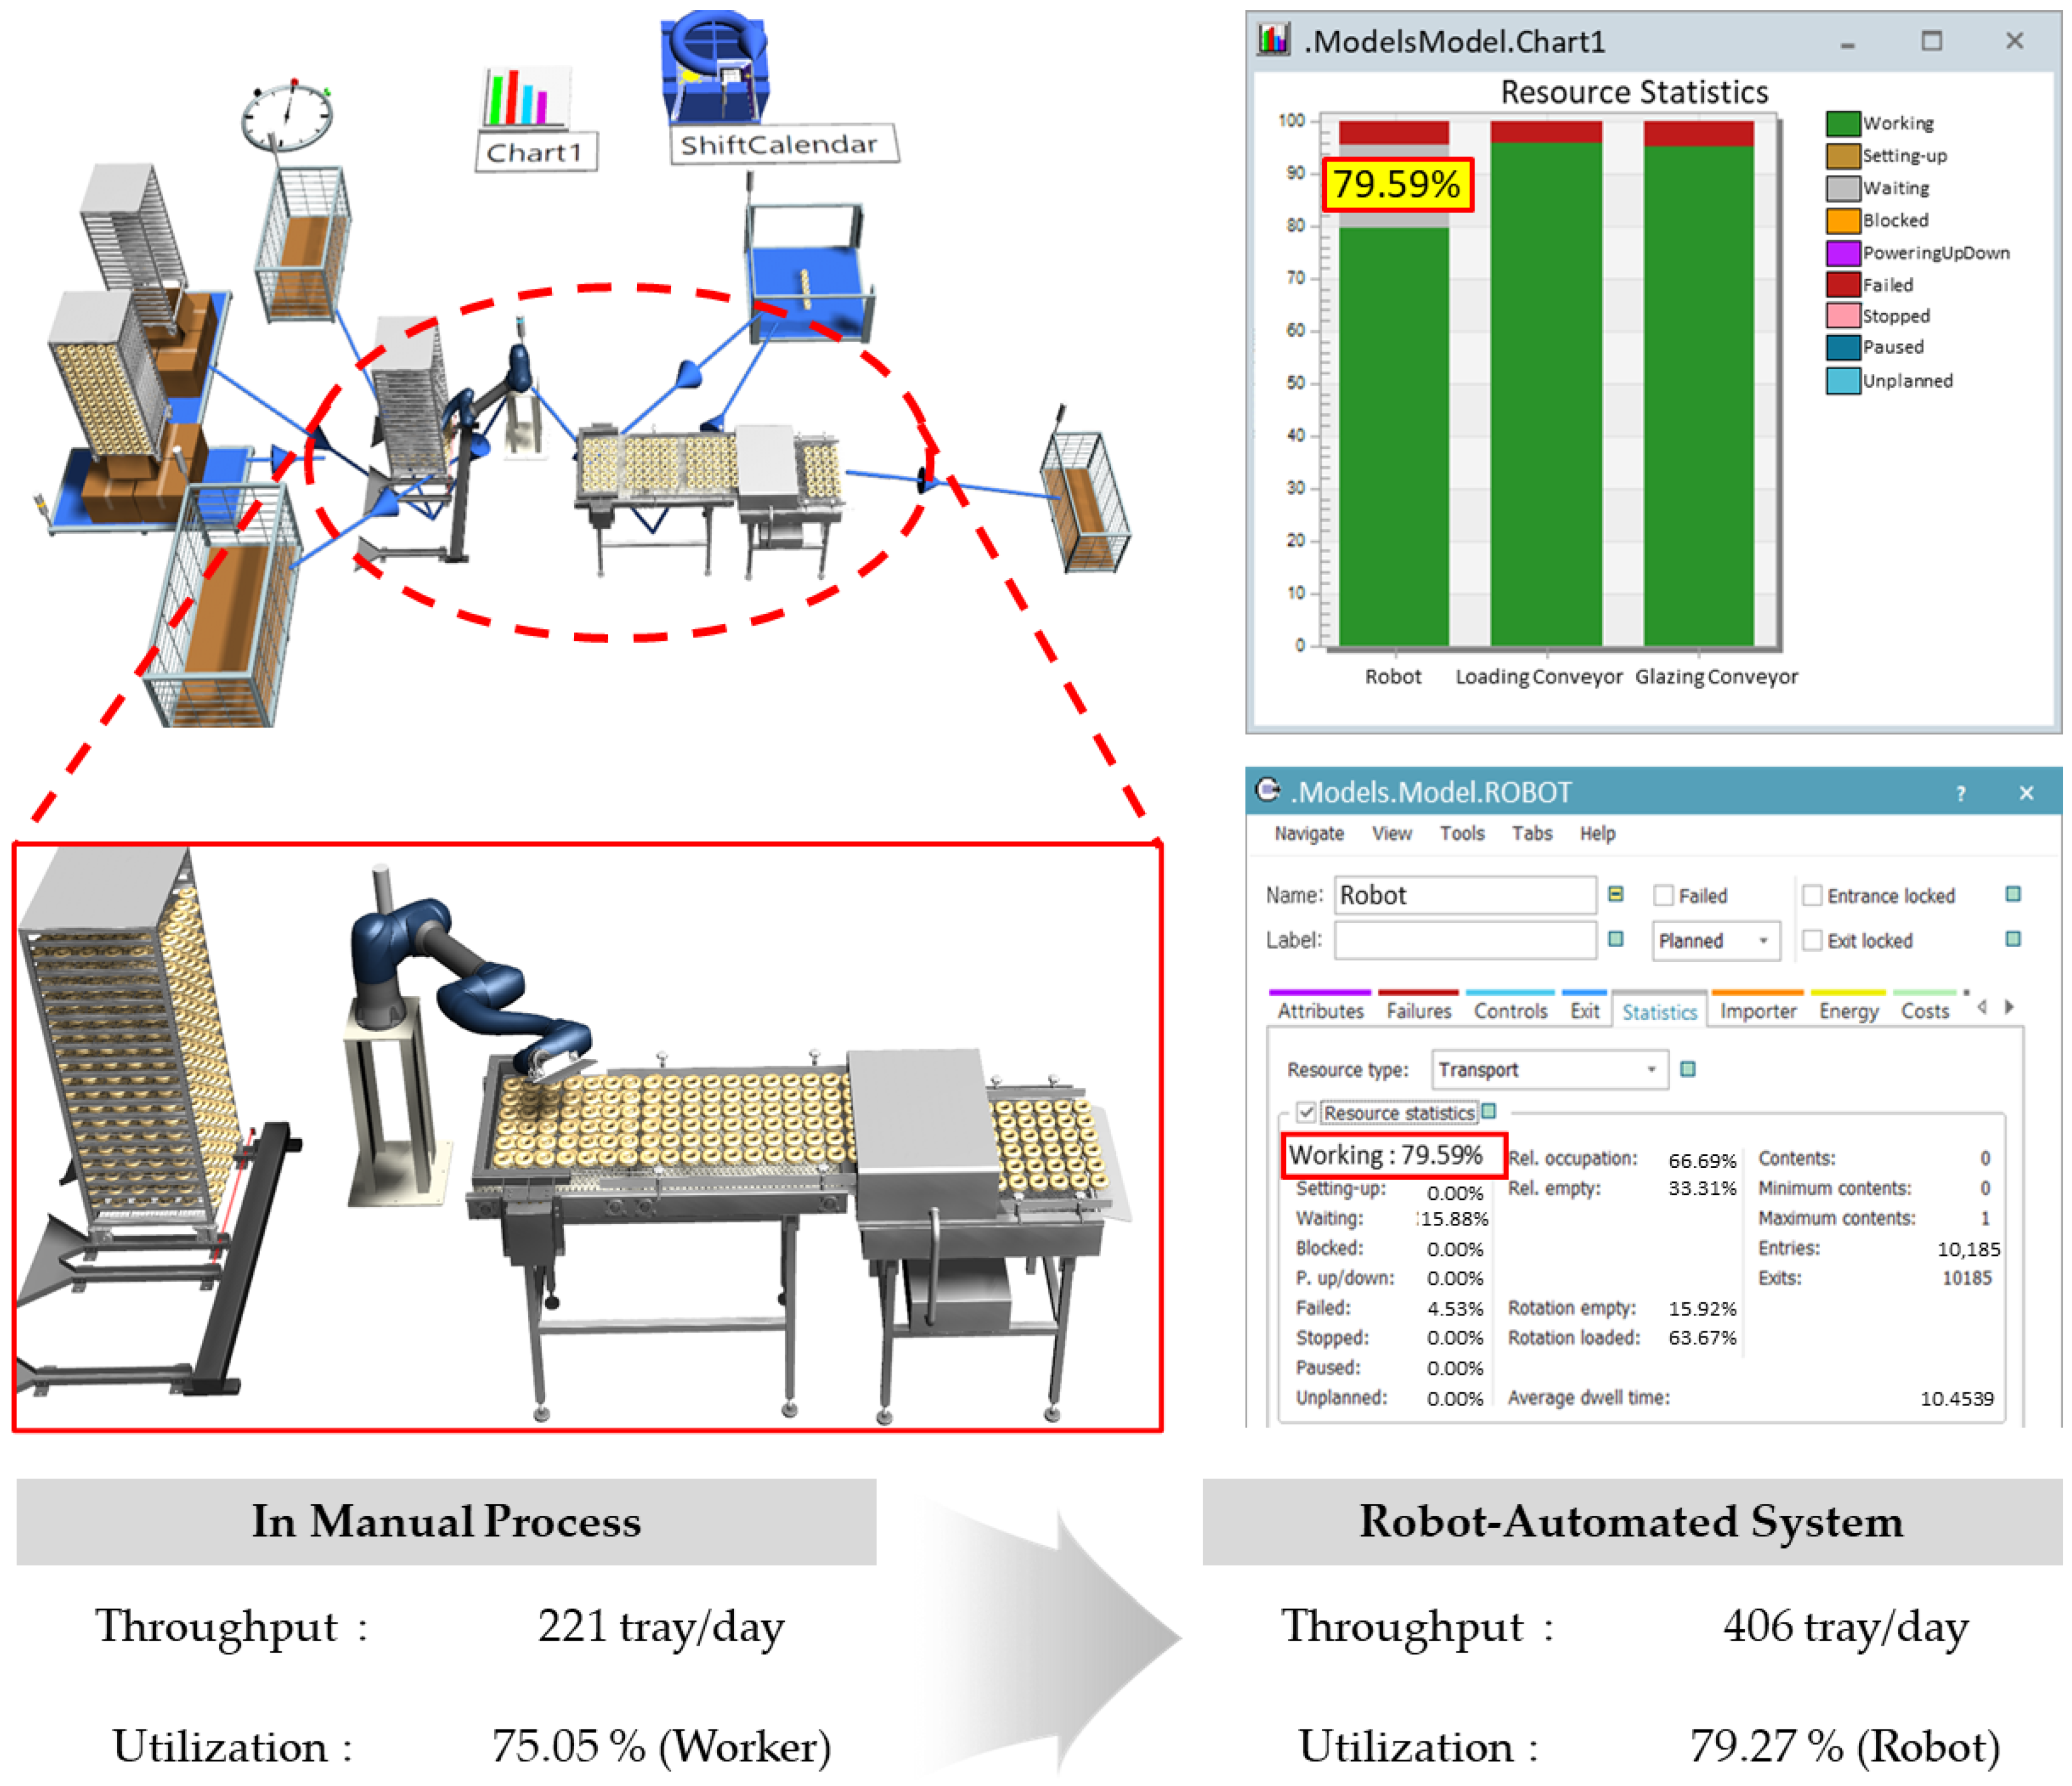
The process in Case A begins with a worker removing trays of oil-fried, naturally degreased products from racks and supplying them for glazing. Once the trays are emptied, they are returned to their original positions on the racks. The worker repeatedly performs this task, bending to access the lowest levels of the rack and reaching overhead to place trays on the highest levels, creating ergonomic risks.
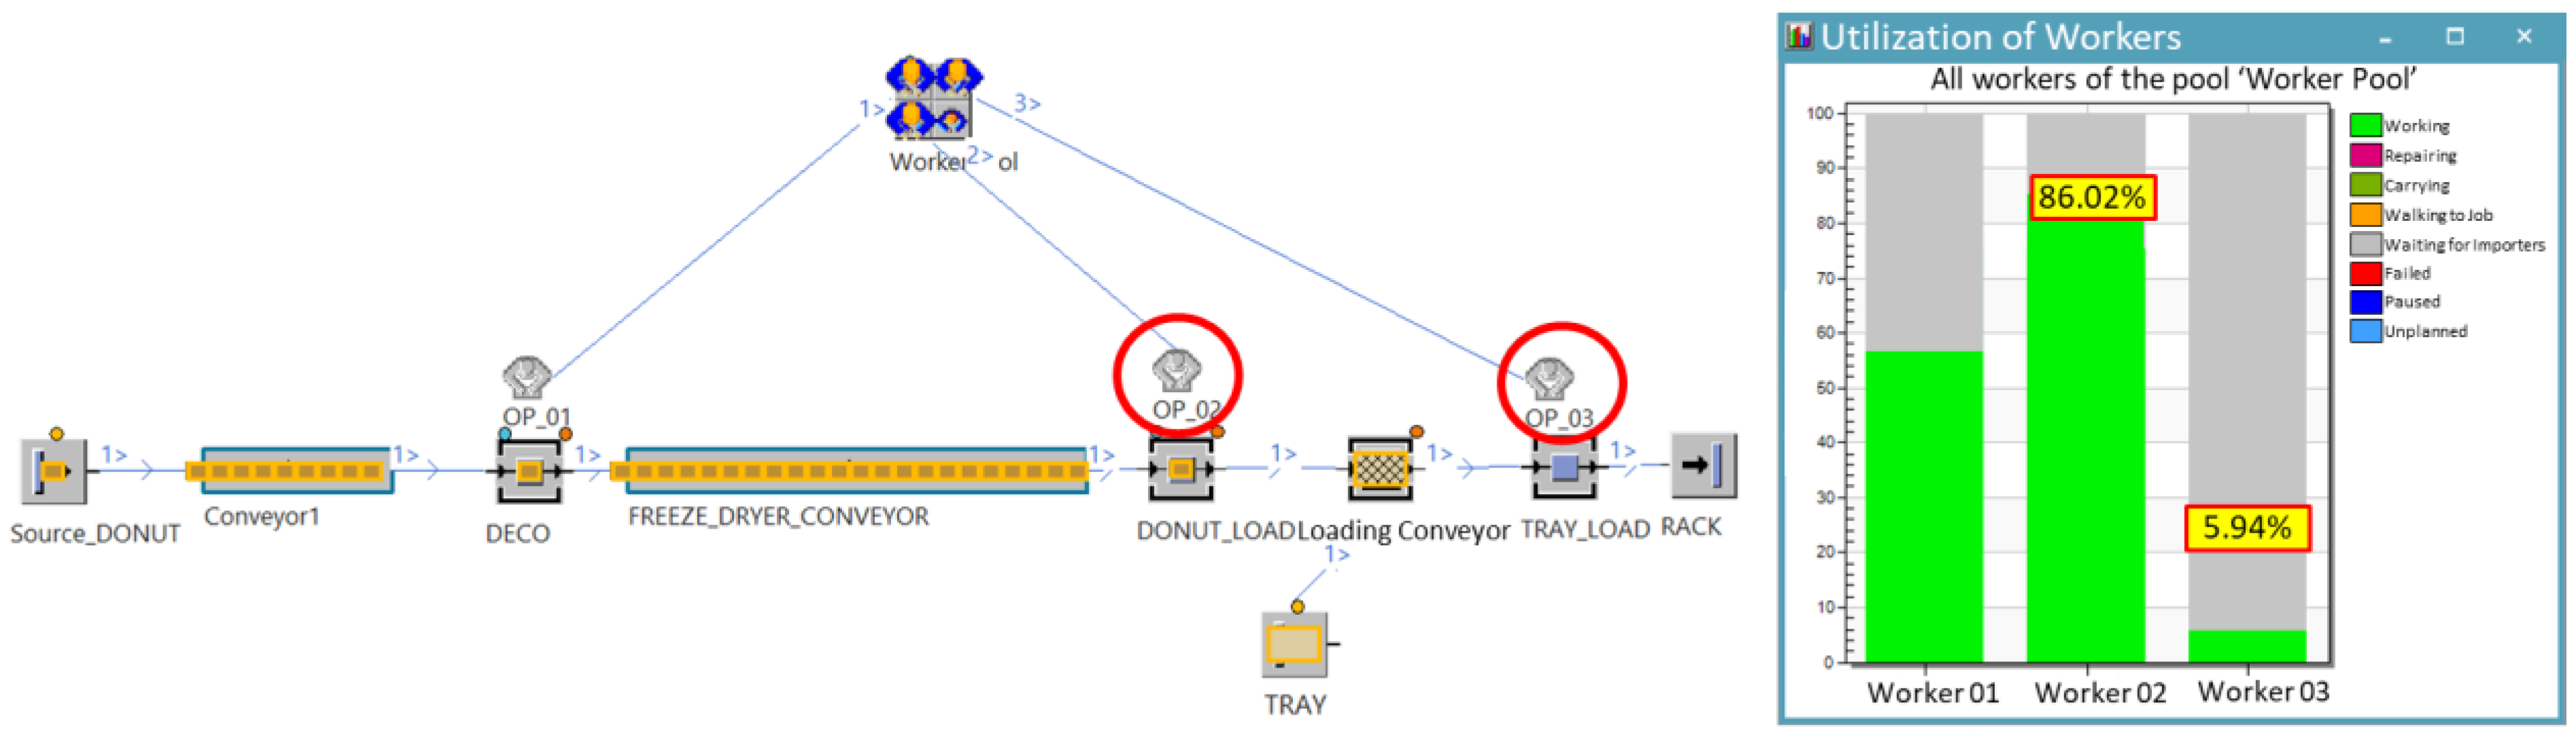
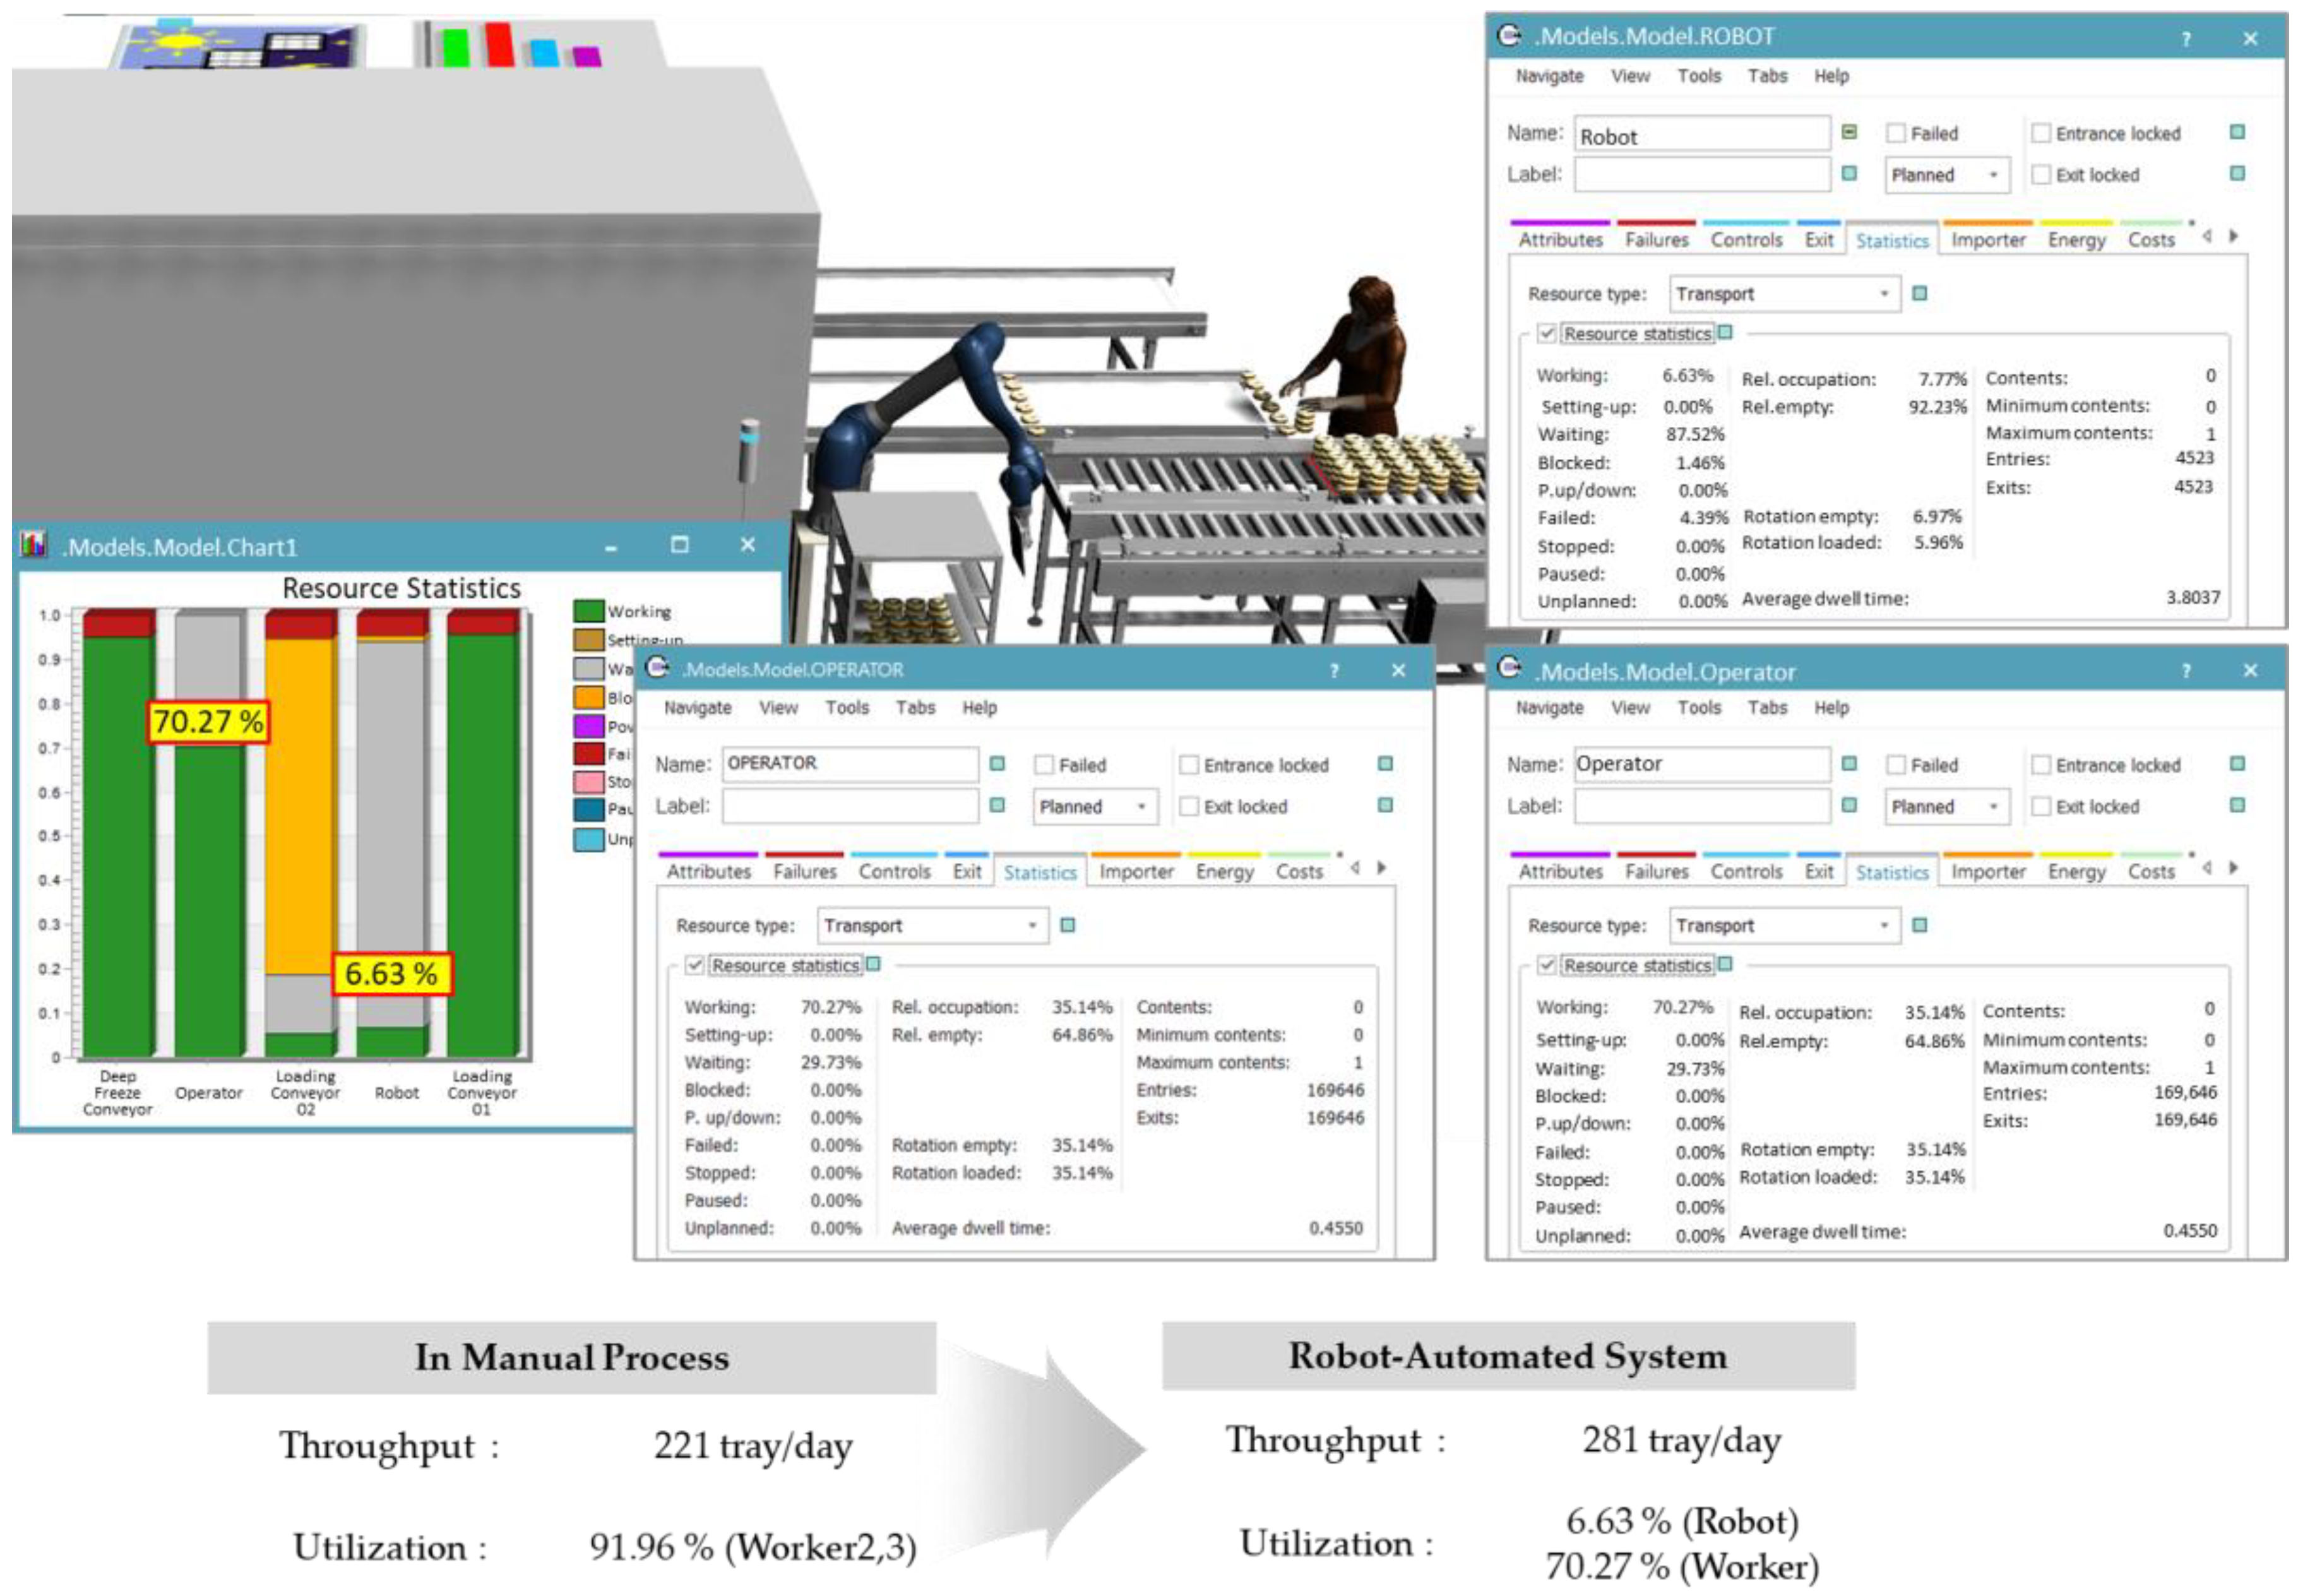
Case B involves loading glazed products, which have been rapidly cooled, onto trays. The worker retrieves empty trays from the racks and, unlike in Case A where products are aligned horizontally, vertically aligns the products on the tray. Once the trays are loaded, they are returned to the racks. This process requires enhanced repetitive handling and presents similar challenges to Case A.
To address these issues, a thorough pre-analysis and simulation were conducted to evaluate the feasibility of applying a robotic automation system to the existing production environment.
The dimensions of the production site were measured using a FARO Focus3D Premium 70 Laser Scanner (FARO Technologies Inc., Lake Mary, FL, USA) to construct the process simulation. The laser scanner generated 3D point cloud data composed of ‘X, Y, Z + Color’ points, which provided precise spatial and color information for each point to ensure the accurate representation of the process line. This high-precision point cloud data, accurate within approximately 2 mm, was used to create the projected shape of the production environment, as shown in Figure 1. The collected data were then reconstructed into a 3D model using Autodesk 3DS Max (version 2021, Autodesk Inc., San Rafael, CA, USA), enabling an accurate 3D simulation of the current manufacturing site.
SIEMENS Tecnomatix Plant Simulation (V2201, SIEMENS Inc., Munich, Germany) and Process Simulate (V16.0.1, SIEMENS Inc., Munich, Germany) were chosen for this study due to their extensive industrial databases, which provided a stronger foundation for the research compared to other available tools. These programs enabled detailed trajectory configurations and virtual implementation of robotic systems, enhancing the reliability of the simulations. Their 3D visualization capabilities made analyses easy to understand for general users and proved the suitability of SIEMENS tools for this study. Plant simulation processes were utilized to explore the potential for improving existing manual operations through the application of robotic automation. SIEMENS Tecnomatix Process Simulate (V16.0.1, SIEMENS Inc., Munich, Germany) was employed to design robot movements and path loading when either supporting or cooperating with human labor. SIEMENS Tecnomatix Plant Simulation (V2201, SIEMENS Inc., Munich, Germany) was used to compare the outcomes of the current manual process with the improved robotic automation system.

2.2. Application of Robot Process Simulation and Plant Simulation

Collaborative robots, known as cobots, were chosen to enhance the process due to their ability to operate safely with human workers. These robots were equipped with collision detection capabilities to operate in shared workspaces. Operating speeds were modified to increase safety and reduce potential risks for workers and nearby objects [
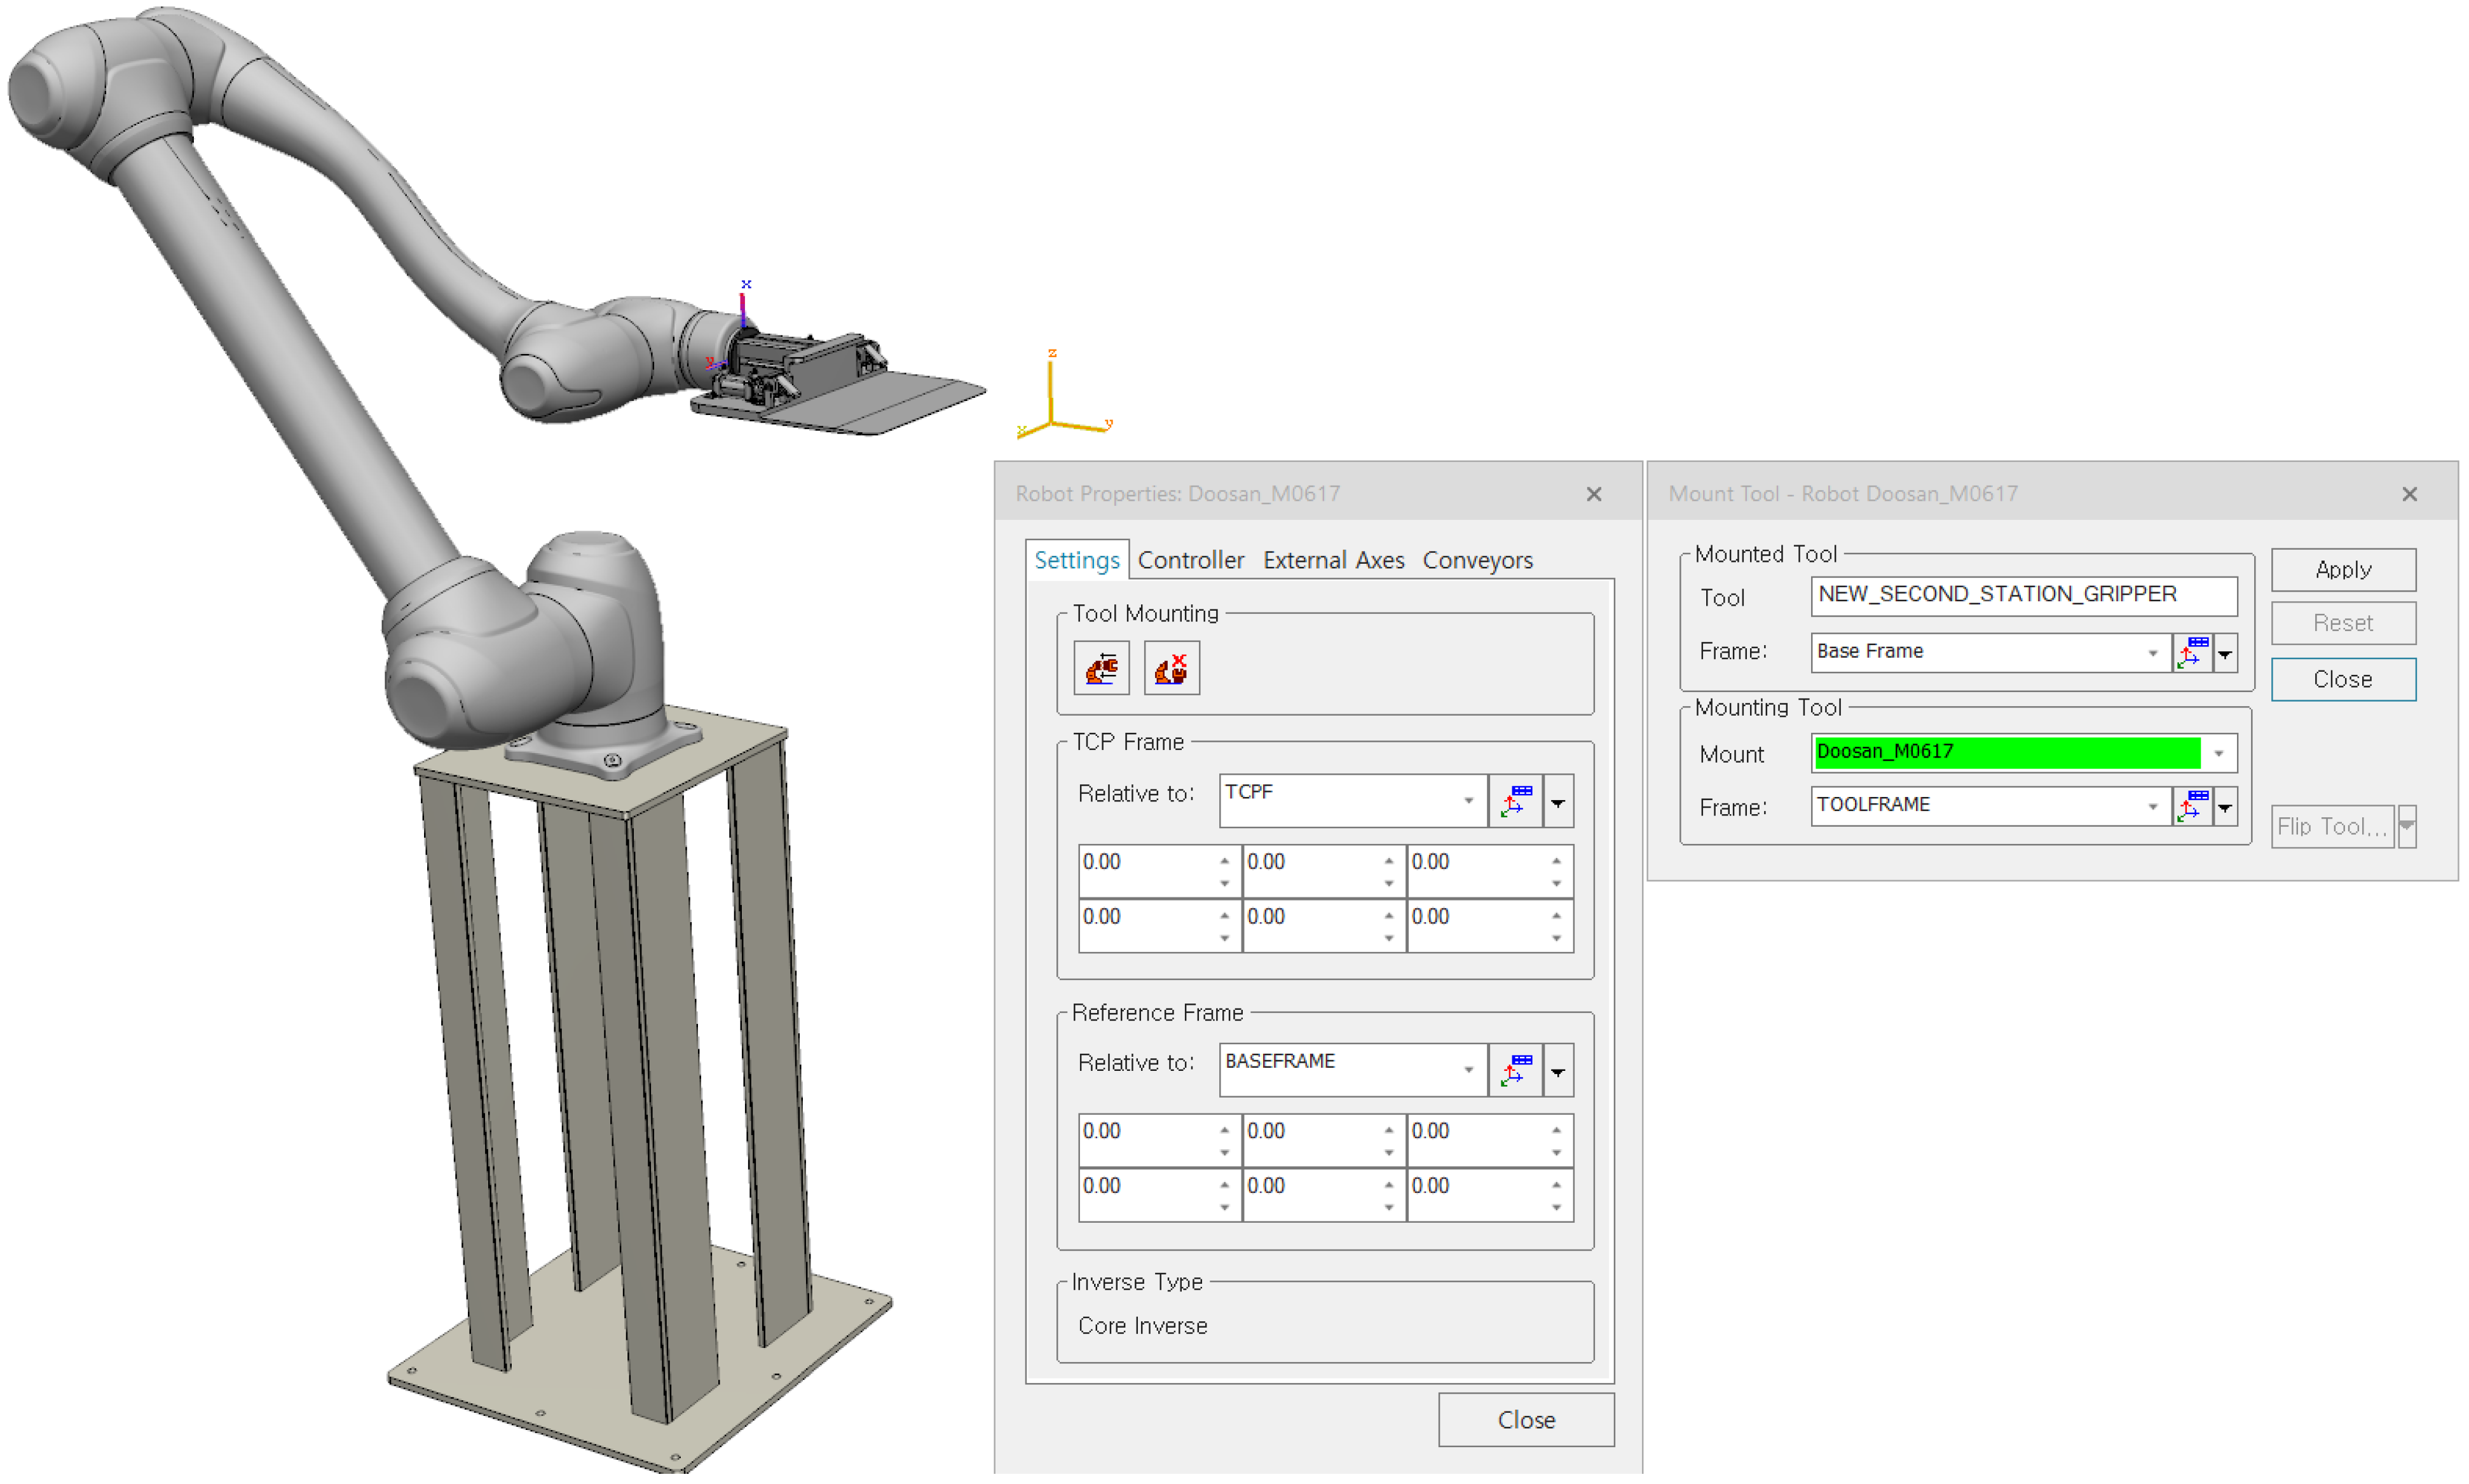
36]. This study implemented an articulated robot with a payload capacity of 6 kg, a reach of 1700 mm, and a repeatability of 0.1 mm (Doosan Robotics, Suwon, Republic of Korea, Model: M0617). This robot model was incorporated into the simulation library to allow accurate replication of its movements in the simulated production process.
To connect the end-effector to the robot’s arm, the tool and frame were configured in the process simulation, as illustrated in Figure 2. This configuration is crucial for establishing the tool’s position and orientation in relation to the robot, enabling accurate trajectory and motion planning by setting the end-effector as the tool center point (TCP). The robot uses the TCP and its body configuration to determine spatial limitations. If the TCP is defined in poses, the position of the robot flange must be represented as a pose (including both position and orientation) in relation to either the robot base or a reference coordinate frame. After a specific trajectory is programmed, the TCP aligns with the designated path. This arrangement in Tecnomatix Process Simulate supports precise object placement and trajectory planning, as shown in Figure 2.
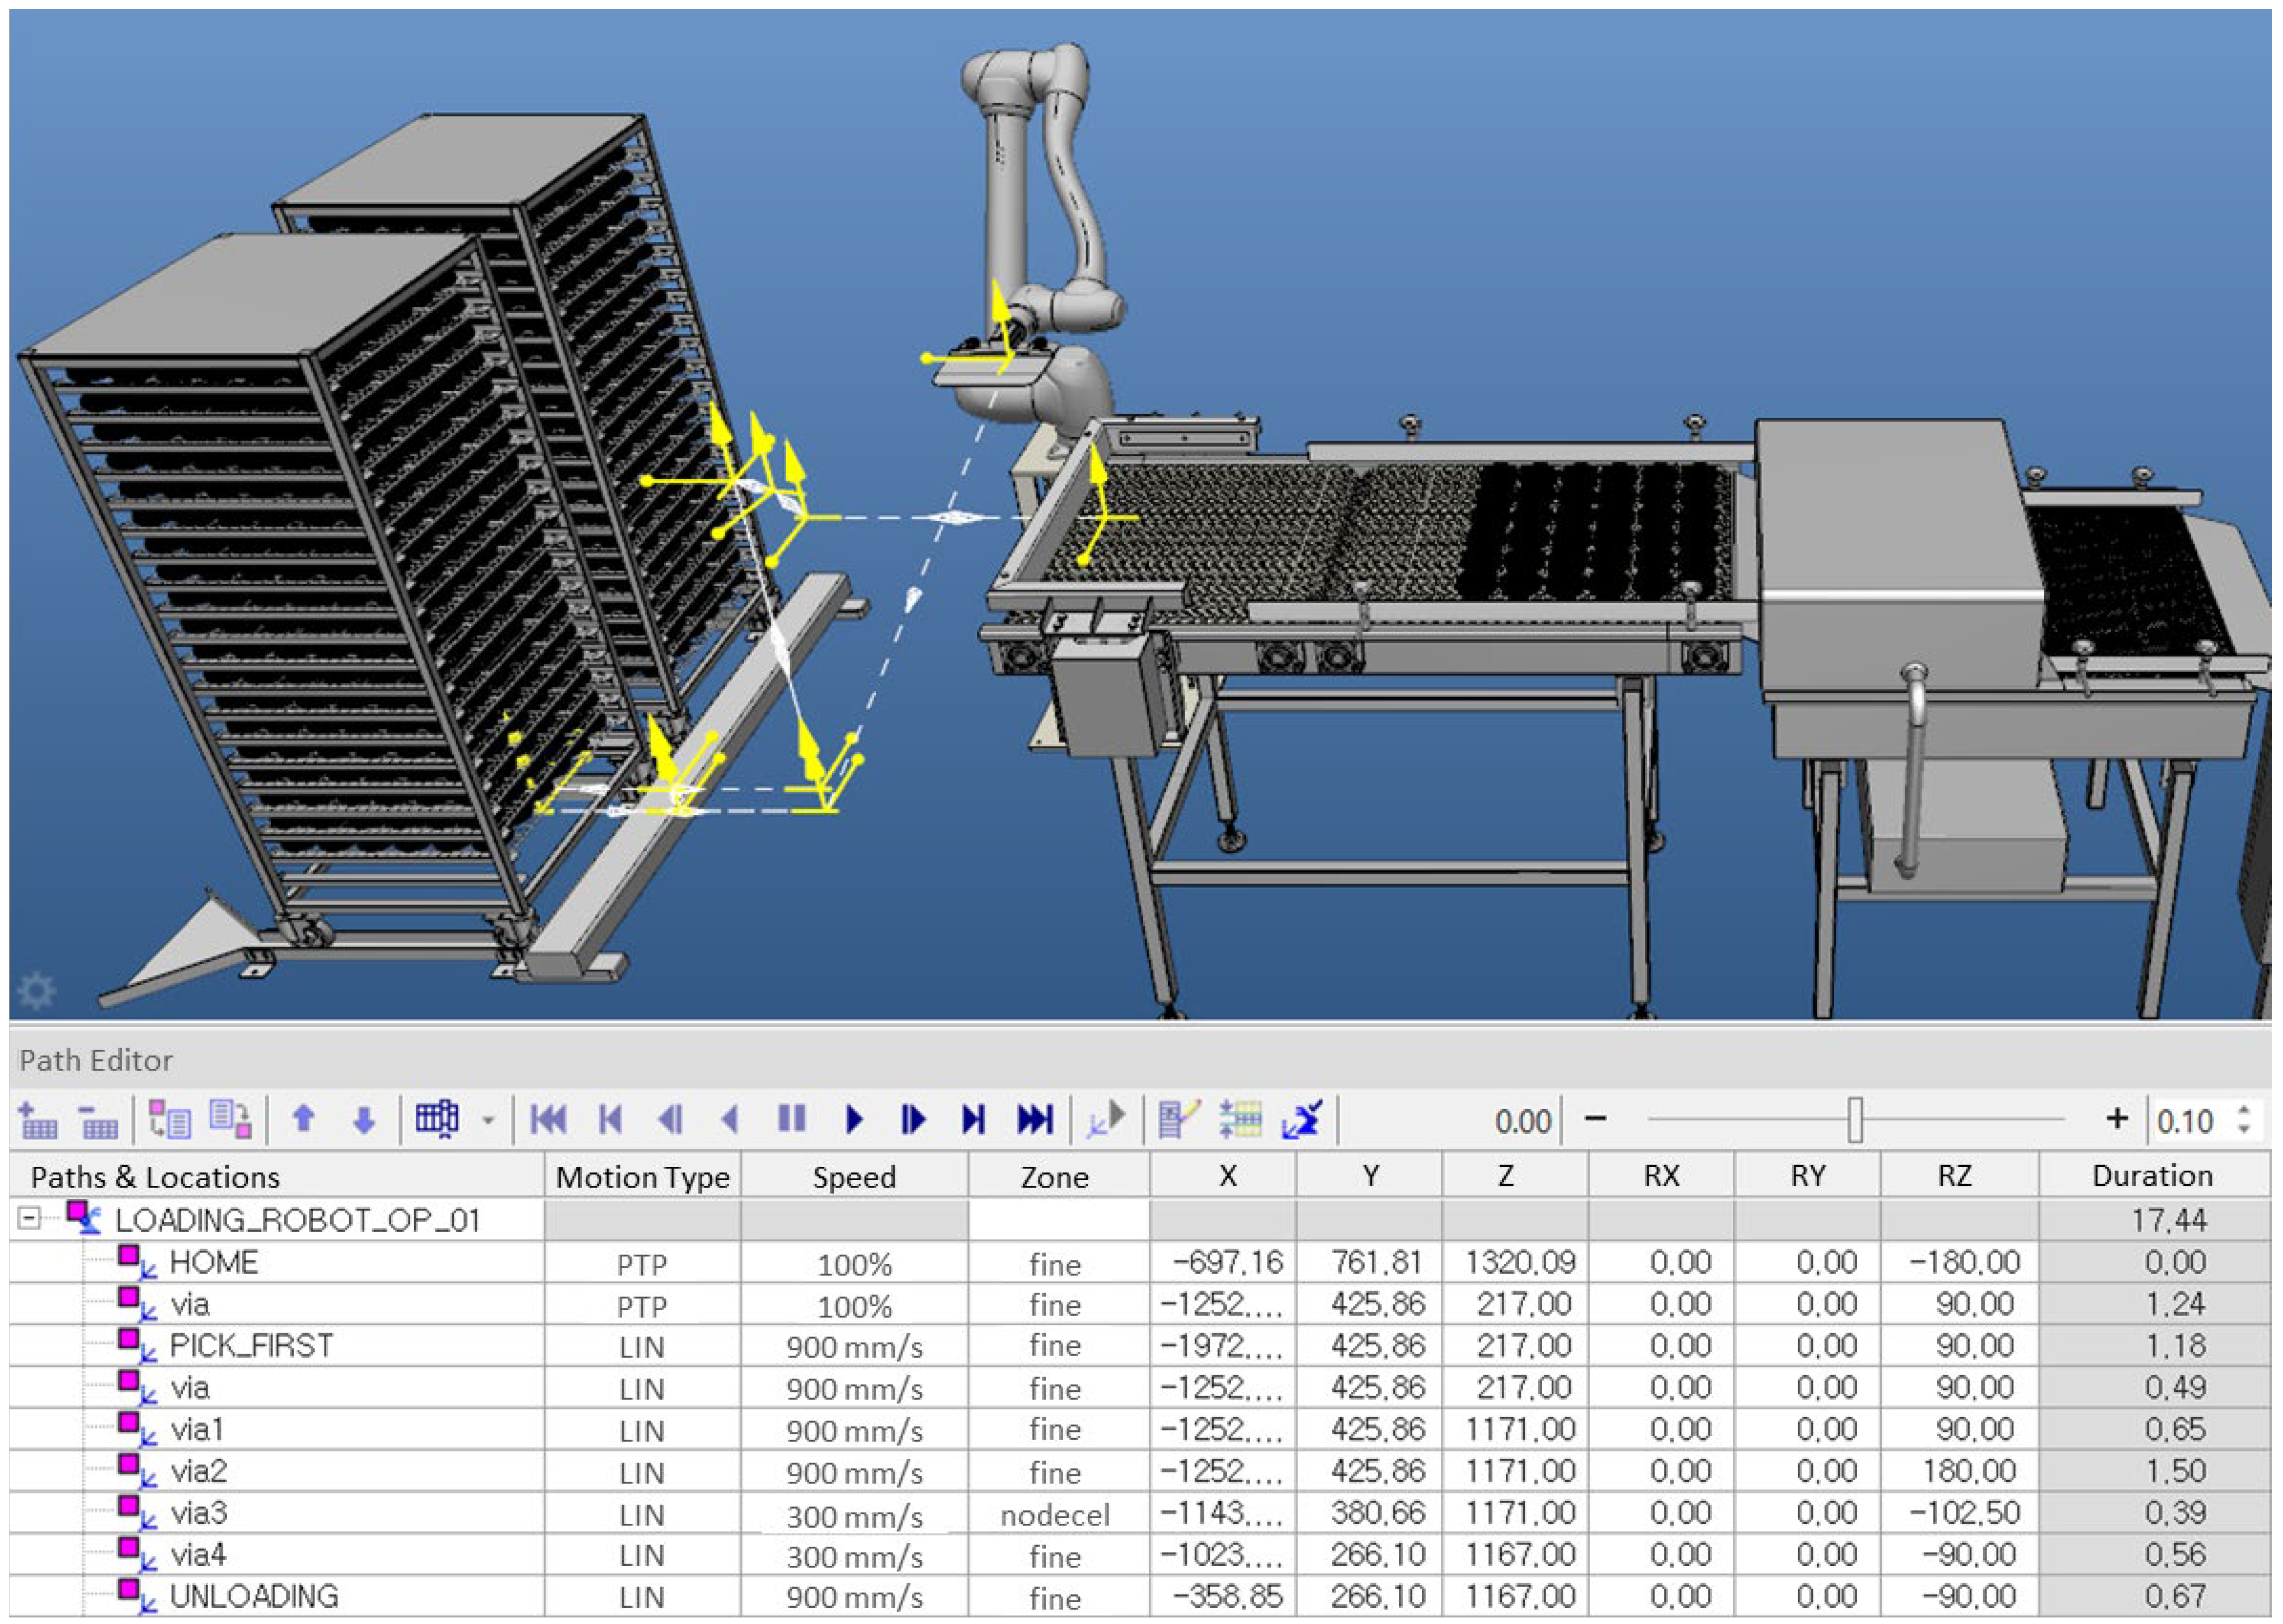
Tecnomatix Process Simulate software (V16.0.1) was used to configure the trajectory and speed to ensure precise movement. ‘Home Position’, which is the starting position, was set as the initial task location and return point after completing each cycle. The specific trajectory of the pick-up and placement points on the tray were created using point-to-point (PTP) movements. Collision detection and additional software tools were applied to improve these paths. This allowed the testing of the robot movements within the production environment. This ensured safe and efficient operation by identifying potential collisions with conveyors, trays, and other equipment.
Worker speeds were inconsistent in conventional settings. The robot’s speed was calibrated along the simulated paths shown in Figure 3. This approach helped to reduce process time and maintain a steady production rate. The speed of the robot was limited to 90 percent of its maximum capacity to ensure worker safety. It operated at full speed only along a short and designated path segment. Adjusting the robot’s movements and speed allowed for production rates that exceeded those of manual operations. Although each quick movement saved only around 0.1 s, these small time savings added up over weeks and months, leading to substantial reductions in production time.

2.3. Chosen KPIs

The objective in both cases was to improve the production process by implementing a robot-automated system. This aimed to either increase throughput or maintain consistent productivity. A set of key performance indicators (KPIs) was selected to analyze the effect of the enhanced simulation, with a focus on production. The throughput, utilization rate, and human resources were chosen as the primary KPIs. SIEMENS Tecnomatix Plant Simulation (V2206) standard library tools were utilized to model and sequence the simulation logically. Each KPI reflected distinct performance measures obtained from the observations and data gathered at the production site. The KPIs were organized into related categories to simplify analysis and interpretation [37].
For the current process, throughput was estimated from manual records of production, and worker involvement was documented for each time period. Detected production data from the company were used to establish the maximum production level, reflecting the highest recorded output. Throughput was then calculated as shown in Equation (1) [37]:
T h r o u g h p u t = ( G Q + R Q ) / A O E T
where GQ refers to good quantity, RQ indicates rework quantity, and AOET represents the actual order execution time in hours. Throughput in the robotic automation system was measured based on the same production time as the manual process.
The utilization rate referred to the proportion of actual work time (AWT) for machines, robots, and workers compared to their planned operational time (POT). This measure was effective in detecting worker overload in manual processes, while in automated systems, it evaluated whether the robotic operations ran continuously without interruption. This allowed for the robot’s continuous operation to be assessed, particularly for avoiding delays caused by bottlenecks. The utilization rate was determined according to the following equation:
U t i l i z a t i o n   R a t e = A W T / P O T   ×   100
The Plant Simulation software (V2206) was configured with consistent parameters for availability and the shift calendar in both manual and robotic automation systems. Availability was set at 95% to reflect the percentage of time the robot remained functional and ready to perform tasks. Ensuring reliability is critical in the food industry to avoid disruptions during operations. The robot’s mean time to repair (MTTR) was defined as 15 min. This represented the shortest duration necessary to return the equipment to its full operational state after experiencing downtime. The shift calendar followed a 5-day, 40 h workweek format, ensuring the simulation results accounted for a maximum of 8 operational hours per day.

2.4. Model Creation Using Simulation: Robotic Automation System

The movement of the robot and the overall system flow were modeled in Tecnomatix Plant Simulation (V2206) using the SimTalk programming language within the method function, as shown in Figure 4. Commands were set to interact with conveyor sensors. In Case A, the robot delivered trays to a designated “location” and paused until all products were removed. Then, the robot transferred the empty tray back to the rack and repeated the cycle. In Case B, the robot provided an empty tray to the worker. Once the tray was fully loaded with products and reached the robot’s position, the robot placed the loaded tray onto the rack. Specific conveyor points were designated to ensure trays stopped at precise locations for loading or unloading. The robot’s movements followed predefined actions set in the earlier robot process simulation.

2.5. Environment of Virtual System Configuration

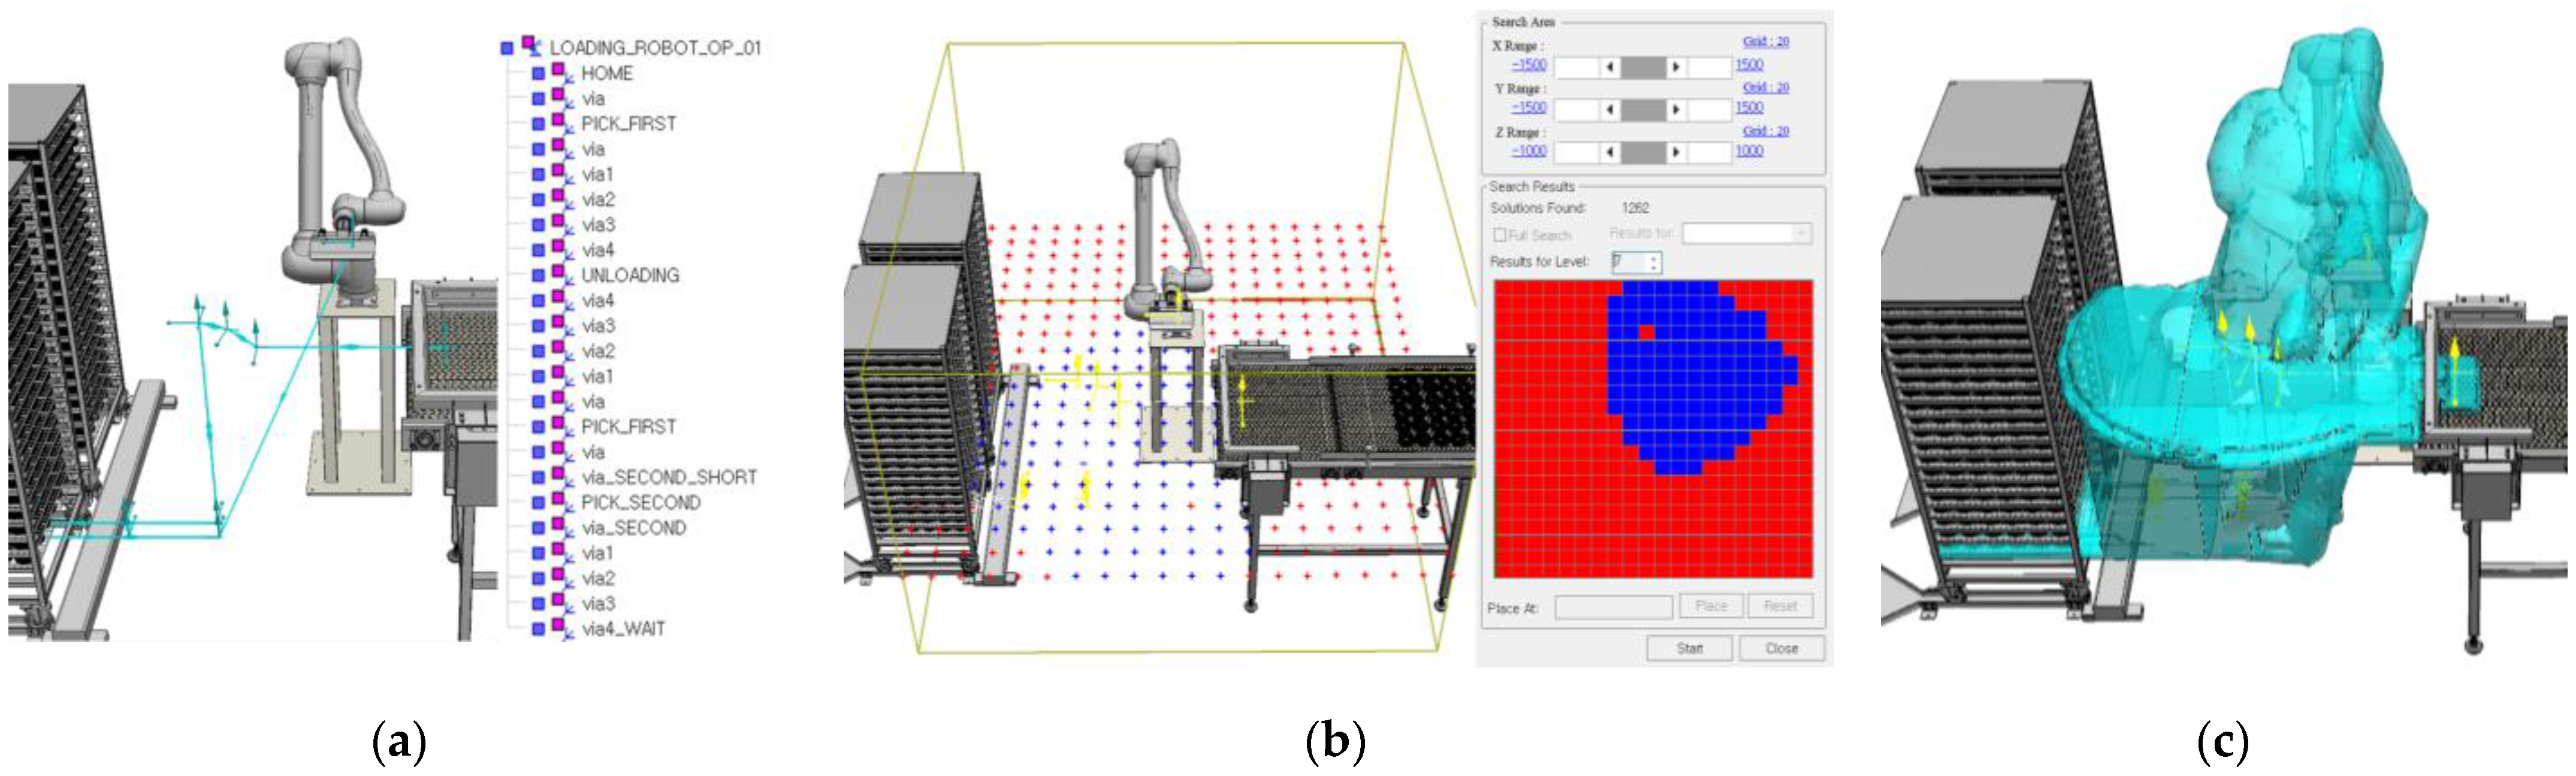
In the 3D simulator, a virtual robotic automation system was set up using the OPC-UA (Open Platform Communication—Unified Architecture) protocol, allowing for a virtual manufacturing environment where the control logic could be tested without the need for physical equipment production, installation, or commissioning. The simulation enabled control verification from the initial design phase of the robotic automation process to the commissioning phase through the virtualization of the equipment. Table 1 shows the configuration of the virtual system environment used for robotic automation process simulations. The hardware setup includes the XBC-DR64H PLC (LSIS Inc., Seoul, Republic of Korea) and eXP40-TTA HMI (LSIS Inc., Seoul, Republic of Korea). The software components consist of the OPC-UA protocol (KEPServerEx6, Kepware Technologies, Portland, OR, USA) for communication, XG5000 (LSIS Inc., Seoul, Republic of Korea) for PLC programming, and Tecnomatix V2206.0 (SIEMENS Inc., Munich, Germany) as the simulation platform. This setup enabled a comprehensive virtual commissioning process, allowing control logic testing from the design to the commissioning stages without physical equipment installation.
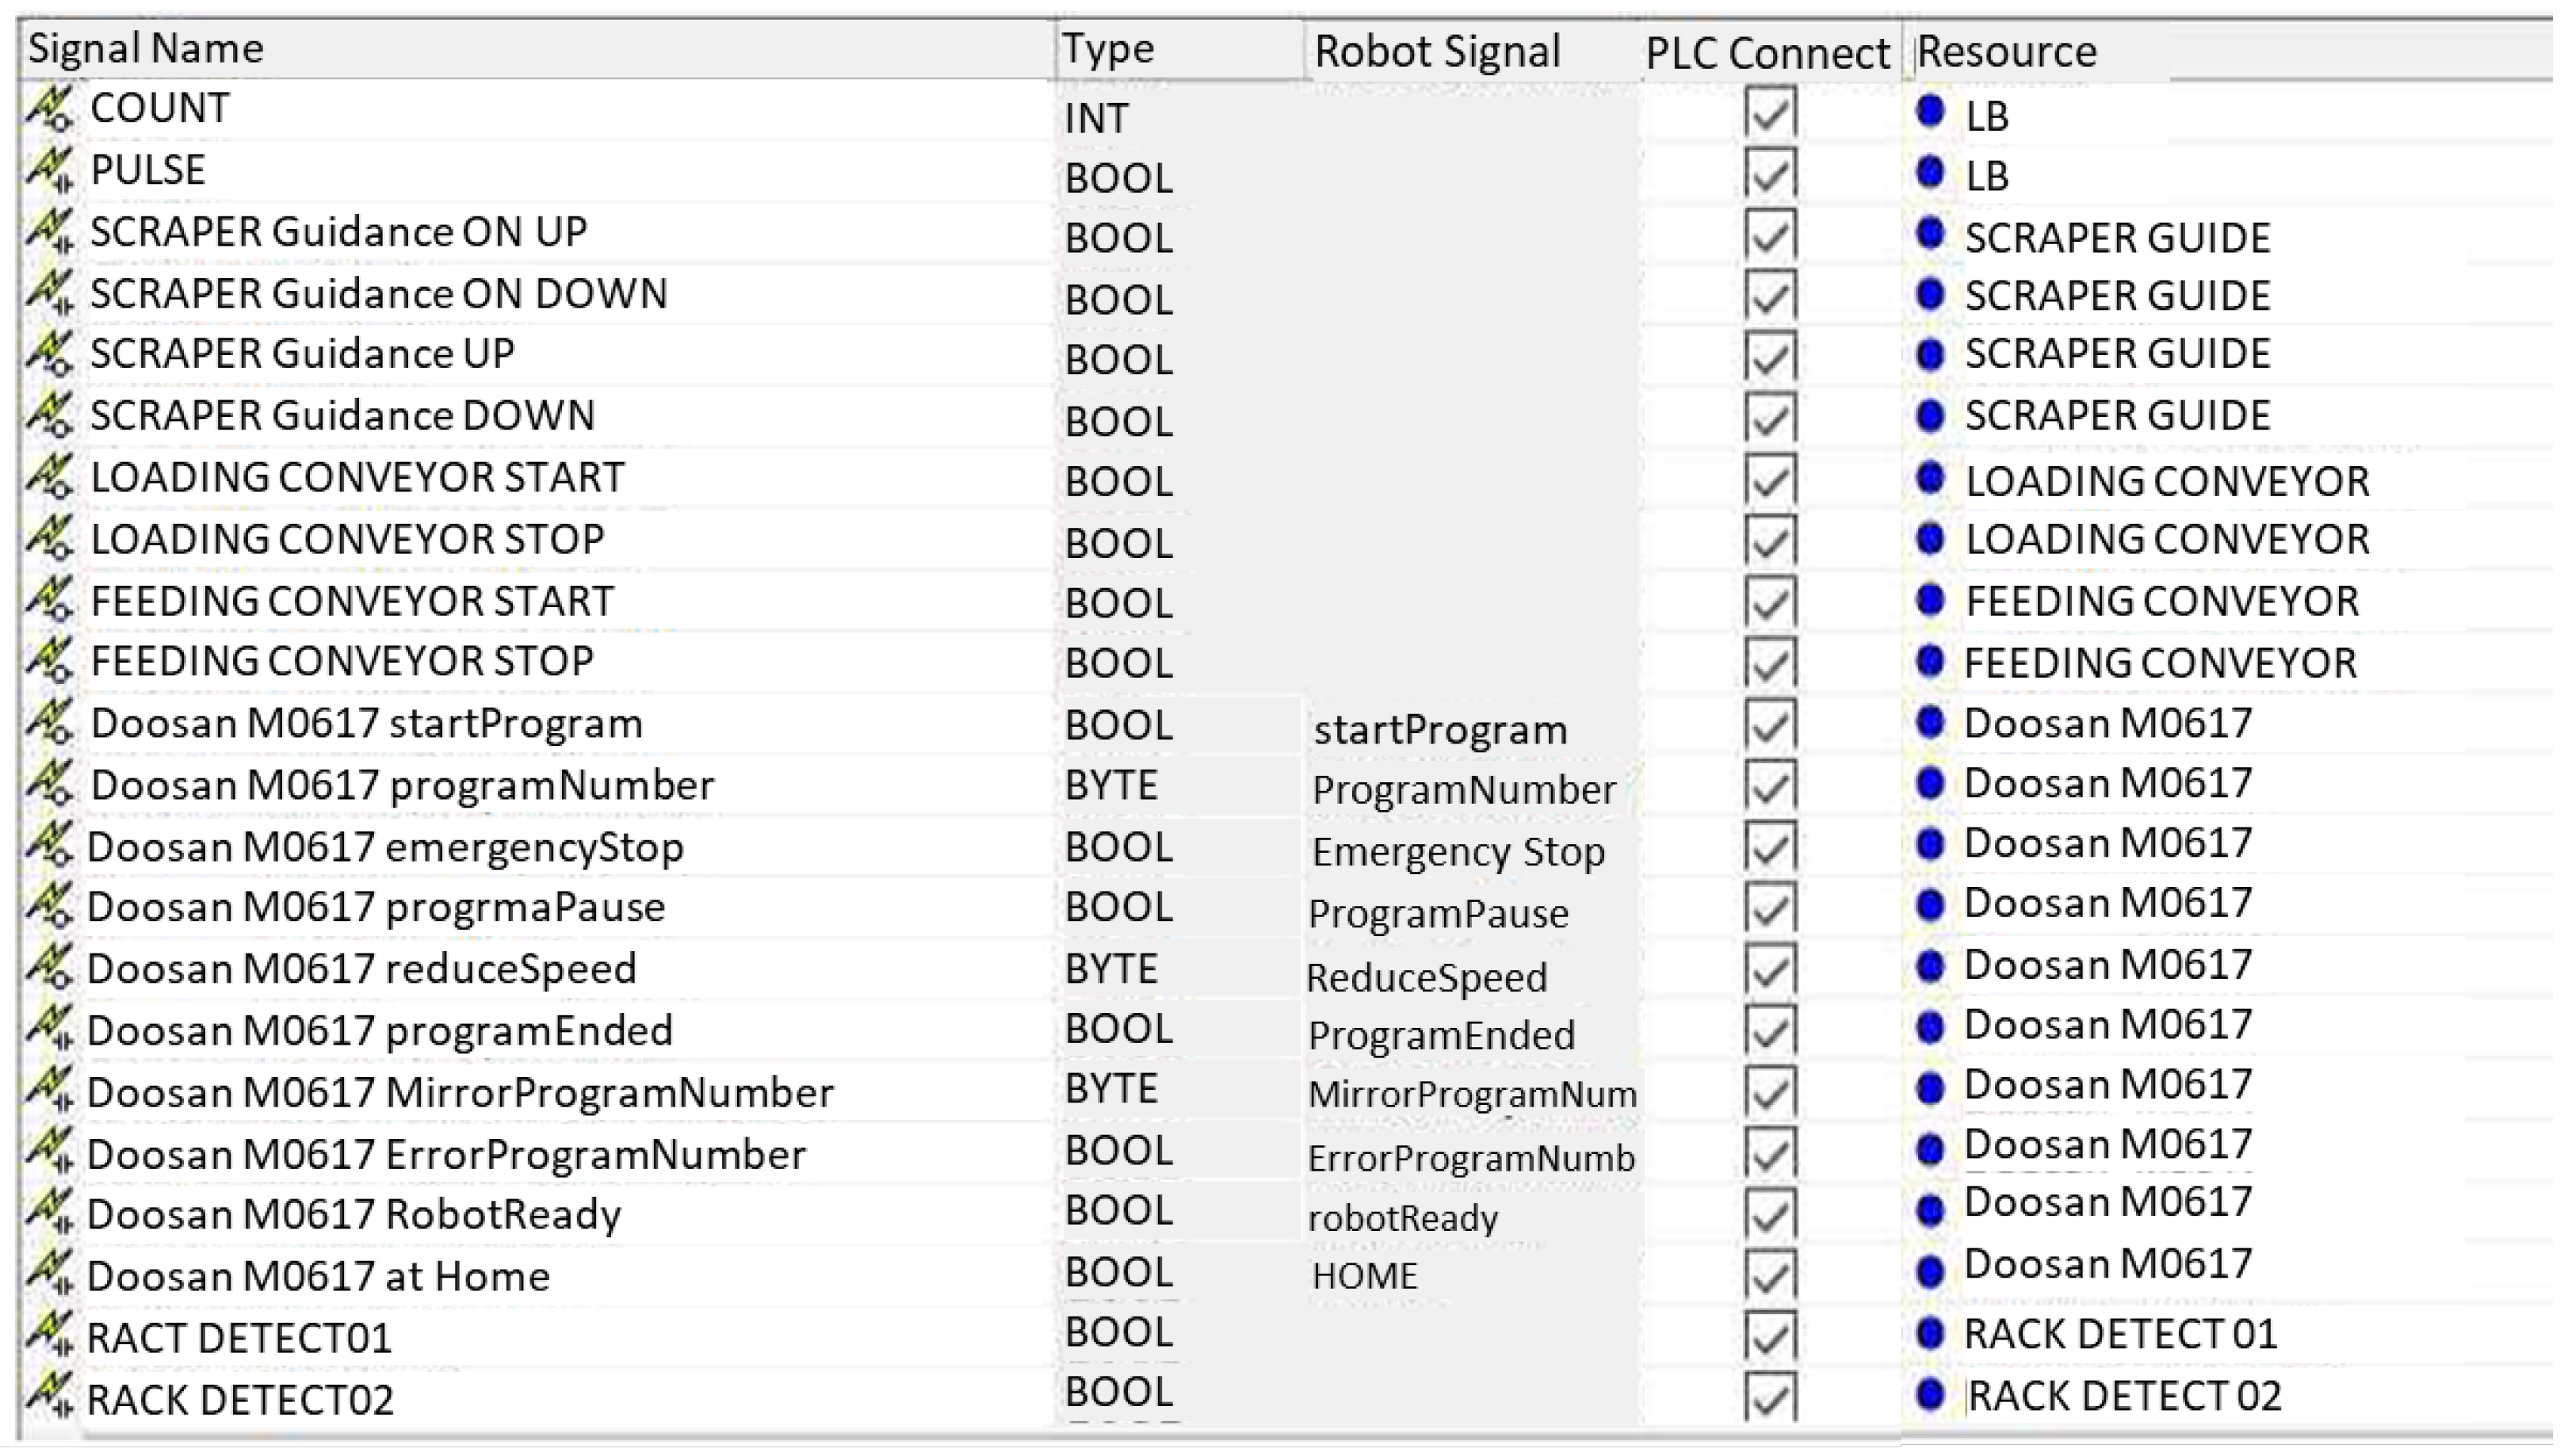
The virtual commissioning system focused on supplying trays to the manufacturing station. When a tray was moved to the main rack, the robot gripped it with its gripper. The robot then placed the products onto the loading conveyor and returned the empty tray to its original position on the rack. In the 3D simulator, virtual devices and signals were generated to represent the process, linking the control PLC with virtual devices and equipment through the OPC-UA protocol. The scraper’s up–down motion, the loading conveyor, and the feeding conveyor were all tested in manual mode to verify operation. Figure 5 shows the virtual commissioning testbed environment. Signal mapping for activating, selecting task programs, and stopping the operations of the virtual Doosan robot (M0617) was configured.

3. Results

The effectiveness of the application of robot was analyzed by comparing it with the original manual processes. The results for the two similar cases were compared using throughput and utilization as KPIs.

3.1. Case A: Supply Tray in Food Manufacturing Process

3.1.1. 3D Reconstruction of Case A

To analyze worker utilization rates and staffing based on production volume in the tray supply process, the existing systems and equipment used on-site were recreated in a 3D model. Figure 6 shows the manual process and robot automated system. For the improved system, a robot was integrated to assess its effectiveness. Originally, one worker supplied trays loaded with products from the rack for the syrup glazing process, while a second worker aligned and glazed the products. The empty tray was returned to the adjacent rack when all products were processed. The process continued in sequence. Each tray held 36 products, and the rack could hold up to 20 trays. This setup was used in the simulation to enable a single worker to complete the entire process more efficiently.

3.1.2. Model Creation in Process Simulation

In Case A, a process simulation was created to determine whether the robot could be effectively applied to supply trays loaded with products. This system was designed with the assumption that once the robot had supplied the tray, the worker or the doughnut supply conveyor would take over. The doughnuts would then align automatically. The robot’s trajectory was configured as shown in Figure 7a. The robot was programmed to handle each of the 20 trays on the rack in sequence and to move and reposition each tray until the rack was fully processed. The Smart Place function assessed the suitability of the robot’s placement within the actual site. This evaluation considered elements such as the robot’s operational range and the arrangement of automated equipment. Figure 7b showed that the robot was positioned in the optimal area, marked in blue in the system layout. To ensure safe operation, interactions between the robot, workers, and system components were examined for potential collisions. Figure 7c illustrates that no collisions occurred during the process, validated through the generation of a 3D volume.

3.1.3. Simulation Creation in Tecnomatix Plant Simulation

Simulation was used to assess the utilization rate of workers performing manual tasks. The workflow and movement logic of workers at the current site were modeled and analyzed, as shown in Figure 8. Three workers were involved, producing 221 trays in a day. The utilization rate of the worker responsible for fetching racks and supplying trays to other workers was analyzed to be 20.12%. The workers who manually separated, aligned, and supplied the products from the trays had a utilization rate of 75.05%. Those performing the glazing process also showed the same utilization rate.
The simulation results for the robot-applied model are shown in Figure 9. The worker supplying trays from the rack was replaced by a robot. The robot automatically supplied trays loaded with products from the rack. After unloading all the products, it returned the empty tray to a designated position on the adjacent rack. When automatic supply conveyors and glazing equipment were introduced, it was estimated that production could reach 406 trays per day. The robot’s utilization rate was calculated at 75.59%, indicating that it could continuously operate without pauses, thus reducing the workload on human workers. The simulation showed that only one worker would be needed to supply the racks, allowing a single worker to manage the entire process instead of the original three workers.

3.2. Case B: Positioning Product-Filled Trays on the Rack

3.2.1. 3D Reconstruction of Case B

In Case B, products that have been glazed and cooled in a deep freezer are loaded onto trays and then positioned by workers onto racks in preparation for packaging. The systems and equipment used on-site were recreated in 3D to analyze worker utilization rates and working for this process. Figure 10 shows the 3D model developed to evaluate the effectiveness of the robotic system. This model was implemented with the same setup as the current one, where workers handle the process. When the finished products were automatically supplied, the worker aligned them on the tray. The tray was then placed from the bottom to the top of the rack. In the improved process, the robot was programmed to supply empty trays from the rack to the conveyor, making them accessible to the worker. After the worker aligned products on a tray, it was placed on a conveyor that automatically delivered it to the robot. The robot then picked up the tray and positioned it in an empty slot on the rack. This setup simplified the worker’s tasks and reduced unnecessary movement, allowing the process to be completed by a single worker.

3.2.2. Model Creation in Process Simulation

Process simulation was used to analyze and design the improved process. This evaluated whether the loading operations performed by the worker and the robot were optimally implemented. Figure 11a shows that trajectories were created for the robot to supply trays and to position the filled trays back on the rack when the aligned products reached the designated area. The robot’s speed was set to a slower rate to accommodate the limited space and the need to carefully position the aligned products. To verify that the robot’s position was suitable for performing the task, an analysis was conducted, as shown in Figure 11b. The robot was confirmed to be correctly positioned within the blue zone, indicating optimal placement. The configured robot trajectories were tested for any potential collisions or interferences with workers or the system. Figure 11c confirms that no collisions occurred throughout the process. This includes the handling of all 20 trays on the rack, as verified through volume creation analysis.

3.2.3. Simulation Creation in Tecnomatix Plant Simulation

The simulation was configured to match the current production rate of 221 trays per day. This setup allowed for an analysis of the utilization rate of workers, as shown in Figure 12. Worker 2 and Worker 3 represent the same person performing two separate tasks at the actual site. These tasks are aligning completed products and placing loaded trays on the rack. For simulation purposes, these tasks were split and assigned to separate logical workers to represent each task individually. In the actual process, one worker completes both tasks. This results in a utilization rate of 86.02% for product alignment and 5.94% for loading trays onto the rack. This totaled a high utilization rate of 91.96%, indicating significant overload for the single worker. An additional worker was included in the simulation to represent the relative utilization rates across tasks, as only showing one worker would not highlight the differences in task utilization. Worker 1 represents a role that involves adding syrup or decorations to products before the deep freezer stage, which is not a focus of this process.
The results of the simulation model with robotic integration are shown in Figure 13. A tray conveyor was added to facilitate smooth circulation within the limited workspace, supporting the process that was originally managed by a single worker. According to the plant simulation results, the process could handle up to 281 trays per day. The robot’s utilization rate was 6.63%. The worker’s utilization rate decreased to 70.27% as a result of the simplified tasks and optimized workflow. This represents a reduction compared to the original manual process.

3.3. Case A and Case B Outcome Comparison

The integration of the robotic automation system showed improvements compared to the manual processes in both Case A and Case B. Throughput and handling efficiency both showed an increase while maintaining the same completion time. Utilization rates and worker requirements were also reduced (Table 2).
The robotic system throughput of Case A increased by up to 83.7%. For Case B, throughput rose by approximately 27.1%. Since both cases were based on a single production line, the initial production capacity was the same. The reason for the lower production increase in Case B compared to Case A is that workers vertically align the products in Case B, allowing for a higher number of items per tray. The higher utilization rate of workers in Case B corresponds with a lower utilization rate for the robot. However, both cases demonstrated that the robot could alleviate the physical strain on workers. Tasks such as bending to remove and insert trays on the lower part of the rack can contribute to musculoskeletal issues. Similarly, reaching above shoulder height to place trays on higher racks also poses a risk. These movements could be handled by the robot. Both cases highlighted the advantages of robotic automation. Not only does it enhance productivity, but it also reduces workers’ physical workload. This leads to a more streamlined and efficient production process.

3.4. OLP Programming Macro Implementation and Test

The virtual commissioning testbed system was designed as an automated robotic process for supplying trays initially loaded with products. Figure 14 shows the virtual devices and signals created and mapped to implement the series of process steps within the 3D simulator. These elements connected the control PLC, virtual devices, and equipment using the OPC-UA protocol. Signal mapping was performed to control the virtual Doosan robot (M0617), with functions including Robot Ready, StartProgram, ProgramNumber, EmergencyStop, and ProgramPause.
The up-and-down motion of the product auto-supply scraper, along with the loading and feeding conveyors, was tested in manual mode. Figure 15 is a resource logic block implemented to control the scraper’s upward and downward movements. The PLC program and HMI touch interface were configured to output control signals to the OPC-UA server’s mapped tags. This setup enabled signal transmission to the virtual equipment and confirmed its operation.

4. Discussion

This study investigated the implementation of robotic automation within a food manufacturing setting. It specifically evaluated two cases (Case A and Case B) to assess improvements in productivity, worker utilization, and process efficiency. By comparing automated and manual processes, the results highlighted the effectiveness of robotic systems in streamlining operations and reducing worker strain. Simulations were used to assess performance in the bakery industry, where tasks often require handling trays and involve repetitive motions that can strain workers over time.
The simulation analyses revealed substantial improvements in utilization rates and throughput with robotic automation. These findings align with previous research suggesting that automation can significantly enhance productivity and operational consistency in manufacturing environments [14,15,20,21]. Both cases applied similar robotic systems at different stages of the manufacturing process, before and after primary processing. This underscored the flexibility of robotic automation and its potential applicability across diverse production environments in the bakery industry. The validation was conducted virtually via OPC-UA, demonstrating the feasibility of implementing the simulated system. This validation showed that simulation results could closely match actual production outcomes. This confirmed the reliability of simulations as predictive tools for identifying potential improvements when implementing robotic systems. These findings support the value of simulations in planning and refining production enhancements.
The KPIs, such as throughput and utilization rates, were essential in evaluating the robotic automation system’s impact. These KPIs provided a clear basis for comparing manual and automated setups. The results revealed that robotic systems not only maintained but also increased production output. Workforce reduction served as an indicator in the analysis. This demonstrated the system’s ability to lessen the need for manual labor in repetitive, physically demanding tasks.
Despite the promising results, several limitations of this study should be acknowledged. The simulations were based on specific case scenarios in the bakery industry, and their applicability to other production environments may vary. This study focused exclusively on a particular type of tray process with fixed dimensions, which may not capture the variability of different bakery products or processes. For different product weights or sizes, the loading times achieved by workers would need to be reconsidered, and increased weight may require replacing the robot and reanalyzing its trajectory. However, based on its operations, the system is expected to be highly effective for repetitive tasks, such as supplying trays from racks and transporting them back to racks after processing. The results of this study extend beyond time savings, as the implementation of robotic systems showed potential for reducing workforce dependency. While this research primarily focused on productivity improvements, future applications of similar systems could significantly lower operational costs, including maintenance and resource consumption. In this study, the costs associated with implementing the robotic automation system and the return on investment (ROI) were not analyzed. Future research could calculate the costs of commercialized equipment and robots to incorporate labor costs and provide more comprehensive economic value assessments. This approach could further highlight the potential for similar systems to lower operational costs and increase overall efficiency. The simulations were based on fixed assumptions and did not account for dynamic factors like unexpected disruptions or variations in worker performance. Furthermore, the lack of economic analysis or physical validation in a real-world production setting suggests the need for further research to explore these aspects comprehensively. These limitations provide avenues for future research to enhance the generalizability and practical applicability of robotic automation in food manufacturing and beyond.
Future research should expand the scope to include more-diverse production setups, enabling a comprehensive analysis that accounts for preceding and subsequent processes. This approach would support full-scale factory simulations and assist in furthering digital transformation goals in the bakery sector. Further studies should consider detailed cost–benefit analyses to assess the financial feasibility of robotic integration for SMEs.

5. Conclusions

This study demonstrated that robotic automation significantly enhanced productivity and reduced physical strain on workers within a food manufacturing environment. The application of robotic systems led to an 83.7% increase in throughput for simpler processes and a 27.1% increase for more complex operations, confirming that task complexity directly impacted the effectiveness of automation. Regarding ergonomically challenging tasks, robotic automation reduced the likelihood of workplace injuries and improved overall worker well-being, contributing to a safer production environment.
This research highlighted the valuable role of simulation models in designing and testing robotic systems, specifically within the bakery industry. The findings suggested that robotic automation could improve production efficiency, lower physical demands on workers, and enhance operational consistency. For SMEs facing limitations in manual operations, the insights from this study indicated that automation could be an effective strategy for boosting productivity while mitigating labor shortages. The case comparisons revealed that similar automation strategies could be adapted across different production setups, positioning this approach as a versatile tool for optimizing bakery production lines. Future research should consider applying these models to real-world environments to validate the simulation results. Integrating hybrid systems that blend human and robotic labor could yield further insights into achieving optimal efficiency and safety in different manufacturing contexts. Additionally, the integration of data collection and comprehensive plant simulations could lead to the development of adaptive automation systems that efficiently manage energy use across all production stages.

Author Contributions

Conceptualization, S.E.O.; methodology, S.B.; software, S.B. and S.E.O.; validation, S.B. and S.H.L.; formal analysis, S.B.; investigation, S.B. and S.H.L.; resources, S.B., S.E.O. and S.H.L.; data curation, S.B.; writing—original draft preparation, S.B.; writing—review and editing, S.H.L. and S.E.O.; visualization, S.B.; supervision, S.E.O.; project administration, S.E.O.; funding acquisition, S.E.O. All authors have read and agreed to the published version of the manuscript.

Funding

This research was supported by the Main Research Program (E0220702) of the Korea Food Research Institute (KFRI), funded by the Ministry of Science and ICT (Republic of Korea).

Data Availability Statement

The original contributions presented in the study are included in the article. Further inquiries can be directed to the corresponding authors.

Conflicts of Interest

The authors declare no conflicts of interest.

References

  1. Hassoun, A.; Jagtap, S.; Garcia-Garcia, G.; Trollman, H.; Pateiro, M.; Lorenzo, J.M.; Trif, M.; Rusu, A.V.; Aadil, R.M.; Šimat, V.; et al. Food quality 4.0: From traditional approaches to digitalized automated analysis. J. Food Eng. 2023, 337, 111216. [Google Scholar] [CrossRef]
  2. Hassoun, A.; Aït-Kaddour, A.; Abu-Mahfouz, A.M.; Rathod, N.B.; Bader, F.; Barba, F.J.; Biancolillo, A.; Cropotova, J.; Galanakis, C.M.; Jambrak, A.R.; et al. The fourth industrial revolution in the food industry—Part I: Industry 4.0 technologies. Crit. Rev. Food Sci. Nutr. 2023, 63, 6547–6563. [Google Scholar] [CrossRef]
  3. Lefranc, G. Review of trends in manufacturing systems based on industry 4.0: The opportunities. In International Conference on Computers Communications and Control; Springer International Publishing: Cham, Switzerland, 2022; pp. 182–192. [Google Scholar]
  4. Wakchaure, Y.B.; Patle, B.K.; Pawar, S. Prospects of robotics in food processing: An overview. J. Mech. Eng. Autom. Control Syst. 2023, 4, 17–37. [Google Scholar] [CrossRef]
  5. Almurib, H.A.; Al-Qrimli, H.F.; Kumar, N. A review of application industrial robotic design. In Proceedings of the 2011 Ninth International Conference on ICT and Knowledge Engineering, Bangkok, Thailand, 11–13 January 2012; IEEE: New York, NY, USA; pp. 105–112. [Google Scholar]
  6. Vu, H.; Leopold, H.; Van Der Aa, H. What is business process automation anyway? In Proceedings of the Hawaii International Conference on System Sciences (HICSS), Kauai, HI, USA, 5–8 January 2023; pp. 5462–5471. [Google Scholar]
  7. Duong, L.N.; Al-Fadhli, M.; Jagtap, S.; Bader, F.; Martindale, W.; Swainson, M.; Paoli, A. A review of robotics and autonomous systems in the food industry: From the supply chains perspective. Trends Food Sci. Technol. 2020, 106, 355–364. [Google Scholar] [CrossRef]
  8. Caldwell, D.G.; Davis, S.; Moreno Masey, R.J.; Gray, J.O. Automation in food processing. In Springer Handbook of Automation; Springer: Chem, Switzerland, 2009; pp. 1041–1059. [Google Scholar]
  9. Echelmeyer, W.; Kirchheim, A.; Wellbrock, E. Robotics-logistics: Challenges for automation of logistic processes. In Proceedings of the 2008 IEEE International Conference on Automation and Logistics, Qingdao, China, 1–3 September 2008; IEEE: New York, NY, USA; pp. 2099–2103. [Google Scholar]
  10. Mathath, A.; Fernando, Y. Robotic transformation and its business applications in food industry. In Robotics, Automation, and Control in Industrial and Service Settings; IGI Global: Hershey, PA, USA, 2015; pp. 281–305. [Google Scholar]
  11. Kumar, P. Robotics Intervention in Food Processing Industries: A Mini Review. Curr. J. Appl. Sci. Technol. 2022, 41, 1–9. [Google Scholar]
  12. Bloss, R. Robots use machine vision and other smart sensors to aid innovative picking, packing and palletizing. Ind. Robot Int. J. 2013, 40, 525–529. [Google Scholar] [CrossRef]
  13. Grobbelaar, W.; Verma, A.; Shukla, V.K. Analyzing human robotic interaction in the food industry. J. Phys. Conf. Ser. 2021, 1714, 012032. [Google Scholar] [CrossRef]
  14. Mason, A.; Haidegger, T.; Alvseike, O. Time for change: The case of robotic food processing [industry activities]. IEEE Robot. Autom. Mag. 2023, 30, 116–122. [Google Scholar] [CrossRef]
  15. Andersson, H.J. Picking pizza picker. ABB Rev. Spec. Rep. Robot. 2005, 3, 23–27. [Google Scholar]
  16. Müller, C. World Robotics 2023—Industrial Robots; IFR Statistical Department, VDMA Services GmbH: Frankfurt am Main, Germany, 2023. [Google Scholar]
  17. de Paula Ferreira, W.; Armellini, F.; De Santa-Eulalia, L.A. Simulation in industry 4.0: A state-of-the-art review. Comput. Ind. Eng. 2020, 149, 106868. [Google Scholar] [CrossRef]
  18. Negahban, A.; Smith, J.S. Simulation for manufacturing system design and operation: Literature review and analysis. J. Manuf. Syst. 2014, 33, 241–261. [Google Scholar] [CrossRef]
  19. Huynh, B.H.; Akhtar, H.; Li, W. Discrete event simulation for manufacturing performance management and optimization: A case study for model factory. In Proceedings of the 2020 9th International Conference on Industrial Technology and Management (ICITM), Oxford, UK, 2–4 February 2020; IEEE: New York, NY, USA; pp. 16–20. [Google Scholar]
  20. Kikolski, M. Identification of production bottlenecks with the use of Plant Simulation software. Eng. Manag. Prod. Serv. 2016, 8, 103–112. [Google Scholar] [CrossRef]
  21. Kovbasiuk, K.; Židek, K.; Balog, M.; Dobrovolska, L. Analysis of the selected simulation software packages: A study. Acta Technol. 2021, 7, 111–120. [Google Scholar] [CrossRef]
  22. Feng, Y.; Gao, G. Design and simulation study on logistics planning in automatic plant factory based on Tecnomatix Plant Simulation. In Proceedings of the 2019 2nd World Conference on Mechanical Engineering and Intelligent Manufacturing (WCMEIM), Shanghai, China, 16–17 November 2019; IEEE: New York, NY, USA; pp. 667–671. [Google Scholar]
  23. Wu, G.; Yao, L.; Yu, S. Simulation and optimization of production line based on FlexSim. In Proceedings of the 2018 Chinese Control and Decision Conference (CCDC), Shenyang, China, 9–11 June 2018; IEEE: New York, NY, USA; pp. 3358–3363. [Google Scholar]
  24. Hecker, F.; Hussein, W.; Becker, T. Analysis and optimization of a bakery production line using ARENA. Int. J. Simul. Model. 2010, 9, 208–216. [Google Scholar] [CrossRef]
  25. Babor, M.; Paquet-Durand, O.; Kohlus, R.; Hitzmann, B. Modeling and optimization of bakery production scheduling to minimize makespan and oven idle time. Sci. Rep. 2023, 13, 235. [Google Scholar] [CrossRef]
  26. Pham, H.; Stepanova, A.; Zourmand, A.; Christophe, F.; Kaikkonen, J.; Laakkonen, M.P. Transforming bakery production lines in Finnish SMEs through modeling, simulation, and co-robotization for efficient use of energy resources. Int. J. Simul. Syst. Sci. Technol. 2023, 24, 1–4. [Google Scholar] [CrossRef]
  27. Aziz, S.; Jung, D.W.; Aqeel, A.B. Digital Twins in Smart Manufacturing. In Handbook of Manufacturing Systems and Design; Taylor & Francis: Milton Park, UK, 2024. [Google Scholar]
  28. Sujová, E.; Vysloužilová, D.; Čierna, H.; Bambura, R. Simulation Models of Production Plants as a Tool for Implementation of the Digital Twin Concept into Production. Manuf. Technol. 2020, 20, 527–533. [Google Scholar] [CrossRef]
  29. Hovanec, M.; Korba, P.; Vencel, M.; Al-Rabeei, S. Simulating a digital factory and improving production efficiency by using virtual reality technology. Appl. Sci. 2023, 13, 5118. [Google Scholar] [CrossRef]
  30. Janeková, J.; Fabianová, J.; Kádárová, J. Optimization of the automated production process using software simulation tools. Processes 2023, 11, 509. [Google Scholar] [CrossRef]
  31. Demčák, J.; Židek, K.; Krenický, T. Digital twin for monitoring the experimental assembly process using RFID technology. Processes 2024, 12, 1512. [Google Scholar] [CrossRef]
  32. Sharma, A.; Kosasih, E.; Zhang, J.; Brintrup, A.; Calinescu, A. Digital twins: State of the art theory and practice, challenges, and open research questions. J. Ind. Inf. Integr. 2022, 30, 100383. [Google Scholar] [CrossRef]
  33. Maheshwari, P.; Kamble, S.; Belhadi, A.; Mani, V.; Pundir, A. Digital twin implementation for performance improvement in process industries—A case study of food processing company. Int. J. Prod. Res. 2023, 61, 8343–8365. [Google Scholar] [CrossRef]
  34. Siderska, J. Application of tecnomatix plant simulation for modeling production and logistics processes. Bus. Manag. Educ. 2016, 14, 64–73. [Google Scholar] [CrossRef]
  35. Bangsow, S. Tecnomatix Plant Simulation; Springer: Cham, Switzerland, 2020. [Google Scholar]
  36. Zamboni, M.; Valente, A. Collaborative robots: Overview and future trends. In Industrial Robots: Design, Applications and Technology; Isak, K., Ed.; Nova Science Publishers, Inc.: Hauppauge, NY, USA, 2020; pp. 171–199. [Google Scholar]
  37. Kang, N.; Zhao, C.; Li, J.; Horst, J.A. A Hierarchical Structure of Key Performance Indicators for Operation Management and Continuous Improvement in Production Systems. Int. J. Prod. Res. 2016, 54, 6333–6350. [Google Scholar] [CrossRef] [PubMed]
Figure 1. Three-dimensional point cloud data acquired by scanning a manual doughnut manufacturing site and reconstructing it in a three-dimensional model.
Processes 12 02791 g001
Figure 2. Mount gripping system of the end-effector to the robot, defined as the tool center point (TCP) in Tecnomatix Process Simulate.
Processes 12 02791 g002
Figure 3. Control of robot speed and the trajectory of the robot in Tecnomatix Process Simulation.
Processes 12 02791 g003
Figure 4. Simulation model with applied methods.
Processes 12 02791 g004
Figure 5. Control signal mapping for virtual robots and devices.
Processes 12 02791 g005
Figure 6. Simulation model for Case A: manual process and robot-automated system.
Processes 12 02791 g006
Figure 7. Robot path planning and placement analysis in Case A: (a) path setting, (b) placement suitability, (c) collision detection.
Processes 12 02791 g007
Figure 8. Analyzing throughput and utilization rate using plant simulation of manual operations in Case A: (a) Logic of the manual process, (b) 3D simulation of the manual process.
Processes 12 02791 g008
Figure 9. Analyzing the throughput and utilization rate of the robot-automated system in Case A.
Processes 12 02791 g009
Figure 10. Simulation model for Case B: manual process and robot-automated system.
Processes 12 02791 g010
Figure 11. Robot path planning and placement analysis in Case B: (a) path setting, (b) placement suitability, (c) collision detection.
Processes 12 02791 g011
Figure 12. Analyzing throughput and utilization rate using plant simulation of logic manual place in Case A.
Processes 12 02791 g012
Figure 13. Analyzing throughput and utilization rate of robot-automated system in Case B.
Processes 12 02791 g013
Figure 14. Control signal mapping for virtual robots and devices.
Processes 12 02791 g014
Figure 15. Implementation of scraper guidance up and down via a resource logic block.
Processes 12 02791 g015
Table 1. Environment of virtual system configuration.
CategoryComponentSystem Specification
HardwarePLCXBC-DR64H (LSIS, Republic of Korea)
HMIeXP40-TTA (LSIS, Republic of Korea)
SoftwareOPC-UAKEPServerEx6
PLC EditorXG5000
SimulatorTecnomatix V2206.0 and NET API
Table 2. Comparison of effectiveness in throughput, utilization rate, and employee involvement between simulation and actual application in each case.
CategorySimulation
As-Is
(Manual)
To-Be
(Robot Automation)
Improvement Rate (%)
Case AThroughput
(trays)
22140683.7
Utilization Rate
(%)
75.05 (Worker)79.59 (Robot)-
Employees Involved
(# of workers)
3166.7
Case BThroughput
(trays)
22128127.1
Utilization Rate
(%)
91.96 (Worker)70.27 (Worker)
6.63 (Robot)
-
Employees Involved
(# of workers)
2150
Disclaimer/Publisher’s Note: The statements, opinions and data contained in all publications are solely those of the individual author(s) and contributor(s) and not of MDPI and/or the editor(s). MDPI and/or the editor(s) disclaim responsibility for any injury to people or property resulting from any ideas, methods, instructions or products referred to in the content.

