1. Introduction
Water makes up most of our planet and is vital to the survival of all animal and human species. More than 326 million cubic miles, or nearly 71% of the planet’s entire area, consist of water, of which 97% is ocean. Of the total amount of drinking water on Earth, only 0.5% is accessible; the other 2.5% is either buried deep below the surface of the planet beyond human reach or trapped in glaciers, polar ice caps, the atmosphere, or on land. There would be just 0.003 L, or less than a teaspoon, of drinking water if the world’s water supply were 100 L. As a result, managing and maintaining drinking water is of utmost importance. Because there is so little water available for use on the surface of the Earth [
1], it is the most critical issue humanity needs to address.
Because of their dynamic nature and relationship to waste disposal, rivers, which are the main source of water for many uses, including irrigation and industry, are especially vulnerable to environmental deterioration. The general state or condition of water, encompassing its chemical, physical, and biological components, is referred to as water quality. Therefore, it is essential to forecast and manage surface water quality with precision [
2].
In smart cities, water quality monitoring plays a crucial role in promoting public health, environmental sustainability, and urban resilience. As urban populations grow and industrial activities intensify, maintaining clean and safe water becomes increasingly challenging. Advanced technologies, including IoT sensors, data analytics, and AI, are central to smart city initiatives, enabling the continuous, real-time monitoring of water quality parameters such as pH, turbidity, chemical contaminants, and biological markers. By integrating these technologies, smart cities can quickly detect and respond to pollution events, optimize water treatment processes, and ensure regulatory compliance. This proactive, data-driven approach not only safeguards residents’ health but also supports sustainable urban development by fostering efficient water resource management and reducing the risks associated with contaminated water supplies.
The integration of IoT with water quality monitoring revolutionizes the way water resources are managed and protected. IoT-enabled systems deploy a network of sensors to continuously collect real-time data on crucial water quality parameters such as pH, turbidity, temperature, and conductivity. These sensors are connected to IoT platforms, which facilitate data transmission, processing, and analysis, often through cloud-based systems. By leveraging IoT, water quality monitoring becomes more efficient, scalable, and responsive, enabling the early detection of contaminants and providing actionable insights for timely intervention. This technology not only enhances the accuracy and reliability of water quality assessments but also supports sustainable water management practices, crucial for both urban and rural communities. The IoT system for water quality monitoring consists of several levels, as illustrated in
Figure 1, structured as follows:
Level 0: This level involves IoT sensors and actuators responsible for collecting and monitoring various water quality parameters. Different types of sensors are deployed in water bodies to measure parameters such as pH levels, turbidity, temperature, and conductivity. These sensors are connected to IoT-based controllers, such as Raspberry Pi or Arduino, to facilitate data acquisition and initial processing;
Level 1: At this level, gateways and edge devices act as intermediaries between the sensor network and cloud servers. These devices collect data from the sensors and perform preliminary processing before transmitting them to the cloud, ensuring efficient data management and reduced latency;
Level 2: Cloud computing is employed at this level for the storage and processing of water quality data. The IoT controllers periodically send the collected data to cloud servers via secure communication protocols. The cloud infrastructure enables scalable data storage, advanced analytics, and real-time processing;
Level 3: This level involves the development of mobile and web applications that interact with cloud servers. These applications utilize machine learning models to analyze the stored water quality data and provide actionable insights. The analytics results assist decision-makers, environmental agencies, and water management authorities in making informed decisions to ensure the sustainability and safety of water resources.
Intelligent machine learning models have several problems, one of which is their inherent inability to be understood, or “black-box” nature. As a result, it becomes difficult to comprehend and analyze the findings and underlying logic from research [
3]. The inability of ML models to offer insights into their internal workings makes it difficult for academics and end users to comprehend the method and logic behind the predictions, even though they are capable of learning complex functions and relationships. Lack of interpretability and transparency has a significant impact on many delicate areas, including water quality, which is essential to the survival of all living things. For this reason, despite ML models’ greater performance, both the authorities and the end users often choose to rely on traditional methods that provide transparency and understandability.
Therefore, it is essential to include explainability and transparency in complex machine learning models. This makes it possible for domain experts and end users to comprehend and trust these algorithms in addition to producing accurate forecasts. They are therefore able to understand the fundamental causes of the model’s results. XAI was developed to solve the interpretability problem that results from complex machine learning models. Crucially, it makes it possible to develop a rational and intelligible explanation that can be successfully conveyed to the final user [
4].
The primary objective of this study is to evaluate and predict water quality using advanced Ensemble Learning models, including stacked ensemble and VEL, to achieve high predictive performance and provide useful information for decision-making, particularly in smart cities. Therefore, this paper develops EWAIS (Ensemble Learning and Explainable AI System), an intelligent system for water quality monitoring and assessment. By utilizing XAI and Ensemble Learning models, while handling imbalanced data using the Synthetic Minority Over-sampling Technique (SMOTE), EWAIS not only improves water quality forecast accuracy but also offers clear insights into the variables affecting these predictions. To make the system’s predictions easier for end users and decision-makers to understand, we specifically use SHAP and LIME to create visual explanations, including force charts, summary plots, dependency plots, and decision plots. These methods aim to improve the interpretability of machine learning by providing a clear visual explanation of the predictions. The Voting Ensemble Learning (VEL) model earned high accuracy, demonstrating the reliable predictive accuracy of the EWAIS system. These performance indicators demonstrate how well our suggested methodology can anticipate water quality and offer clear information about the model. Therefore, the contributions of this paper are as follows:
Evaluation and Prediction: The study evaluates and forecasts water quality by utilizing advanced Ensemble Learning models, including stacked ensemble and VEL, achieving high predictive performance. The VEL model demonstrated impressive results with higher accuracy alongside higher precision and recall scores;
Explainability with SHAP and LIME: To address the black-box nature of machine learning models, SHAP and LIME techniques are employed, providing clear insights into how each water quality parameter influences the predictions. This enhances model interpretability and helps decision-makers understand the factors driving water quality assessments;
Enhanced Decision-Making: By integrating XAI approaches into machine learning models, the system not only enhances interpretability and transparency but also facilitates informed decision-making. This contributes to more reliable water quality management, particularly in smart city environments;
Feature Importance Analysis: SHAP is used to determine the importance of input variables in the prediction models, offering a deeper understanding of the factors impacting water quality.
Through these contributions, the study offers a solid, transparent, and interpretable framework for water quality prediction. This framework provides actionable insights for decision-makers, supporting sustainable water management strategies and contributing to the well-being of urban populations.
The structure of the paper is organized as follows.
Section 2: Related work provides a review of the literature related to water quality monitoring systems, highlighting both traditional and recent machine learning-based approaches.
Section 3: Proposed Water Quality System using EL and XAI described the key steps of the proposed methodology for Smart Water Quality Monitoring in the context of a smart city.
Section 4: Materials and methods outlines the methods employed, including the dataset, and discusses the performance of various EL and XAI models.
Section 5: Experimental Results and Analysis, supported by relevant tables and figures, provides a comparative analysis of the results and provides a suggested IoT system for smart water quality for smart cities. Finally,
Section 6: Conclusion and Future Scope summarizes the key findings and suggests directions for future research.
2. Related Works
Unfavorable taste or odor are only two of the negative impacts that excessive algal growth frequently has on water quality and associated water supply systems [
5]. Certain algae emit compounds that are harmful to human health, including cyanobacteria [
6]. For managing water supply systems, algal bloom prediction is, thus, crucial. Chlorophyll-a concentration (Chl-a) is frequently employed as an indicator to show the state of algal blooms in water resources; however, quantifying algal concentrations is labor- and time-intensive.
The author in [
7] presented ML models, such as decision trees, random forests (RFs), and correlation analyses, which were integrated to discover significant water quality measures by selecting key features. To guarantee effective data handling and processing, they created and optimized data-driven models, including RFs, deep neural networks (DNNs), and gradient-boosting machines (GBMs), within the H
2O API framework. A three-pronged XAI approach was used to achieve the interpretation of these models: Partial Dependence Plots (PDPs), Accumulated Local Effects (ALEs) plots, and Individual Conditional Expectation (ICE) plots were used for model profiling, model diagnosis with residual analysis, and model parts with permutation-based feature importance.
In [
2], the author created a model for forecasting water quality by combining XAI approaches with sophisticated machine learning models. RFs, LightGBM, and XGBoost were utilized in conjunction with the weighted arithmetic water quality index to predict water quality. The model’s predictions were interpreted using SHAP, and the results showed that COD and BOD were the most important factors in determining water quality, while electrical conductivity, chloride, and nitrate had little effect. While pH continuously affected forecasts, high dissolved oxygen levels were linked to lower water quality indices, which are suggestive of great water quality.
However, study [
8] tackled these obstacles by incorporating sophisticated ML methods to enhance Water Quality Index (WQI) forecasts. The researchers employed a dataset that included physicochemical parameters from various water sources, including pH, Cl
−, SO
42−, Na
+, K
+, Ca
2+, Mg
2+, Total Hardness, and Total Dissolved Solids. They then applied several machine learning algorithms, such as Gradient Boosting, random forests, and XGBoost, which were enhanced with XAI. To create prediction models.
Paper [
9] proposed a context-aware voting-ensemble model for imputing missing values in water-quality datasets, dynamically selecting optimal weights for various imputation models based on the characteristics of different missingness scenarios. The study demonstrates the potential of the ensemble model with dynamic weighting for robust imputation in diverse hydrological environments. The experiments on real-world water-quality data show superior accuracy with the designed method.
In [
10], they presented water quality with various machine learning techniques such as SVM, DT, random forests, Gradient Boost, and AdaBoost. The Water Quality Index dataset is used to train the model. The dataset is first normalized using the Z-score before the model is trained. The provided dataset is unbalanced; thus, they utilize XAI to help identify which features are most significant and SMOTE to balance the dataset, and the characteristics’ relevance is determined by the application of LIME.
A framework for XAI is presented in [
11] that can be used with multivariate time series. Interpretable explanations from the XAI are available to subject matter specialists. It combines, in three steps, supervised decision trees guided by projection-based clustering with a data-driven selection of a distance measure. Measurements of the water quality, including nitrate, electrical conductivity, and 12 other environmental characteristics, make up the multivariate time series. To examine the connections between environmental characteristics and water quality, comparable and dissimilar days within clusters are identified. Reference [
12] introduces the AHA-XDNN approach to water quality (WQ) prediction. The three steps in the approach are the artificial hummingbird algorithm (AHA), Explainable Artificial Intelligence, and DNN, which allow for high accuracy and confidence in WQ prediction. The four stages of the method are preprocessing the data, optimization, training, and evaluation. Issues like unwelcome noise and unbalance are resolved in the first stage. AHA is used in the second phase to optimize the hyper-parameters of the DNN model.
The authors of [
13] developed a robust generalizable ensemble machine learning model for water quality prediction based on water potability and other water quality metrics from various water quality samples throughout the world; they suggested and utilized SHAP to increase the final ensemble model’s generalizability for predicting water quality. The author in [
14], by applying the coalition game theory-based SHAP approach to determine the significance of each parameter, determined the class of water samples based on quality They first investigated various machine learning algorithms on the previously collected water samples to determine the water quality. Popular algorithms, including decision trees, support vector machines, K-NN, and others, are being investigated for their potential in determining the quality of water samples. The neural network performs the best among all the machine learning algorithms utilized in the work to openly and explainably evaluate the most crucial criteria that these models employ to determine water quality.
The authors in [
15] provided a technique to help policymakers to receive theoretical support from the simulated results regarding how to enhance pollution control, water, and ecological management and preserve the quality or safety of the water in metropolitan settings. SHAP-XAI with a neural network pattern recognition model (ANN-PR) is used to match all ungauged catchments that flow to the Great Barrier Reef to gauged ones using proxy spatial data. A neural network water quality (ANN-WQ) simulator trained on gauged catchment datasets was used to verify the adequacy of the catchment matches. The simulator was evaluated for matched catchments in unsupervised learning situations introduced in [
16]. To give an overview and comparison of some of the previous studies,
Table 1 highlights the focuses, datasets, models, XAI methods, key findings, advantages, and disadvantages.
Despite recent research that used machine learning models in conjunction with XAI approaches to predict water quality, it is noted that some gaps occur in prediction performance, interpretability, and decision-making efficiency. For example, advanced Ensemble Learning models such as stacked ensembles and VEL have not been widely used in research, despite being more accurate and robust. Furthermore, while SMOTE has been used to address the class imbalance question, its integration with sophisticated approaches to improve minority class predictions remains relatively unexplored. In this context, feature importance is rarely used to make informed decisions. Improving these characteristics could considerably enhance water quality prediction, model interpretability, and decision-making, particularly in smart city water.
4. Materials and Methods
4.1. Ensemble Learning
Ensemble Learning in machine learning is a way of combining multiple models for solving problems. The goal is to improve prediction accuracy by leveraging the strengths of individual models. By putting together multiple hypotheses, the ensembles end up providing a new and usually more accurate predictive framework. Systems that utilize methods of ensemble usually perform better than single-model approaches, using additional computations, storage, or communication resources. In practice, when the models are highly diverse, ensembles often yield better results. Although the ensemble techniques are speedier, memory-intensive algorithms can be enhanced.
The most widely used ensemble methods for classification are bagging, boosting, and stacking. Bagging builds multiple classifiers, treats their predictions equally, and uses majority voting to determine the final class. By training most ML models on different chosen subsets of the training data, bagging helps reduce overfitting that might occur with a single ML model. Boosting, on the other hand, assigns different weights to classifiers based on their performance and uses weighted voting to finalize the prediction. Boosting creates a sequence of models designed to address the shortcomings in bagging, which trains each model separately. On the other hand, stacking trains diverse base classifiers using different algorithms and employs a meta-classifier to combine their predictions, making the ultimate decision. These methods leverage the strengths of multiple models to improve classification accuracy. The base learners are machine learning models trained on the same dataset, using algorithms like decision trees, KNN, Extra Trees Classifier, or variations of the same model. Each algorithm captures different patterns in the data, leveraging their unique strengths. The outputs or predictions from these base learners are then used as inputs for a second-level model called the meta-learner. This meta-learner is trained to optimally combine the predictions of the base learners and make the final decision.
4.2. Voting Ensemble Learning
An approach of Ensemble Learning, wherein several individual classifiers are used to form prediction results, is a Voting Ensemble classifier. In this type of classifier, the predictions of each individual classifier are aggregated, and the final prediction is either determined through weighted averaging or by simple majority vote. Unlike stacking, this ensemble does not require a meta-learner, but it uses a proprietary process of amalgamating predictions by common methods. There are two main categories of voting: hard voting and soft voting.
In hard voting, each model casts a vote for the class label, and the final prediction is determined by a majority rule. On the contrary, soft voting implies the averaging of the probability outputs by the models for every class and picking the class with the highest average probability for the final prediction. Soft voting is especially useful when models differ in their confidence levels, as this allows a better integration of probabilistic information. Overall, Voting Ensembles are a simple and effective way to improve classification performance by leveraging the strengths of multiple models.
4.3. Exaplainable Artificail Intellegence (XAI)
XAI, i.e., Explainable Artificial Intelligence, is all about making machine learning models interpretable and understandable. XAI tackles the black-box nature of several machine learning models and can provide critical insight into how the models make predictions, thus building trust with stakeholders. It seeks to make machine learning models interpretable and their decision-making processes clear to human users. Explainability is a critical barrier to the practical adoption of AI in highly regulated sectors, where trust and comprehension are essential. The frameworks for XAI include LIME and SHAP. The well-known techniques for interpreting the predictions made by complex models have been developed by these two XAI frameworks.
LIME approaches explain each individual prediction by approximating locally the complex model through an interpretable surrogate. LIME perturbs input data to ascertain feature importance, thereby rendering it relevant in understanding model behavior at single instances, but computationally intensive for large datasets. However, the SHAP approach, based on cooperative game theory, distributes Shapley values to features, representing the contributions of these factors to individual model predictions based on a mean model prediction. Using both methods will give complementary insights about the machine learning model to enhance transparency and trust.
4.4. Dataset and Processing
The dataset [
17] includes evaluations and measurements of water quality that are connected to potability, or the acceptability of water for human consumption. The main goal of the dataset is to help determine whether the water is potable by offering insights into water quality metrics. The “Potability” column in the dataset indicates if the water is fit for human consumption, and there are 3277 rows in the dataset that each represent a water sample with certain characteristics; the dataset consists of 9 features and one label.
Table 2 shows the common features of the datasets. By including so many important factors, the dataset gives a full picture of water quality. Each characteristic, parameter, or constituent has a definite role in water quality assessment: pH is the measure of acidity or alkalinity, hardness gives mineral content, and solids measure dissolved and suspended particulates in water. Chloramines and trihalomethanes are important indicators of disinfection procedures, sulfate signifies health and infrastructure effects, conductivity acts as a proxy for ionic content, organic carbon measures organic material levels, and turbidity indicates the clarity of water. These features are widely recognized under global water quality standards, ensuring their foundational relevance [
18]. Such parameters are flexible; they are apt for a whole range of environment-specific and region-specific applications. For example, conductivity and solids feature strongly in areas that are subject to high salinity, while chloramines and trihalomethanes significantly impact urban areas with treated water systems. Including these parameters makes the model robust and adaptable for analyzing water quality under different conditions. Thus, the dataset is flexible enough to be used in all sorts of urban areas, which means that it can give strong and trustworthy water quality evaluations.
4.5. Water Quality Visualization
Water quality, a vital aspect of human health and the environment, is often complex to comprehend. This is where visualization comes into play. By transforming raw data into understandable visuals, we can paint a clearer picture of the state of our water resources. One cannot learn anything about potability from a pH. The distributions of 0 and 1 are nearly identical, aside from the first graph, which indicates that many samples of drinkable water have a pH of roughly 7. Rather than a true correlation, this might have been the result of mean substitution. Both charts agree that hardness levels of about 170–220 have higher potability rates, both charts agree that solids levels of about 20 k have higher potability rates, and both charts agree that chloramine levels of about 6–7 have higher potability rates, as shown in
Figure 3.
4.6. Data Pre-Processing on Water Quality Datasets
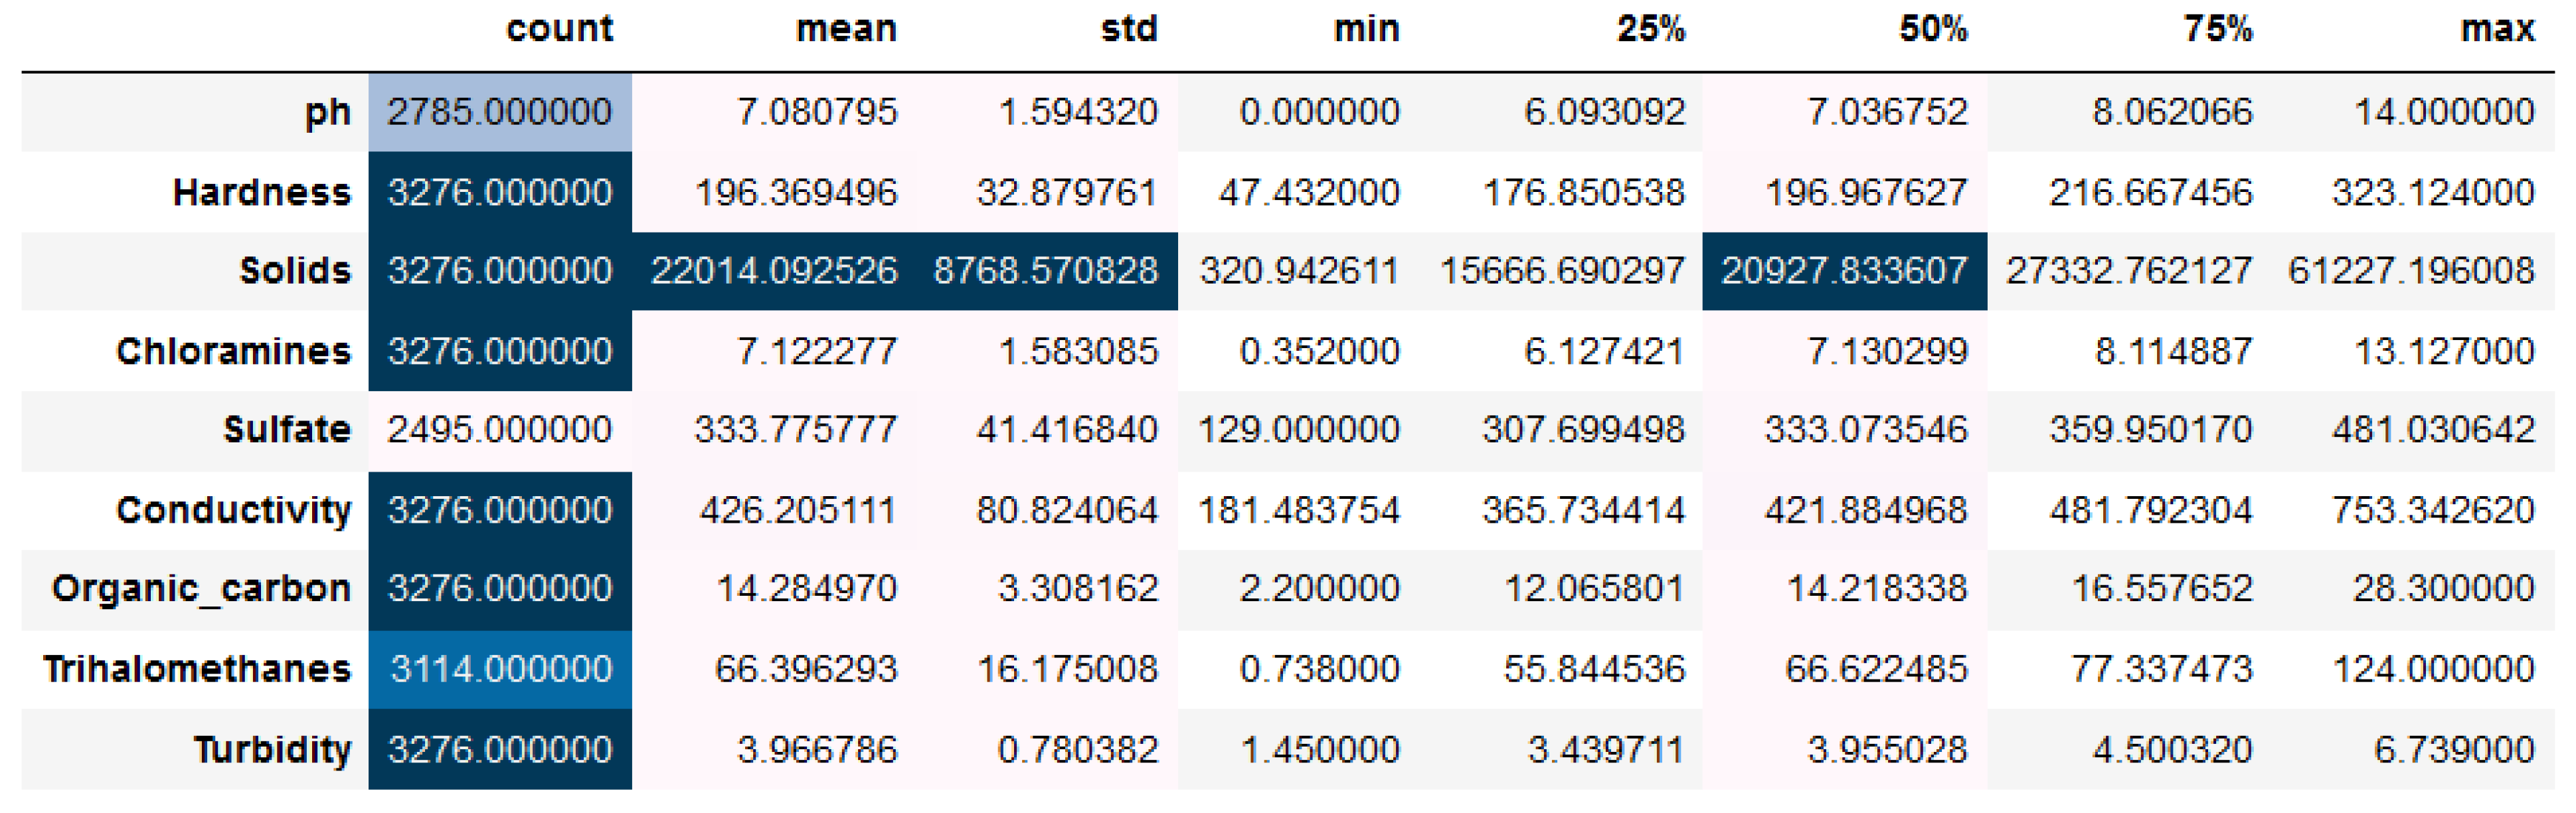
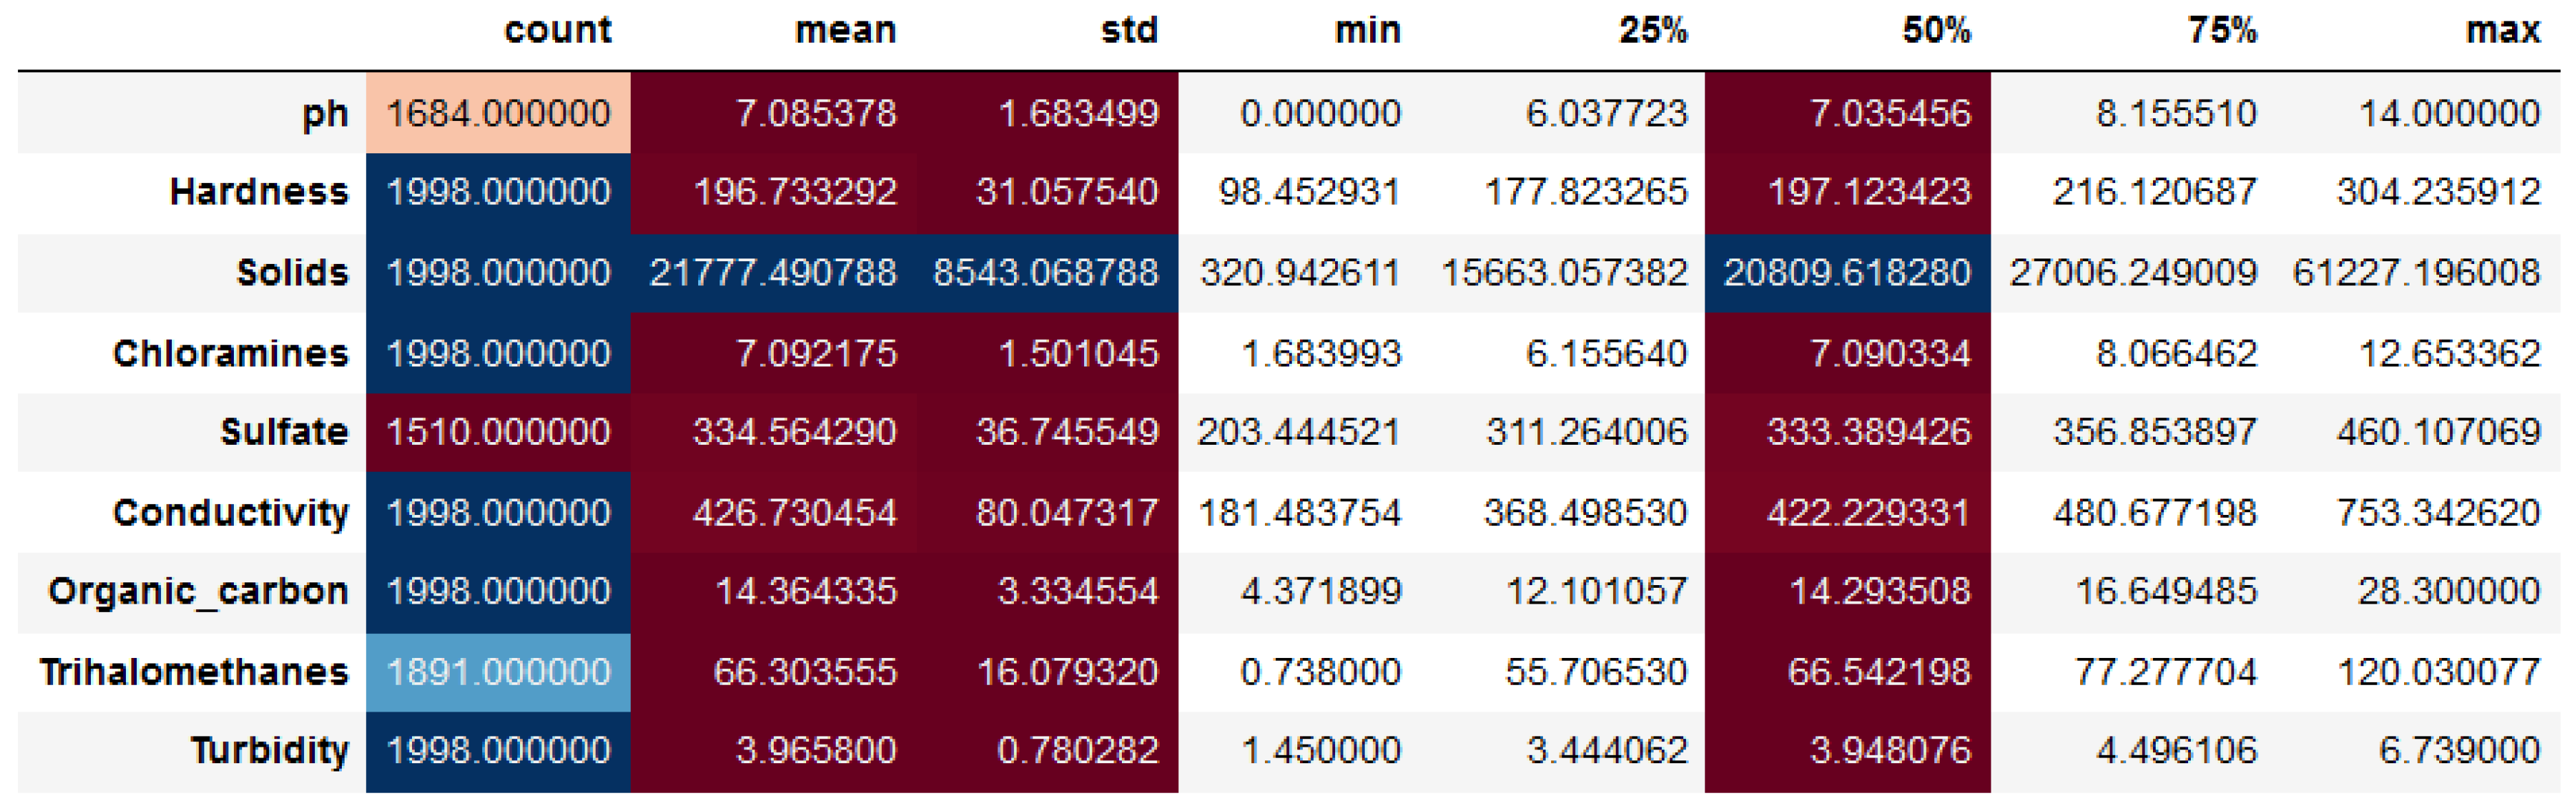
Statistical analysis plays a crucial role in water quality assessment, serving as a preprocessing step to extract meaningful information from raw data. By applying various statistical techniques, analysts can clean, transform, and summarize data, making them suitable for further analysis and modeling, as shown in
Figure 4,
Figure 5 and
Figure 6.
These data analysis procedures allow us to use information about water quality to create reliable classification models. These models enable us to make well-informed decisions on environmental protection and public health since they may be used to forecast future changes in water quality, monitor water quality in real-time, and issue health advisories.
Figure 4,
Figure 5 and
Figure 6 demonstrate that every feature has the same count. Null values are, therefore, absent. When compared to other features, it is evident from the above figure that not every feature has the same count. Hence, some null values must exist. When compared to other features, the solids feature has a higher mean and standard deviation. Hence, a high distribution is required. But the description given above applies to the entire population. Considering the potability feature, let us do the same with two samples [
19].
An essential step before supplying data to machine learning models is data preprocessing. This entails removing outliers from the data, which can distort the results; feature scaling keeps features with bigger values from controlling the model’s learning process by guaranteeing that all features have a similar range. This can raise the model’s overall accuracy and level the playing field for all characteristics. In this work, we utilize a standard scalar to scale numerical features to a specific range, typically between 0 and 1. This transformation is crucial in many machine learning algorithms, as it helps ensure that features contribute equally to the model’s learning process and prevents certain features from dominating others due to their different scales [
20].
In preprocessing steps, we utilized LightGBM’s unique capability to handle missing values effectively. LightGBM inherently learns the optimal treatment for missing data during model training, leveraging its algorithmic design to treat missing values as a distinct category. This makes it particularly useful for imputation, where missing values are treated in a manner that minimizes bias and maximizes accuracy. The used datasets contain numerical features. As such, Light Gradient Boosting creates two branches for numerical features with missing values: one for missing values and one for non-missing values. The algorithm learns the optimal split conditions for both branches, allowing it to capture the potential impact of missingness on the target variable. From
Figure 7, we find that the datasets are imbalanced datasets, so we applied the SMOTE technique, which handles imbalanced datasets in various machine learning tasks by generating synthetic samples for the minority class [
21,
22].
4.7. Experimental Environment
Using water_potability datasets, the proposed approach for predicting water quality was evaluated. The experiments use Python-written ML and VEL algorithms running on an 11th generation Intel® CoreTM i7-11800H @ 2.30 GHz with 16.00 GB of RAM and Windows 10 Pro.
The dataset in the proposed system has undergone several classification algorithms to determine the quality of water_potability, such as Gradient-Boosting Classifier, AdaBoost Classifier, Extra Trees Classifier, Bagging Classifier, KNN, and DT, with XAI providing the transparency and interpretability of VEL (XAI helps to understand why a model makes certain predictions) using SHAP and LIME. These methods provide valuable insights into the factors driving model predictions, enhancing our understanding of complex water quality phenomena. SHAP assigns each feature a value representing its contribution to a model’s prediction [
4].
4.8. Evaluation Metrics
To test the ML and VEL performance evaluation models, several statistical and mathematical models are used for the accurate classification and prediction tasks of water quality. Performance metrics, including recall, accuracy, precision, and F1-score, have been employed to evaluate the relative performance of the proposed system and the current approach. To complete the observations, true negatives (TN), true positives (TP), false positives (FP), and false negatives (FN) are taken into consideration. The accuracy of the classification model on that test is indicated by the percentage of the test set that the classifier successfully classifies. The correctness of instances with positive labels determines their precision. Recall measures the number of instances of the positive class that have the correct label assigned, or how accurate or thorough positive examples are. Recall, accuracy, precision, and F1-score are calculated using the following formulas, in that respective order [
23]:
5. Results Analysis
By effectively applying statistical analysis, water quality experts can gain valuable insights to support sustainable water resource management. We noticed that the datasets contain missing values; thus, we apply mean imputation and LightGBM imputation to accurately determine these missing values. Mean imputation involves replacing missing values with the mean of the non-missing values in the same column. This technique is particularly effective for numerical data with a normal distribution. LightGBM imputation helps to accurately and efficiently impute missing values, even for complex data with non-linear relationships. As shown in
Table 3, four statistical measures were used to evaluate the ML and VEL models: accuracy, precision, recall, and F1-score. After a careful examination of the results, it became clear that VEL performed better than the other ML models in test phases. VEL outperformed the other two methods when it came to accuracy throughout the test phase, with an accuracy of 83%, as compare with 80%, and 79%, for Stack Ensemble Learning and GradientBoostingClassifier respectively using mean imputation [
4]. Likewise,
Figure 8 shows a comparative study between the proposed model and existing models using mean imputation.
During the testing phase, VEL once more showed its exceptional performance in light boosting imputation, with accuracy values of 0.89. GradientBoostingClassifier had accuracy values of 0.80, and Stack Ensemble learning came in second with 0.81 accuracy values, as shown in
Table 4. Similarly,
Figure 9 shows a comparative study between the proposed model and existing models using light boosting imputation.
Therefore, VEL is the most successful model for predicting the WQ, according to the results of the performance analysis conducted using these statistical indices, which showed that it consistently outperformed both Stack Ensemble Learning and GradientBoostingClassifier across all measures. The VEL model performed better than other ML models, and the SHAP explanation was used to examine the underlying mechanism of the results that it produced. The VEL model’s mean absolute SHAP values, or feature importance, are shown in
Figure 10, and the SHAP summary plot is shown in
Figure 11,
Figure 12 and
Figure 13. Sulfate showed the highest mean SHAP value of 1.81, indicating that it is the most significant contributing element in predicting WQ, based on the feature relevance concerning the total model predictions. pH came in second on the list, with a mean SHAP value of 1.46, while the effects on the model predictions were similar for trihalomethanes (0.61), solids (0.52), and hardness (0.48). The impact of chloramines (0.42), turbidity (0.33), conductivity (0.33), and organic carbon (0.31) on the total was relatively low [
24].
Because it approximates a complex machine learning model with a simpler, interpretable model, LIME is a powerful XAI technique that can be used to understand the complex relationships between water quality parameters and their impact on overall water potability. In the context of water quality, this means that LIME can assist in identifying the most significant water quality parameters that contribute to a specific prediction of water potability. These were the main factors driving the model’s forecast as to whether the water was unfit for human consumption. This information can be very useful for researchers and decision-makers since it helps identify the precise problems that need to be fixed to enhance the quality of the water, as shown in
Figure 14 [
25].
High-Level Suggested IoT System for Smart Water Quality
Figure 15 presents the suggested IoT-based Water Quality Monitoring system, which can employ a network of sensors to collect real-time water data on parameters. This data is transmitted to an IoT gateway, such as a Raspberry Pi or ESP32 which acts as a bridge between the sensors and a cloud-based analytics server. Using communication protocols like CoAP (Constrained Application Protocol) or MQTT (Message Queuing Telemetry Transport), the gateway can send the data to the cloud, where machine learning models will analyze it to predict water quality. The results are accessible via mobile and web applications, enabling stakeholders to make timely, informed decisions to ensure water safety and sustainability. This suggested approach can enable prompt and informed decision-making to successfully handle water quality concerns, thereby maintaining sustainability and public health. The conceptual system closes the gap between theoretical advances in water quality modelling and practical IoT-based implementation.
6. Conclusions and Future Scope
This study aimed to evaluate and forecast water quality using machine learning models, particularly focusing on VEL. Nine water quality parameters, including pH, hardness, and turbidity, were used as input features. The models’ performance was assessed using accuracy, precision, recall, and F1-score, with VEL outperforming other models like Stack Ensemble and GradientBoostingClassifier, achieving scores between 0.89 and 0.83. SHAP and LIME were employed to provide explainability, revealing that sulfate and pH had the most significant impact on water quality predictions, while turbidity and organic arbon had minimal effects. The study demonstrated the effectiveness of VEL in water quality assessment and highlighted the importance of feature interactions, offering valuable insights for decision-making in water management.
Future research should cover the constraints to enhance both the robustness and real-world utility of the proposed model. One can focus on incorporating a broader range of water quality parameters, regions, and contaminants, which will improve generalizability, while incorporating seasonal, microbiological, and environmental factors to enhance model accuracy and generalizability. Real-time monitoring and integration with IoT devices could improve scalability and responsiveness in smart city applications. Additionally, improving the interpretability of XAI outputs for non-technical users could facilitate better decision-making. Moreover, advancing the interpretability of explainability tools (e.g., SHAP, LIME) will make the models more accessible to non-technical stakeholders, fostering better decision-making. Expanding the study to include temporal analysis could provide deeper insights into water quality trends and anomaly detection.


