Article

In Situ Remediation of Combined Ammonia and Nitrate Nitrogen Contamination Using Zero-Valent Iron-Enhanced Microorganisms in Acidic Groundwater: A Laboratory and Pilot-Scale Study

1
Guangzhou Runfang Environmental Protection Technology Co., Ltd., Guangzhou 510670, China
2
Guangdong Provincial Academy of Environmental Science, Guangzhou 510045, China
3
Guangdong Engineering Technology Research Center for Source Control of Combined Pollution in Mining Areas, Guangdong Provincial Key Laboratory of Chemical Pollution and Environmental Safety & MOE Key Laboratory of Theoretical Chemistry of Environment, South China Normal University, Guangzhou 510006, China
*
Authors to whom correspondence should be addressed.
Processes 2024, 12(12), 2768; https://doi.org/10.3390/pr12122768
Submission received: 16 October 2024 / Revised: 28 November 2024 / Accepted: 1 December 2024 / Published: 5 December 2024
(This article belongs to the Special Issue Advances in Remediation of Contaminated Sites: 2nd Edition)

Abstract

:
In acidic groundwater, effectively removing both ammonia nitrogen (NH4+-N) and nitrate nitrogen (NO3-N) poses a challenge. This study focused on studying the removal of NH4+-N and NO3-N combined contaminations by zero-valent iron (ZVI) combined with microbial agents in both laboratory and field pilot-scale studies. Laboratory experiments showed that ZVI could reduce the denitrification stage from 15 days to 10 days by increasing solution pH and improving NO3-N reduction efficiency. In a field pilot test (at Qingyuan, Guangdong Province, China), high-pressure injection pumps were used to inject alkaline reagents to raise the pH to 7~8. Meanwhile, compressors were applied to aerate the groundwater to increase the dissolved oxygen (DO) concentration above 2 mg·L−1. Subsequently, microbial agents of nitrobacteria were injected to initiate aerobic nitrification. As the DO level dropped below 2 mg·L−1, agents of micro-ZVI and denitrifying bacteria were injected to stimulate autotrophic denitrification. Intermittent aeration was employed to modify the redox conditions in the groundwater to gradually eliminate NH4+-N and NO3-N. However, due to the effect of the low-permeability layers, adjustments in the frequency of remediation agent injection and aeration were necessary to achieve removal efficiencies exceeding 80% for both NH4+-N and NO3-N. This work aims to overcome the limitations of microbial remediation methods in the laboratory and the field and advance nitrogen pollution remediation technologies in groundwater.

1. Introduction

Global groundwater pollution, including from pollutants such as petroleum, solvents, volatile organic compounds, pesticides, heavy metals, and nitrogen compounds, is a widespread and increasingly severe global issue [1,2,3,4]. Among various pollutants, the presence of ammonium nitrogen (NH4+-N) and nitrate nitrogen (NO3-N) in groundwater due to excessive application of agricultural fertilizers, agricultural drainage, urban and industrial wastewater, and surface water leakage have greatly impacted groundwater ecology and water safety [5,6,7]. NH4+-N is a highly oxygen-consuming substance that has toxic effects on humans and aquatic organisms [7]. The oxidation of 1 mg of NH4+-N to NO3-N requires the consumption of 4.57 mg of dissolved oxygen (DO); therefore, high concentrations of NH4+-N directly lead to severe oxygen depletion in groundwater, resulting in water-quality deterioration [8,9]. Furthermore, prolonged consumption of nitrogen-rich water increases the burden on the human kidneys and raises the potential risks of conditions such as methemoglobinemia, digestive tract cancer, bladder cancer, ovarian cancer, and diseases of the brain and nervous system [10,11,12]. The “Standard for Drinking Water Quality” [13] in China sets strict limits for NH4+-N and NO3-N contamination in drinking water at 0.5 mg/L and 10 mg/L, respectively. Therefore, the elimination of NH4+-N and NO3-N combined contamination in groundwater has long been a focal point for the government and the field of environmental remediation.
Microbial remediation technology has shown feasibility and potential in the practical application of removing NH4+-N and NO3-N contamination in groundwater [14,15]. For the removal of NH4+-N and NO3-N combined contamination in groundwater, a reliable approach involves the synergistic interaction between nitrifying bacteria-mediated nitrification and denitrification induced by denitrifying bacteria [16,17,18]. Nitrifying bacteria primarily oxidize NH4+-N to nitrite nitrogen (NO2-N), followed by the oxidation of NO2-N to NO3-N using the energy from the oxidation reaction to acquire energy and electrons for growth. Therefore, nitrifying bacteria do not require an external carbon source. However, denitrification is the process of reducing NO3-N to nitrogen gas (N2) or NO2-N and typically occurs under oxygen-depleted conditions [14,19] The denitrification process is relatively slower and requires organic matter as an electron donor to proceed. Therefore, nitrification is usually more effective than denitrification in reducing NH4+-N and NO3-N combined contaminations in groundwater. The strategy to enhance denitrification efficiency has become the key issue in effectively removing the NH4+-N and NO3-N combined contamination [19,20]. Zero-valent iron (ZVI) is a commonly employed remediation material that finds extensive application in the remediation of groundwater and soil. ZVI demonstrates exceptional capabilities in reducing NO3-N [21]. For example, under alkaline conditions (pH range approximately 6–10), ZVI can reduce NO3-N to nitrite (NO2-N) (Equation (1)) or nitrogen gas (N2) (Equation (1)), thereby enhancing denitrification [22,23].
NO3 + 3 Fe0 → NO2 + 3 Fe2+ + 2 OH
NO3 + 10 Fe0 + 12 H+ → 5/2 N2 + 10 Fe2+ + 6 H2O
Additionally, acidic groundwater environment at the actual site is not conducive to the survival of denitrifying bacteria, while ZVI can react with acidic substances in groundwater, indirectly enhancing denitrification efficiency [23,24]. Therefore, through the synergistic effects of nitrifying bacteria, denitrifying bacteria, and ZVI, along with suitable site conditions and operational controls, it is feasible to enhance the removal efficiency for the co-pollutants of NH4+-N and NO3-N in groundwater. However, existing studies on ZVI-assisted microbial remediation have predominantly concentrated on single NH4+-N or NO3-N contamination, with limited studies on the concurrent elimination of NH4+-N and NO3-N combined pollution [6,25,26,27]. Specifically, ZVI-assisted microbial remediation studies have been primarily restricted to laboratory-scale studies, with few instances of field applications demonstrating synergistic improvement of denitrification by ZVI and microorganisms.
In the Qingyuan region of Guangdong, China, a typical site exhibits groundwater contamination with NH4+-N and NO3-N. This contamination has been worsened by the unconventional extraction of rare earth minerals, which involves the introduction of ammonium salt solutions into leach ponds, leaching heaps, or mountainous terrain, resulting in soil and groundwater acidification (with local soil pH levels ranging from 4.56 to 6.49). Consequently, this area presents a significantly severe case of NH4+-N and NO3-N combined contamination, making it an ideal candidate for our pilot-scale study.
In this study, laboratory experiments were conducted to simulate the groundwater contamination characteristics of the research area, validating the enhanced denitrification effects of ZVI and microbial agents. Subsequently, technologies based on ZVI and microbial agents were applied in on-site experiments to investigate the removal of NH4+-N and NO3-N combined contaminations. Additionally, the feasibility and operability of the remediation technology were assessed to analyze its practical application outcomes. This study is crucial for advancing the development of remediation technologies aimed at addressing the combined contamination of groundwater by NH4+-N and NO3-N.

2. Research Area and Methods

2.1. Materials

ZVI powder (>98%) was purchased from Gongyi City Meiqi Industry and Trade Co., Ltd., Zhengzhou, China. Sodium bicarbonate, Nessler’s reagent, and KI, were purchased from the Aladdin Reagent Co., Shanghai, China. Amino sulfonic acid (analytically pure) was obtained from the Tianjin Damao Chemical Reagent Co., Tianjin, China.

2.2. Reaction Column Experiment in Laboratory

Laboratory experiments were conducted using column reactors to simulate the remediation process (Figure S1). The main component of the experimental setup is an organic glass column, 105 cm in height, with an inner diameter of 15 cm and an outer diameter of 17 cm. The described column is equipped with an outlet on one side at the top and an inlet on the opposite side at the bottom. Between the inlet and outlet, there are five distinct sampling ports. The inlet is connected to a water tank via a water pipe, with a peristaltic pump controlling the water flow rate. Each end of the glass column is filled with a 5 cm thick layer of coarse sand with a particle size ranging from 1 to 2 mm, which serves to filter, buffer, and protect the intermediate fillings. Adjacent to the coarse sand layer is a 20 cm thick layer of fine to medium sand with particle sizes ranging from 0.25 to 0.5 mm. The contaminated soil sample collected from the study area is placed next to the fine sand layer, simulating the aquifer zone and facilitating uniform water distribution. The middle 60 cm serves as the reactive fill zone, where the experimental requirements dictate the use of soil, sand, microbial agents and ZVI powder as the active fillings. The glass column is equipped with five sampling ports distributed in the middle section, with intervals of 15 cm between each port. The coarse sand and fine sand are thoroughly washed with distilled water, air-dried before use, and stored in a drying cabinet. The experimental water is synthetic groundwater with concentrations of NH4+-N and NO3-N set at 50 mg/L. The pH value of the newly prepared water ranges from 4.5 to 8.5. By varying the experimental conditions, such as different ratios of remediation materials, pollutant concentrations, solution pH, and DO, the impact of these factors on the removal efficiency for NH4+-N and NO3-N is investigated, gradually optimizing the remediation technology. The sampling frequency is once a day, and the removal efficiency for NH4+-N and NO3-N pollutants is calculated based on the concentration of pollutants at the final outlet.
To obtain nitrifying and denitrifying microbial communities, domesticated sludge from a sewage treatment plant in Qingyuan City was utilized. Representative sludge samples were collected from the secondary sedimentation tank of the sewage treatment plant. These sludge samples were exposed to different cultivation conditions, such as varying temperature, pH, and DO, etc., using culture media containing NH4+-N and NO3-N. This allowed the microbial communities to gradually adapt and grow in specific environments. Regular sampling (sampling once a day as needed) was conducted, and the concentrations of NH4+-N and NO3-N were measured to assess changes in the degradation capacity of the microbial communities. After a period of domestication, stability tests were performed on the domesticated sludge to confirm its high stability in degrading NH4+-N and NO3-N.

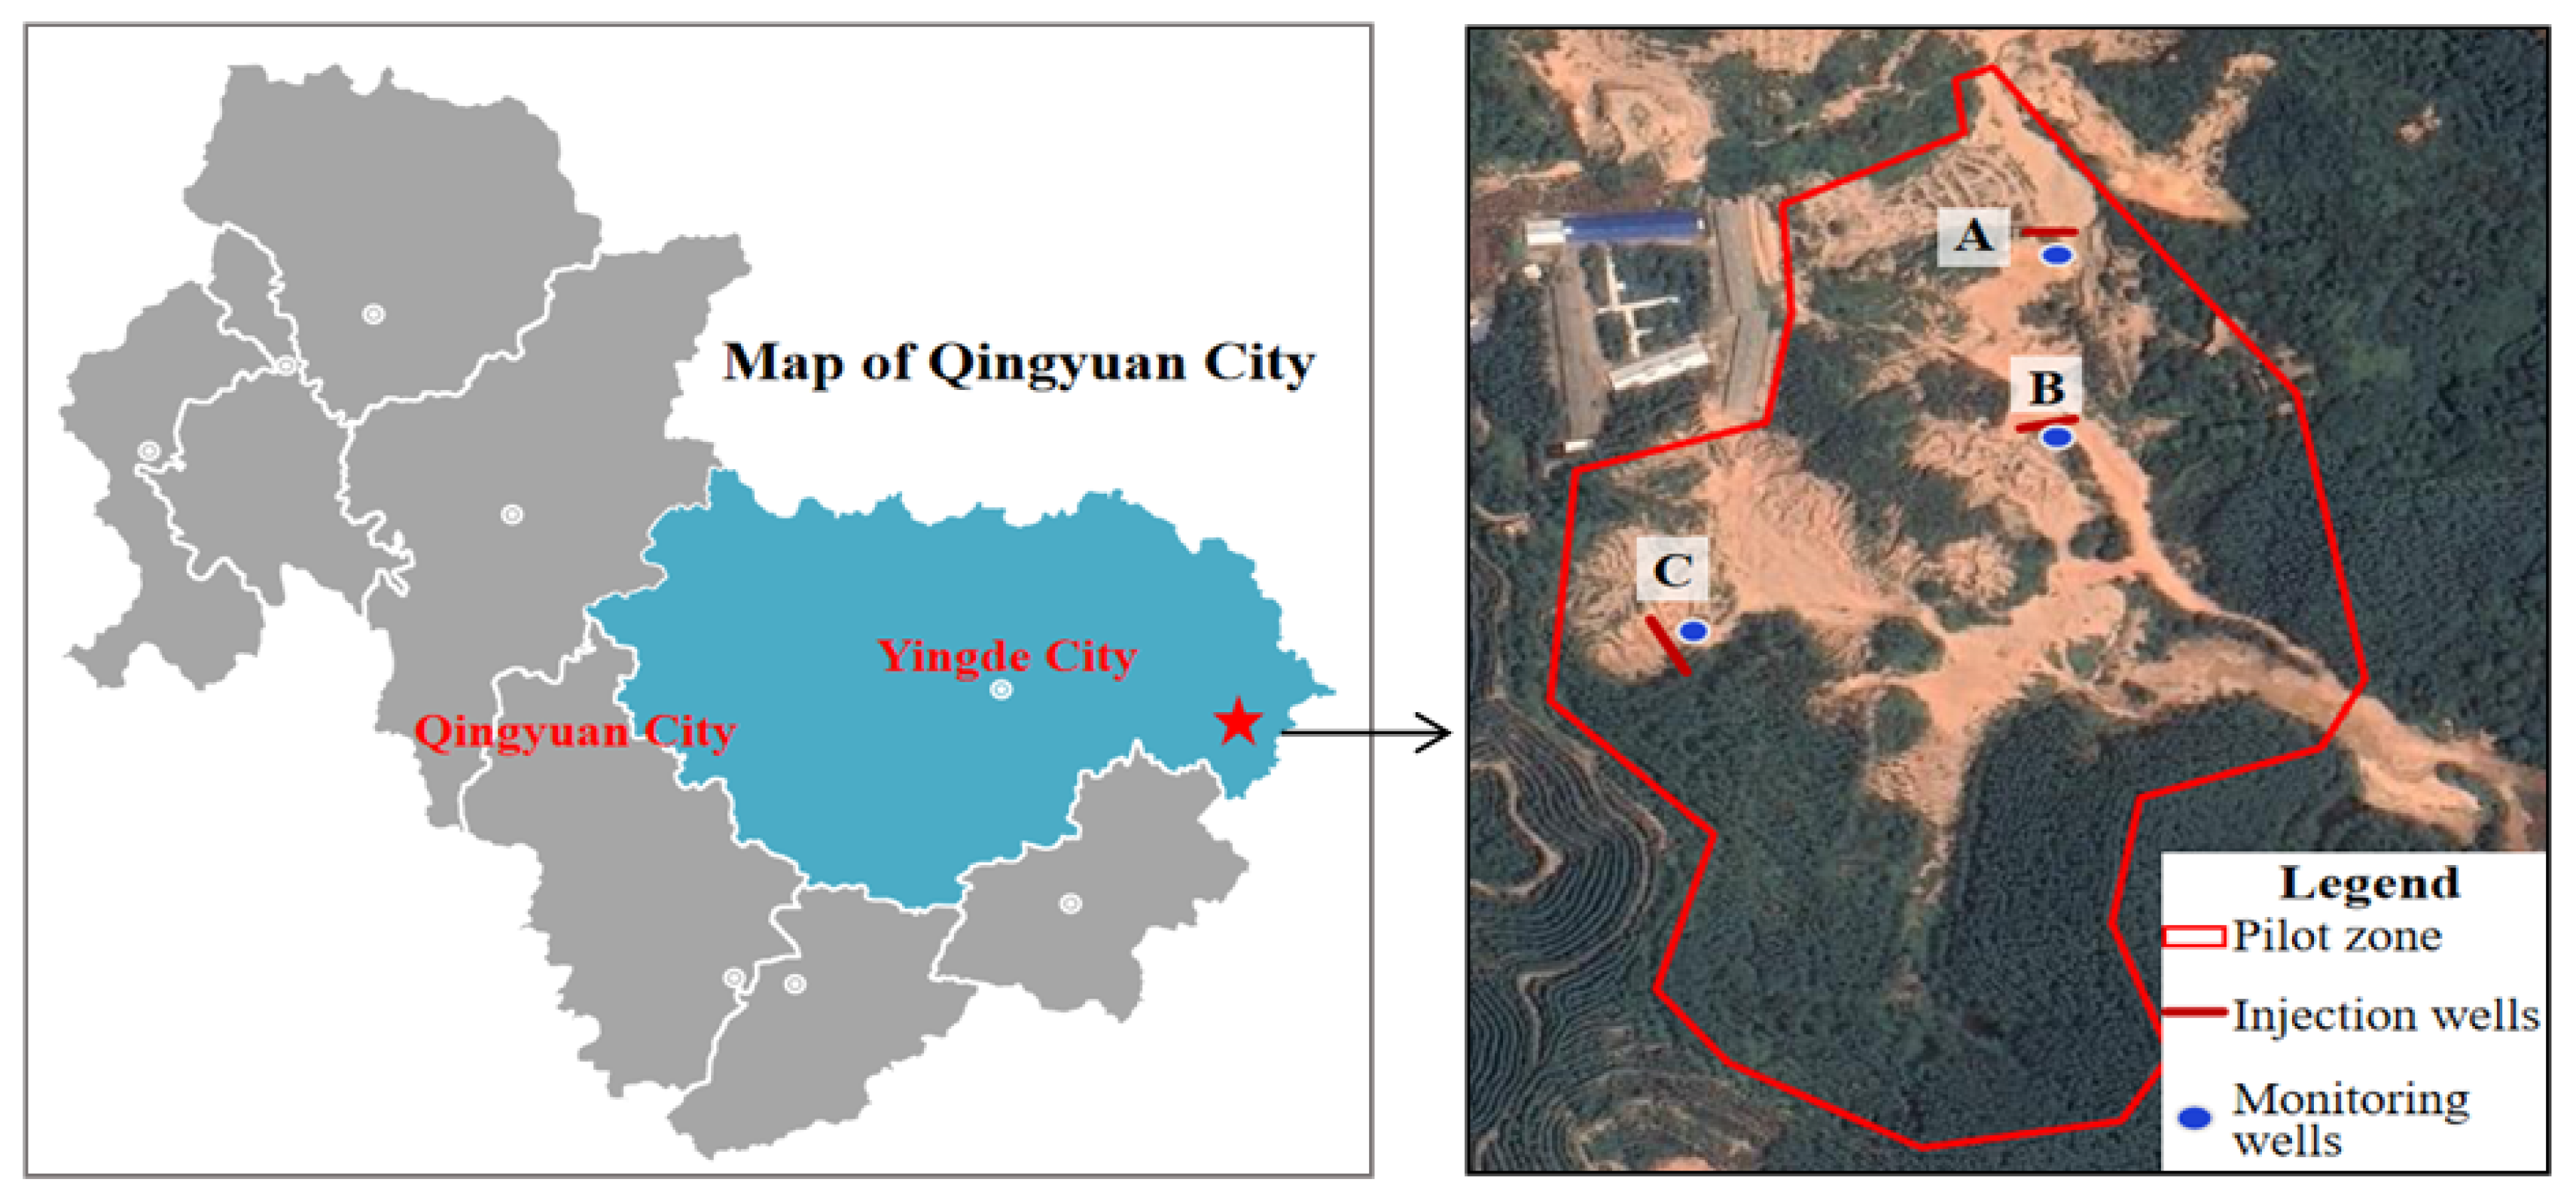
2.3. Hydrogeological and Climatic Characteristics of the Study Area

The pilot study site is located in Qingyuan City, Guangdong Province, China, at coordinates 113.712728° E and 24.103932° N (Figure 1). The site covers an area of approximately 27 acres, with a length of about 500 m from north to south and a width of about 300 m from east to west. The area is characterized by the accumulation of tailings resulting from illegal exploitation of rare earth minerals. It is situated in a low mountainous and hilly region, with generally higher western and northern topography compared to the central part. The low-lying areas exhibit relatively flat terrain. Groundwater in the area converges from the southern and western slopes of the pilot area towards the central valley and eventually discharges towards the southeast direction.
Based on hydrogeological surveys conducted in the pilot area, the predominant aquifer media consist of sandy loam and silty clay. The study area encompasses unconsolidated rock pore water and weathered rock fracture water. Unconsolidated rock pore water is mainly distributed in the Quaternary alluvial deposits, consisting of fine sand, medium sand, and coarse sand, etc. However, water permeability in clayey and silty clay layers is low, resulting in poor water-yielding potential, with individual well yields below 100 m3/d. Annual fluctuations in water level for unconsolidated rock pore water range from 1 to 3 m, while those for weathered rock fracture water range from 2 to 5 m. The residual soil from the heap leaching of rare earth minerals and completely weathered granite form loose accumulations with a thickness of approximately 4 to 12 m. This type of groundwater primarily flows and discharges along the pores within the tailings, exhibiting good permeability and low water-yielding characteristics. In situ measurements indicate horizontal soil hydraulic conductivity (kv) ranging from 4.6 × 10⁻⁶ to 3.6 × 10⁻⁵ cm/s and a vertical soil hydraulic conductivity (kh) ranging from 4.1 × 10⁻⁶ to 2.5 × 10⁻⁵ cm/s. The measured soil porosity is approximately 30%. The calculated migration velocities of pollutants in the groundwater within the pilot area range from 0.01 to 0.12 m/d horizontally and from 0.01 to 0.10 m/d vertically, indicating a relatively slow and uneven distribution of pollutant migration within the groundwater.
The study area is located in the transitional zone from the South Subtropical Zone to the Central Subtropical Zone and experiences a subtropical monsoon climate. The annual average temperature ranges from 20.1 °C to 22.0 °C [28]. The groundwater dynamics in the surrounding area exhibit a seasonal pattern primarily influenced by rainfall. During the spring and summer seasons, precipitation is abundant, leading to increased groundwater recharge.

2.4. Groundwater Pollution Characteristics

The contamination at the site originated from the improper leaching process used in the past, which introduced leaching agents (NH4)2SO4 and precipitants such as oxalic acid or NH4HCO3 into the mountain. The soil pH in the study area ranged from 4.56 to 6.49, indicating weak acidity. The monitoring results of the groundwater revealed that the NH4+-N contamination concentrations in the research area ranged from 1.1 to 97.38 mg/L, with an average of 26.76 mg/L, while the NO3-N concentrations ranged from 0.21 to 51.35 mg/L, with an average of 21.2 mg/L. The initial average concentration of NO2-N was 0.06 mg/L, with a maximum concentration of 0.329 mg/L. The concentrations of NH4+-N, NO3N, and NO2-N in the three pilot sites to be selected in this study are shown in Table 1.

2.5. Analytical Methods

The DO and pH in the groundwater were monitored by a multi-parameter water quality analyzer (SX836, Shanghai Sanxin Instrument Factory, Shanghai, China). The Nessler’s reagent spectrophotometric method was used to determine the NH4+-N content in water samples on a spectrophotometer (Metash UV-9000, Yourop Scientific Instruments (Shanghai) Co., Ltd., Shanghai, China), while the ultraviolet spectrophotometric method was employed to measure the NO3-N content [29]. The N-(1-Naphthyl) ethylenediamine spectrophotometric method was employed to determine the NO2-N content in water samples [30]. Groundwater samples were collected from source points or wellheads, ensuring that the collection process was free from the contamination of exogenous microbial communities. The total colony counts in the groundwater were determined using the plate count method or the spread plate method. Details of the detection methods for NH4-N, NO3-N, NO2-N, and the total bacterial colonies have been listed in Text S1. The removal efficiencies (RE) for NH4-N and/or NO3-N were calculated by Equation (3):
RE (%) = (C0 − Ct)/C0 × 100%
where C0 represents the initial concentration of NH4-N or NO3-N before the injection of the ZVI and microbial reagents, and Ct refers to the concentration of residual NH4-N or NO3-N after incubation for t days.

3. Results and Discussion

3.1. The Column Experiment Results

In the column reactor without any additional bacteria or ZVI (control), the removal efficiencies for NH4+-N and NO3-N are less than 10% and 5%, respectively (Figure 2a). The minimal removal efficiency observed for NH4+-N could potentially be attributed to the presence of minute quantities of oxygen in the water circulating within the reactor, rather than to microbial degradation. Considering that the reaction column was filled with undisturbed soil samples sourced from the contaminated site, the results suggest a lack of a microbial community proficient in simultaneously removing NH4+-N and NO3-N under acidic conditions at the contaminated site [7,31]. This result also explains why the concentrations of NH4+-N and NO3-N in groundwater remain high despite decades of contamination at the pilot site.
In the influent with an initial concentration of 50 mg/L of NH4+-N, the removal of NH4+-N by the column reactor with nitrobacteria reached 99.5% within 5 days (Figure 2a). However, it takes 15 days for denitrifying bacteria to remove 50 mg/L of NO3-N. Surprisingly, ZVI shortens the remediation period of NO3-N driven by denitrifying bacteria to about 10 days (Figure 2a). ZVI may increase denitrification via the following mechanisms: (i) ZVI is a strong reducing agent, and ZVI can provide electrons to denitrifying bacteria for the reduction of NO3-N to N2 or NO2-N [6]. (ii) the iron oxide shells of ZVI, such as magnetite, produced by the reaction of ZVI with NO3-N, exhibit excellent adsorption capacity [32]. This property of ZVI allows it to adsorb NO3-N on its surface, facilitating the electron transfer process between the iron core of the ZVI and the NO3-N, thereby enhancing denitrification efficiency.
pH plays a significant role in affecting the redox potential of iron and nitrogen and the solubility of ZVI and iron minerals, as well as microbial activity, thereby exerting a considerable influence on the nitrification and denitrification processes [33]. Under pH conditions of 7–8, the removal efficiency for NH4+-N and NO3-N were the highest (both greater than 95%), but as the pH decreased to 4.0, the removal efficiency for NH4+-N and NO3-N significantly decreased from over 99% to around 40% or lower (Figure 2b). Generally, lower pH levels can inhibit microbial growth. Furthermore, under neutral and alkaline conditions, the redox potential of Fe(II)/Fe(III) is +200 mV, while that of NO3/NO2 is +430 mV, facilitating the reaction of Fe0/Fe(II) and reducing NO3. However, under acidic conditions, the redox potential of Fe(II)/Fe(III) increases. For instance, the redox potential of Fe(II)/Fe(III) is +770 mV at pH 2, which may significantly inhibit the reduction of NO3-N [26]. Additionally, under acidic conditions, ZVI preferentially transfers electrons to H+ to produce H2 rather than reducing NO3-N, resulting in lower NO3-N reduction efficiency. Therefore, maintaining the pH at around 7–8 is more conducive to promoting the nitrification and denitrification processes. Therefore, under slightly acidic conditions (pH~4) at the contaminated site, the natural attenuation of NH4+-N and NO3-N co-pollution is very low. The issue of excessive groundwater acidity must be addressed first before achieving effective remediation of co-pollution at the actual contaminated site. Importantly, as the ZVI concentration increases from 0 to 500 mg/L, the solution pH gradually increases from acidic conditions (pH 4.5) to around 7.8 (Figure S2). This phenomenon provides strong evidence that ZVI can enhance nitrification and denitrification efficiency by neutralizing acidic substances.
The DO exerts distinct impacts on denitrification efficiency through nitrifying bacteria/denitrifying bacteria [34]. Nitrifying bacteria are strictly aerobic microorganisms that rely on ample DO to facilitate the oxidation of NH4+-N to NO3-N. As the DO concentration escalates from 0.1 to 4 mg/L, the removal efficiency for NH4+-N gradually rises from 11.2% to 100% (Figure S3). With elevated DO levels, nitrifying bacteria can effectively utilize oxygen for the oxidation of NH4+-N, thus enhancing denitrification efficiency. Conversely, denitrifying bacteria are typically facultative anaerobes, and as such, the removal efficiency for NO3-N decreases with rising DO levels.
The optimal concentrations of nitrifying bacteria and denitrifying bacteria for the removal of N-pollutants were 100 and 300 mg/L, respectively (Figure 2c). However, when the concentrations of bacteria exceed the optimal values, the removal efficiency for NH4+-N and NO3-N no longer increases. This result suggested that in addition to considering microbial concentrations, other factors such as nutrients, environmental conditions, and substrate concentrations should be comprehensively considered in the removal of N-pollutants [35,36].
The carbon source also affects the removal efficiency for NO3-N during the denitrification stage. As the glucose concentration increases from 0 to 300 mg/L, the removal efficiency for NO3-N gradually increases (Figure 2d). Glucose can serve as a carbon source to support growth and metabolism. In this study, the appropriate glucose concentration is 300–500 mg/L. As a result, the denitrification process requires organic compounds as electron donors, and the lack of carbon sources in the contaminated site may become a limiting factor for denitrification.

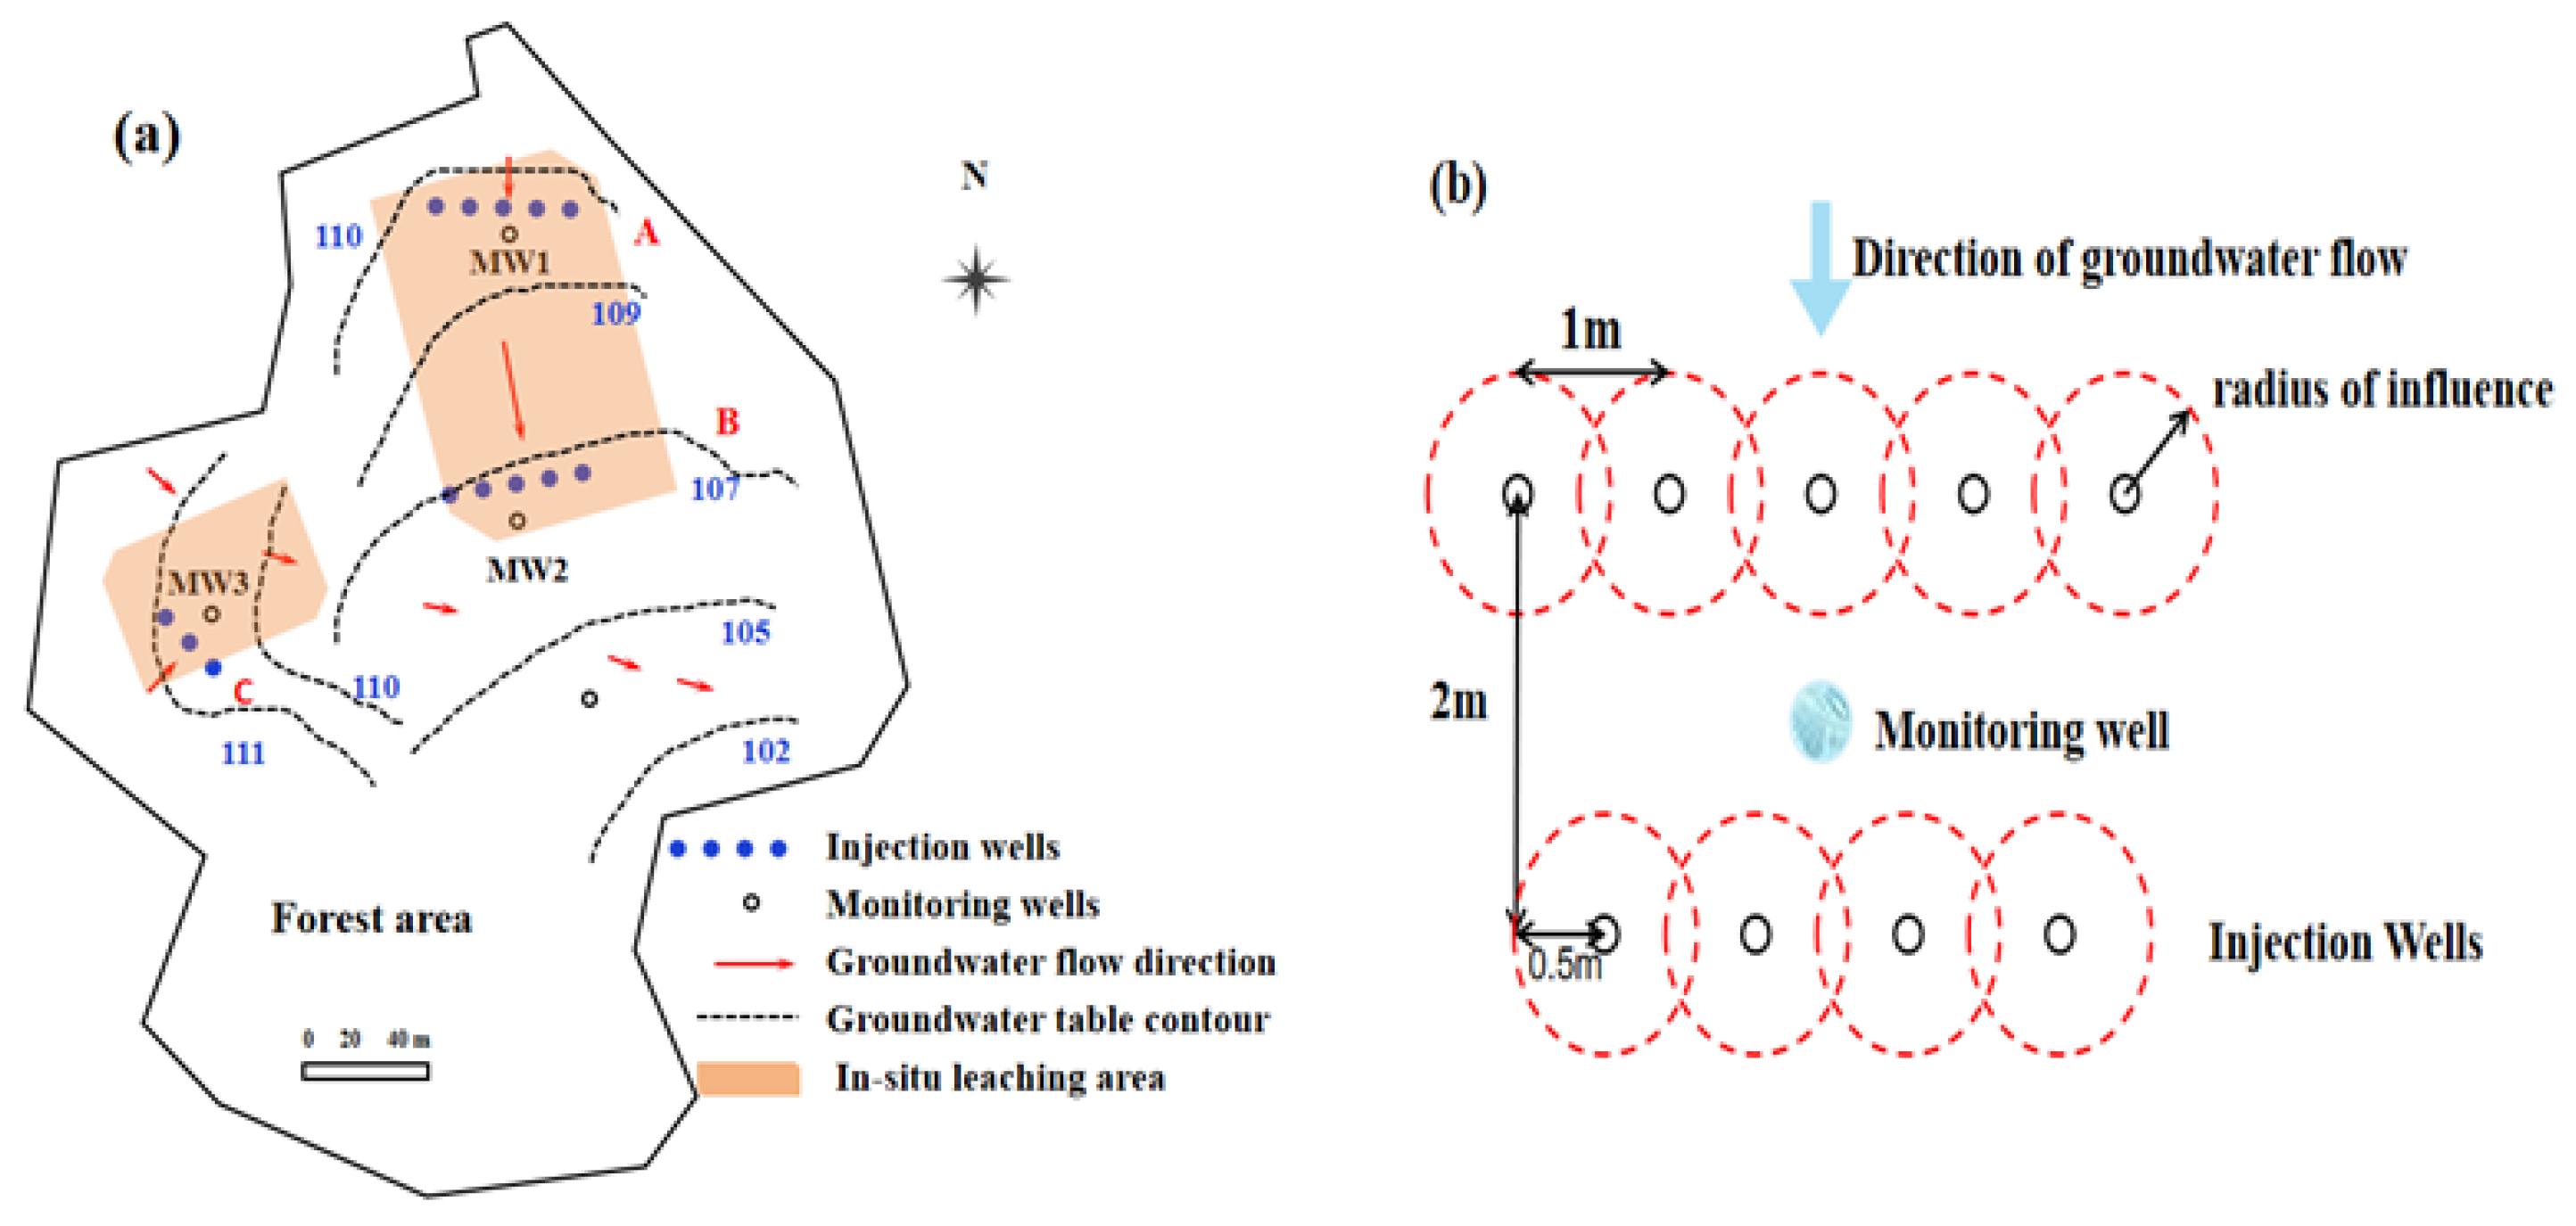
3.2. The Pilot Study for the Assessment of NH4+-N and NO3-N Combined Contaminations

Based on laboratory column test results, the in situ study involved injecting microbial agents in conjunction with micro-ZVI. The three chosen pilot test points were in situ acid-leached areas with high-concentration contamination (Figure 3a). Three injection wells (A, B, C) were planned to be perpendicular to groundwater, and a mixed arrangement of single and double rows was adopted. Monitoring wells MW1-MW3 were located downstream of the injection wells (Figure 3b). Table 2 and Table 3 outline the information of injection wells and monitoring wells, respectively. Among them, the depth of the injection wells should ensure that the screen is 2 m below the groundwater level for proper material injection.
The metabolism of nitrifying and denitrifying bacteria occurs within a specific pH range (Figure 2). Alkali agents (i.e., sodium hydroxide and sodium bicarbonate) were firstly injected to maintain an appropriate pH condition. Following this, aeration was employed to raise the DO concentration above 2 mg·L−1, creating an ideal aerobic environment for microbial nitrification reactions. After 5–7 days of nitrification, aeration ceased, and micro-ZVI was introduced to observe changes in NH4+-N and NO3-N concentrations in groundwater. Intermittent aeration was used to modify the groundwater’s redox conditions, cycling between nitrification and denitrification reactions to progressively eliminate NH4+-N and NO3-N. Experience in the field suggested an injection pressure of 1.5 MPa, a flow rate of 300 L·h−1, an impact radius of 1–2 m, aeration of each well every 5 days for 6 min, alkali agent injections every 18 days at 6 kg each time, and dosing of microbial agents and ZVI at 20 kg and 6 kg, respectively. For detailed dosing methods for nitrifying and denitrifying bacteria, consult Tables S1 and S2.

3.3. Experimental Results of Pilot Site

3.3.1. Monitoring Results of Total Iron Concentration in Groundwater

Generally, high concentrations of Fe2+ typically indicate higher ZVI activity and better mobility [37]. The concentrations of Fe2+ measured at different time intervals in the monitoring wells are shown in Table S3. The Fe2+ concentration steadily increased over the first 0~7 days post-ZVI injection, indicating that under high-pressure injection conditions, ZVI diffused into the downstream monitoring wells (~2 m downstream), although it is challenging to assess its exact quantity. Moreover, after 7 days, there was a slight decrease in Fe2+ concentration, suggesting that the reactivity of ZVI diminished after this period.

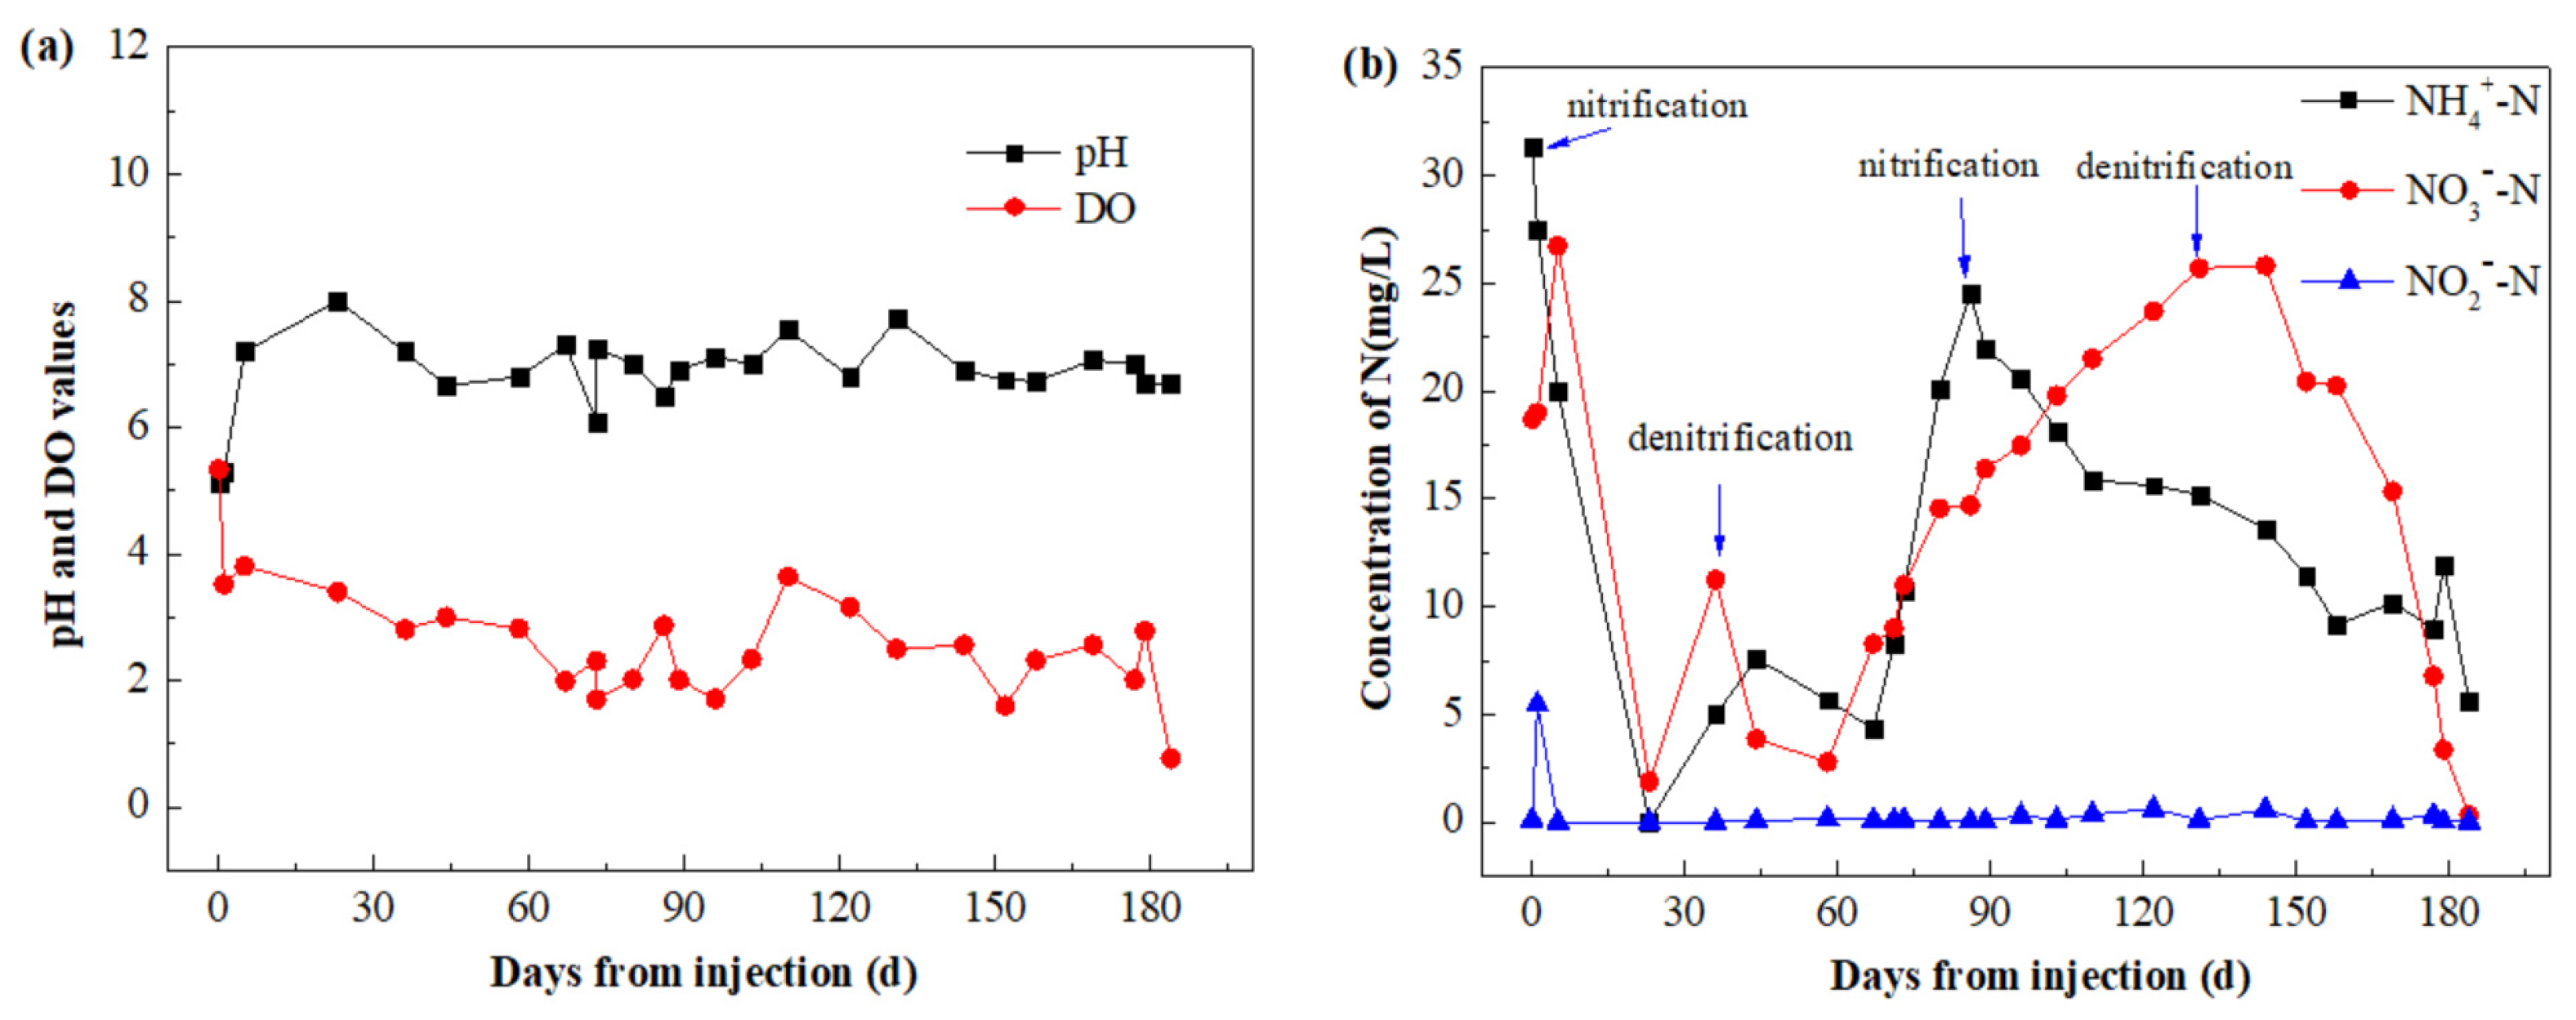
3.3.2. Monitoring Results of Injection Point A

The results from monitoring at injection point A, as illustrated in Figure 4, depict the variations in DO, pH, and different N concentrations at monitoring well MW1 over a 180-day remediation period post the introduction of remedial agents. Following the injection of alkali agents, the pH at MW1 spiked from 5.2 to 7.4 on the first day, stabilizing at around 7.0 thereafter (Figure 4a). Likewise, the DO levels rose swiftly to about 5.4 on the initial aeration day, maintaining at around 2 mg/L with continuous aeration. During the 1–26-day timeframe of nitrifying bacteria injection, the NH4+-N concentration plunged rapidly from 31.3 mg/L to below 5 mg/L. However, between 26 and 58 days, there was a slight uptick in both NH4+-N and NO3-N concentrations, notably peaking between 58 and 87 days. This re-rising concentration trend may be attributed to the runoff from the rainy season (Figure S4), which causes the release of N-pollutants from the aquifer soil. The high concentration of NH4+-N and NO3-N in the soil (Figure S5) indicated that the soil is highly likely to affect the distribution and movement of NH4+-N and NO3-N in groundwater through the adsorption, exchange, and degradation processes in the upper layer [14,38,39,40]. Similarly, points B and C (Figure 5 and Figure 6) also experienced a rising trend in both NH4+-N and NO3-N concentrations between 58 and 87 days because of the runoff. Consequently, solely addressing NH4+-N and NO3-N in groundwater may not fully eradicate the pollution source, necessitating concurrent soil restoration to curb or diminish the release of pollutants into groundwater.
Upon escalating the frequency of nitrifying bacteria injections (without ZVI) between 88 and 124 days, NO3-N increased significantly with the decrease in NH4+-N, likely because (i) NO3-N is the oxidation product of NH4+-N, and the concentration of NO3-N would continue to increase when the concentration of NH4+-N decreased, and (ii) oxygen explosion is required during the NH4+-N remediation period, but high DO during NH4+-N remediation would inhibit the removal efficiency for NO3-N by denitrifying bacteria, resulting in the accumulation of NO3-N [41,42]. Following the injection of denitrification agents from 125 to 180 days, the NO3-N concentration gradually declined. Moreover, due to the depth of injection well A being greater than 10 m, the DO concentration in the groundwater lingered at a lower level, typically below 3 mg/L, even with continuous aeration, underscoring the significance of DO as a primary limiting factor in NH4+-N microbial remediation within deep groundwater. Through continual adjustments in aeration and the frequency of remedial agent injections, by day 180, the removal efficiency for NH4+-N and NO3-N had reached 82.50% and 98.80%, respectively. Notably, the NO2-N concentration remained below 1 mg/L for most of the study duration, except for a slight rise at the onset of the reaction.

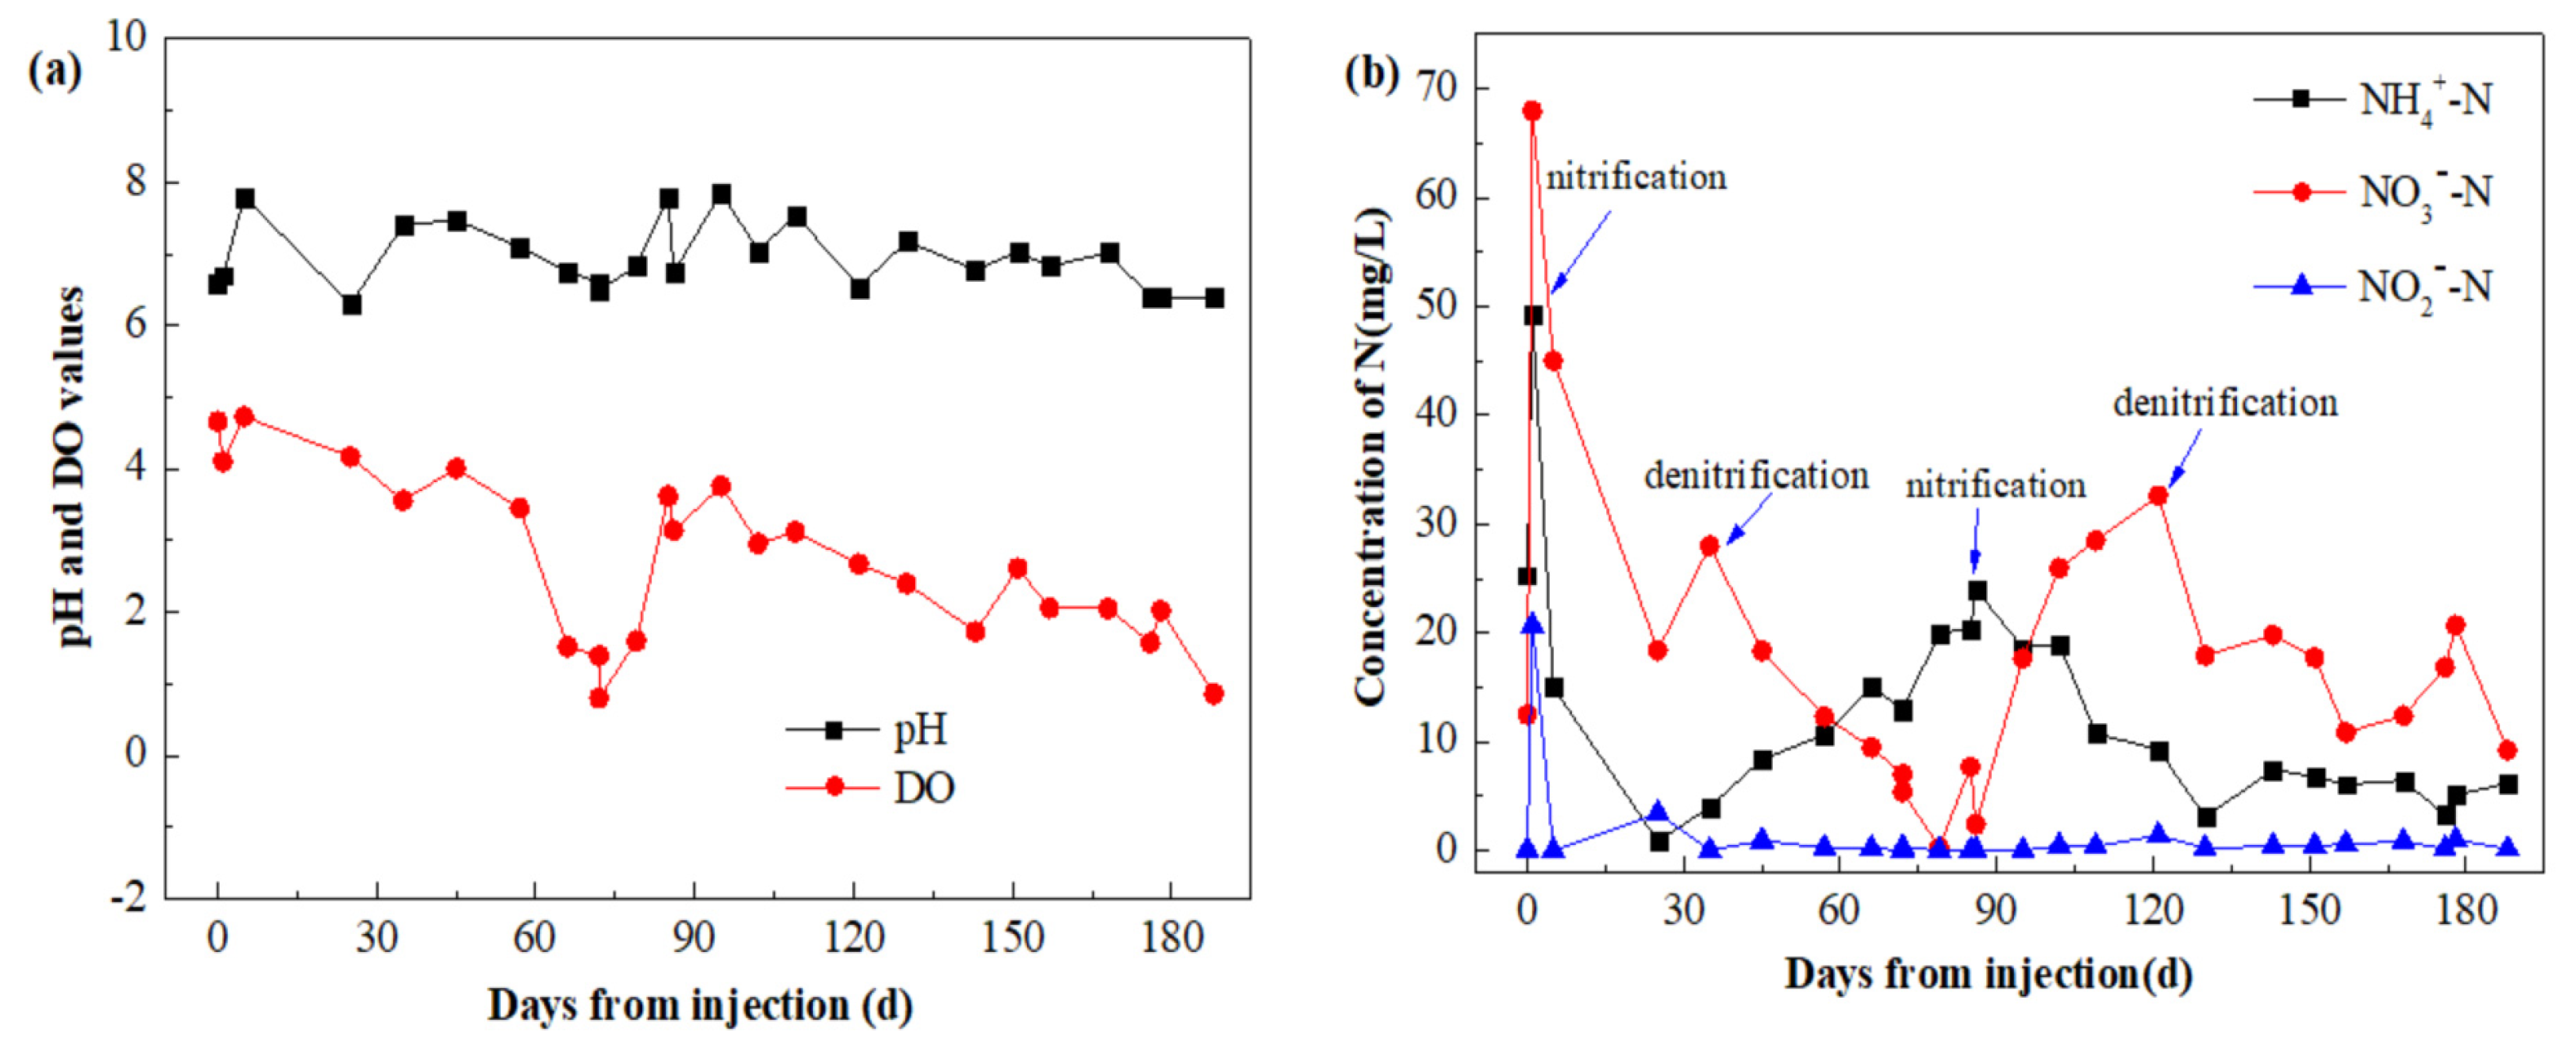
3.3.3. Monitoring Results of Injection Point B

At injection point B (Figure 5), upon the introduction of alkali agents, the pH quickly increased from 6.6 to 7.8 on the first day, stabilizing at around 7.5 thereafter. Initially, during aeration, the DO concentration rose rapidly to approximately 4.7. However, reducing the aeration frequency led to a rapid decrease in DO concentration to below 2 mg/L. This decline can be attributed to the significant oxygen consumption during the nitrification process, where the removal of NH4+-N results in the depletion of oxygen [4]. Increasing the frequency of aeration would further elevate the DO concentration to 2 mg/L.
The NH4+-N concentration gradually declined from 25.3 mg/L to below 3 mg/L over days 1–30. Nevertheless, during the denitrification phase (31–60 days), the NH4+-N concentration increased back to 25 mg/L. Reinitiating the nitrification remediation between days 85 and 120, along with supplementing additional remediation fluid, led to a progressive decrease in NH4+-N concentration to below 5 mg/L. As a byproduct of nitrification, NO3-N exhibits an inverse relationship with the NH4+-N concentration. For instance, between 1 and 30 days, as the NH4+-N concentration decreased, the NO3-N concentration gradually rose to 45 mg/L. The concentration of NO2-N was also monitored during the remediation process, with the concentration remaining below 1 mg/L for the majority of the duration, except for a brief spike at the initial phase of the reaction. Through continuous adjustments in aeration and the frequency of remedial agent injections, by 180 days, the removal efficiency for NH4+-N and NO3-N had reached 87.5% and 86.4%, respectively, in comparison to their initial concentrations.

3.3.4. Monitoring Results at Injection Point C

The injection of alkali agents caused the pH to quickly rise from 5.2 to 7.4 on the first day, stabilizing at around 7.0 thereafter at injection point C (Figure 6). Subsequent aeration led to a rapid increase in the DO concentration from 2.4 to approximately 5.8 on the same day. During the nitrification phase, the NH4+-N concentration gradually decreased from 48.6 mg/L to below 5.6 mg/L within the first 30 days. However, reducing the aeration frequency resulted in a significant drop in the DO concentration to below 2 mg/L between 31 and 90 days.
Given the deeper groundwater level at monitoring well MW3, the DO concentration consistently remained low (<2 mg/L). During the denitrification phase, the NO3-N concentration at this well consistently stayed at a lower level (<20 mg/L), possibly due to conducive conditions for denitrifying bacteria in low DO concentrations facilitating the removal of NO3-N. Additionally, compared to the other monitoring points, this well displayed greater data variability, likely stemming from its distinct hydrogeological conditions. Site investigations identified the predominant soil type at injection point C as silty clay, characterized by a dense particle structure with limited permeability due to small gaps between the clay particles. These clay particles restrict the water flow, leading to lower permeability coefficients compared to sandy soil. Silty clay, often termed a “low-permeability layer” in groundwater systems, hinders the migration and diffusion of pollutants, slowing the spread of contaminants beyond the remediation area. This constraint may impede pollutant movement during remediation, prolonging both the duration and extent of remediation activities. By adjusting aeration and remedial agent injection frequency continuously, by the conclusion of the 180-day remediation period, the removal efficiency for NH4+-N and NO3-N had reached 94.50% and 92.90%, respectively. Meanwhile, NO2-N concentrations remained below 1.5 mg/L throughout the monitoring period.

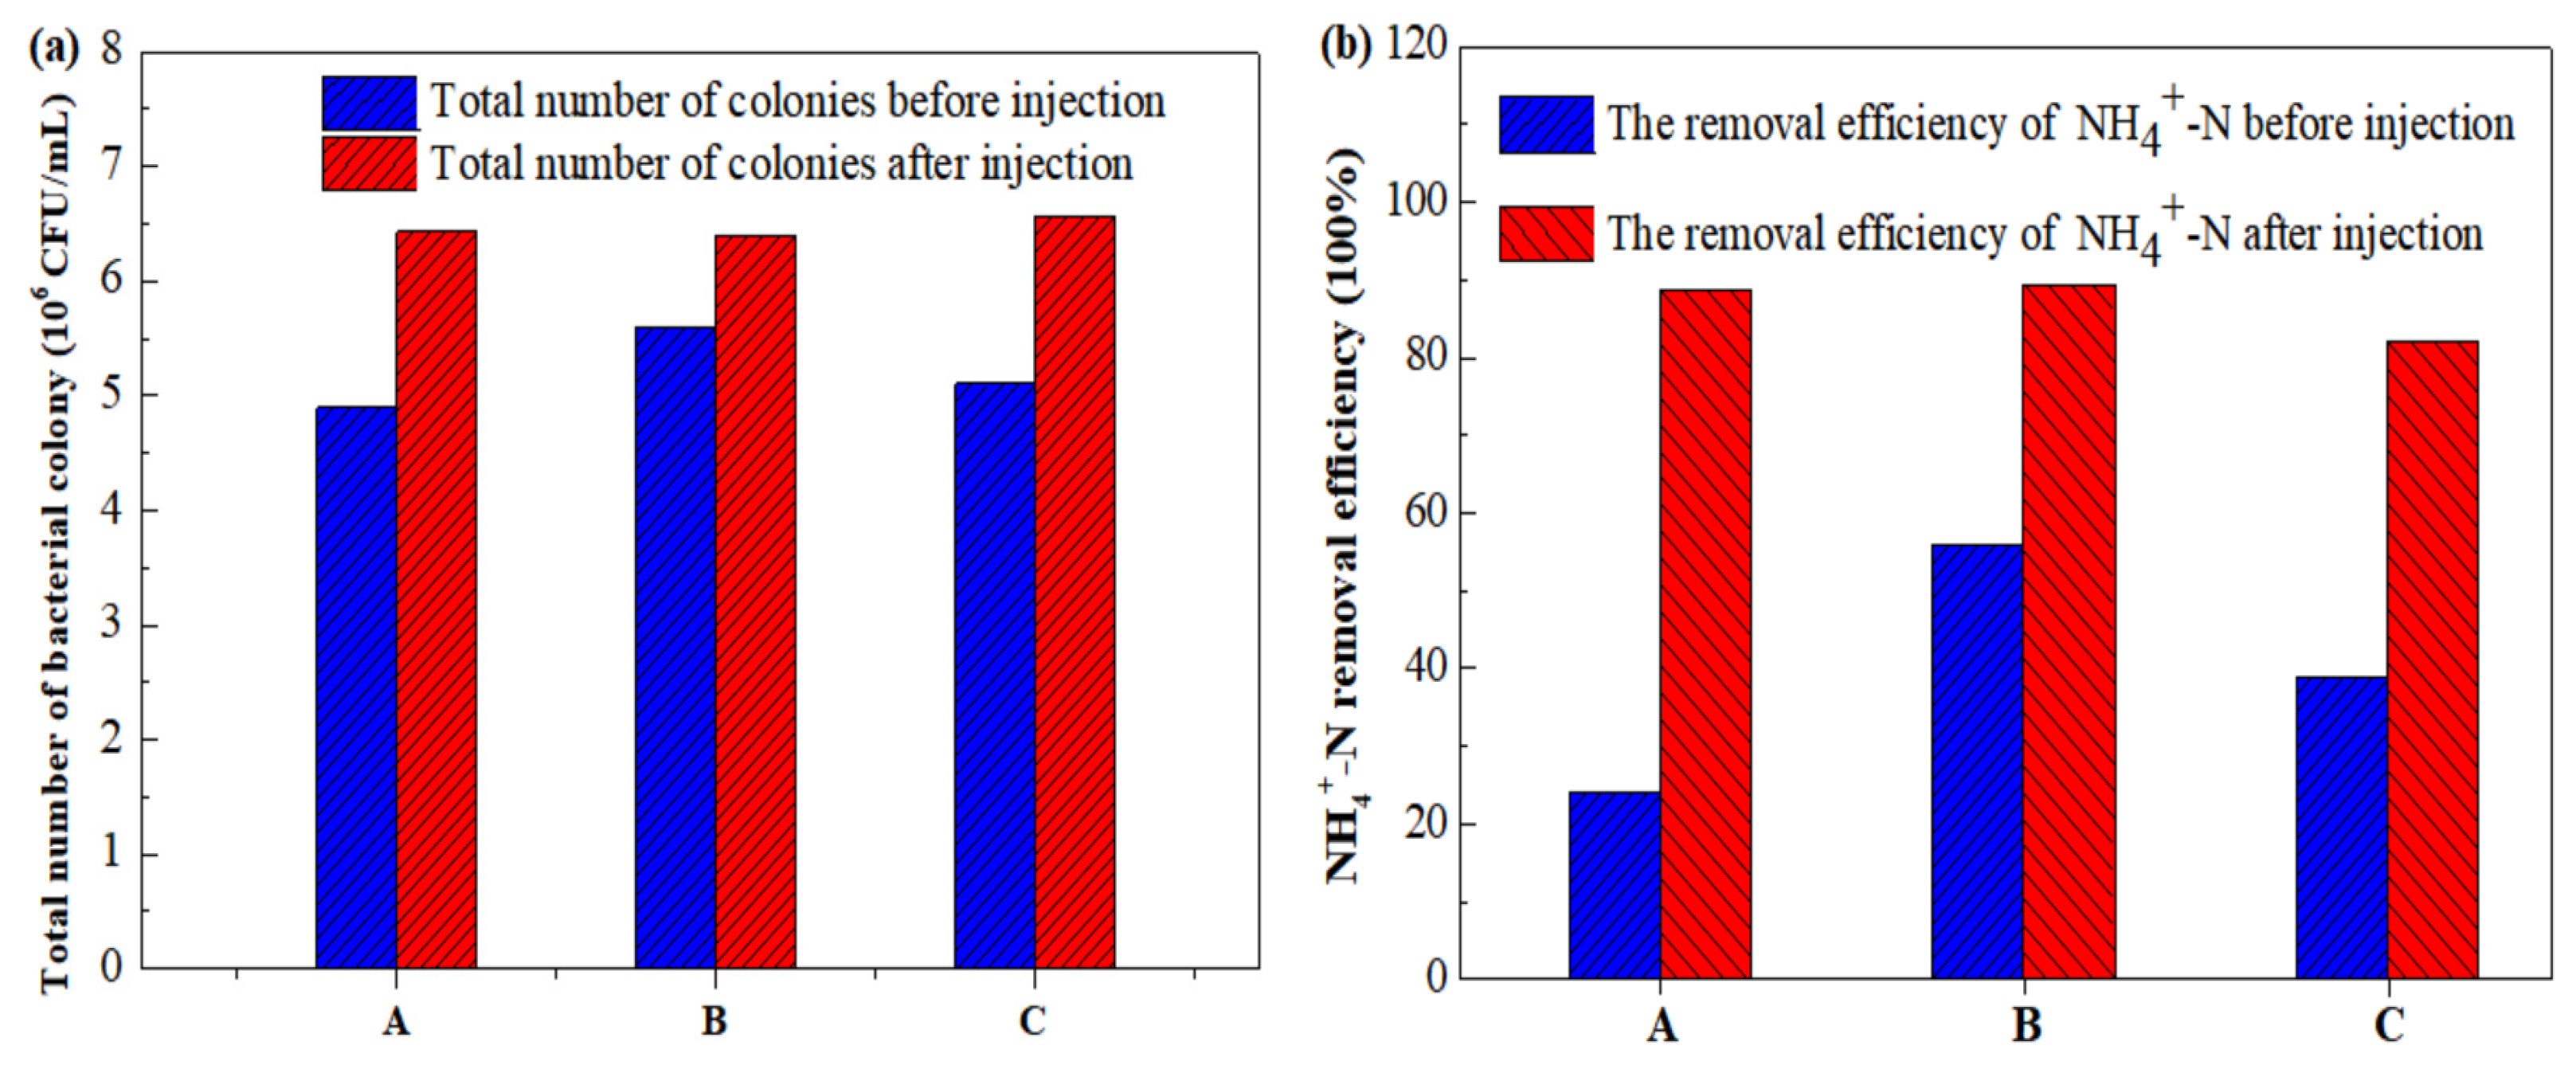
3.3.5. Total Number of Colonies and NH4+-N Removal Efficiency

The total colony count serves as an indicator of the quantity and activity levels of microorganisms. Maintaining an optimal total colony count is crucial for preserving the diversity and equilibrium of microbial communities, ensuring the presence of microbes that adapt well to their surroundings and have degradation capabilities [43,44]. Figure 7a illustrates that prior to the introduction of bacterial agents, the total colony count at three locations hovered around 105 CFU/mL. The acidic condition of the groundwater before administering the remediation agent might inhibit microbial community growth, contributing to these initial readings. Post-injection, however, the count escalates significantly, surpassing 106 CFU/mL. It is well known that nitrifying bacteria ideally thrive in concentrations ranging from 105 to 106 CFU/mL, whereas denitrifying bacteria prefer a slightly higher concentration, typically between 106 and 107 CFU/mL [45]. However, the implementation in actual field conditions may require adjustments based on preliminary assessments and ongoing monitoring to optimize the effectiveness of the bioremediation process. It is essential to conduct trials to determine the most effective microbial concentration for a specific site and contamination scenario.
Additionally, a positive correlation exists between the total colony count and the removal of NH4+-N. Before the injection, the removal rates of NH4+-N at points A, B, and C were all below 60% (Figure 7b). Following the application of bacterial agents, these rates saw a substantial increase due to the growth of microbial colonies within the sediment at the bottom of the injection well, with efficiency reaching upwards of 80%.

3.3.6. Site Management and Operational Experience

Utilizing ZVI alongside microbial techniques to address NH4+-N and NO3-N pollutants at contaminated locations present significant challenges due to the complexity of the site’s hydrogeology, which often results in outcomes that do not match the efficacy observed in controlled laboratory settings. Therefore, strengthening the management of on-site engineering implementation and dynamically adjusting remediation strategies are crucial for achieving improved remediation effects for the NH4+-N and NO3-N pollutants. Firstly, at locations where remediation effect has been effectively achieved, halting the injection of agents and shifting to regular monitoring can maintain effectiveness while being cost-efficient. Furthermore, it is necessary to adjust remediation parameters immediately based on the latest monitoring data. Particularly at locations where the removal efficiency for NH4+-N falls below 80%, intensifying aeration and adjusting the frequency of injecting solutions are essential measures to boost the nitrification process. In addition, the operational phase revealed issues like deformation, misalignment, and blockages in the pipework of injection wells (Figure S6). Addressing these problems involves critical maintenance actions such as excavating and replacing misaligned pipes, as well as applying aeration and pumping to clear blocked pipes of bio-silt. Based on our engineering operation experience, the above measures are of great significance for improving the removal efficiency for NH4+-N and NO3-N at the pilot site.

4. Conclusions

This study utilized both lab-based experiments and pilot field studies to prove that ZVI, when used alongside microbial agents, significantly improves the treatment of groundwater contaminated with high levels of NH4+-N and NO3-N combined contamination. The conclusions are as follows:
(1)
The laboratory experiments showed that nitrifying bacteria could increase the removal efficiency for 50 mg/L of NH4+-N to over 99% within 5 days. DO concentration emerged as a crucial factor influencing nitrification efficiency, with higher DO levels significantly enhancing the nitrification process. The introduction of ZVI in the reaction columns reduced the denitrification-driven NO3-N remediation cycle from 15 days to approximately 10 days. This improvement was mainly attributed to ZVI elevating pH levels and facilitating the reduction of NO3-N, thereby promoting denitrification through microbial activity synergistically.
(2)
The pilot-scale experiments demonstrated that the combination of ZVI with microbial agents substantially boosted the removal efficiency for NH4+-N and NO3-N combined contamination in groundwater. The injection of ZVI and microbial agents increased the removal efficiency for NH4+-N and NO3-N contaminants to above 80%. However, the presence of complex hydrogeological interactions, such as those between soil and groundwater and the existence of low-permeability layers, hindered the removal efficiency for N-pollutants. Adjusting the process parameters, including the remediation agent injection frequency and aeration frequency, is essential to meet the remediation requirements for NH4+-N and NO3-N combined contamination.
(3)
In practical engineering applications, enhancing monitoring and remediation agent injection is critical. Locations with inadequate remediation outcomes require increased injection frequency. Addressing issues like sludge accumulation in well bottoms, voids around injection wells, and solid alkali precipitation necessitates improved maintenance of in situ injection wells. Strategies to enhance overall remediation efficiency involve supplementing filling materials, reinforcing injection wells, regular well maintenance, and optimizing alkali dosing levels.

Supplementary Materials

The following supporting information can be downloaded at https://www.mdpi.com/article/10.3390/pr12122768/s1, Text S1: Details of detection methods for NH4-N, NO3-N, NO2-N, and the total bacterial colonies; Figure S1: Schematic diagram of reaction column in laboratory test; Figure S2: Effect of different ZVI mass concentrations on pH of aqueous solution; Figure S3: Effect of DO on removal efficiency for NH4+-N and NO3-N; Figure S4: The amount of rainfall in different remediation periods; Figure S5: The concentration of NH4+-N and NO3-N in soil at different points; Figure S6: Problems in injection wells and photos of work and results before and after rectification; Table S1: Parameters of in situ nitrification restorers; Table S2: Parameters of in situ denitrification restorers; Table S3: Geochemical parameters of groundwater in the pilot test area after ZVI injection.

Author Contributions

Conceptualization, J.C. and X.W.; formal analysis, Y.L., J.Z., Z.L., Y.H., X.C., M.L. and H.F.; investigation, J.C., J.Z., X.C., M.L. and H.F.; methodology, J.C., J.Z., Z.L. and X.C.; supervision, X.W.; writing—original draft, J.C.; writing—review and editing, Y.H. and X.W. All authors have read and agreed to the published version of the manuscript.

Funding

This work was supported financially by the National Key Research and Development Program of China (No. 2022YFC3702300), the Guangdong Basic and Applied Basic Research Foundation (No. 2024A1515011091), the National Natural Science Foundation of China (No. 42207244), the Science and Technology innovation self-supporting projects by the Pearl River Water Resources Research Institute ([2022]YF005), and the Open Research Fund of the Key Laboratory of Water Security Guarantee in the Guangdong–Hong Kong–Marco Greater Bay Area of the Ministry of Water Resources (No. WSGBA-KJ202306).

Data Availability Statement

All data and materials supporting the findings of this study are available upon reasonable request.

Acknowledgments

We appreciate the assistance of the Analysis and Testing Center at the College of Ecological Environment, Guangdong University of Technology, and the Analysis and Testing Center at South China Normal University for their support with analytical testing. This work was financially supported by the central ecological environment fund for water pollution preventing and controlling project (XMHT-2022-SS-FW847) of China.

Conflicts of Interest

Authors Junyi Chen, Xiangxin Chen, Mingkui Li and Hanyun Fan were employed by the company Guangzhou Runfang Environmental Protection Technology Co., Ltd. The remaining authors declare that the research was conducted in the absence of any commercial or financial relationships that could be construed as a potential conflict of interest. The company had no role in the design of the study; in the collection, analyses, or interpretation of data; in the writing of the manuscript, or in the decision to publish the results.

References

  1. Adimalla, N.; Li, P.; Qian, H. Evaluation of groundwater contamination for fluoride and nitrate in semi-arid region of Nirmal Province, South India: A special emphasis on human health risk assessment (HHRA). Hum. Ecol. Risk Assess. Int. J. 2019, 25, 1107–1124. [Google Scholar] [CrossRef]
  2. Shen, S.; Ma, T.; Du, Y. Temporal variations in groundwater nitrogen under intensive groundwater/surface-water interaction. Hydrogeol. J. 2019, 27, 1753–1762. [Google Scholar] [CrossRef]
  3. Tang, S.; Luo, Z.; Liao, J.; Liu, Z.; Xu, L.; Niu, J. Degradation and detoxification mechanisms of organophosphorus flame retardant tris(1,3-dichloro-2-propyl) phosphate (TDCPP) during electrochemical oxidation process. Chin. Chem. Lett. 2023, 34, 108090. [Google Scholar] [CrossRef]
  4. Xiong, Y.; Du, Y.; Deng, Y.; Ma, T.; Li, D.; Sun, X.; Liu, G.; Wang, Y. Contrasting sources and fate of nitrogen compounds in different groundwater systems in the Central Yangtze River Basin. Environ. Pollut. 2021, 290, 118119. [Google Scholar] [CrossRef]
  5. Yu, Q.J.; Cao, Q.; Connell, D.W. An overall risk probability-based method for quantification of synergistic and antagonistic effects in health risk assessment for mixtures: Theoretical concepts. Environ. Sci. Pollut. Res. Int. 2011, 19, 2627–2633. [Google Scholar] [CrossRef]
  6. Zhang, Y.; Douglas, G.B.; Pu, L.; Zhao, Q.; Tang, Y.; Xu, W.; Luo, B.; Hong, W.; Cui, L.; Ye, Z. Zero-valent iron-facilitated reduction of nitrate: Chemical kinetics and reaction pathways. Sci. Total Environ. 2017, 598, 1140–1150. [Google Scholar] [CrossRef]
  7. Zhang, Q.; Ren, F.; Li, F.; Chen, G.; Yang, G.; Wang, J.; Du, K.; Liu, S.; Li, Z. Ammonia nitrogen sources and pollution along soil profiles in an in-situ leaching rare earth ore. Environ. Pollut. 2020, 267, 15449. [Google Scholar] [CrossRef]
  8. Deng, C.; Chen, Z.; Li, Y. Effective recovery of the nitritation process through hydrogen peroxide. Environ. Sci. Pollut. Res. 2024, 31, 28404–28417. [Google Scholar] [CrossRef]
  9. Maharjan, A.K.; Mori, K.; Toyama, T. Nitrogen removal ability and characteristics of the laboratory-scale tidal flow constructed wetlands for treating ammonium-nitrogen contaminated groundwater. Water 2020, 12, 1326. [Google Scholar] [CrossRef]
  10. Powlson, D.S.; Addiscott, T.M.; Benjamin, N.; Cassman, K.G.; Kok, T.M.; Grinsven, H.; L’hirondel, J.L.; Avery, A.A.; Kessel, C. When does nitrate become a risk for humans? J. Environ. Qual. 2008, 37, 291–295. [Google Scholar] [CrossRef]
  11. Umezawa, Y.; Hosono, T.; Onodera, S.; Siringan, F.; Buapeng, S.; Delinom, R.; Yoshimizu, C.; Tayasu, I.; Nagata, T.; Taniguchi, M. Sources of nitrate and ammonium contamination in groundwater under developing Asian megacities. Sci. Total Environ. 2008, 404, 361–376. [Google Scholar] [CrossRef] [PubMed]
  12. Yu, G.; Wang, J.; Liu, L. The analysis of groundwater nitrate pollution and health risk assessment in rural areas of Yantai, China. BMC Public Health 2020, 20, 43–52. [Google Scholar] [CrossRef] [PubMed]
  13. GB 5749-2022; Standards for Drinking Water Quality. National Health Commission of the People’s Republic of China: Beijing, China, 2022.
  14. Li, S.; Zhang, Y.; Yin, S. Analysis of microbial community structure and degradation of ammonia nitrogen in groundwater in cold regions. Environ. Sci. Pollut. Res. 2020, 27, 44137–44147. [Google Scholar] [CrossRef] [PubMed]
  15. Rajta, A.; Bhatia, R.; Setia, H.; Pathania, P. Role of heterotrophic aerobic denitrifying bacteria in nitrate removal from wastewater. J. Appl. Microbiol. 2020, 128, 1261–1278. [Google Scholar] [CrossRef]
  16. Elisante, E.; Muzuka, A.N.N. Assessment of sources and transformation of nitrate in groundwater on the slopes of Mount Meru, Tanzania. Environ. Earth Sci. 2016, 75, 277. [Google Scholar] [CrossRef]
  17. Guo, W.; Ying, X.; Zhao, N.; Yu, S.; Zhang, X.; Feng, H.; Zhang, Y.; Yu, H. Interspecies electron transfer between Geobacter and denitrifying bacteria for nitrogen removal in bioelectrochemical system. Chem. Eng. J. 2023, 455, 1385–8947. [Google Scholar] [CrossRef]
  18. Xu, D.; Ling, H.; Li, Z.; Li, Y.; Chen, R.; Cai, S. Treatment of Ammonium-Nitrogen–Contaminated Groundwater by Tidal Flow Constructed Wetlands Using Different Substrates: Evaluation of Performance and Microbial Nitrogen Removal Pathways. Water Air Soil Pollut. 2022, 233, 159. [Google Scholar] [CrossRef]
  19. Solomon, K.M.; Eldon, R.R.; Hullebusch, E.D.; Annachhatre, A.P. Nitrate removal from groundwater: A review of natural and engineered processes. J. Water Supply Res. Technol. 2018, 67, 885–902. [Google Scholar] [CrossRef]
  20. Usher, K.M.; Kaksonen, A.H.; Cole, I.; Marney, D. Critical review: Microbially influenced corrosion of buried carbon steel pipes. Int. Biodeterior. Biodegrad. 2014, 93, 84–106. [Google Scholar] [CrossRef]
  21. Lu, Q.; Jeen, S.-W.; Gui, L.; Gillham, R.W. Nitrate reduction and its effects on trichloroethylene degradation by granular iron. Water Res. 2017, 112, 48–57. [Google Scholar] [CrossRef]
  22. Hou, J.; Wang, A.; Miao, L.; Wu, J.; Xing, B. The role of nitrate in simultaneous removal of nitrate and trichloroethylene by sulfidated zero-valent iron. Sci. Total Environ. 2022, 829, 154304. [Google Scholar] [CrossRef] [PubMed]
  23. Liu, Y.; Wang, J. Reduction of nitrate by zero valent iron (ZVI)-based materials: A review. Sci. Total Environ. 2019, 671, 388–400. [Google Scholar] [CrossRef] [PubMed]
  24. Wei, X.P.; Guo, Z.; Yin, H.; Yu, Y.; Dang, Z. Removal of heavy metal ions and polybrominated biphenyl ethers by sulfurized nanoscale zerovalent iron: Compound effects and removal mechanism. J. Hazard. Mater. 2021, 414, 125555. [Google Scholar] [CrossRef]
  25. Song, W.; Gao, B.; Wang, H.; Xu, X.; Xue, M.; Zha, M.; Gong, B. The rapid adsorption-microbial reduction of perchlorate from aqueous solution by novel amine-crosslinked magnetic biopolymer resin. Bioresour. Technol. 2017, 240, 68–76. [Google Scholar] [CrossRef] [PubMed]
  26. Zhang, Y.; Douglas, G.B.; Anna, H.; Cui, L.; Ye, Z. Microbial reduction of nitrate in the presence of zero-valent iron. Sci. Total Environ. 2019, 646, 1195–1203. [Google Scholar] [CrossRef]
  27. Zhang, W.; Swaney, D.P.; Hong, B. Influence of rapid rural-urban population migration on riverine nitrogen pollution: Perspective from ammonia-nitrogen. Environ. Sci. Pollut. Res. 2017, 24, 27201–27214. [Google Scholar] [CrossRef] [PubMed]
  28. Climate Bulletin of Qingyuan City of 2023. Available online: http://www.gdqy.gov.cn/jjqy/ljqy/jrfc/qyqh/content/post_1841096.html (accessed on 28 November 2024).
  29. Lin, K.; Zhu, Y.; Zhang, Y.; Lin, H. Determination of ammonia nitrogen in natural waters: Recent advances and applications. Trends Environ. Anal. Chem. 2019, 24, e00073. [Google Scholar] [CrossRef]
  30. Li, D.; Xu, X.; Li, Z.; Wang, T.; Wang, C. Detection methods of ammonia nitrogen in water: A review. Trends Environ. Anal. Chem. 2020, 127, 5890. [Google Scholar] [CrossRef]
  31. Michael, O.R.; Stephen, R.B.; Morgan, P.; Smith, J.W.N.; Chrystina, D.B. Nitrate attenuation in groundwater: A review of biogeochemical controlling processes. Water Res. 2008, 42, 4215–4423. [Google Scholar] [CrossRef]
  32. Liu, Y.; Wan, Y.; Ma, Z.; Dong, W.; Su, X.; Shen, X.; Yi, X.; Chen, Y. Effects of magnetite on microbially driven nitrate reduction processes in groundwater. Sci. Total Environ. 2023, 855, 15895. [Google Scholar] [CrossRef]
  33. Xu, J.; Pu, Y.; Qi, W.; Yang, X.; Tang, Y.; Wan, P.; Adrian, F. Chemical removal of nitrate from water by aluminum-iron alloys. Chemosphere 2016, 166, 197–202. [Google Scholar] [CrossRef]
  34. Kutvonen, H.; Rajala, P.; Carpén, L.; Malin, B. Nitrate and ammonia as nitrogen sources for deep subsurface microorganisms. Front. Microbiol. 2015, 6, 1079. [Google Scholar] [CrossRef] [PubMed]
  35. Li, P.; Wang, Y.; Zuo, J.; Wang, R.; Zhao, J.; Du, Y. Nitrogen Removal and N2O Accumulation during Hydrogenotrophic Denitrification: Influence of Environmental Factors and Microbial Community Characteristics. Environ. Sci. Technol. 2017, 51, 870–879. [Google Scholar] [CrossRef]
  36. Niu, C.; Zhai, T.; Zhang, Q.; Wang, H.; Xiao, L. Research Advances in the Analysis of Nitrate Pollution Sources in a Freshwater Environment Using δ15 N-NO3 and δ18O-NO3. Int. J. Environ. Res. Public Health 2021, 18, 11805. [Google Scholar] [CrossRef]
  37. Wei, Y.T.; Wu, S.C.; Chou, C.M.; Che, C.H.; Tsai, S.M.; Lien, H.L. Influence of nanoscale zero-valent iron on geochemical properties of groundwater and vinyl chloride degradation: A field case study. Water Res. 2010, 44, 131–140. [Google Scholar] [CrossRef]
  38. Li, D.; Zhou, Y.; Long, Q.; Li, R.; Lu, C. Ammonia nitrogen adsorption by different aquifer media: An experimental trial for nitrogen removal from groundwater. Hum. Ecol. Risk Assess. 2020, 26, 2434–2446. [Google Scholar] [CrossRef]
  39. Liu, T.; Xia, X.; Liu, S.; Mou, X.; Qiu, Y. Acceleration of Denitrification in Turbid Rivers Due to Denitrification Occurring on Suspended Sediment in Oxic Waters. Environ. Sci. Technol. 2013, 47, 4053–4061. [Google Scholar] [CrossRef]
  40. Yin, G.; Hou, L.; Liu, M.; Liu, Z.; Wayne, S.A. Novel Membrane Inlet Mass Spectrometer Method to Measure 15 NH4+ for Isotope-Enrichment Experiments in Aquatic Ecosystems. Environ. Sci. Technol. 2014, 48, 9555–9562. [Google Scholar] [CrossRef] [PubMed]
  41. Wang, R.; Zheng, P.; Xing, Y.; Zhang, M.; Ghulam, A.; Zhao, A.; Li, W.; Wang, L. Anaerobic ferrous oxidation by heterotrophic denitrifying enriched culture. J. Ind. Microbiol. Biotechnol. 2014, 41, 803–809. [Google Scholar] [CrossRef]
  42. Xu, D.; Li, Y.; Song, F.; Gu, T. Laboratory investigation of microbiologically influenced corrosion of C1018 carbon steel by nitrate reducing bacterium Bacillus licheniformis. Corros. Sci. 2013, 77, 385–390. [Google Scholar] [CrossRef]
  43. Tong, K.; Zhang, Y.; Liu, G.; Ye, Z.; Paul, K. Treatment of heavy oil wastewater by a conventional activated sludge process coupled with an immobilized biological filter. Int. Biodeterior. Biodegrad. 2013, 84, 65–71. [Google Scholar] [CrossRef]
  44. Wu, D.; Chen, G.; Zhang, X. Change in microbial community in landfill refuse contaminated with antibiotics facilitates denitrification more than the increase in ARG over long-term. Sci. Rep. 2017, 7, 41230. [Google Scholar] [CrossRef] [PubMed]
  45. Goncalves da Silva, D. Nitrosomonas Eutropha D23—An In Vitro, Evaluation of Its Metabolic Phenotype and Evidence for Its Bio-Activity. Doctoral Thesis, University of Southampton, Southampton, UK, 2019; p. 272. Available online: http://eprints.soton.ac.uk/id/eprint/437367 (accessed on 28 November 2024).
Figure 1. Location map of the pilot study area and research site. The stars indicate the locations within the study area, while points A, B, and C represent three representative research sites.
Processes 12 02768 g001
Figure 2. Influence of different factors on nitrification and denitrification efficiency. The effect of ZVI on the microbial degradation of NH4+-N and NO3-N, respectively (a), the effects of different pH (b), microbial mass concentration (c), and glucose concentration (d) on the removal of NH4+-N and NO3-N in a ZVI/microbial complex system (reaction conditions: [ZVI]0 = 200 mg·L−1, [microorganism]0 = 20–400 mg·L−1, [glucose]0 = 0–500 mg·L−1, and pHini = 4–9).
Processes 12 02768 g002
Figure 3. Pilot point position information: (a) map of the study site and (b) layout diagram of the injection well and monitoring well. The letters A, B, and C represent three representative research sites.
Processes 12 02768 g003
Figure 4. Variation of DO, pH (a) and different types of N concentration (b) during the point A remediation.
Processes 12 02768 g004
Figure 5. Variation of DO, pH (a), and different types of N concentration (b) during point B remediation.
Processes 12 02768 g005
Figure 6. Variation of DO, pH (a), and different types of N concentration (b) during the point C remediation.
Processes 12 02768 g006
Figure 7. Total number of colonies (a) and removal rate of NH4+-N (b) before and after injection.
Processes 12 02768 g007
Table 1. Nitrogen pollution concentration in different injection wells.
SitesNH4+-N
(mg/L)
NO3-N
(mg/L)
NO2-N
(mg/L)
Total Nitrogen (mg/L)
A31.318.70.10550.105
B25.312.50.04937.849
C34.951.350.04586.295
Table 2. In situ injection well parameters.
Injection WellsNumber of RowsNumber of Wells Per RowTotal Number of Injection WellsDepth (m)Actual Top Tube Length (m)Length of Bobbin (m)
A1202018116.8
B120201898.8
C271410.53.56.8
Table 3. List of groundwater monitoring well information.
Monitoring Well NumberLength of Upper Solid Pipe (m)The Length of the Screen (m)Settling Tube Length (m)
MW19101
MW2712.31
MW33201
Disclaimer/Publisher’s Note: The statements, opinions and data contained in all publications are solely those of the individual author(s) and contributor(s) and not of MDPI and/or the editor(s). MDPI and/or the editor(s) disclaim responsibility for any injury to people or property resulting from any ideas, methods, instructions or products referred to in the content.

