Article

Study on the Influence of Heterogeneity of Low-Permeability Reservoirs on Wormhole Morphology and Acidizing Process Parameters

1
Geological Research Institute of Changqing Oilfield Third Oil Production Plant, China National Petroleum Corporation, Yinchuan 750000, China
2
College of Petroleum Engineering, Yangtze University, Wuhan 430100, China
*
Author to whom correspondence should be addressed.
Processes 2024, 12(12), 2740; https://doi.org/10.3390/pr12122740
Submission received: 6 November 2024 / Revised: 25 November 2024 / Accepted: 27 November 2024 / Published: 3 December 2024
(This article belongs to the Section Chemical Processes and Systems)

Abstract

:
Carbonate rocks typically exhibit strong heterogeneity, which can have a significant impact on the effectiveness of acidification processes. This article developed a non-homogeneous reservoir acidification process program based on the TSC model and open-source software FMOT, and studied the influence of heterogeneity intensity on wormhole morphology and acidizing process parameters. The results indicate that different heterogeneity intensities can produce different wormhole development patterns and wormhole morphology. In the early stage of acidizing, there is competitive development at low heterogeneity intensities and a transition to dominant wormhole development as the intensity increases. The differences in the wormholes morphology are mainly reflected in the branching wormholes. Low intensity forms fewer and wider branches, while high intensity forms more and narrower branches. As the heterogeneity intensity increases, the curve shows a downward trajectory characterized by a progressively diminishing rate of decline. However, this enhanced heterogeneity does not affect the optimal injection rate. The optimal injection rate increases with the increase in the acid injection temperature. Under high-heterogeneity conditions, the optimal injection rate increases more significantly with the increase in the inject temperature. Additionally, although typically there are increases with the rise in the inject temperature, this trend reverses under high injection rates.

1. Introduction

Carbonate rocks are the main oil and gas reservoirs with the typical characteristics of strong heterogeneity. During the drilling phase, mud can clog the rock pores around the wellbore, causing damage to the reservoir. To solve this problem, acidification is usually used to improve the permeability of the rock around the wellbore, with the ultimate aim of achieving maximum stimulation potential [1,2].
Acidizing enhances well productivity by dissolving minerals in the rock. This is achieved by injecting specifically formulated acid solutions into the formation at pressures between pore and fracturing pressures. In carbonate reservoirs, hydrochloric acid is commonly used, which dissolves the calcite matrix, creating conductive channels known as wormholes. These wormholes propagate from the wellbore into the formation, bypassing damaged zones. Four key parameters influence the performance of carbonate matrix acidizing: calcite concentration [3,4], acid injection rate [5,6,7], reaction type [8], and rock heterogeneity [9]. Rock heterogeneity is often characterized by the maximum deviation of local porosity values from the mean porosity and the scale at which these variations occur.
The Two-Scale Continuum model (TSC) of acidizing was initially proposed by Panga et al. [10]. Afterwards, Kalia and Balakotaiah extended TSC from the Cartesian coordinate system to the radial model [11,12]. Based on these two models, scholars have conducted extensive research on acidification issues. Kalia employed a uniform distribution method (linear model) to simulate the effect of heterogeneity on acid dissolution reactions [13]. However, multiple studies indicate that real formation porosity distribution follows a log-normal pattern [14,15]. Kalia et al. observed that rock heterogeneity influences not only the structural patterns formed during reactive dissolution but also the amount of acid required to achieve a specified increase in permeability [16]. The required acid volume decreases with increased heterogeneity or length scale of variation, particularly under high acid injection rates. Liu et al. compared porosity distributions generated by normal and uniform distributions, finding that as the standard deviation increases, the number of wormholes decreases, but their morphology becomes more tortuous [17]. Dawei Zhu et al. analyzed the effect of interlayer permeability contrast on the VES acid diversion performance [18]. Mahmoodi et al. proposed a Two-Phase Two-Scale Continuum (TPTSC) model to analyze the optimal acid injection rate across different heterogeneous media, concluding that for low-heterogeneity media, the optimal injection rate is relatively unaffected by oil viscosity, whereas in high-heterogeneity media, it increases with oil viscosity [19]. Through core displacement experiments, Jafarpour et al. demonstrated that optimal injection rates exist for both low- and high-permeability zones [20]. Bekibayev et al. investigated the impact of formation property degradation due to damage on the matrix acidizing efficacy [21]. Cao et al. utilized CT scanning to evaluate dual-core acid flooding experiments at different permeability contrasts to determine acid diversion [22]. Dong et al. developed a 3D acid transport model incorporating acid viscous fingering to achieve non-uniform acid etching [23]. Mou et al. studied the effects of conventional and VES acids on acidizing performance in heterogeneous intervals [24]. Liu et al. demonstrated that, at the pore scale, the effective reaction rate in heterogeneous porous media may be orders of magnitude lower than in well-mixed homogeneous systems [25]. Ghommem et al. showed that rock heterogeneity significantly influences acid dissolution patterns [26]. Maheshwari et al. used a 3D dual-scale continuum model to analyze sensitivity in the dissolution process of heterogeneous carbonate rocks [27]. Qi et al. noted that high reservoir heterogeneity leads to the selective dissolution of larger pores, resulting in wormhole formation [28]. Ferreira et al. used actual porosity and permeability fields to simulate real carbonate reservoirs and predict wormhole path evolution due to acidizing [28]. Schwalbert et al. analyzed the number of wormholes propagating radially and spherically in isotropic and anisotropic carbonate reservoirs [29]. As the temperature increases, the chemical reaction rate of acid–rock accelerates, leading to a faster consumption rate of the acid. A study using the TSC model combined with heat transfer modeling investigated the impact of temperature on wormholes during the acidizing dissolution process. It was found that injecting cooler acid at an appropriate rate improves acidizing efficiency [30]. Additionally, the effect of reaction temperature on acidizing efficiency becomes more significant at higher acid injection rates, with the optimal injection rate increasing as the temperature rises [31].
In summary, there is no clear and explicit discussion on the effects of different heterogeneity intensities on the development patterns and breakthrough morphology of wormholes, and the process parameters of acidizing in heterogeneous research. Specifically, clarifying the impact of heterogeneous strength on optimal acidification process parameters can help improve acidification efficiency and reduce costs. Therefore, it is necessary to conduct research on these three points.
We implanted the TSC model into the software FMOT* (https://github.com/FMOTs/FMOT_matlab (accessed on 11 October 2024)) developed by Chang [32,33] and conducted research. We evaluated the impact of heterogeneity on the development pattern, final morphology of wormholes, and the process parameters of acidizing.

2. Mathematical Models

In this section, we introduce the Two-Scale Continuum model with the temperature–chemical coupling used in this paper. The mathematical model of acidizing consists of five equations: (1) pressure equation, (2) velocity equation, (3) H+ concentration equation, (4) acid temperature equation, and (5) rock equation.
(1)
Pressure equation:
Acid is assumed to be an incompressible fluid, so the pressure equation is [32,33]
· ( K λ P ) = Q
where K, λ , and P are the permeability, mobility, and pressure field, respectively.
(2)
Velocity equation [10]:
The velocity equation is derived from Darcy’s law:
U = K λ P
where U is the velocity field.
(3)
H+ concentration:
Based on the TSC model, the equation for the transport of H+ within rock pores is [10,32,33]
ϕ C f t + · ( U C f ) = · ( ϕ D e · C f ) R ( C s ) a v reaction consumption
where ϕ , C f , D e , R ( C s ) , and a v are the porosity, cup-mixing mass concentration of H + , effective dispersion tensor for H + , rate of disappearance of H + , and interfacial area of the matrix, respectively.
(4)
Acid temperature equation [32,33]:
The fluid in pores and the rock are considered to be dynamic heat transfer processes; therefore, acid and rock have separate temperature equations. We first introduce the temperature equation of the acid:
ϕ ρ l C p , l T l t + · ( U i ρ l C p , l T l ) = · ( ϕ k l T l ) + H m a v ( T r T l )
where ρ l , C p , l , T l , k l   H m , and T r are the density of acid, specific heat capacity of acid, acid temperature field, acid conductivity, convective heat transfer coefficient, and rock temperature field, respectively.
(5)
Rock equation:
The heat transfer between rock and acid is a thermal conduction process; therefore, there is no convective term. Furthermore, acid dissolves rock and releases heat, so the rock equation is as follows [32,33]:
( 1 ϕ ) ρ r C p , r T r t = · ( ( 1 ϕ ) k r T r ) H m a v ( T r T l ) Δ H r ( T r ) a v R ( C s ) chemical reaction heat
where ρ r , C p , r , k r and H r ( T r ) are the density of rock, specific heat capacity of rock, rock conductivity, and acid–rock molar reaction heat, respectively.
(6)
Chemical reaction:
We explain the calculation formulas for the chemical reactions and related physical quantities involved in Equations (3) and (5). Equation (6) is the chemical reaction equation used in the acidizing process. We assume this reaction only occurs at the fluid–solid surface:
2 H + + CaCO 3 ( s ) r s Ca 2 + + H 2 O + CO 2 ( g )
where r s denotes the reaction rate on the interfacial surface of the matrix. The HCL-CaCO3 reaction is approximated as an irreversible first-order reaction. Hence, the formula for calculating the chemical reaction terms is
R ( C s ) = k c k s k c + k s C f k s = 0.015 e x p ( 18,616 / R T ) C f 1.1997 k c = S h + 0.7 m 1 / 2 Re p 1 / 2 S c 1 / 3 D m 2 r p
where k c , k s , R, S h , m, R e p , Sc, and r p are the mass transfer coefficient, reaction rate constant, gas constant, asymptotic Sherwood number, ratio of the pore length to pore diameter, pore Reynolds number, Schmidt number, and average pore radius.
(7)
Quantity update:
The dissolution of rock by acid can increase the porosity of rock, while the permeability (K) and interfacial area of matrix( a v ) will also change accordingly. Therefore, in addition to the governing equations, updated formulas for physical quantities are also needed. The change in porosity with the time step advance can use
ϕ t = R ( C s ) a v α c ρ s
where a c is the dissolving power of the acid.
After obtaining the new ϕ , the new K can be calculated:
K n e w K i n i t = ϕ n e w ϕ i n i t ϕ n e w ( 1 ϕ i n i t ) ϕ i n i t ( 1 ϕ n e w ) 2 β
where K i n i t and ϕ i n i t are the initial permeability and porosity. Note that this is a fixed value that does not change during the whole calculation process.
The new r p can be calculated by ϕ n e w and K n e w [10]:
r p , n e w r p , i n i t = K n e w ϕ i n i t K i n i t ϕ n e w
The new a v can be calculated by ϕ n e w and r p :
a v , n e w a v , i n i t = ϕ n e w r p , i n i t ϕ i n i t r p , n e w
The D e can be divided into longitudinal and transverse components [10]:
D L e = α o s D m + 2 λ L U r p ϕ D T e = α o s D m + 2 λ T U r p ϕ
where U is the magnitude of velocity. In this paper, D L e and D T e are the effective diffusion coefficients in the x and y directions, respectively. α o s , λ L , and λ T are the constants related to the pore structure.

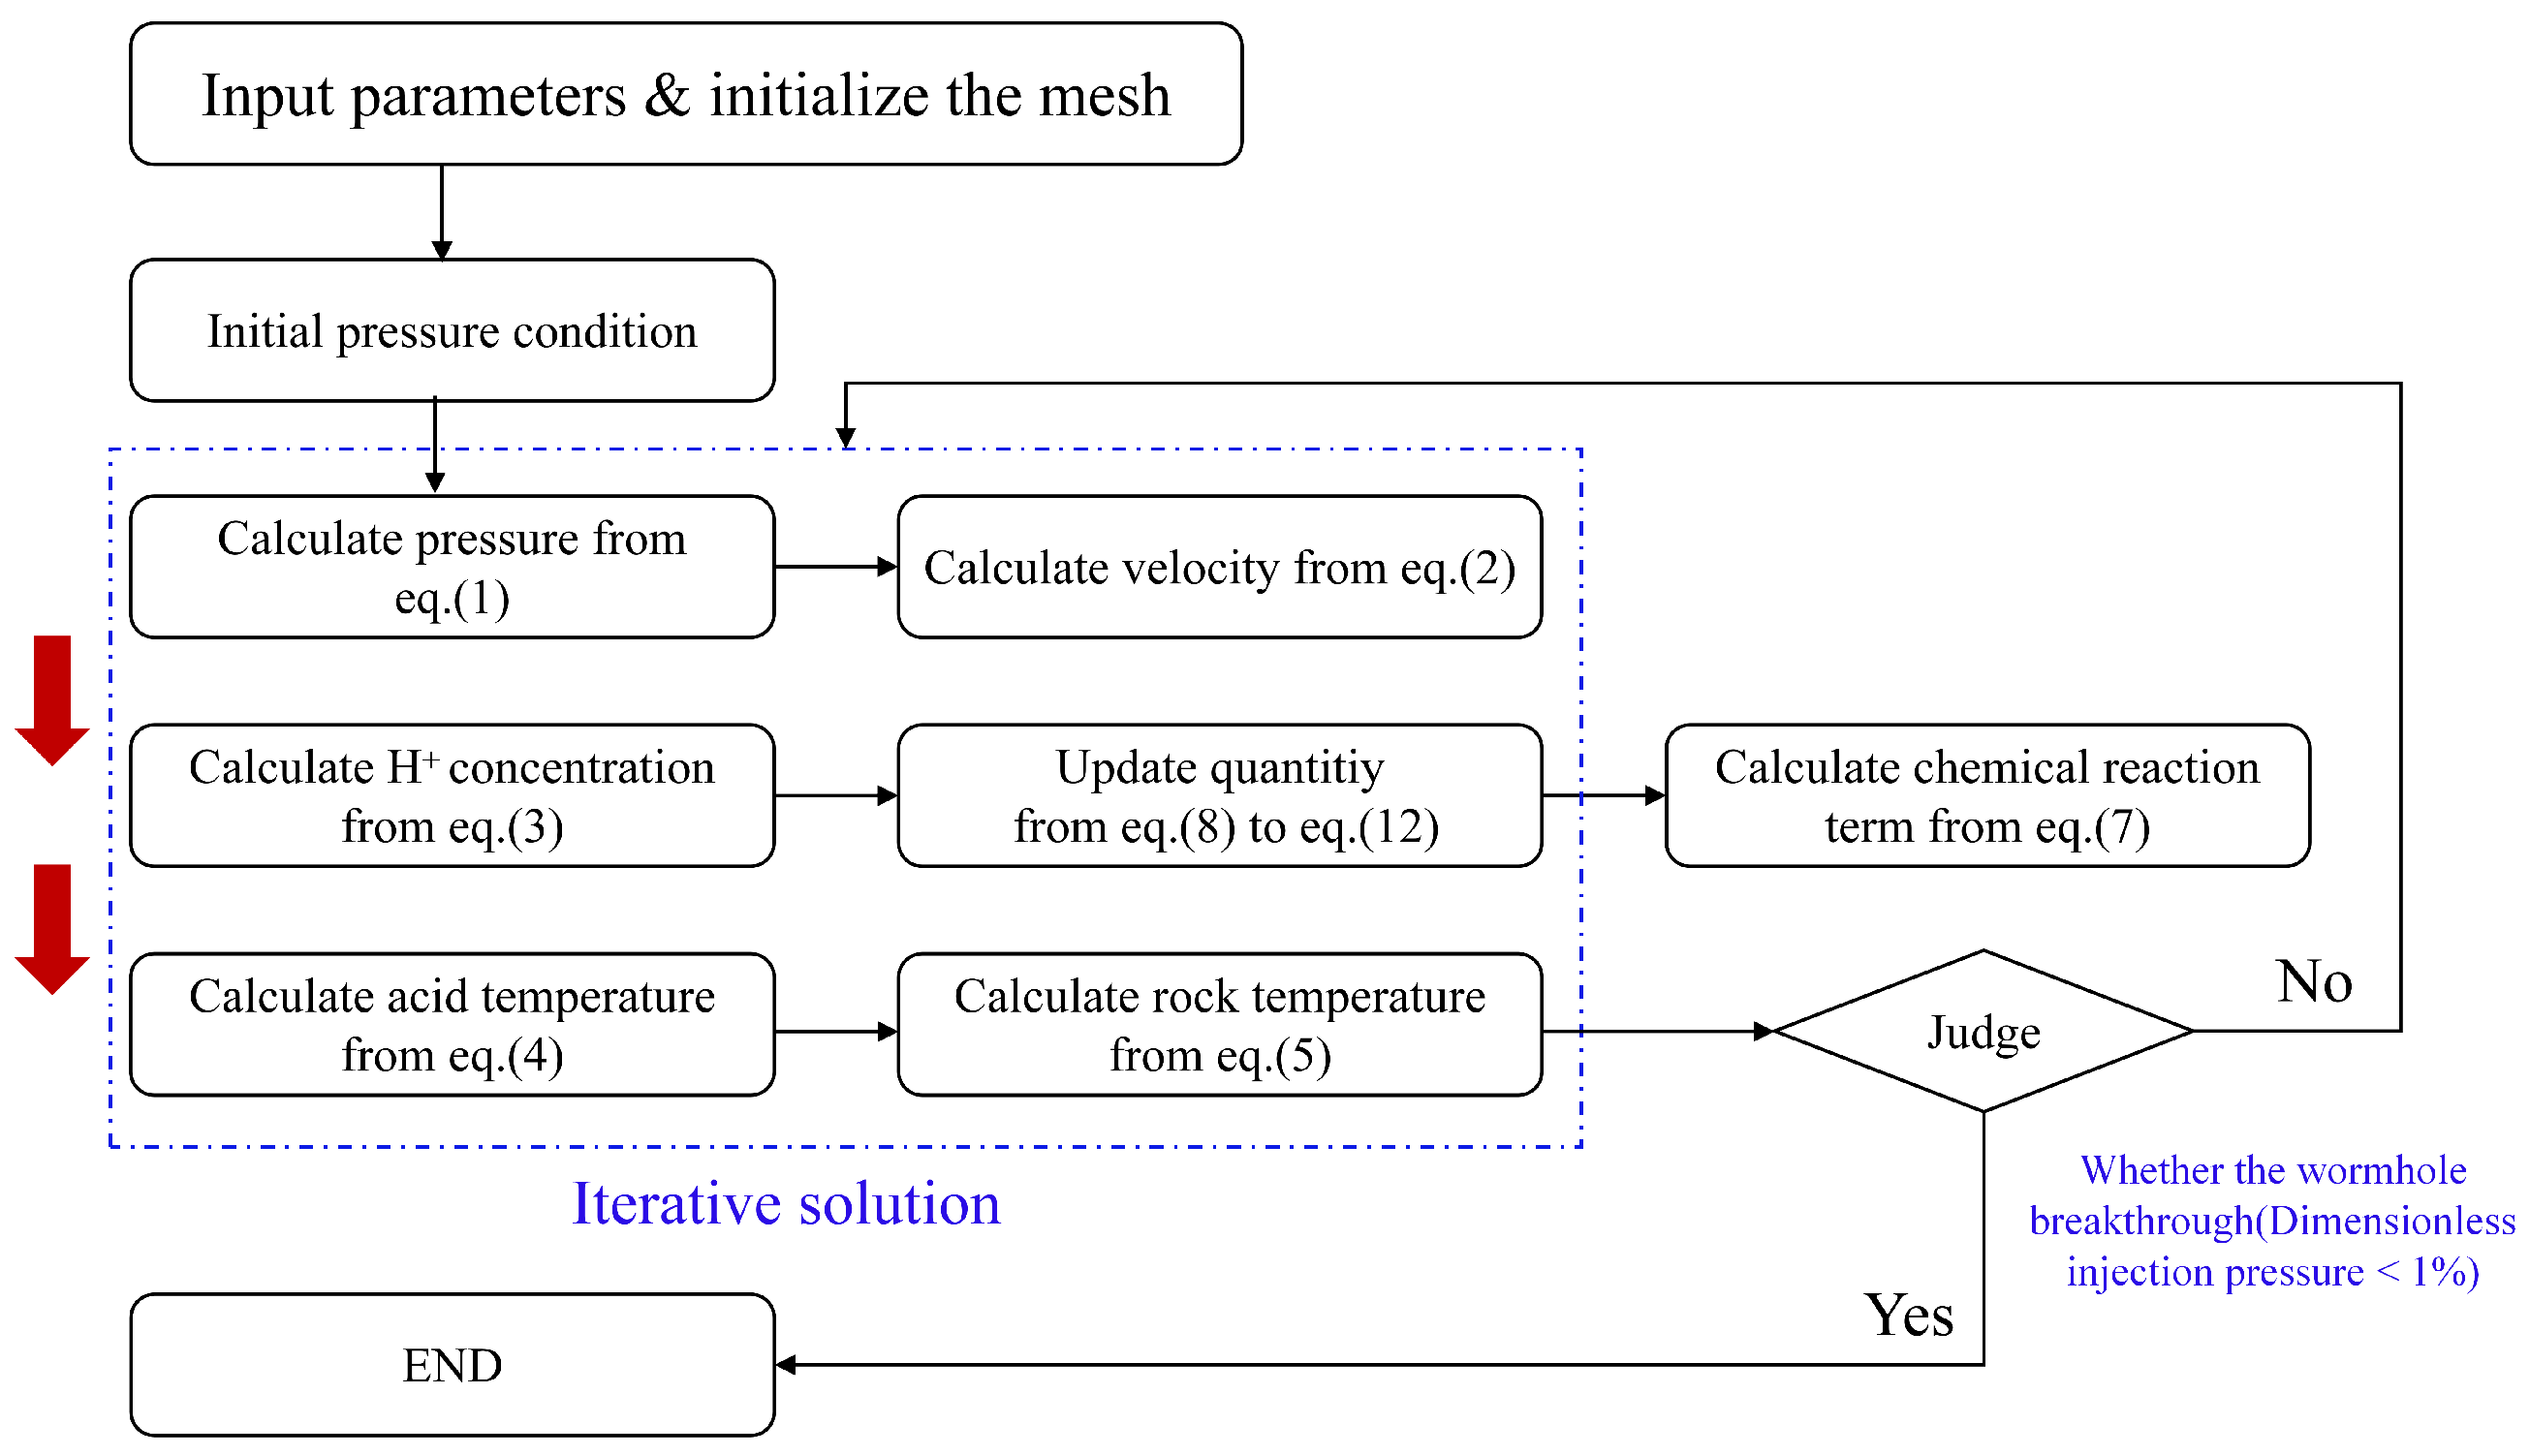
3. Numerical Methods

We use the finite volume method (FVM) to handle Equations (1)–(5). Based on the software FMOT developed by Chang [32,33], we implement the simulation process included in this paper. Next, we introduce the discrete form and calculation process of the equations included in this paper. Note that the verification of the program in this paper can be found in Chang‘s paper.

3.1. Discretization Method

The temporal term uses the Euler backwards scheme, the convective term uses the upwind scheme, and the Laplacian term uses the central differential scheme. Here, we directly provide the algebraic form of Equations (1)–(5). The algebraic pressure equation is
A P P P + A N P N = S u A P = K f λ f | S f | | d | A N = K f λ f | S f | | d | S u = V p Q
and the algebraic H+ concentration equation is
A P C f , P t + Δ t + A N C f , P t + Δ t + A u p C f , P u p , t + Δ t = S u A P = V p ϕ t + Δ t ϕ f t D e , f t | S f | | d | A N = Δ t ϕ f t D e , f t | S f | | d | A u p = Δ t F f t S u = V p ϕ t C f , P t + Δ t V p R ( C s ) a v
and the algebraic acid temperature equation is
A P T P , l t + Δ t + A N T N , l t + Δ t + A u p T P u p , t + Δ t = S u A P = V p ϕ t ρ l t C p , l t + Δ t ϕ f t k l , f t | S f | | d | + Δ t V p H m t a v t A N = Δ t ϕ f t k l , f t | S f | | d | A u p = Δ t F f t S u = V p ϕ t ρ l t C p , l t T P , l t + Δ t V p H m t a v t T r t
and the algebraic rock temperature equation is
A P T P , r t + Δ t + A N T N , r t + Δ t = S u A P = V p ( 1 ϕ ) t ρ s t C p , s t + Δ t ( 1 ϕ ) f t k s , f t | S f | | d | + Δ t V p H m t a v t A N = Δ t ( 1 ϕ ) f t k s , f t | S f | | d | S u = V p ( 1 ϕ ) t ρ s t C p , s t T P , r t + Δ t V p H m t a v t T l t V p Δ H r ( T ) t a v t k c t k s t k c t + k s t C f t + Δ t
The subscript f in Equations (13)–(16) represents the surface value, which is obtained by interpolating the physical quantities at the centers of two adjacent grids. And F t represents the flux obtained by the upwind scheme.

3.2. Computational Methods and Simulation Parameters

Based on the TSC model, the detailed solving procedure is listed as follows: (1) input parameters and initialize the mesh; (2) initialize pressure field based on the stable formation pressure; (3) calculate the pressure field from Equation (1); (4) calculate the velocity field based on Darcy’s law from Equation (2); (5) calculate the H+ concentration (scalar transport equation) based on the velocity field from Equation (3); (6) update the pore-related parameters based on the H+ concentration from Equation (8) to Equation (12); (7) calculate the acid temperature from Equation (4); (8) calculate the rock temperature field from Equation (5); and (9) if the wormhole breaks through the porous medium, then end the calculation. The numerical simulation flow chart is shown in Figure 1. In addition, the general parameters used in the simulation of this paper are shown in Table 1.

3.3. Initial and Boundary Conditions

Initial condition:
P x , y = 0 C x , y = 0 T r x , y = T r 0
Here, T r 0 is the initial rock temperature.
Pressure boundary condition:
At the inlet, keep the constant flow rate of the acid injection:
U i n x = 0 = k μ P x P x = L = 0 k μ P y y = 0 , y = H = 0
where U i n is the acid injection rate; L is the length of the model; and H is the width of the model.
Boundary condition of the acid concentration:
C x = 0 = C i n C x x = L = 0 C y y = 0 , y = H = 0
where C i n is the concentration of the acid injected at the boundary.
Boundary condition of the acid temperature:
T x = 0 = T i n T x x = L = 0 T y y = 0 , y = H = 0
where T i n is the temperature of the acid injected at the boundary.

4. Results and Discussion

In this section, we first discuss the influence of rock heterogeneity intensity on wormhole morphology. The influence of different intensities of heterogeneity on the optimal injection rate and temperature, two process parameters, is analyzed sequentially.

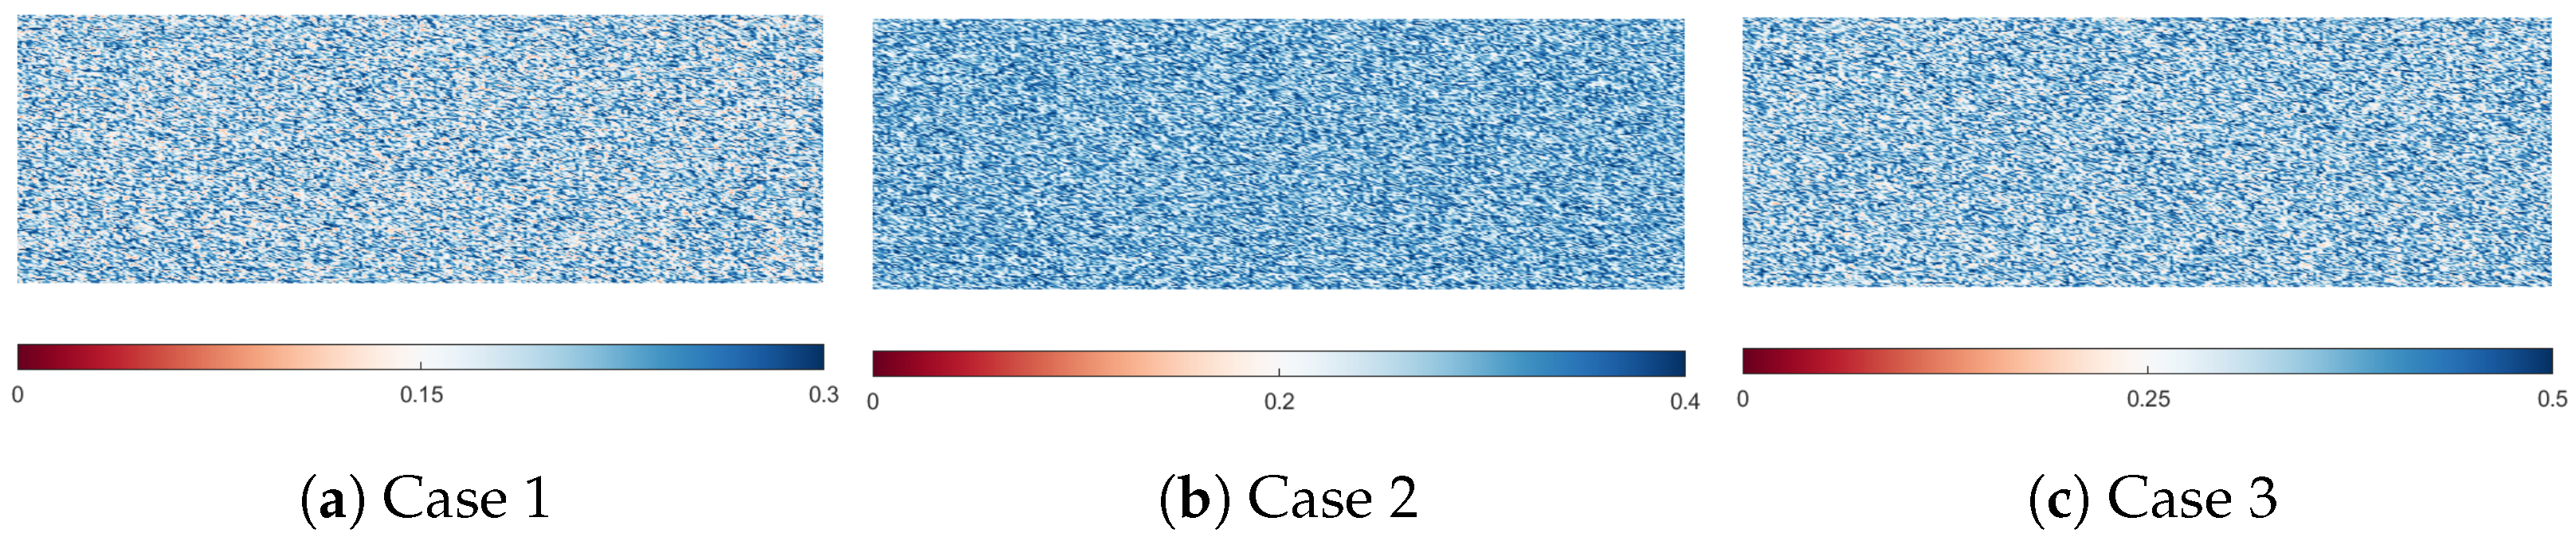
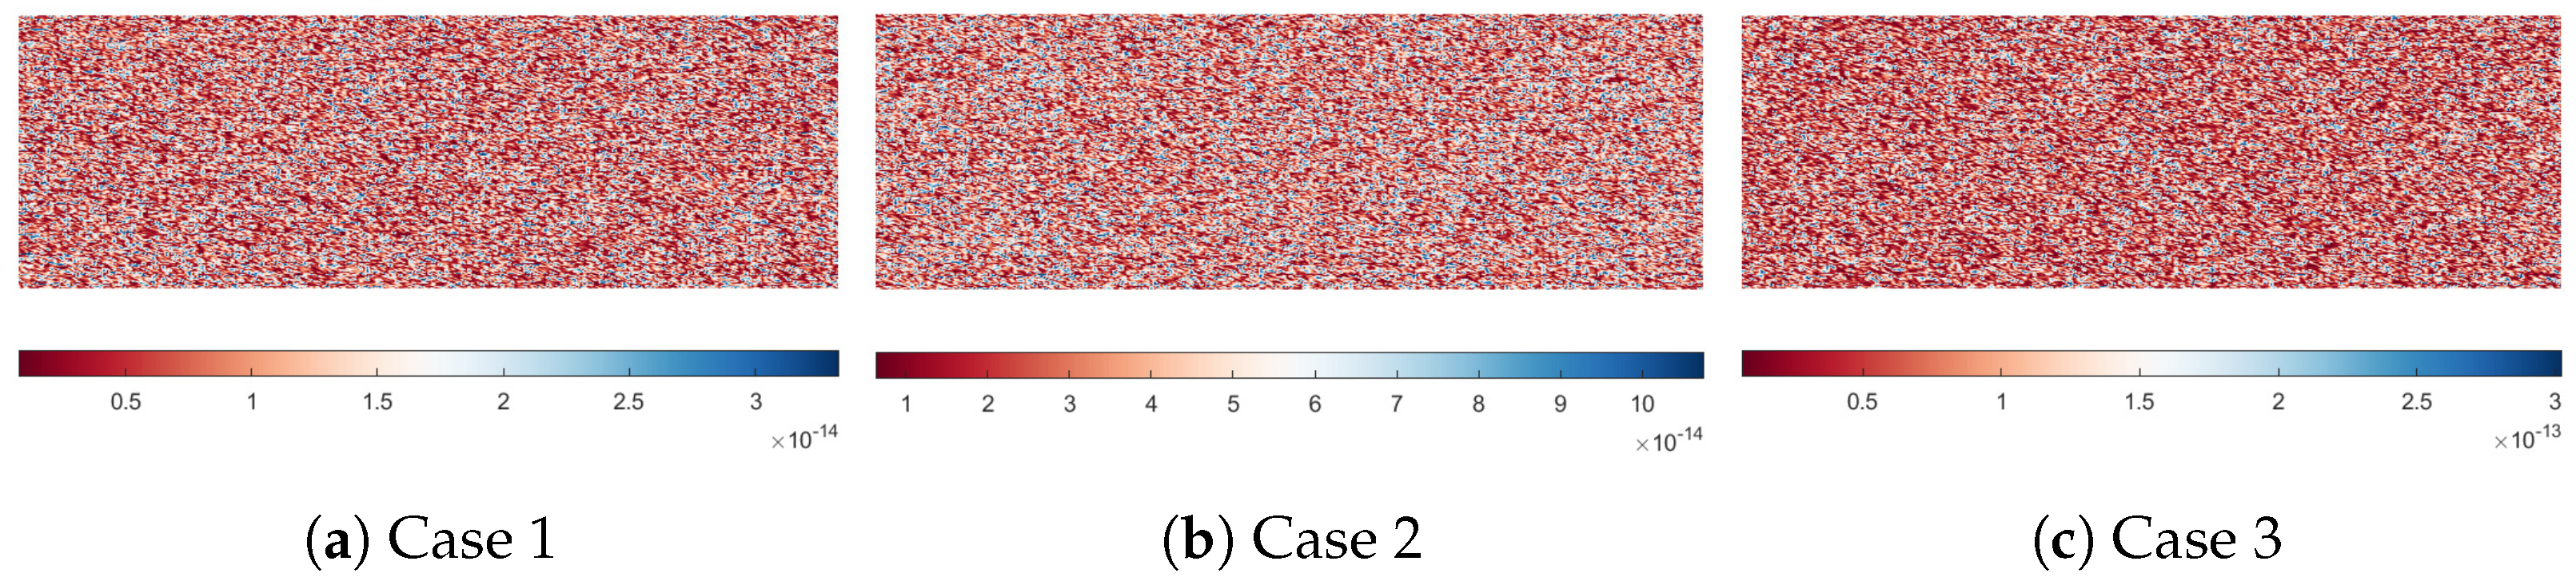
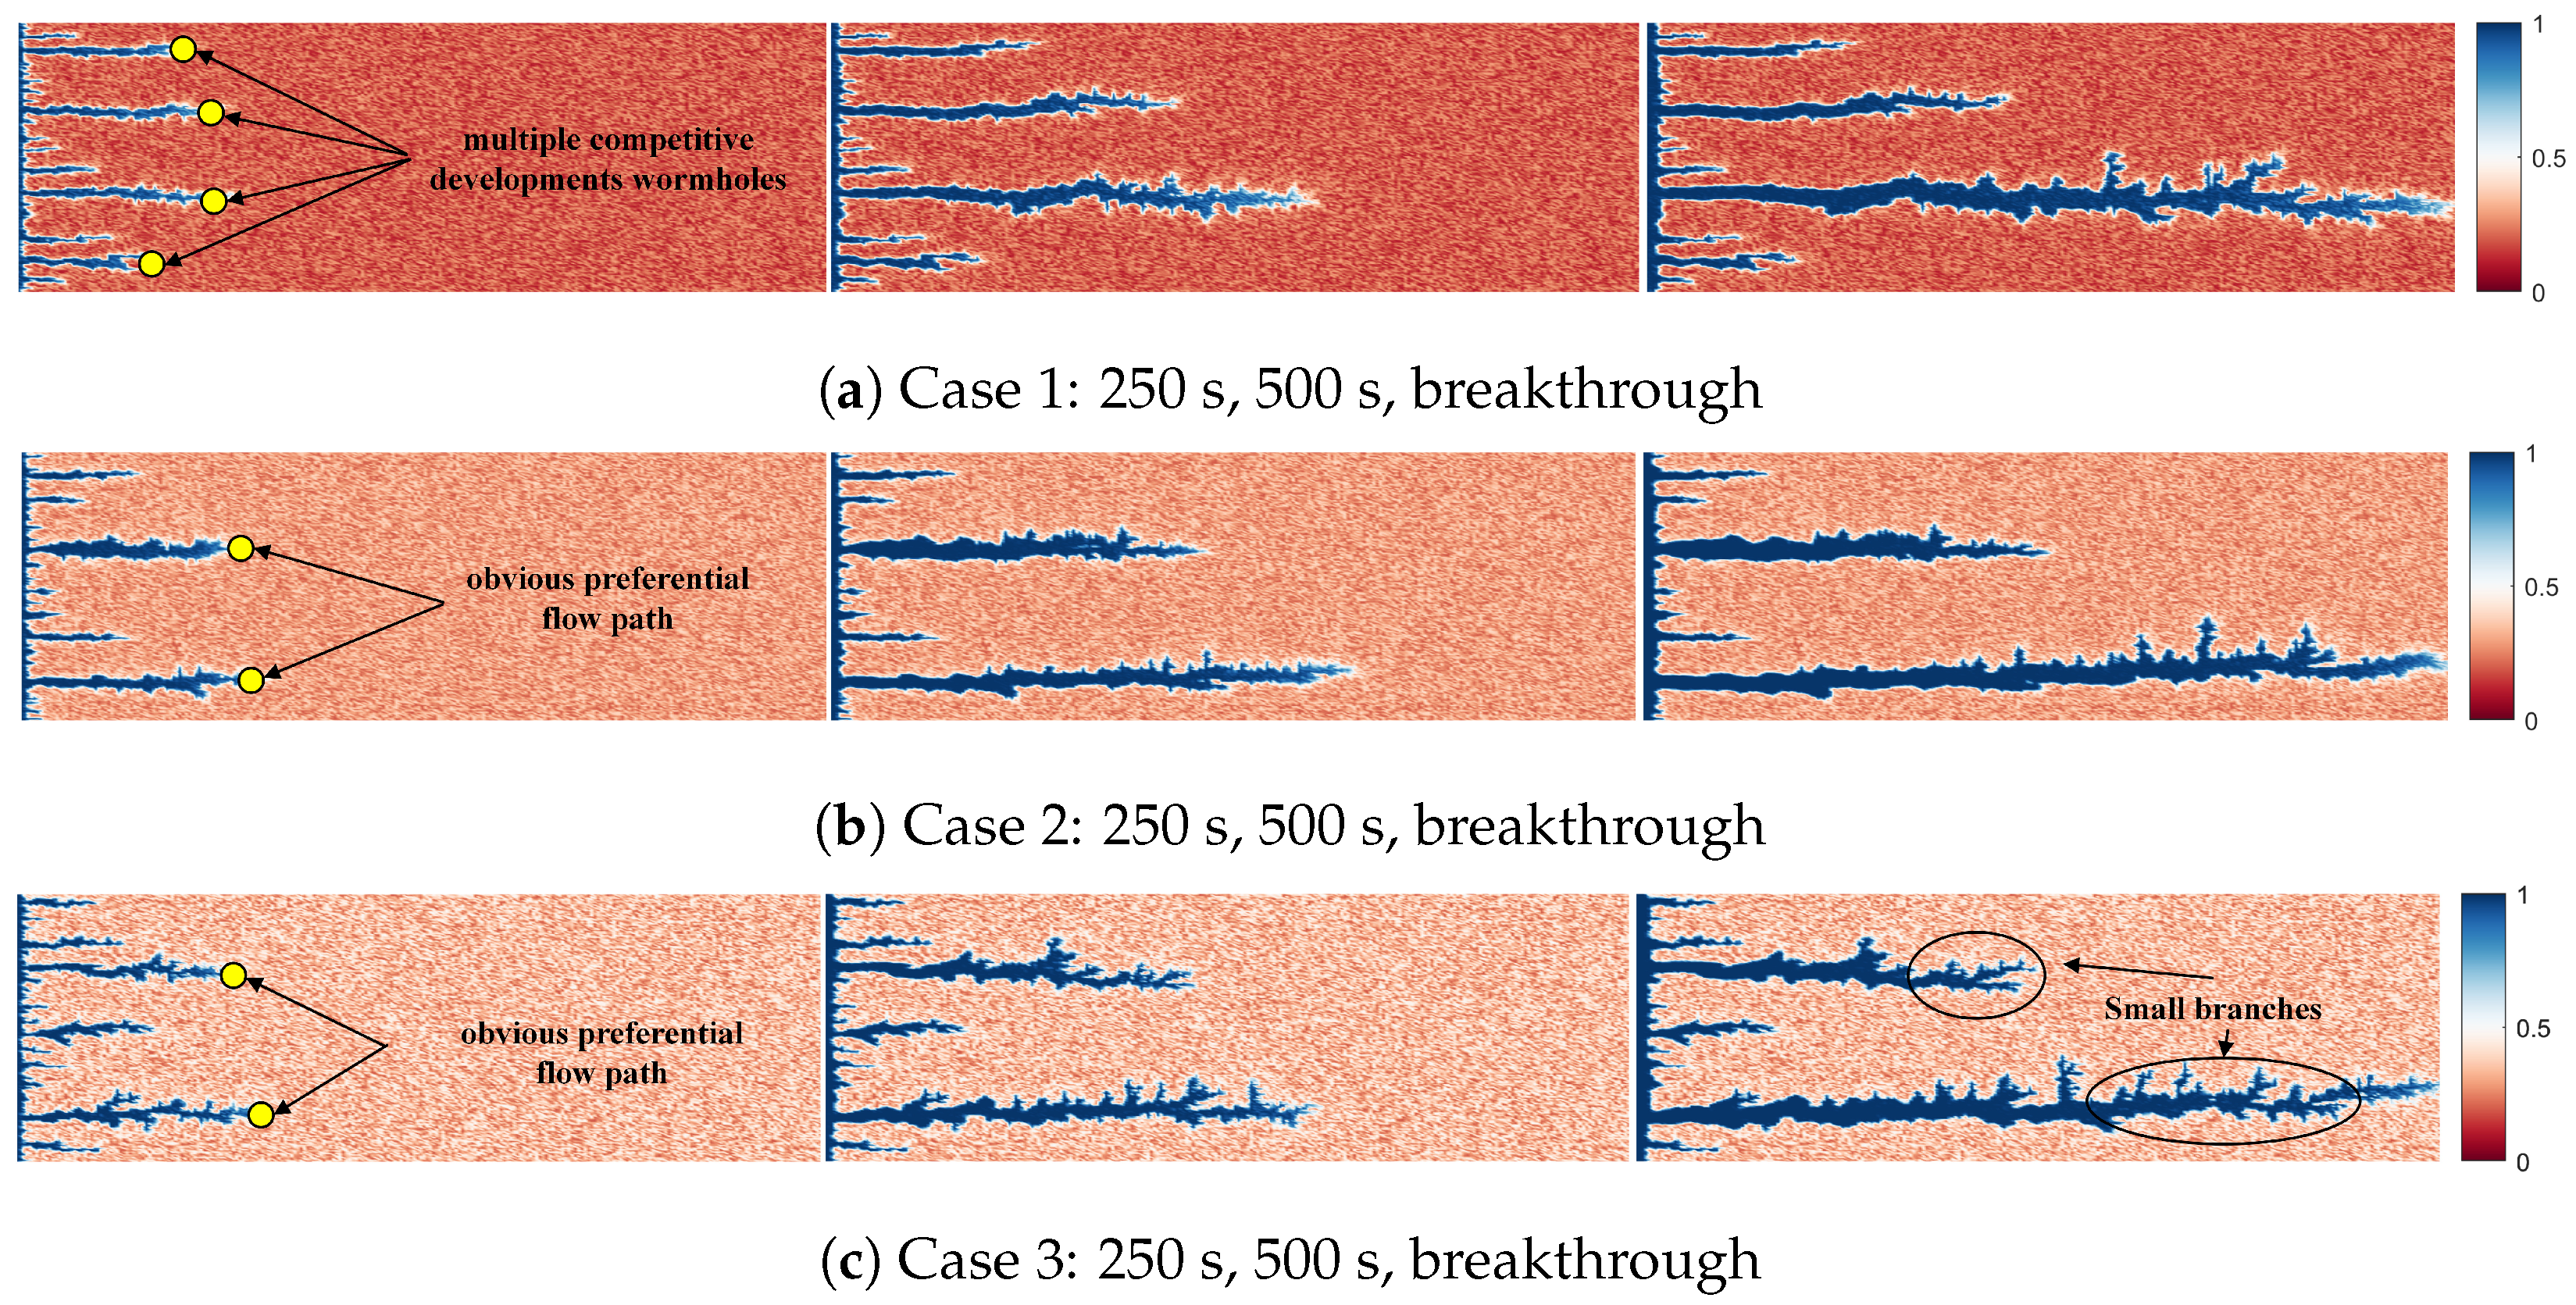
4.1. Effect of Different Heterogeneity Intensity on Wormhole Morphology

Firstly, three cases are established to study the influence of different heterogeneous strengths on the morphology of wormholes. The case parameters are shown in Table 2. The distribution of porosity is shown in Figure 2.
The relationship between porosity and permeability can be calculated using the formula proposed by the Carman–Kozeny relation:
K = 1 72 τ ϕ 3 d p 2 ( 1 ϕ ) 2 ,
where τ is the tortuosity, and d p is a hypothetical pressure drop. The distribution of permeability is shown in Figure 3.
With the change in acid injection rate, five dissolution patterns can be observed in acidizing [34]. Different dissolution patterns arise from the interplay between axial advection, lateral dispersion, and the reaction at the dissolution front. When these processes reach a certain balance, the rate at which acid is transported to the dissolution front via advection and diffusion matches the rate of the acid–rock reaction. As a result, the acid tends to flow preferentially into areas with higher porosity and permeability. This leads to more extensive growth in substrates with greater porosity, ultimately forming narrow channels known as dominant wormholes [10].
Figure 4 shows the wormhole morphology for Cases 1 to 3 when the rock core is broken through. From the development process of the wormholes, it can be seen that the preferential flow path during the initial stage of development of low heterogeneity (Case 1) is not obvious, and multiple competitive developments wormholes appear as shown in Figure 4a. As the intensity in heterogeneity increases, the difference in the resistance to fluid between the pores of the rock also gradually increases. The middle (case 2) and high heterogeneities (Case 3) exhibit a clear preferential flow path in the initial development stage as shown in Figure 4b,c. From the final wormhole morphology, it can be seen that the wormhole morphologies obtained from the three heterogeneous intensities all produce branching wormholes, but there are differences in the morphology of the branching wormholes. The number of branches in Case 1’s wormhole is relatively small, and the wormhole width is relatively large. A large number of small branch wormholes are generated on the main wormholes of Case 2 and Case 3, resembling ’snowflakes’.
Further, we extract the development of wormholes along the breakthrough direction (x) as shown in Figure 5. The increase in porosity of rocks near the acid injection site in Case 1 is significantly higher than in Case 2 and Case 3, and the stronger the heterogeneity, the lower the degree of porosity increase near the inlet. This phenomenon reflects that the stronger the heterogeneity, the more obvious the dominant path, and the more obvious the trend of wormholes developing forward. In the early stage of wormhole development, the fluctuation pattern of Case 1 is different from that of Cases 2 and 3. Case 1 mainly has small-amplitude and large-quantity fluctuations, while Case 2 and Case 3 have larger-amplitude and smaller-quantity fluctuations. Small fluctuations come from competitive development, while large fluctuations come from porosity distribution.
Figure 6 shows the PVBT value of Case 1 to Case 3. As heterogeneity increases, PVBT gradually decreases, and the efficiency of the rock breakthrough becomes faster. This is also due to the fact that the stronger the heterogeneity, the more obvious the preferential flow path becomes.

4.2. Effect of Different Heterogeneity Intensity on the Breakthrough Curve

Next, we research the effect of different heterogeneity intensity on the breakthrough curve. The case parameters are shown in Table 3.
As shown in Figure 7, the acid injection rate corresponding to the lowest point on the curve is defined as the optimal injection rate, which holds critical significance in field acidizing operations [31]. Studies have revealed that heterogeneity intensity does not significantly affect the optimal injection rate. The optimal injection rate remains consistent at 0.0005 m/s across all three cases examined. This is primarily due to the fact that the optimal injection rate is predominantly influenced by the acid–mineral system, while the impact of heterogeneity is minimal. This finding aligns with the research outcomes obtained by Jia et al. [35]. As heterogeneity intensity increases, the curve exhibits an overall downward trend, with a gradually decreasing rate of decline. Notably, the transition from low to middle heterogeneity intensity has a particularly significant effect on reduction, especially under conditions of low injection rates.

4.3. Effect of Different Inject Temperature on the Breakthrough Curve

Finally, we research effect of different inject temperatures on the breakthrough curve. The case parameters are shown in Table 4.
Figure 8 illustrates the wormhole breakthrough curves for porous media with low, middle, and high heterogeneity intensities at different acid injection temperatures. From Figure 8a–c, it can be observed that the optimal injection rate increases with the increase in acid injection temperature. The acid injection temperature influences the convective heat transfer, thus altering the rock temperature and subsequently affecting the initial rate of the acid–rock reaction. As the inject temperature increases, the rate of the acid–rock reaction increases, leading to a higher flux per unit time within the wormholes and consequently increasing the optimal injection rate. Notably, under high-heterogeneity conditions, the optimal injection rate increases more significantly with the increase in the inject temperature as shown in Figure 8c. Additionally, although there are typically increases with the rise in inject temperature, this trend reverses under high injection rates, in line with the findings of Kalia and Glasbergen [36]. In particular, with the increase in heterogeneity intensity, the effect of high inject temperature reducing under high injection rates becomes more pronounced as shown in Figure 8a,c. This implies that in environments with high heterogeneity intensity and high temperatures, injecting colder acid helps to enhance acidizing efficiency. However, this optimization is significantly realized under conditions of achieving the optimal injection rate.

5. Conclusions

In this work, we developed an acidizing simulation program based on the FMOT of Chang, and discussed the effects of rock heterogeneity intensity on wormhole morphology, optimal acid injection rate, and injection temperature. The main conclusions drawn are as follows:
(1)
The heterogeneity intensity has a significant impact on the development pattern of wormholes, when the heterogeneity intensity is low, the early stage of wormhole development is characterized by competition among multiple wormholes, and as the heterogeneity intensity increases, it gradually shifts to dominant wormhole development.
(2)
The wormhole morphology formed by different heterogeneous intensities during rock breakthrough also varies, mainly reflected in the branching wormholes on the main wormhole. When the heterogeneity intensity is low, the number of branch wormholes is small and the width is large. When the heterogeneity intensity is high, the number of branch wormholes is large, and the width is small.
(3)
The influence mechanism of heterogeneity intensity on the development pattern and morphology of wormholes mainly comes from the stronger heterogeneity, clearer preferential flow path, more obvious trend of acid solution forward development, lower PVBT, and higher acidification efficiency.
(4)
As heterogeneity intensity increases, the curve shows a downward trajectory characterized by a progressively diminishing rate of decline. A significant impact on reduction is particularly pronounced at low injection rates. However, this enhanced heterogeneity does not affect the optimal injection rate.
(5)
The optimal injection rate increases with the increase in the acid injection temperature. Under high heterogeneity conditions, the optimal injection rate increases more significantly with the increase in the inject temperature. Additionally, although there are typically increases with the rise in inject temperature, this trend reverses under high injection rates. This implies that in environments with high heterogeneity intensity and high temperatures, injecting colder acid helps to enhance the acidizing efficiency. This conclusion is only applicable within an appropriate injection rate range.

Author Contributions

Conceptualization, G.Y., X.W. and F.N.; methodology, G.Y., X.W., J.H. and F.N.; software; validation, F.Z. and F.N.; formal analysis, G.Y., X.W. and F.N.; investigation, G.Y., X.W., F.N. and J.H.; resources, G.Y., X.W., F.Z. and F.N.; data curation, G.Y., X.W. and F.N.; writing—original draft preparation, G.Y. and F.N.; writing—review and editing, G.Y., X.W. and F.N.; visualization, G.Y., F.Z. and F.N.; supervision, G.Y.; project administration, G.Y.; funding acquisition, G.Y. All authors have read and agreed to the published version of the manuscript.

Funding

This research received no external funding.

Institutional Review Board Statement

Not applicable.

Informed Consent Statement

Not applicable.

Data Availability Statement

The data presented in this study are available on request from the corresponding author.

Conflicts of Interest

Authors Guobin Yang, Xinwei Wu, Jingtao Hou and Fei Zhou were employed by the company China National Petroleum Corporation. The remaining authors declare that the research was conducted in the absence of any commercial or financial relationships that could be construed as a potential conflict of interest.

References

  1. Lungwitz, B.; Fredd, C.; Brady, M.; Miller, M.; Ali, S.; Hughes, K. Diversion and cleanup studies of viscoelastic surfactant-based self-diverting acid. SPE Prod. Oper. 2007, 22, 121–127. [Google Scholar] [CrossRef]
  2. Tian, H.; Quan, H.; Huang, Z. Investigation on rheological properties and thickening mechanism of a novel thickener based on hydrophobically associating water-soluble polymer during the acid rock reaction. J. Pet. Sci. Eng. 2020, 188, 106895. [Google Scholar] [CrossRef]
  3. Yavuz, H.; Demirdag, S.; Caran, S. Thermal effect on the physical properties of carbonate rocks. Int. J. Rock Mech. Min. Sci. 2010, 47, 94–103. [Google Scholar] [CrossRef]
  4. Murray, R.C. Origin of porosity in carbonate rocks. J. Sediment. Res. 1960, 30, 59–84. [Google Scholar] [CrossRef]
  5. Mostofizadeh, B.; Economides, M. Optimum injection rate from radial acidizing experiments. In Proceedings of the SPE Annual Technical Conference and Exhibition, New Orleans, LA, USA, 25–28 September 1994. [Google Scholar]
  6. Mahmoud, M.A.; Nasr-El-Din, H.A.; De Wolf, C.A.; LePage, J.N. Optimum injection rate of a new chelate that can be used to stimulate carbonate reservoirs. In Proceedings of the SPE Annual Technical Conference and Exhibition, Florence, Italy, 19–22 September 2010. [Google Scholar]
  7. Wang, Y.; Hill, A.D.; Schechter, R.S. The optimum injection rate for matrix acidizing of carbonate formations. In Proceedings of the SPE Annual Technical Conference and Exhibition, Houston, TX, USA, 3–6 October 1993. [Google Scholar]
  8. Zhang, K.; Sang, S.; Liu, C.; Ma, M.; Zhou, X. Experimental study the influences of geochemical reaction on coal structure during the co2 geological storage in deep coal seam. J. Pet. Sci. Eng. 2019, 178, 1006–1017. [Google Scholar] [CrossRef]
  9. Dautriat, J.; Gl, N.; Dimanov, A.; Raphanel, J. Hydromechanical behavior of heterogeneous carbonate rock under proportional triaxial loadings. J. Geophys. Res. Solid Earth 2011, 116, 1–26. [Google Scholar] [CrossRef]
  10. Panga, M.K.; Ziauddin, M.; Balakotaiah, V. Two-scale continuum model for simulation of wormholes in carbonate acidization. AIChE J. 2005, 51, 3231–3248. [Google Scholar] [CrossRef]
  11. Kalia, N.; Balakotaiah, V. Modeling and analysis of wormhole formation in reactive dissolution of carbonate rocks. Chem. Eng. Sci. 2007, 62, 919–928. [Google Scholar] [CrossRef]
  12. Khormali, A.; Ahmadi, S.; Kazemzadeh, Y. Inhibition of barium sulfate precipitation during water injection into oil reservoirs using various scale inhibitors. Arab. J. Sci. Eng. 2023, 48, 9383–9399. [Google Scholar] [CrossRef]
  13. Kalia, N.; Balakotaiah, V. Effect of medium heterogeneities on reactive dissolution of carbonates. Chem. Eng. Sci. 2009, 64, 376–390. [Google Scholar] [CrossRef]
  14. Chierici, G.L. Principles of Petroleum Reservoir Engineering; Springer: Berlin/Heidelberg, Germany, 2012; Volume 2. [Google Scholar]
  15. Hollis, C.; Vahrenkamp, V.; Tull, S.; Mookerjee, A.; Taberner, C.; Huang, Y. Pore system characterisation in heterogeneous carbonates: An alternative approach to widely-used rock-typing methodologies. Mar. Pet. Geol. 2010, 27, 772–793. [Google Scholar] [CrossRef]
  16. Kalia, N.; Glasbergen, G. Wormhole formation in carbonates under varying temperature conditions. In Proceedings of the SPE European Formation Damage Conference and Exhibition, SPE, Scheveningen, The Netherlands, 27–29 May 2009; p. SPE-121803. [Google Scholar]
  17. Liu, M.; Zhang, S.; Mou, J. Effect of normally distributed porosities on dissolution pattern in carbonate acidizing. J. Pet. Sci. Eng. 2012, 94, 28–39. [Google Scholar] [CrossRef]
  18. Zhu, D.; Wang, Y.; Cui, M.; Zhou, F.; Zhang, Y.; Liang, C.; Zou, H.; Yao, F. Effects of spent viscoelastic-surfactant acid flow on wormholes propagation and diverting performance in heterogeneous carbonate reservoir. Energy Rep. 2022, 8, 8321–8332. [Google Scholar] [CrossRef]
  19. Mahmoodi, A.; Javadi, A.; Sola, B.S. Porous media acidizing simulation: New two-phase two-scale continuum modeling approach. J. Pet. Sci. Eng. 2018, 166, 679–692. [Google Scholar] [CrossRef]
  20. Jafarpour, H.; Aghaei, H.; Litvin, V.; Ashena, R. Experimental optimization of a recently developed matrix acid stimulation technology in heterogeneous carbonate reservoirs. J. Pet. Sci. Eng. 2021, 196, 108100. [Google Scholar] [CrossRef]
  21. Bekibayev, T.T.; Beisembetov, I.K.; Assilbekov, B.K.; Zolotukhin, A.B.; Zhapbasbayev, U.K.; Turegeldieva, K.A. Study of the impact of reduced permeability due to near-wellbore damage on the optimal parameters of the matrix acidizing in carbonate rocks. In Proceedings of the SPE Annual Caspian Technical Conference & Exhibition, Baku, Azerbaijan, 4–6 November 2015. [Google Scholar]
  22. Cao, C.; Zhou, F.; Cheng, L.; Liu, S.; Lu, W.; Wang, Q. A comprehensive method for acid diversion performance evaluation in strongly heterogeneous carbonate reservoirs stimulation using ct. J. Pet. Sci. Eng. 2021, 203, 108614. [Google Scholar] [CrossRef]
  23. Dong, R.; Wheeler, M.F.; Su, H.; Ma, K. Modeling acid fracturing treatments in heterogeneous carbonate reservoirs. In Proceedings of the SPE International Conference on Oilfield Chemistry, The Woodlands, TX, USA, 6–7 December 2021. [Google Scholar]
  24. Mou, J.; Liu, M.; Zheng, K.; Zhang, S. Diversion conditions for viscoelastic-surfactant-based self-diversion acid in carbonate acidizing. SPE Prod. Oper. 2015, 30, 121–129. [Google Scholar] [CrossRef]
  25. Liu, C.; Liu, Y.; Kerisit, S.; Zachara, J. Pore-scale process coupling and effective surface reaction rates in heterogeneous subsurface materials. Rev. Mineral. Geochem. 2015, 80, 191–216. [Google Scholar] [CrossRef]
  26. Ghommem, M.; Zhao, W.; Dyer, S.; Qiu, X.; Brady, D. Carbonate acidizing: Modeling, analysis, and characterization of wormhole formation and propagation. J. Pet. Sci. Eng. 2015, 131, 18–33. [Google Scholar] [CrossRef]
  27. Maheshwari, P.; Ratnakar, R.R.; Kalia, N.; Balakotaiah, V. 3-D simulation and analysis of reactive dissolution and wormhole formation in carbonate rocks. Chem. Eng. Sci. 2013, 90, 258–274. [Google Scholar] [CrossRef]
  28. de Paulo, F.L.; Surmas, R.; Tonietto, S.N.; da Silva, M.A.P.; Peçanha, R.P. Modeling reactive flow on carbonates with realistic porosity and permeability fields. Adv. Water Resour. 2020, 139, 103564. [Google Scholar] [CrossRef]
  29. Schwalbert, M.P.; Zhu, D.; Hill, A.D. Extension of an empirical wormhole model for carbonate matrix acidizing through two-scale continuum 3d simulations. In Proceedings of the SPE Europec Featured at 79th EAGE Conference and Exhibition, Paris, France, 12–15 June 2017. [Google Scholar]
  30. Liu, P.; Yao, J.; Couples, G.D.; Huang, Z.; Sun, H.; Ma, J. Numerical modelling and analysis of reactive flow and wormhole formation in fractured carbonate rocks. Chem. Eng. Sci. 2017, 172, 143–157. [Google Scholar] [CrossRef]
  31. Li, Y.; Mo, W.; Jiang, Y.; Chang, T. Influence of fractures and heat transmission on wormhole propagation in fractured carbonate rocks. Geoenergy Sci. Eng. 2024, 239, 212916. [Google Scholar] [CrossRef]
  32. Chang, T.; Jiang, Y.; Li, Y.; Chen, X.; Kang, X.; Mo, W. Study on the effect of natural fractures and temperature on the wormhole morphology formed by two-phase acidizing in carbonate rocks. Phys. Fluids 2024, 36, 083333. [Google Scholar] [CrossRef]
  33. Chang, T.; Jiang, Y.; Zhao, H.; Chen, X.; Mo, W. Effect of two-phase viscosity difference and natural fractures on the wormhole morphology formed by two-phase acidizing with self-diverting acid in carbonate rocks. Phys. Fluids 2024, 36, 093623. [Google Scholar] [CrossRef]
  34. Mo, W.; Jiang, Y.; Li, Y.; Chang, T.; Liu, K. Non-isothermal simulation of wormhole propagation in fractured carbonate rocks based on 3d-edfm. Geoenergy Sci. Eng. 2024, 244, 213453. [Google Scholar] [CrossRef]
  35. Jia, C.; Alkaabi, S.; Hu, J.; Sepehrnoori, K.; Yao, J.; Zhang, L. Impact of rock heterogeneity on reactive flow during acid stimulation process. Int. J. Heat Mass Transf. 2024, 227, 125560. [Google Scholar] [CrossRef]
  36. Kalia, N.; Glasbergen, G. Fluid temperature as a design parameter in carbonate matrix acidizing. In Proceedings of the SPE Production and Operations Conference and Exhibition, Tunis, Tunisia, 8–10 June 2010. [Google Scholar]
Figure 1. Flowchart.
Processes 12 02740 g001
Figure 2. Porosity of Case 1 to Case 3.
Processes 12 02740 g002
Figure 3. Permeability of Case 1 to Case 3.
Processes 12 02740 g003
Figure 4. Wormhole morphology of Case 1 to Case 3.
Processes 12 02740 g004
Figure 5. Porosity enhancement curve along the breakthrough direction (X).
Processes 12 02740 g005
Figure 6. Comparison of PVBT of Case 1 to Case 3.
Processes 12 02740 g006
Figure 7. Effect of different heterogeneity intensity on the breakthrough curve.
Processes 12 02740 g007
Figure 8. The breakthrough curve of Case 7 to Case 15.
Processes 12 02740 g008
Table 1. General parameters of simulation cases.
ParameterSymbolValue
Core length [m]L0.3
Core diameter [H]H0.1
Acid injection concentration [kmol/m3] C f , i n 4.4178 (15wt%HCL)
Acid injection velocity [m/s] U i n 1–1 × 10 3 cm/s
Initial porosity of matrix [dimLess] ϕ 0.01–0.5
Initial permeability of matrix [m2]KCalculated
Viscosity of acid at 20 °C [mPa·s] μ w 1
Acid specific heat capacity at 20 °C [J/(kg·°C)] C p , l 4180
Rock specific heat capacity [J/(kg·°C)] C p , r 999
Acid thermal conductivity at 20 °C [W/(m·°C)] k l 0.6508
Solubility of acid [kg/kmol] a c 50
Rock thermal conductivity [W/(m·°C)] k r 5.2
Interfacial area of matrix [m2/m3] a v 5000
Molecular diffusion coefficient [m2/s] D e 3.6 × 10 9
Solubility of acid [kg/kmol] a c 50
Rock convective heat transfer coefficient [W/(m2·°C)] H m 600
Table 2. Parameters of Case 1 to Case 3.
ParameterSymbolCase 1Case 2Case 3
Porosity [dimLess] ϕ 0.1–0.30.05–0.40.01–0.5
Inject temperature [°C] T i n j e c t 333.15
Inject velocity [m/s] U i n 5 × 10 4
Table 3. Parameters of Case 4 to Case 6.
ParameterSymbolCase 4Case 5Case 6
Porosity [dimLess] ϕ 0.1–0.30.05–0.40.01–0.5
Inject temperature [°C] T i n j e c t 333.15
Inject velocity [m/s] U i n 5 × 10 5 1 × 10 2
Table 4. Parameters of Case 7 to Case 15.
ParameterSymbolCase 7Case 8Case 9
Porosity [dimLess] ϕ 0.1–0.3
Inject temperature [°C] T i n j e c t 293.15333.15373.15
Inject velocity [m/s] U i n 5 × 10 5 1 × 10 2
ParameterSymbolCase 10Case 11Case 12
Porosity [dimLess] ϕ 0.05–0.4
Inject temperature [°C] T i n j e c t 293.15333.15373.15
Inject velocity [m/s] U i n 5 × 10 5 1 × 10 2
ParameterSymbolCase 13Case 14Case 15
Porosity [dimLess] ϕ 0.01–0.5
Inject temperature [°C] T i n j e c t 293.15333.15373.15
Inject velocity [m/s] U i n 5 × 10 5 1 × 10 2
Disclaimer/Publisher’s Note: The statements, opinions and data contained in all publications are solely those of the individual author(s) and contributor(s) and not of MDPI and/or the editor(s). MDPI and/or the editor(s) disclaim responsibility for any injury to people or property resulting from any ideas, methods, instructions or products referred to in the content.

