
The Evaluation Method of the Power Supply Capability of an Active Distribution Network Considering Demand Response

Abstract
1. Introduction
2. Methodology
2.1. Evaluation Model of PSC Considering DR
2.1.1. Modeling of Incentive-Based DR
2.1.2. Modeling of PSC Considering DR
- The proposed TSC curve model considers both N-0 and N-1 security constraints, which is suitable for evaluating the complete PSC of active distribution networks accounting for N-1 contingencies. In contrast, the TSC curve model presented in [25] only considers N-0 security constraints and is not applicable to N-1 contingency scenarios. The TSC curve model proposed in [26] accounts for N-1 security constraints but does not consider DG and is therefore applicable only to traditional passive distribution networks, not to active distribution networks.
2.2. Evaluation Algorithm of PSC Considering DR
3. Results and Discussion
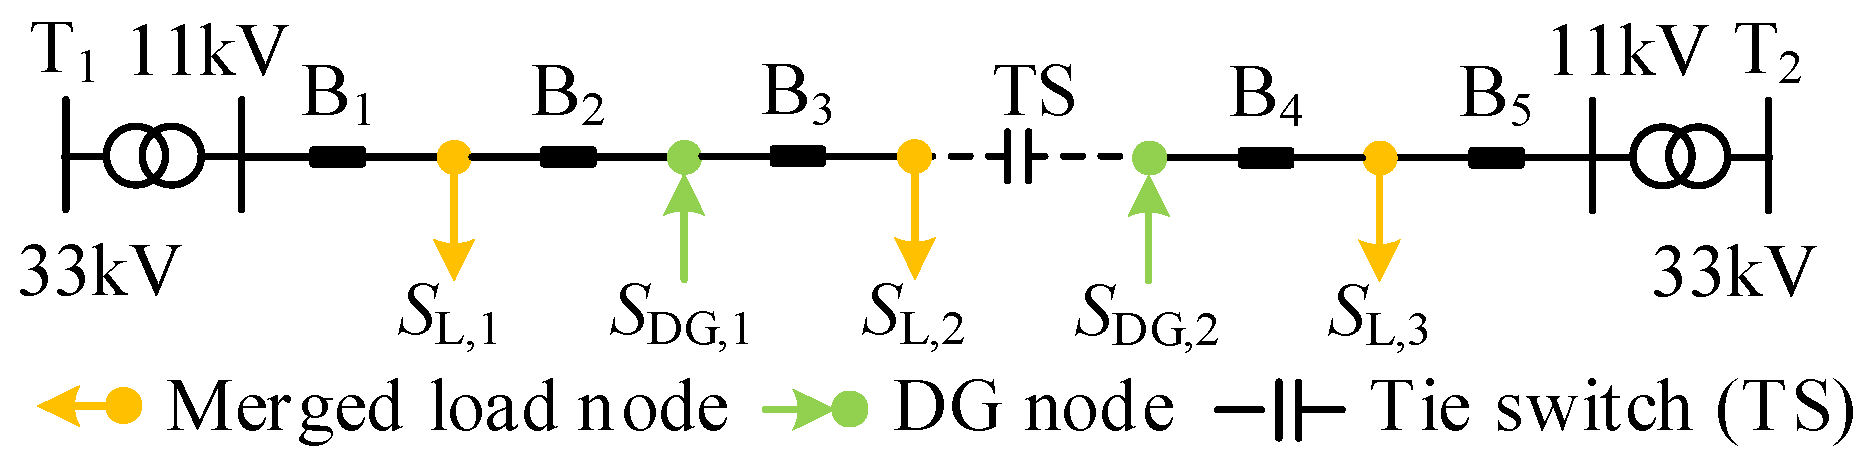
3.1. Case Overview
3.2. PSC Evaluation Process and Results
3.2.1. Implementation of Proposed Model
3.2.2. Simulation Calculation Process and Results
3.3. Analysis of the Influence of DR on PSC
3.3.1. TSC Curve Indices Under Different Load Reduction Coefficients
3.3.2. TSC Curve Under Different Load Reduction Coefficients
3.4. Enhancement Measures for PSC
- (1)
- Measure 1: increase the load reduction coefficient within a certain range, as affects load distribution and subsequently influences the TSC curve.
- (2)
- Measure 2: expand the capacity of the bottleneck component, as its capacity represents a critical factor in constraining the TSC curve.
- (1)
- Measure 1 significantly enhances the maximum PSC (i.e., TSC) when the load reduction coefficient increases in DR. This measure is particularly applicable in scenarios where incentive policies promote an increase in the load reduction coefficient at specific nodes through DR.
- (2)
- Measure 2 effectively enhances the overall TSC curve by addressing specific bottleneck components without necessitating substantial additional investment in capacity expansion. This measure is particularly suited to distribution network upgrade projects involving the replacement of components.
3.5. IEEE RBTS BUS4 Case Verification
4. Conclusions
- (1)
- The proposed PSC evaluation model considering incentive-based DR effectively describes the complete PSC of active distribution networks considering both N-1 security and DR.
- (2)
- The proposed PSC evaluation algorithm based on uniform state-space sampling visualizes the complete PSC of active distribution networks considering DR as a TSC curve and quantifies it as an interval value rather than a single TSC value. For instance, the complete PSC for CASE1 is quantified within the range of [4.0, 8.4] MVA, whereas for CASE2, it is quantified within the range of [17.0, 33.0] MVA.
- (3)
- The influence law and mechanism of the load reduction coefficient in DR on PSC are revealed. As the load reduction coefficient λ increases, the TSC first increases and then remains constant. For instance, as λ increases from 0 to 1.0, the TSC for CASE1 first increases linearly from 8.0 MVA to 10.0 MVA, then remains constant at 10.0 MVA.
- (4)
- The two proposed measures of increasing the load reduction coefficient and expanding the capacity of bottleneck components can effectively enhance the PSC of active distribution networks. For instance, as λ increases from 0.1 to 0.5, the TSC and average PSC of CASE1 increase by 2.0 MVA and 0.59 MVA, respectively. Similarly, as the capacity of bottleneck components expands from 4.0 MVA to 5.0 MVA, the TSC, average PSC, and minimum PSC of CASE1 increase by 1.4 MVA, 1.02 MVA, and 1.0 MVA, respectively.
Author Contributions
Funding
Data Availability Statement
Conflicts of Interest
Acronym
| Symbol | Full form | Meaning |
| PSC | Power supply capability | The total load of the secure boundary point. |
| TSC | Total supply capability | The maximum load that a distribution network can serve under a given security criterion, i.e., maximum PSC. |
| TSC curve | Total supply capability curve | A curve formed by the total load of all secure boundary points with criticality. |
| DR | Demand response | A mechanism that enables consumers to adjust their electricity consumption in response to external signals to help balance supply and demand in the energy grid. |
| DG | Distributed generation | The generation of electricity from multiple, small-scale energy sources located close to the point of consumption, which can be connected to the grid or operate independently (off-grid). |
| TS | Tie switch | An electrical device used to link different parts of a power network, enabling the transfer of electrical power between them. |
References
- Hao, J.; Feng, X.; Chen, X.; Jin, X.; Wang, X.; Hao, T.; Hong, F.; Du, X. Optimal scheduling of active distribution network considering symmetric heat and power source-load spatial-temporal characteristics. Appl. Energy 2024, 373, 123974. [Google Scholar] [CrossRef]
- Yan, R.; Yuan, Y.; Wang, Z.; Geng, G.; Jiang, Q. Active distribution system synthesis via unbalanced graph generative adversarial network. IEEE Trans. Power Syst. 2023, 38, 4293–4307. [Google Scholar] [CrossRef]
- Sharma, S.; Niazi, K.; Verma, K.; Rawat, T. Coordination of different DGs, BESS and demand response for multi-objective optimization of distribution network with special reference to Indian power sector. Int. J. Electr. Power Energy Syst. 2020, 121, 106074. [Google Scholar] [CrossRef]
- Rawat, T.; Niazi, K.; Gupta, N.; Sharma, S. Impact assessment of electric vehicle charging/discharging strategies on the operation management of grid accessible and remote microgrids. Int. J. Energy Res. 2019, 43, 9034–9048. [Google Scholar] [CrossRef]
- Rawat, T.; Niazi, K.; Gupta, N.; Sharma, S. Multi-objective techno-economic operation of smart distribution network integrated with reactive power support of battery storage systems. Sustain. Cities Soc. 2021, 75, 103359. [Google Scholar] [CrossRef]
- Rawat, T.; Niazi, K.; Gupta, N.; Sharma, S. A linearized multi-objective Bi-level approach for operation of smart distribution systems encompassing demand response. Energy 2022, 238, 121991. [Google Scholar] [CrossRef]
- Rawat, T.; Niazi, K. Impact of EV charging/discharging strategies on the optimal operation of islanded microgrid. J. Eng. 2019, 2019, 4819–4823. [Google Scholar] [CrossRef]
- Koirala, A.; Acker, T.; Hashmi, M.; D’hulst, R.; Van Hertem, D. Chance-constrained optimization based PV hosting capacity calculation using general Polynomial Chaos. IEEE Trans. Power Syst. 2024, 39, 2284–2295. [Google Scholar] [CrossRef]
- Lee, K.; Zhao, P.; Bhattacharya, A.; Mallick, B.; Xie, L. An active learning-based approach for hosting capacity analysis in distribution systems. IEEE Trans. Smart Grid 2024, 15, 617–626. [Google Scholar] [CrossRef]
- Zhang, Z.; Hui, H.; Song, Y. Response capacity allocation of air conditioners for peak-valley regulation considering interaction with surrounding microclimate. IEEE Trans. Smart Grid 2024. early access. [Google Scholar] [CrossRef]
- Xiao, J.; Zhang, T.; Zu, G.; Li, F.; Wang, C. TSC-based method to enhance asset utilization of interconnected distribution systems. IEEE Trans. Smart Grid 2018, 9, 1718–1727. [Google Scholar] [CrossRef]
- Liu, H.; Cao, Y.; Ge, S.; Xu, Z.; Gu, C.; He, X. Load carrying capability of regional electricity-heat energy systems: Definitions, characteristics, and optimal value evaluation. Appl. Energy 2022, 310, 118586. [Google Scholar] [CrossRef]
- Tyagi, A.; Verma, Y.; Bijwe, P. Loadability assessment and enhancement in unbalanced distribution systems. CSEE J. Power Energy Syst. 2018, 4, 524–532. [Google Scholar] [CrossRef]
- Qu, Y.; Xiao, J.; Zu, G. Security region and power supply capability for distribution system under normal operational state: Definition, model, and application. CSEE J. Power Energy Syst. 2024. early access. [Google Scholar] [CrossRef]
- Sun, W.; Zhang, J.; Yang, J.; Liu, W.; Zhang, W. Probabilistic evaluation and improvement measures of power supply capability considering massive EV integration. Electronics 2019, 8, 1158. [Google Scholar] [CrossRef]
- Xiao, J.; Qu, Y.; She, B.; Jiao, H.; Li, C.; Zhang, S. Critical flow-based fast algorithm for the total supply capability curve of distribution networks. Arab. J. Sci. Eng. 2023, 48, 14501–14515. [Google Scholar] [CrossRef]
- Hao, Y.; Huang, Z.; Ma, S.; Huang, J.; Chen, J.; Sun, B. Evaluation method of the incremental power supply capability brought by distributed generation. Energies 2023, 16, 6062. [Google Scholar] [CrossRef]
- Kong, X.; Yong, C.; Wang, C.; Li, P.; Yu, L.; Chen, Y. Multi-objective power supply capacity evaluation method for active distribution network in power market environment. Int. J. Electr. Power Energy Syst. 2019, 115, 105467. [Google Scholar] [CrossRef]
- Zhou, W.; Sun, K.; Sun, H.; Shou, Z.; Liu, J.; Huang, W.; Wang, Z. A novel bi-level optimization model for load supply capability issue in active distribution network. Int. Trans. Electr. Energy Syst. 2018, 28, e2492. [Google Scholar] [CrossRef]
- Xiao, J.; Liu, R.; She, B.; He, G.; Liang, Z.; Cai, Z. The influence mechanism of substation transformer on total supply capability (TSC) of distribution networks. Electr. Power Syst. Res. 2024, 228, 110092. [Google Scholar] [CrossRef]
- Sarantakos, I.; Greenwood, D.; Zografou-Barredo, N.; Vahidinasab, V.; Taylor, P. A probabilistic method to quantify the capacity value of load transfer. Int. J. Electr. Power Energy Syst. 2020, 123, 106238. [Google Scholar] [CrossRef]
- Xu, Z.; Liu, H.; Sun, H.; Ge, S.; Wang, C. Power supply capability evaluation of distribution systems with distributed generations under differentiated reliability constraints. Int. J. Electr. Power Energy Syst. 2022, 134, 107344. [Google Scholar] [CrossRef]
- Xu, Z.; Li, J.; Liu, H.; Ge, S.; Wang, B.; Wen, Z. Reliability-based power supply capability evaluation of power distribution networks considering interruptible loads after contingencies. Sustain. Energy Technol. Assess. 2024, 69, 103876. [Google Scholar] [CrossRef]
- Zhou, X.; Li, X.; Liu, F.; Ge, W.; Ma, X.; Tian, Y.; Li, G.; Zhang, J.; Qiu, Y. The comprehensive evaluation model of power supply capacity for regional-oriented distribution network. Neural Comput. Appl. 2020, 32, 5163–5171. [Google Scholar] [CrossRef]
- Xiao, J.; Wang, C.; She, B.; Li, F.; Bao, Z.; Zhang, X. Total supply and accommodation capability curves for active distribution networks: Concept and model. Int. J. Electr. Power Energy Syst. 2021, 133, 107279. [Google Scholar] [CrossRef]
- Xiao, J.; Cai, Z.; Liang, Z.; She, B. Mathematical model and mechanism of TSC curve for distribution networks. Int. J. Electr. Power Energy Syst. 2022, 137, 107812. [Google Scholar] [CrossRef]
- Fahrioglu, M.; Alvarado, F. Designing incentive compatible contracts for effective demand management. IEEE Trans. Power Syst. 2000, 15, 1255–1260. [Google Scholar] [CrossRef]
- Paulraj, S.; Sumathi, P. A comparative study of redundant constraints identification methods in linear programming problems. Math. Probl. Eng. 2010, 2010, 242–256. [Google Scholar] [CrossRef]
- Allan, R.; Billinton, R.; Sjarief, I.; Goel, L.; So, K. A reliability test system for educational purposes-basic distribution system data and results. IEEE Trans. Power Syst. 1991, 6, 813–820. [Google Scholar] [CrossRef]


| Security Constraint | Expression |
|---|---|
| State-space constraint | |
| Normal operational constraint | , |
| N-1 security constraint | , , , |
| Criticality constraint | , |
| Voltage constraint |
| TSC Curve Points | SL,1 (MVA) | SL,2 (MVA) | SL,3 (MVA) | SDG,1 (MVA) | SDG,2 (MVA) | Val(SL,i) (MVA) |
|---|---|---|---|---|---|---|
| W1 | 0.0 | 0.0 | 4.0 | 0.0 | 0.0 | 4.0 |
| W2 | 0.1 | 0.0 | 3.9 | 0.0 | 0.0 | 4.0 |
| W3 | 0.2 | 0.0 | 3.8 | 0.0 | 0.0 | 4.0 |
| W4 | 0.3 | 0.0 | 3.7 | 0.0 | 0.0 | 4.0 |
| W5 | 0.4 | 0.0 | 3.6 | 0.0 | 0.0 | 4.0 |
| … | ||||||
| W10937 | 3.8 | 1.0 | 1.2 | −0.9 | −1.0 | 6.0 |
| W10938 | 0.0 | 4.0 | 2.1 | 0.0 | −1.7 | 6.1 |
| W10939 | 0.1 | 2.0 | 4.0 | 0.0 | −1.9 | 6.1 |
| … | ||||||
| W20169 | 2.7 | 3.0 | 2.6 | −2.0 | −2.0 | 8.3 |
| W20170 | 2.8 | 3.0 | 2.5 | −2.0 | −2.0 | 8.3 |
| W20171 | 2.9 | 3.0 | 2.4 | −2.0 | −2.0 | 8.3 |
| W20172 | 3.0 | 3.0 | 2.3 | −2.0 | −2.0 | 8.3 |
| W20173 | 2.0 | 4.0 | 2.4 | −2.0 | −2.0 | 8.4 |
| TSC (MVA) | (MVA) | TSCmin (MVA) | PSC Range (MVA) |
|---|---|---|---|
| 8.4 | 5.97 | 4.0 | [4.0, 8.4] |
| TSC (MVA) | (MVA) | TSCmin (MVA) | TSC (MVA) | (MVA) | TSCmin (MVA) | ||
|---|---|---|---|---|---|---|---|
| 0.00 | 8.0 | 5.89 | 4.0 | 0.55 | 10.0 | 6.31 | 4.0 |
| 0.05 | 8.2 | 5.86 | 4.0 | 0.60 | 10.0 | 6.60 | 4.0 |
| 0.10 | 8.4 | 5.97 | 4.0 | 0.65 | 10.0 | 6.34 | 4.0 |
| 0.15 | 8.6 | 5.98 | 4.0 | 0.70 | 10.0 | 6.53 | 4.0 |
| 0.20 | 8.8 | 6.13 | 4.0 | 0.75 | 10.0 | 6.70 | 4.0 |
| 0.25 | 9.0 | 6.21 | 4.0 | 0.80 | 10.0 | 6.73 | 4.0 |
| 0.30 | 9.2 | 6.22 | 4.0 | 0.85 | 10.0 | 6.38 | 4.0 |
| 0.35 | 9.4 | 6.16 | 4.0 | 0.90 | 10.0 | 6.61 | 4.0 |
| 0.40 | 9.6 | 6.40 | 4.0 | 0.95 | 10.0 | 6.33 | 4.0 |
| 0.45 | 9.8 | 6.22 | 4.0 | 1.00 | 10.0 | 6.82 | 4.0 |
| 0.50 | 10.0 | 6.56 | 4.0 |
| TSC Curve Points | SL,1 | SL,2 | SL,3 | SL,4 | SL,5 | SL,6 | SL,7 | SDG,1 | SDG,2 | SDG,3 | SDG,4 | Val(SL,i) |
|---|---|---|---|---|---|---|---|---|---|---|---|---|
| W1 | 0.0 | 4.0 | 5.0 | 1.0 | 0.0 | 1.0 | 6.0 | 0.0 | 0.0 | 0.0 | 0.0 | 17.0 |
| W2 | 0.0 | 4.0 | 5.0 | 1.0 | 1.0 | 1.0 | 6.0 | 0.0 | 0.0 | 0.0 | −1.0 | 18.0 |
| W3 | 0.0 | 4.0 | 5.0 | 2.0 | 0.0 | 1.0 | 6.0 | 0.0 | 0.0 | −1.0 | 0.0 | 18.0 |
| W4 | 0.0 | 5.0 | 5.0 | 1.0 | 0.0 | 1.0 | 6.0 | 0.0 | −1.0 | 0.0 | 0.0 | 18.0 |
| W5 | 1.0 | 4.0 | 5.0 | 1.0 | 0.0 | 1.0 | 6.0 | −1.0 | 0.0 | 0.0 | 0.0 | 18.0 |
| … | ||||||||||||
| W974 | 6.0 | 5.0 | 5.0 | 2.0 | 6.0 | 1.0 | 0.0 | 0.0 | −1.0 | −1.0 | 0.0 | 25.0 |
| W975 | 0.0 | 3.0 | 5.0 | 6.0 | 3.0 | 3.0 | 6.0 | 0.0 | −1.0 | −3.0 | −3.0 | 26.0 |
| W976 | 2.0 | 3.0 | 5.0 | 5.0 | 3.0 | 2.0 | 6.0 | −2.0 | 0.0 | −3.0 | −3.0 | 26.0 |
| … | ||||||||||||
| W1556 | 5.0 | 3.0 | 5.0 | 6.0 | 5.0 | 3.0 | 4.0 | −3.0 | −1.0 | −3.0 | −3.0 | 31.0 |
| W1557 | 5.0 | 3.0 | 5.0 | 6.0 | 6.0 | 3.0 | 3.0 | −2.0 | −1.0 | −3.0 | −3.0 | 31.0 |
| W21558 | 6.0 | 3.0 | 5.0 | 6.0 | 6.0 | 3.0 | 2.0 | −2.0 | −1.0 | −3.0 | −2.0 | 31.0 |
| W1559 | 6.0 | 4.0 | 5.0 | 5.0 | 6.0 | 2.0 | 3.0 | −3.0 | −1.0 | −3.0 | −3.0 | 31.0 |
| W1560 | 6.0 | 3.0 | 5.0 | 6.0 | 6.0 | 3.0 | 3.0 | −3.0 | −1.0 | −3.0 | −3.0 | 32.0 |
| TSC (MVA) | (MVA) | TSCmin (MVA) | PSC Range (MVA) |
|---|---|---|---|
| 33.0 | 24.67 | 17.0 | [17.0, 33.0] |
Disclaimer/Publisher’s Note: The statements, opinions and data contained in all publications are solely those of the individual author(s) and contributor(s) and not of MDPI and/or the editor(s). MDPI and/or the editor(s) disclaim responsibility for any injury to people or property resulting from any ideas, methods, instructions or products referred to in the content. |
© 2024 by the authors. Licensee MDPI, Basel, Switzerland. This article is an open access article distributed under the terms and conditions of the Creative Commons Attribution (CC BY) license (https://creativecommons.org/licenses/by/4.0/).
Share and Cite
Li, N.; Sun, S.; Zhang, L.; Wang, J.; Qu, Y. The Evaluation Method of the Power Supply Capability of an Active Distribution Network Considering Demand Response. Processes 2024, 12, 2719. https://doi.org/10.3390/pr12122719
Li N, Sun S, Zhang L, Wang J, Qu Y. The Evaluation Method of the Power Supply Capability of an Active Distribution Network Considering Demand Response. Processes. 2024; 12(12):2719. https://doi.org/10.3390/pr12122719
Chicago/Turabian StyleLi, Ning, Sipei Sun, Liang Zhang, Jianjun Wang, and Yuqing Qu. 2024. "The Evaluation Method of the Power Supply Capability of an Active Distribution Network Considering Demand Response" Processes 12, no. 12: 2719. https://doi.org/10.3390/pr12122719
APA StyleLi, N., Sun, S., Zhang, L., Wang, J., & Qu, Y. (2024). The Evaluation Method of the Power Supply Capability of an Active Distribution Network Considering Demand Response. Processes, 12(12), 2719. https://doi.org/10.3390/pr12122719