Article

A High-Impedance Fault Detection Method for Active Distribution Networks Based on Time–Frequency–Space Domain Fusion Features and Hybrid Convolutional Neural Network

1
State Grid Yuncheng Power Supply Company, Yuncheng 044400, China
2
School of Electrical and Electronic Engineering, North China Electric Power University, Baoding 071003, China
*
Author to whom correspondence should be addressed.
Processes 2024, 12(12), 2712; https://doi.org/10.3390/pr12122712
Submission received: 25 October 2024 / Revised: 20 November 2024 / Accepted: 29 November 2024 / Published: 1 December 2024
(This article belongs to the Section AI-Enabled Process Engineering)

Abstract

:
Traditional methods for detecting high-impedance faults (HIFs) in distribution networks primarily rely on constructing fault diagnosis models using one-dimensional zero-sequence current sequences. A single diagnostic model often limits the deep exploration of fault characteristics. To improve the accuracy of HIF detection, a new method for detecting HIFs in active distribution networks is proposed. First, by applying continuous wavelet transform (CWT) to the collected zero-sequence currents under various operating conditions, the time–frequency spectrum (TFS) is obtained. An optimized algorithm, modified empirical wavelet transform (MEWT), is then used to denoise the zero-sequence current signals, resulting in a series of intrinsic mode functions (IMFs). Secondly, the intrinsic mode functions (IMFs) are transformed into a two-dimensional spatial domain fused image using the symmetric dot pattern (SDP). Finally, the TFS and SDP images are synchronized as inputs to a hybrid convolutional neural network (Hybrid-CNN) to fully explore the system’s fault features. The Sigmoid function is utilized to achieve HIF detection, followed by simulation and experimental validation. The results indicate that the proposed method can effectively overcome the issues of traditional methods, achieving a detection accuracy of up to 98.85% across different scenarios, representing a 2–7% improvement over single models.

1. Introduction

High-impedance faults (HIFs) are prevalent in distribution networks [1]. HIFs typically occur when a live conductor meets surfaces such as tree branches, concrete floors, sand, or asphalt. However, the fault current is weak and is characterized by the extinguishing and reignition of arcs, significant randomness, and nonlinear distortion, rendering HIFs undetectable by conventional equipment [2]. Although the weak HIF current does not pose a direct threat to distribution network equipment, the extinguishing and reignition of arcs can result in substantial economic losses. As the proportion of renewable energy gradually increases, the randomness and nonlinearity of the entire system intensify, complicating the fault characteristics. Consequently, traditional HIF detection methods are increasingly prone to failure [3]. Therefore, there is an urgent need to develop a new HIF detection method that can be effectively applied to modern distribution systems.
The HIF signals in the distribution network can easily be confused with disturbance signals caused by certain normal operations, such as the closing of switches. Existing HIF detection methods mainly process voltage and current signals through various feature extraction algorithms to extract specific characteristics, and then they set thresholds for judgment. When the system experiences intermittent ground faults or when distributed generation (DG) is connected, the steady-state characteristics are not obvious and are easily affected by the arc suppression coil [4,5]. Compared to steady-state characteristics, transient characteristics are rich in content and are not influenced by the grounding method of the neutral point. References [6,7] use a combination of 15% of the traditional phase voltage and the zero-sequence voltage gradient as the initial standard for fault occurrence. They determine the HIF line selection criteria by comparing the current and voltage derivative waveforms on high-frequency and low-frequency lines. However, when the transition resistance is high, the weakening of the fault transient characteristics leads to poor practicality of this method. Reference [8] proposes a HIF detection method based on magnetic flux chain detection for adjustable speed drive systems, which involves system-level software/firmware and is relatively complex. Reference [9] introduces a novel HIF feeder detection method based on extreme value inner product transformation. The proposed method is relatively simple in computation, but it has poor adaptability under different HIF conditions, such as those involving arc grounding and cement grounding. References [10,11] propose an HIF detection method based on the nonlinear distortion characteristics of zero-sequence current. This method only uses the distortion characteristics of the zero-sequence current waveform near the zero-crossing point for HIF detection, resulting in poor robustness.
In recent years, machine learning algorithms such as support vector machine (SVM) [12], extreme learning machine (ELM) [13], and decision tree (DT) [14] have been extensively utilized in the field of fault diagnosis for distribution networks. However, traditional machine learning approaches necessitate the manual extraction of feature vectors for fault diagnosis, and the effectiveness of these feature vectors relies on the research experience in relevant fields [15], which can be quite subjective. Deep learning can autonomously mine features from raw data, enabling fault diagnosis without the need for manual feature extraction. Reference [16] introduced an intelligent method that employs the improved multi-dimensional complete ensemble empirical mode decomposition with adaptive noise (MCEEMDAN) to extract the second intrinsic mode function (IMF2) and compute its Teager–Kaiser energy operator (TKEO) to detect and differentiate HIF from other interference conditions [17]. However, this method exhibits limited robustness under varying fault conditions. Reference [18] proposed a method for detecting HIFs in distribution networks based on an improved Emanuel and DenseNet. This method exhibits poor robustness under different grounding media and grounding methods. In [19], VMD-SVD is used to extract fault features and classify them using SVM. However, variational mode decomposition (VMD) requires manual setting of the number of intrinsic mode functions (IMF), and the decomposition accuracy can be easily affected. Additionally, single-value decomposition (SVD) can impose classification pressure on the classifier. In [20], the HIF detection method utilizes S-transform to extract features and then selects the best combination of feature vectors. The complexity of the S-transform makes the feature extraction process less adaptable. The method proposed in [21] uses wavelet transform (WT) to extract one-dimensional faults from fixed frequency bands as input features for neural networks. However, the extraction of fault features is easily influenced by human experience. The aforementioned methods have limitations and monotonicity when using fault band information. The input to artificial neural networks is often shallow features extracted manually.
To address the aforementioned issues, this paper focuses on data input methods and autonomous extraction of fault features by integrating time–frequency and spatial domain features, and it proposes an active distribution network HIF detection method based on a hybrid convolutional neural network (Hybrid-CNN). First, the continuous wavelet transform (CWT) is applied to the collected zero-sequence currents under various operating conditions to obtain the time–frequency spectrum (TFS). An optimized modified empirical wavelet transform (MEWT) algorithm is introduced to denoise the collected zero-sequence current signals, extracting a series of intrinsic mode functions (IMFs) to reduce electromagnetic interference from external environments. Next, a symmetric dot pattern (SDP) is used to convert the IMFs into two-dimensional fused spatial domain images. Compared to traditional signal-to-image conversion methods, the SDP method integrates multiple IMFs, resulting in better visualization. Finally, the TFS and SDP images are synchronously input into a Hybrid-CNN, which extracts deep features from the time–frequency and spatial domain images of the zero-sequence currents under different operating conditions. This enhances the accuracy of HIF detection in distribution networks. Simulations and experiments on various fault conditions in a distribution network model verify the effectiveness and anti-interference capability of the proposed method.

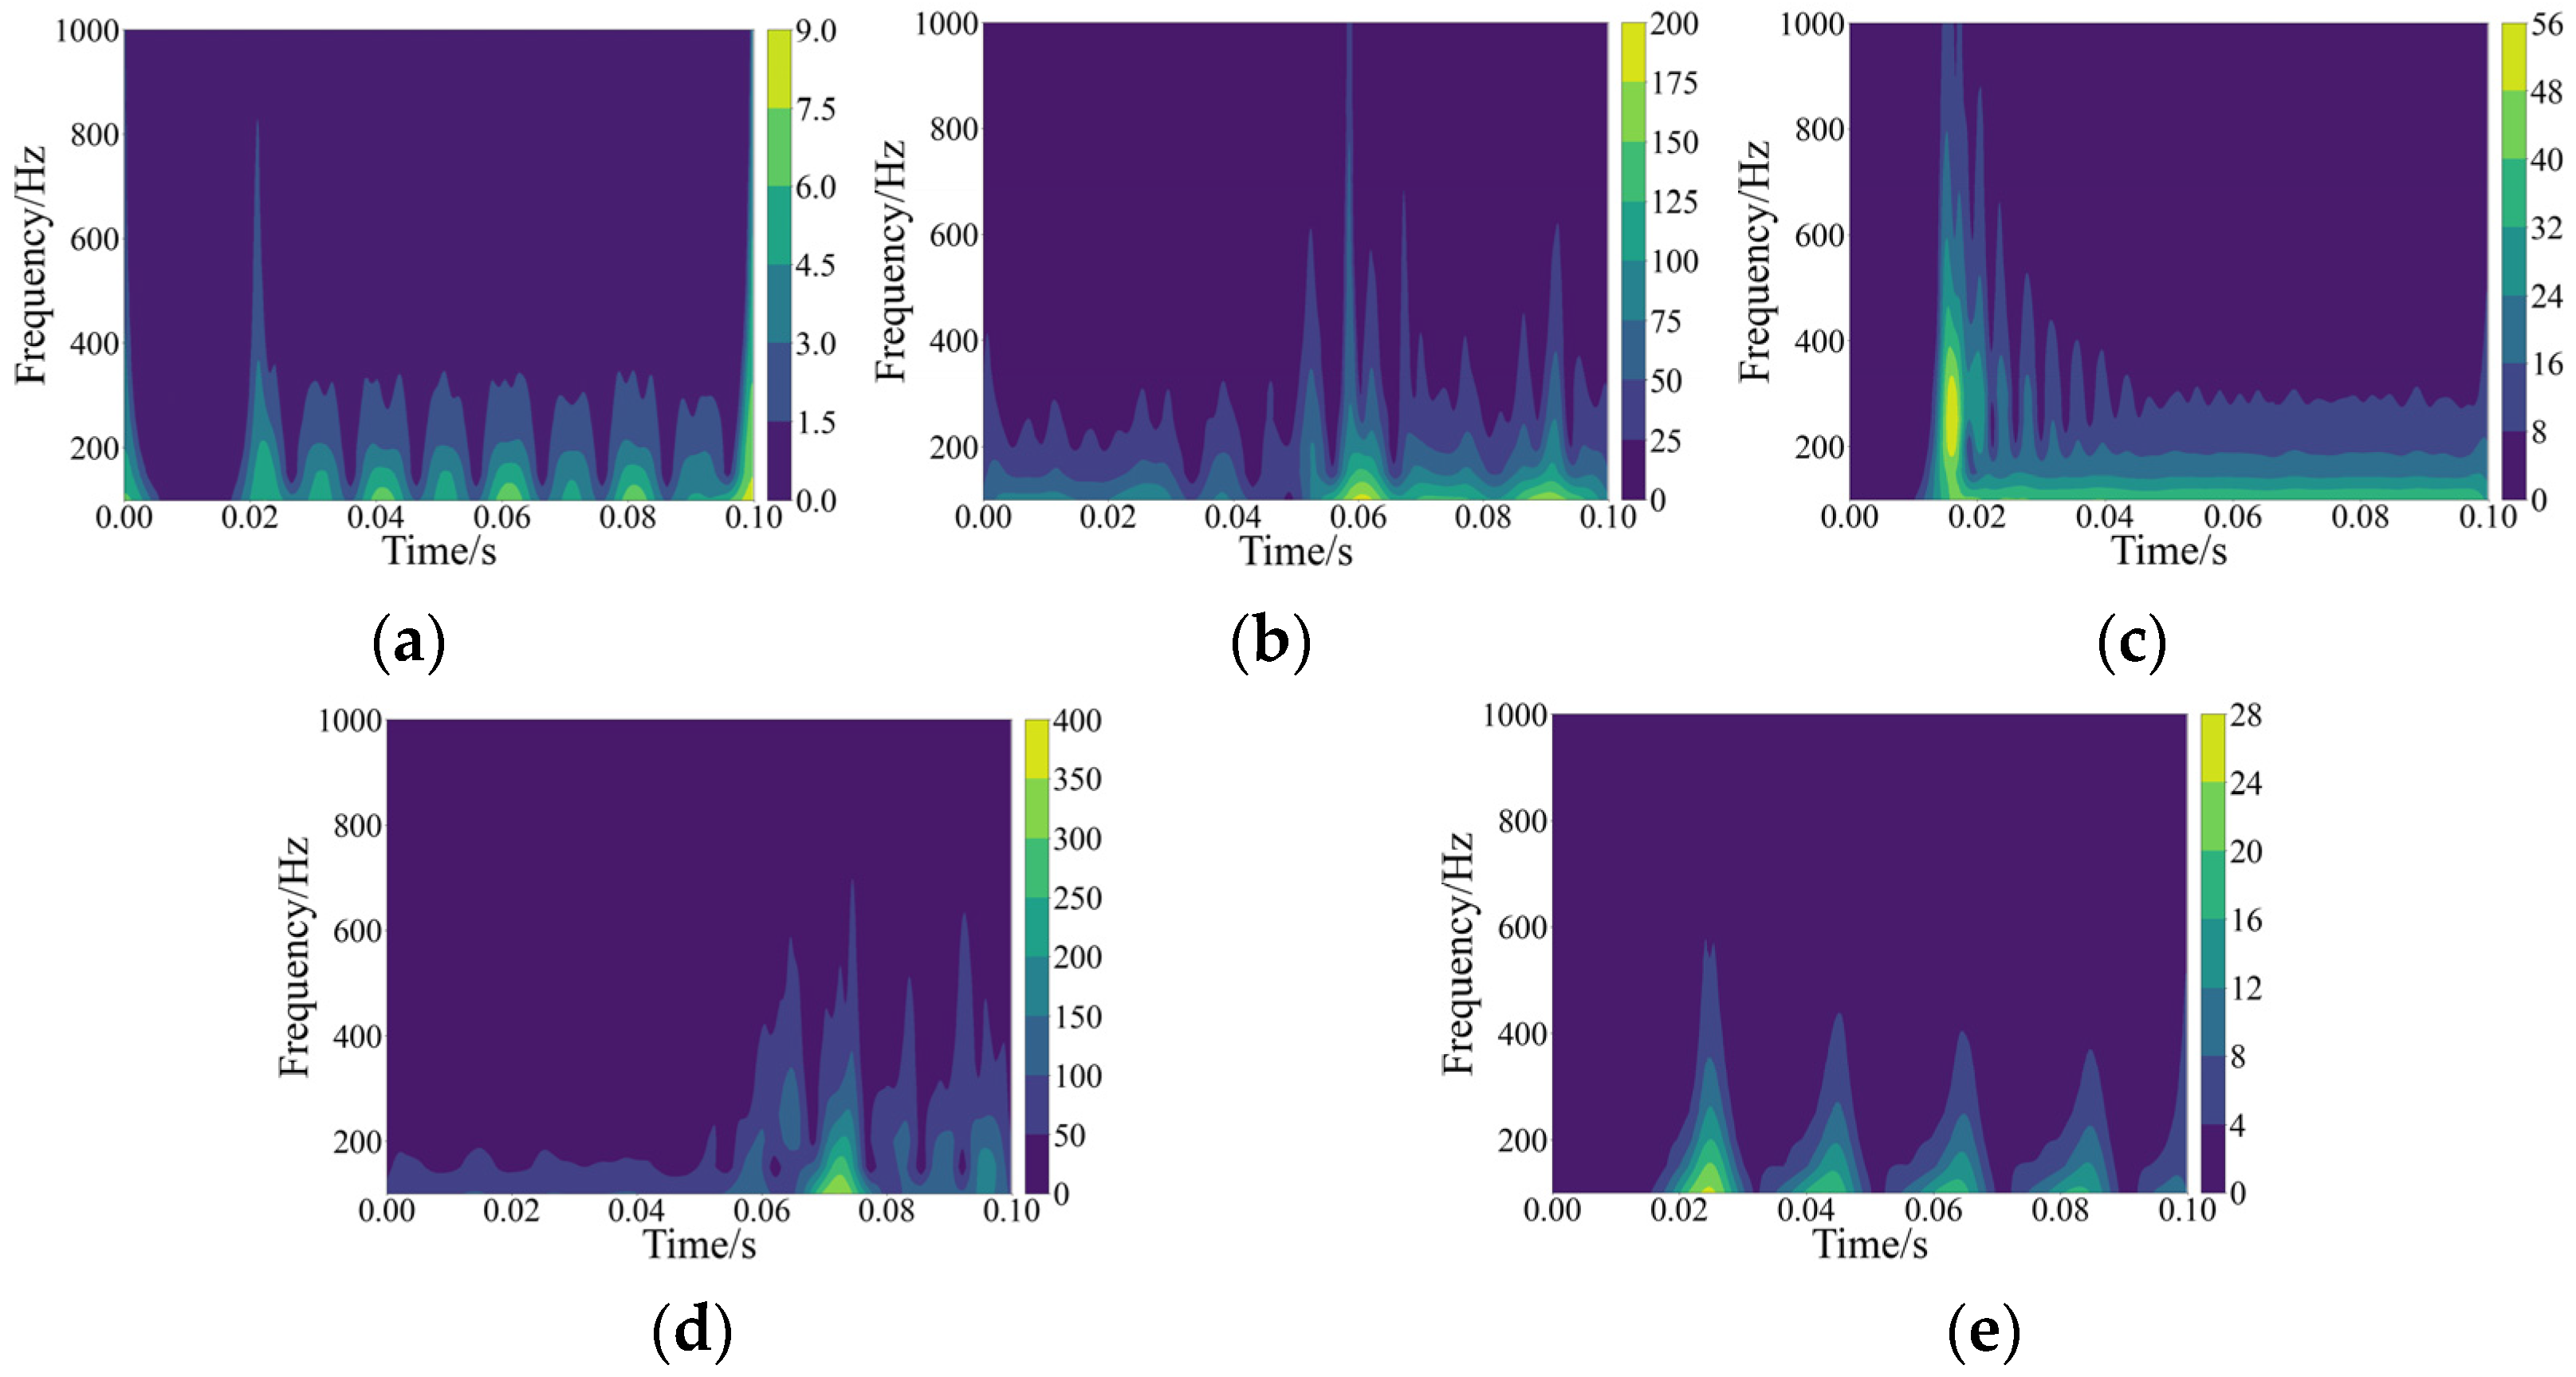
2. Time–Frequency Domain Features of Fault Transient Signals

Figure 1 shows the topology of a 10 kV active distribution network, which consists of a mix of overhead lines and cable lines, with the length of each line marked in the diagram. To thoroughly capture fault data from the beginning, middle, and end of the lines, as well as from both overhead and cable lines, the starting point of each line was selected as the current signal detection point. HIFs were set at the midpoints l1l21 of each segment. For example, a 4 kΩ HIF occurring at the midpoint of l9, located 2 km from the detection point as shown in Figure 1, was used to extract the fault current waveform over a 200μs time window following the fault, as illustrated in Figure 2.
Traditional HIF detection methods rely on time–domain or frequency–domain information of signals to establish detection criteria. However, these methods often suffer from the drawback of using single-feature quantities, leading to the neglect of a large amount of potentially useful fault information under varying fault conditions. To accurately detect HIF, it is essential to study the differences in time–frequency domain distribution between HIF and transient signals under normal disturbance conditions. The TFS, as an image feature, contains rich time–frequency domain fault information that can fully reflect the multi-dimensional characteristics of transient fault current signals, including time, amplitude, frequency, and polarity. This enables the observability of the panoramic time–frequency information of broadband transient signals [22]. To provide a more comprehensive representation of fault information, HIFs and four types of normal disturbance conditions (load switching (LS), capacitor switching (CS), no load line switching (NLLS), and inrush current (IC)) were set in the distribution network model shown in Figure 1. Transient current signals were collected during the occurrence of HIFs and disturbances. We performed a continuous wavelet transform (CWT) on the transient current containing five cycles, as shown in Equation (1).
C W T f = f ( t ) , ψ u , s ( t ) = + f ( t ) 1 s ψ * ( t u s ) d t
In Equation (1), 〈·〉 represents the inner product operation, f ( t ) is an arbitrary spatial function of L 2 ( R ) , and ψ u , s ( t ) = ψ * ( t u s ) is the wavelet basis function ψ ( t ) obtained by scaling and shifting the wavelet mother function. Here, s is the scaling factor, and u is the shifting factor. To represent more comprehensive fault information, the “fbsp” wavelet basis was selected to perform a CWT on the zero-sequence current over five cycles. By filtering out the fundamental frequency components and irrelevant high-frequency components, the transient current signal is mapped to the time–frequency domain, yielding the corresponding TFS, as shown in Figure 3.
As shown in Figure 3, the brighter the color in a specific region of the TFS, the higher the corresponding frequency content. The TFS clearly reflects the distinctive feature of the intermittent reignition and extinction of the fault current near the zero-crossing point (IREZP). When the current exhibits this characteristic, the corresponding frequency components in the frequency domain decrease, leading to a dip. Thus, the differences in the IREZP features of the HIF transient current signal in the frequency domain help achieve accurate HIF detection.

3. Spatial Domain Features of Transient Fault Signals

The electrical signals in a distribution network comprehensively reflect the current operating conditions of the system. While TFS enables the observation of a wide-band transient signal’s full time–frequency panoramic information, it does not sufficiently capture the spatial domain information of the fault. If an effective method can be employed to obtain the spatial domain information of the electrical signal during a fault, the rich combination of time–frequency and spatial domain features will provide valuable data for intelligent fault diagnosis methods based on image recognition.

3.1. MEWT Decomposition Method

Empirical wavelet transform (EWT) integrates the adaptive decomposition concept of empirical mode decomposition (EMD) with the compactly supported framework of wavelet transform (WT) theory. In 2013, Gilles introduced the concept of EWT [23], which is suitable for analyzing non-stationary, time-varying signals. This means that amplitude modulation and frequency modulation (AM–FM) components across different frequency bands can be extracted using a set of wavelet filter banks constructed based on the signal’s frequency domain characteristics. The steps are as follows:
(a)
Extract the signal spectrum using the fast Fourier transform (FFT): The Fourier transform of the signal fff is given by
f ^ ( ω ) = 1 2 π + f ( t ) e i ω t d t
In Equation (2), the spectrum of f ( t ) is denoted by f ( ω ) = | f ^ ( ω ) | , where ω [ 0 , π ] .
(b)
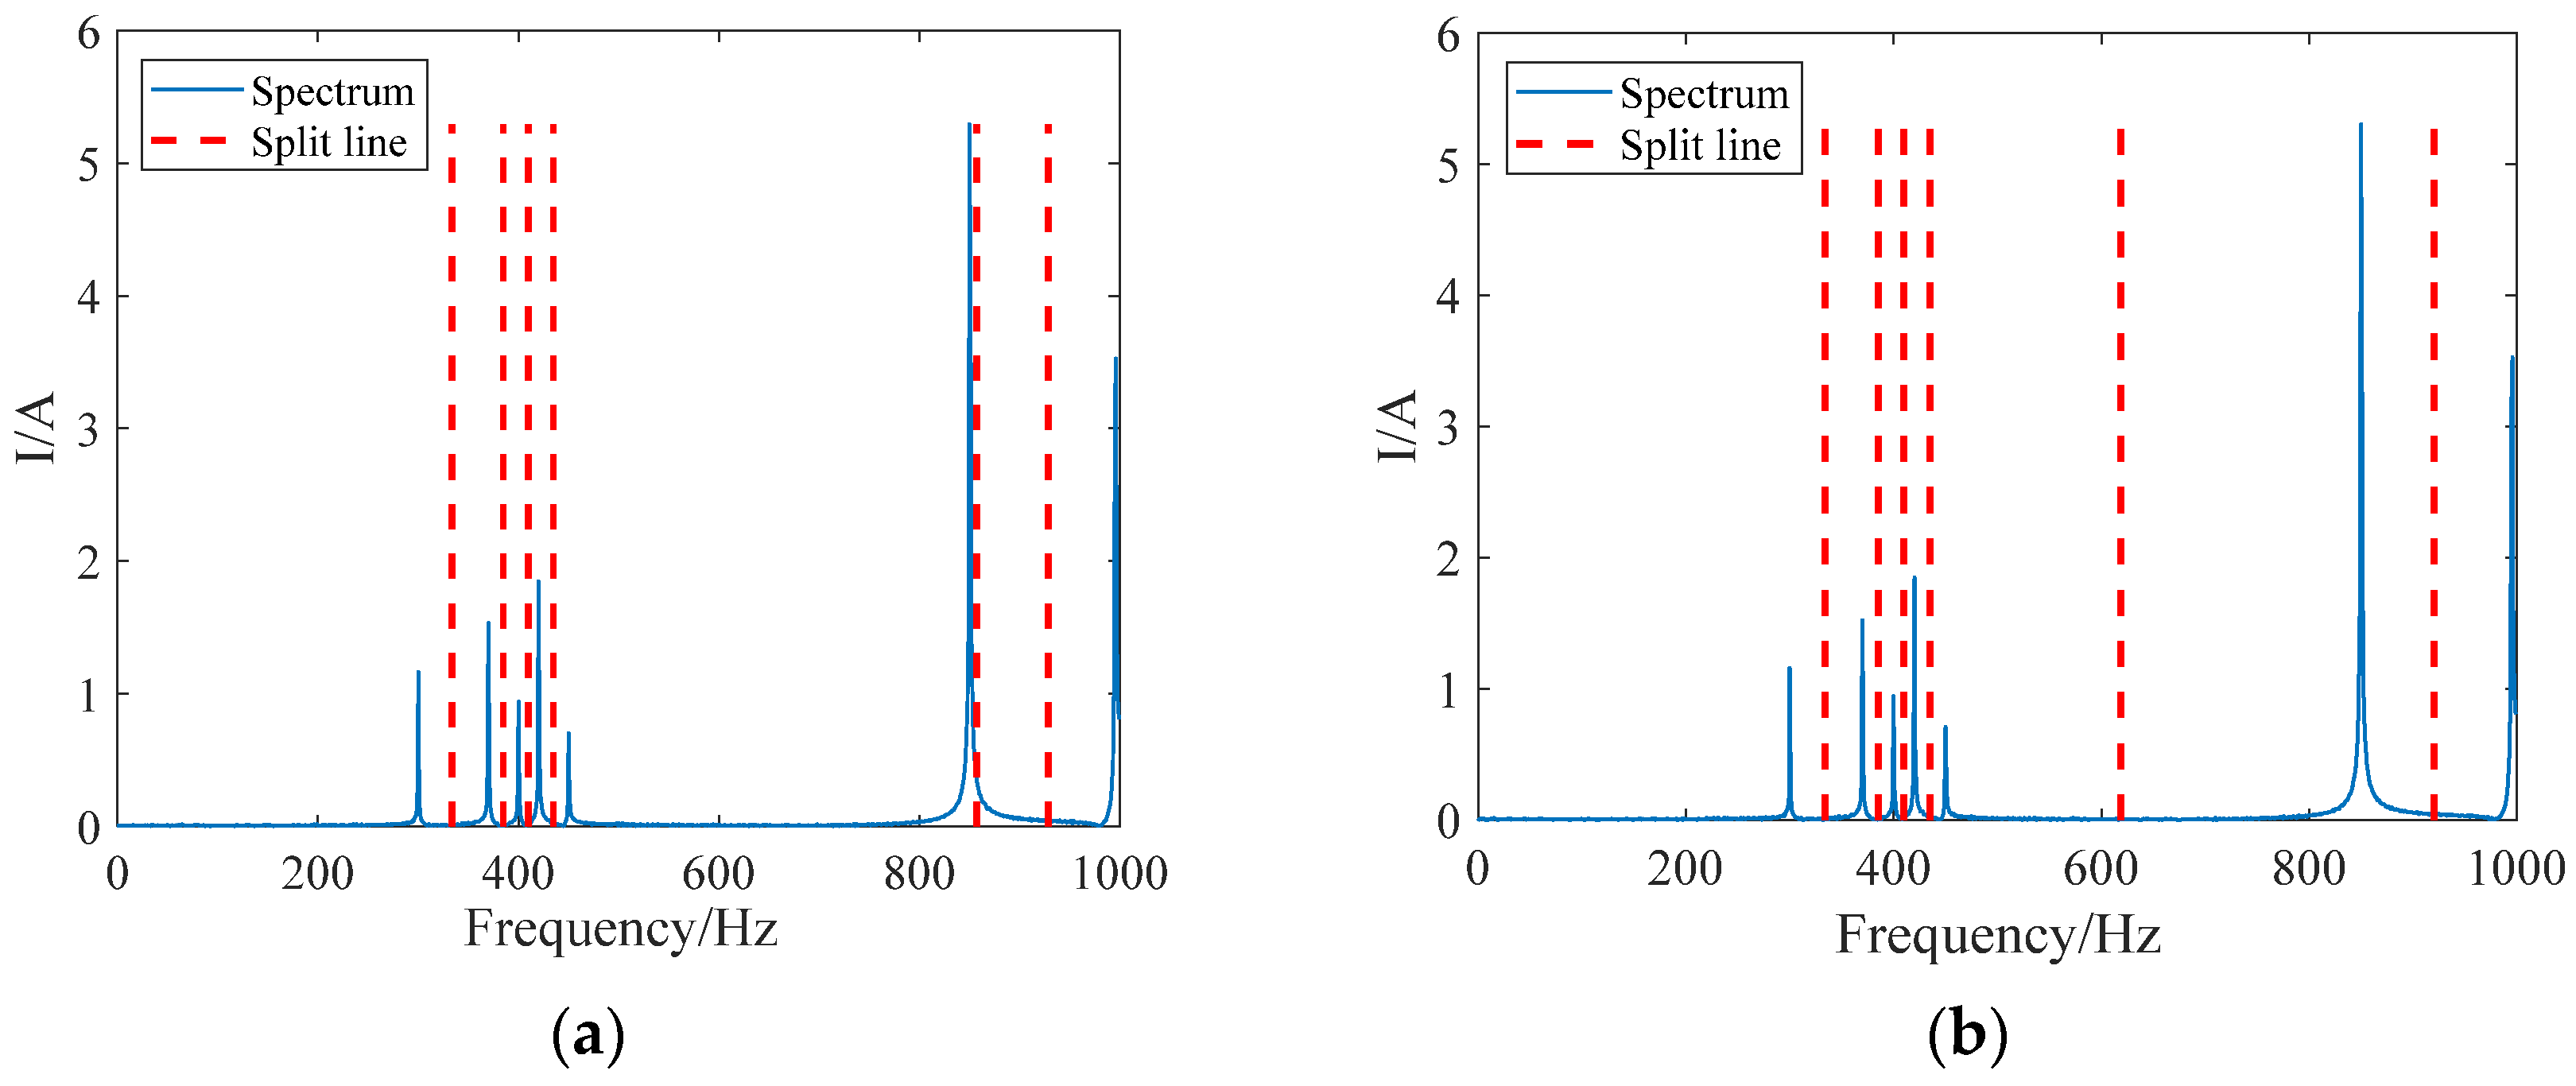
Segmenting the signal frequency bands: First, identify the number of local maxima marked as Num in the obtained spectrum and arrange them in descending order. Then, further arrange the local maxima in ascending order based on the corresponding frequencies ω . After this, the normalized frequency band [ 0 , π ] is divided into sub-band K ( K Num ) , and the sub-band centered at ω k ( k = 2 , 3 , , K ) for the AM–FM components is defined as [ Ω k 1 , Ω k ] , where Ω k 1 = ( ω k 1 + ω k ) / 2 , Ω 0 = 0 , Ω k = π .
(c)
Constructing a wavelet filter bank: For the sub-band [ Ω k 1 , Ω k ] , the scaling function ϕ ^ k ( ω ) and the wavelet function φ ^ k ( ω ) can be expressed as follows:
ϕ ^ k ( ω ) = { 1 | ω | ( 1 γ ) Ω k cos ( π 2 β ( | ω | ( 1 γ ) Ω k 2 γ ω k ) ) ( 1 γ ) Ω k | ω | ( 1 + γ ) Ω k 0 o t h e r s
φ ^ k ( ω ) = { 1 ( 1 γ ) Ω k < | ω | < ( 1 + γ ) Ω k cos ( π 2 β ( | ω | ( 1 γ ) Ω k + 1 2 γ ω k ) ) ( 1 γ ) Ω k + 1 | ω | ( 1 + γ ) Ω k + 1 sin ( π 2 β ( | ω | ( 1 γ ) Ω k 2 γ ω k ) ) ( 1 γ ) Ω k | ω | ( 1 + γ ) Ω k 0 o t h e r s
where β ( x ) can be any arbitrary function, and in this study, β ( x ) = x 4 ( 35 84 x + 70 x 2 20 x 3 ) .
(d)
Signal reconstruction: The inverse Fourier transform is used to calculate f ( ω ) × ϕ ^ k ( ω ) and f ( ω ) × φ ^ k ( ω ) . This allows for obtaining the time–domain representation of each frequency band, known as the modal components e w t ( k ) .
It is capable of adaptively analyzing and processing signals in the time–frequency domain, but the segmentation of its spectrum still requires prior knowledge for determination. The traditional interval segmentation method, known as the local maximum method, necessitates a pre-set number of segments and relies on the spectral peaks of the effective components in the original waveform. This approach has the drawback of overly dense spectral segmentation. Therefore, a MEWT algorithm is proposed, which uses kurtosis as a basis and applies the N-ary search method for adaptive frequency band segmentation. Additionally, Shannon entropy is employed to detect noise signals; when the entropy value exceeds a reference threshold β (set as β = 0.6 in this study), the signal is identified as noise and filtered out, resulting in the reconstructed signal. The flowchart of the MEWT process is shown in Figure 4.
The specific steps of the MEWT algorithm are as follows:
  • In the spectrum, record the local maxima of N frequency bands as Λ n , n = 1 , 2 , 3 , , N .
  • Use the midpoint between two adjacent local maxima as the boundary for the first frequency band segmentation and calculate the kurtosis K n , n = 1 , 2 , 3 , , N for each frequency band.
  • For the first and the N-th frequency bands, if the kurtosis Kn > 3, use the N-divided points (starting from N = 2) between the frequency band’s starting point and its midpoint as new frequency bands. If N ≤ 4, recalculate Kn until Kn ≤ 3 and N > 4, and redefine the frequency band boundaries.
  • For intermediate frequency bands Λ n , n = 2 , 3 , , N 1 , if the kurtosis Kn > 3, use the N-divided points between the band’s starting point and midpoint, as well as between the midpoint and endpoint (starting from N = 2) as new frequency bands and recalculate the kurtosis. If the kurtosis K > 3, then set N = N + 1 and repeat the above process until K ≤ 3 or N > 4.
The EWT decomposition results of the HIF zero-sequence current are shown in Figure 5.

3.2. SDP Transformation

Time–domain or frequency–domain features, such as peak values, root mean square, centroid frequency, and frequency variance, are not effective in distinguishing between HIF and normal disturbance signals. Compared to local fault current features extracted from the time domain, spatial domain image features can fully utilize multi-scale fault information, including time, frequency, and amplitude, thus further enhancing fault detection accuracy. The principle of SDP [24] is to transform a one-dimensional time series into a snowflake pattern composed of mirror-symmetric points in polar coordinates. The pattern differences reflect the variations in amplitude and frequency of the collected signals. By expressing fault information through images, each fault state can be represented more intuitively. For a time–domain signal x = { x 1 , , x n } , normalization is first performed, and then the time–domain signal is converted into polar coordinates as r ( i ) , θ ( i ) , and ϕ ( i ) by using symmetric point generation. The basic principle of SDP is illustrated in Figure 6.
SDP converts the amplitude of the i-th moment and the (i + 1)-th moment in the time series into polar coordinate points, forming symmetrical lobes. The coordinate transformation formula is as follows.
r ( i ) = x i x min x max x min
θ ( i ) = θ + x i + l x min x max x min ξ
ϕ ( i ) = θ x i + l x min x max x min ξ
where x max and x min represent the maximum and minimum amplitudes of the signal, respectively. x i is the i-th sample point of the signal, l is the time interval parameter, θ is the rotation angle of the mirror-symmetrical plane, and ξ is the angle magnification factor. For multiple signals, the SDP analysis method can integrate each signal into the image by adjusting the values of ξ and θ .

3.3. Generation Method of Fault Transient Spatial Domain Image Features

To capture the complex spatiotemporal dynamics of fault currents, signal processing techniques are used to convert 1D time series signals into 2D matrices, referred to as spatial domain panoramic current image features. The method for generating spatial domain images involves transforming each IMF from the MEWT decomposition into images by adjusting the values of ξ and θ in the SDP. The value of θ in SDP affects the overall symmetry of the image; if θ is too large, the generated image will not overlap, resulting in poor symmetry across the entire polar coordinate plane. Conversely, if θ is too small, there will be more overlaps in the image, causing features to be obscured and difficult to extract. Through extensive experiments, it was found that when θ = 60 , the circular plane is divided into six parts, making the overall image appear more symmetrical. The spatial domain image features of various fault conditions are shown in Figure 7.
As shown in Figure 7, the differences in SDP images are reflected in the varying thickness and fullness of the petals at different frequencies. The features of different frequencies of the IMFs, obtained after MEWT decomposition of zero-sequence current signals under various conditions, can be more intuitively represented in the images.

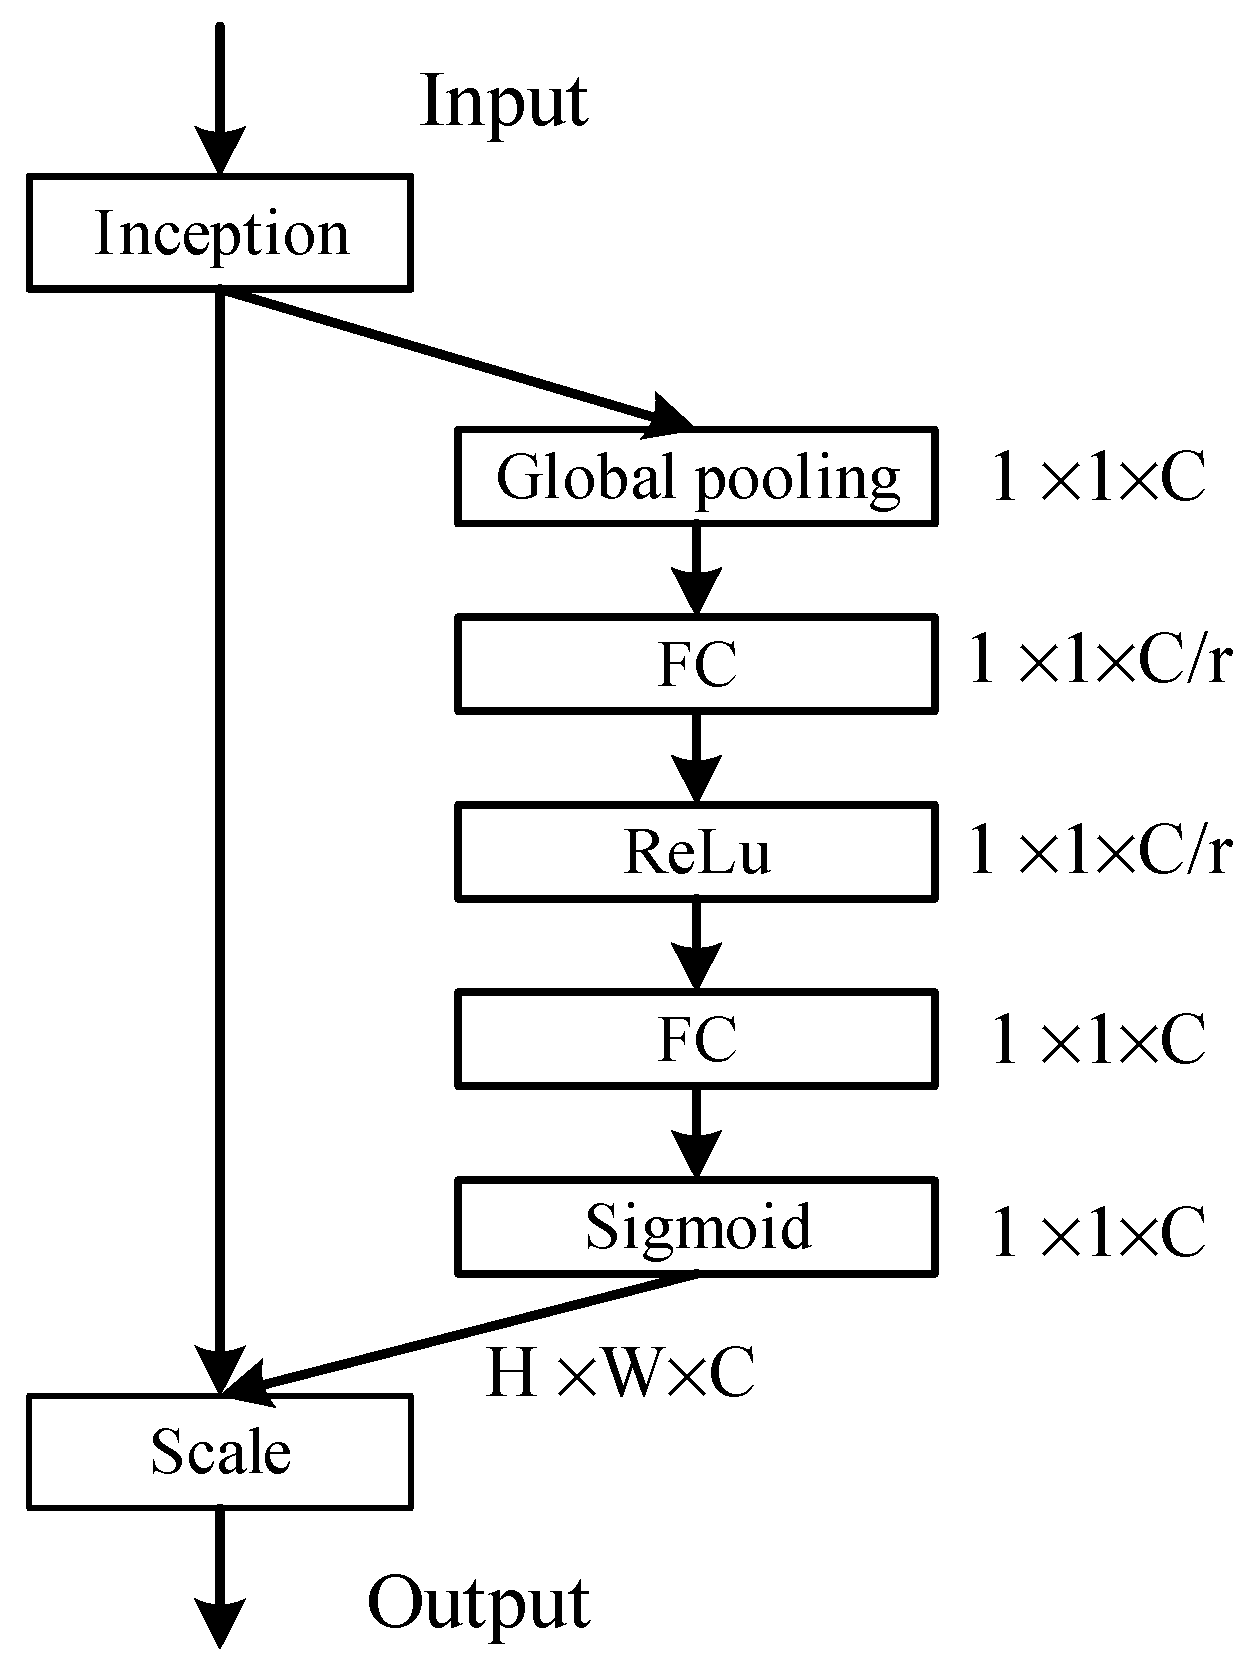
4. Fault Detection Model Based on Hybrid Convolutional Network

Due to the influence of factors such as distributed power sources, arc suppression coils, and line parameter imbalances, the zero-sequence current signals have a complex nonlinear relationship with fault diagnosis results, making modelling challenging. Therefore, this study adopted a data-driven approach, converting the original 1D zero-sequence current into 2D TFS and SDP images. The Hybrid-CNN is used to autonomously extract deep features from these images, enabling accurate HIF detection in distribution networks. The framework of the Hybrid-CNN-based HIF detection model for distribution networks is shown in Figure 8.
As shown in Figure 8, the entire HIF detection framework for the distribution network comprises five modules: signal acquisition, signal decomposition and denoising, spatial domain feature information fusion, network feature extraction, feature merging, and fault detection. The specific steps are described as follows:
Step 1—Signal acquisition: Simulations of the distribution network are conducted under various conditions, including different topologies, transition resistances, fault distances, initial fault angles, and fault scenarios, generating a large amount of data. A transient signal detection device is used to collect zero-sequence current signals during HIF and normal disturbance conditions, with a sampling frequency of 12.8 kHz. Signals from one cycle before the fault and four cycles after the fault are selected for analysis.
Step 2—Signal preprocessing: The “fbsp” wavelet basis is chosen to perform CWT) on the transient zero-sequence current signals containing five cycles, yielding TFS. The MEWT algorithm is used to decompose each condition’s transient zero-sequence current signals into a series of IMFs. The SDP method is then applied to convert each IMF component into a two-dimensional SDP image in the spatio-temporal domain, completing the fusion of spatial domain fault feature information.
Step 3—Network feature extraction: The method proposed in this study employs a CNN to extract TFS fault features from the zero-sequence current signals. By using the SDP method, the zero-sequence current signals for each condition can be transformed into images with distinct shape features. Subsequently, the VGG16 network autonomously extracts deep features from these images, facilitating intelligent HIF detection. However, the network may overlook the relationships between different channels and assign equal weights to all channel features, adversely affecting the model’s fault diagnosis performance. The SE attention mechanism [25], illustrated in Figure 9, serves as a strategy to adaptively weigh the importance of each feature channel, allowing for greater focus on the most informative channel features while suppressing less important ones. This helps the model concentrate on key features, enhancing both accuracy and robustness. Thus, the proposed method utilizes an improved VGG16 network embedded with the SE attention mechanism to extract deep features from the SDP images.
Step 4—Feature merging and fault detection: The CNN and the improved VGG16 network are used to extract global and deep features from the CWT of the zero-sequence current signals and the SDP images, respectively. The output features from the two networks are concatenated to form a new feature vector, as shown in Equation (8).
Y c o n = f c o n ( Y c w t , Y S D P ) = [ Y 1 c w t , Y 2 c w t , , Y j c w t , Y 1 S D P , Y 2 S D P , , Y k S D P ]
In Equation (8), Y c w t , Y S D P represent the features extracted from the TFS and SDP images of the zero-sequence current after processing by a dual-channel convolutional network. f c o n ( ) denotes the concatenation function, while j and k represent the feature dimensions, and Y c o n is the resulting concatenated feature vector. The concatenated feature vector comprises two types of features: spatio-temporal and time–frequency domain features. This new feature vector is then input into a fully connected layer (with 128 neurons) for nonlinear feature learning, and the Sigmoid function is utilized to output the probability of HIF. If the probability exceeds 0.5, it is classified as HIF; if the probability is less than 0.5, it is deemed a normal disturbance condition.

5. Experimental Validation and Analysis

5.1. Fault Transient Waveform Database

In this study, the computer hardware configuration used included an Intel(R) Core(TM) i7-13700K CPU @ 3.40 GHz, 16 GB of RAM, and an NVIDIA GeForce RTX 3080 GPU. The development platform was the Windows 10 64-bit operating system with Matlab 2022b Deep Learning Toolbox. A 10 kV distribution network model, as shown in Figure 1, was constructed using the MATLAB/SIMULINK simulation platform. The simulation model’s line parameters and DG parameters are detailed in Table 1 and Table 2.
The model was used to conduct simulations of HIF and normal disturbance conditions. Additionally, considering that HIFs often occur alongside arcing, the characteristics of the arc must be considered when establishing the HIF model. In this study, the Emanuel model [26] was employed as the HIF fault model, as depicted in Figure 10.
This model is an empirical model established based on a large amount of field experimental data. Due to its simple parameter adjustment and high similarity to actual faults, it has been widely used in research both domestically and internationally. To represent asymmetric fault currents, R n and R p should be selected as different resistances. Additionally, the two DC sources, V n and V p , have different amplitudes to control the IREZP. The parameter settings for the model are shown in Table 3.
The sampling frequency in this study was 12.8 kHz. Simulations of HIF and normal disturbance conditions were conducted by setting different fault locations, fault phase angles, transition resistances, and operating parameters. For each simulation cycle, only one parameter was changed. The parameter settings are listed in Table 4. After obtaining the simulation dataset, additional historical fault data and HIF and normal disturbance signals measured from the real-type test field were added to the dataset, resulting in a total of 2088 fault and disturbance samples. These samples were divided into a training set (1462 samples) and a test set (626 samples) at a 7:3 ratio.

5.2. Analysis of Fault Detection Result

5.2.1. Analysis of Model Result

This article simultaneously input two-dimensional TFS and SDP images generated from one-dimensional fault transient zero sequence current signals into Hybrid-CNN for HIF detection. In order to verify the better performance of the proposed method, TFS and SDP images were input into the CNN and improved VGG16 network, respectively, as well as TFS images input into the improved VGG16 network and SDP images input into CNN. The accuracy during the training process of different network architectures, as well as their training and execution times, were compared. The results are shown in Figure 11 and Table 5. During the training process, the solver used the Adam optimization algorithm with a batch size of 50 and an initial learning efficiency of 0.001. A total of 1200 samples that did not participate in the training were taken as validation samples and validated every 10 times.
From Figure 11a, it can be observed that using only the CNN network resulted in accuracy oscillating around 93%. When using the modified VGG16 network alone, the accuracy during training reached 98% at certain iterations but exhibited significant fluctuations, indicating instability in the network. The training and execution times for the VGG network were longer than those for the CNN network, and adding the SE module to VGG16 further increased computational complexity compared to other single networks. The Hybrid-CNN network converged at the 535th iteration, achieving a stable accuracy of 100%. As shown in Figure 11b, the accuracy of validation samples fluctuated significantly with the CNN network. In contrast, the modified VGG16 network achieved stable validation accuracy at approximately 98.3%, while the Hybrid-CNN network achieved a stable validation accuracy of 100%. Moreover, the training and execution times of the Hybrid-CNN network were less than the combined times of single-channel networks, demonstrating superior performance compared to using a single detection model. Comparative experiments indicate that the proposed method exhibited better training convergence performance. To further validate the feature extraction capability of the Hybrid-CNN, the popular t-distributed stochastic neighbor-embedding (t-SNE) technique [27] from machine learning was introduced to visualize the high-dimensional data from the input layer and the fully connected layer of the hybrid module after dimensionality reduction. The results are shown in Figure 12.
As shown in Figure 12, the input layer data were interwoven, making it difficult to distinguish between HIFs and normal disturbance conditions. By jointly extracting features through the CNN and improved Vgg16 networks, the feature vectors output by the fully connected layer of the hybrid module exhibited a high degree of separability. HIF features clustered together, and features of normal disturbance conditions also formed distinct clusters, indicating the network’s strong feature extraction capability. This study employed the F1-score to evaluate the fault location model for the distribution network, with its calculation formula as follows:
{ a = T 1 + T 4 T 1 + T 2 + T 3 + T 4 p = T 1 T 1 + T 2 r = T 1 T 1 + T 3 F 1 = 2 p r p + r
T1 represents true positives, where positive samples are correctly predicted as positive. T2 indicates false positives, where negative samples are incorrectly predicted as positive. T3 represents false negatives, where positive samples are incorrectly predicted as negative. The F1-score, as the harmonic mean of precision and recall, balances these two metrics. A higher F1 value indicates greater fault detection accuracy and better model performance. Figure 13 presents the confusion matrix for fault detection on both training and testing samples, where 0 denotes normal disturbance conditions and 1 represents HIF. The main diagonal elements indicate the number of correctly classified samples, while the off-diagonal elements represent misclassified samples. The rightmost column shows the precision and the false discovery rate T2, while the bottom row displays the recall and specificity T3. The overall accuracy is shown in the bottom-right cell.
From Figure 13, it can be observed that for both the training set and the test set, the actual values of fault and disturbance samples aligned well with the model’s predicted values, with no misclassifications. The detection accuracy reached 100%, indicating that the Hybrid-CNN model maintained a high accuracy in HIF detection and overcame the classification bias problem in deep learning models under imbalanced small-sample scenarios. To validate the rationality of the 7:3 split ratio for the training and test sets in this study, the changes in model accuracy and loss function under different data split ratios were compared. The results are shown in Figure 14.
The experimental results in Figure 14 show that the 7:3 split ratio achieved a good balance between the training and test data volumes, resulting in the best model performance. This validates the rationality of the data split employed in this study.

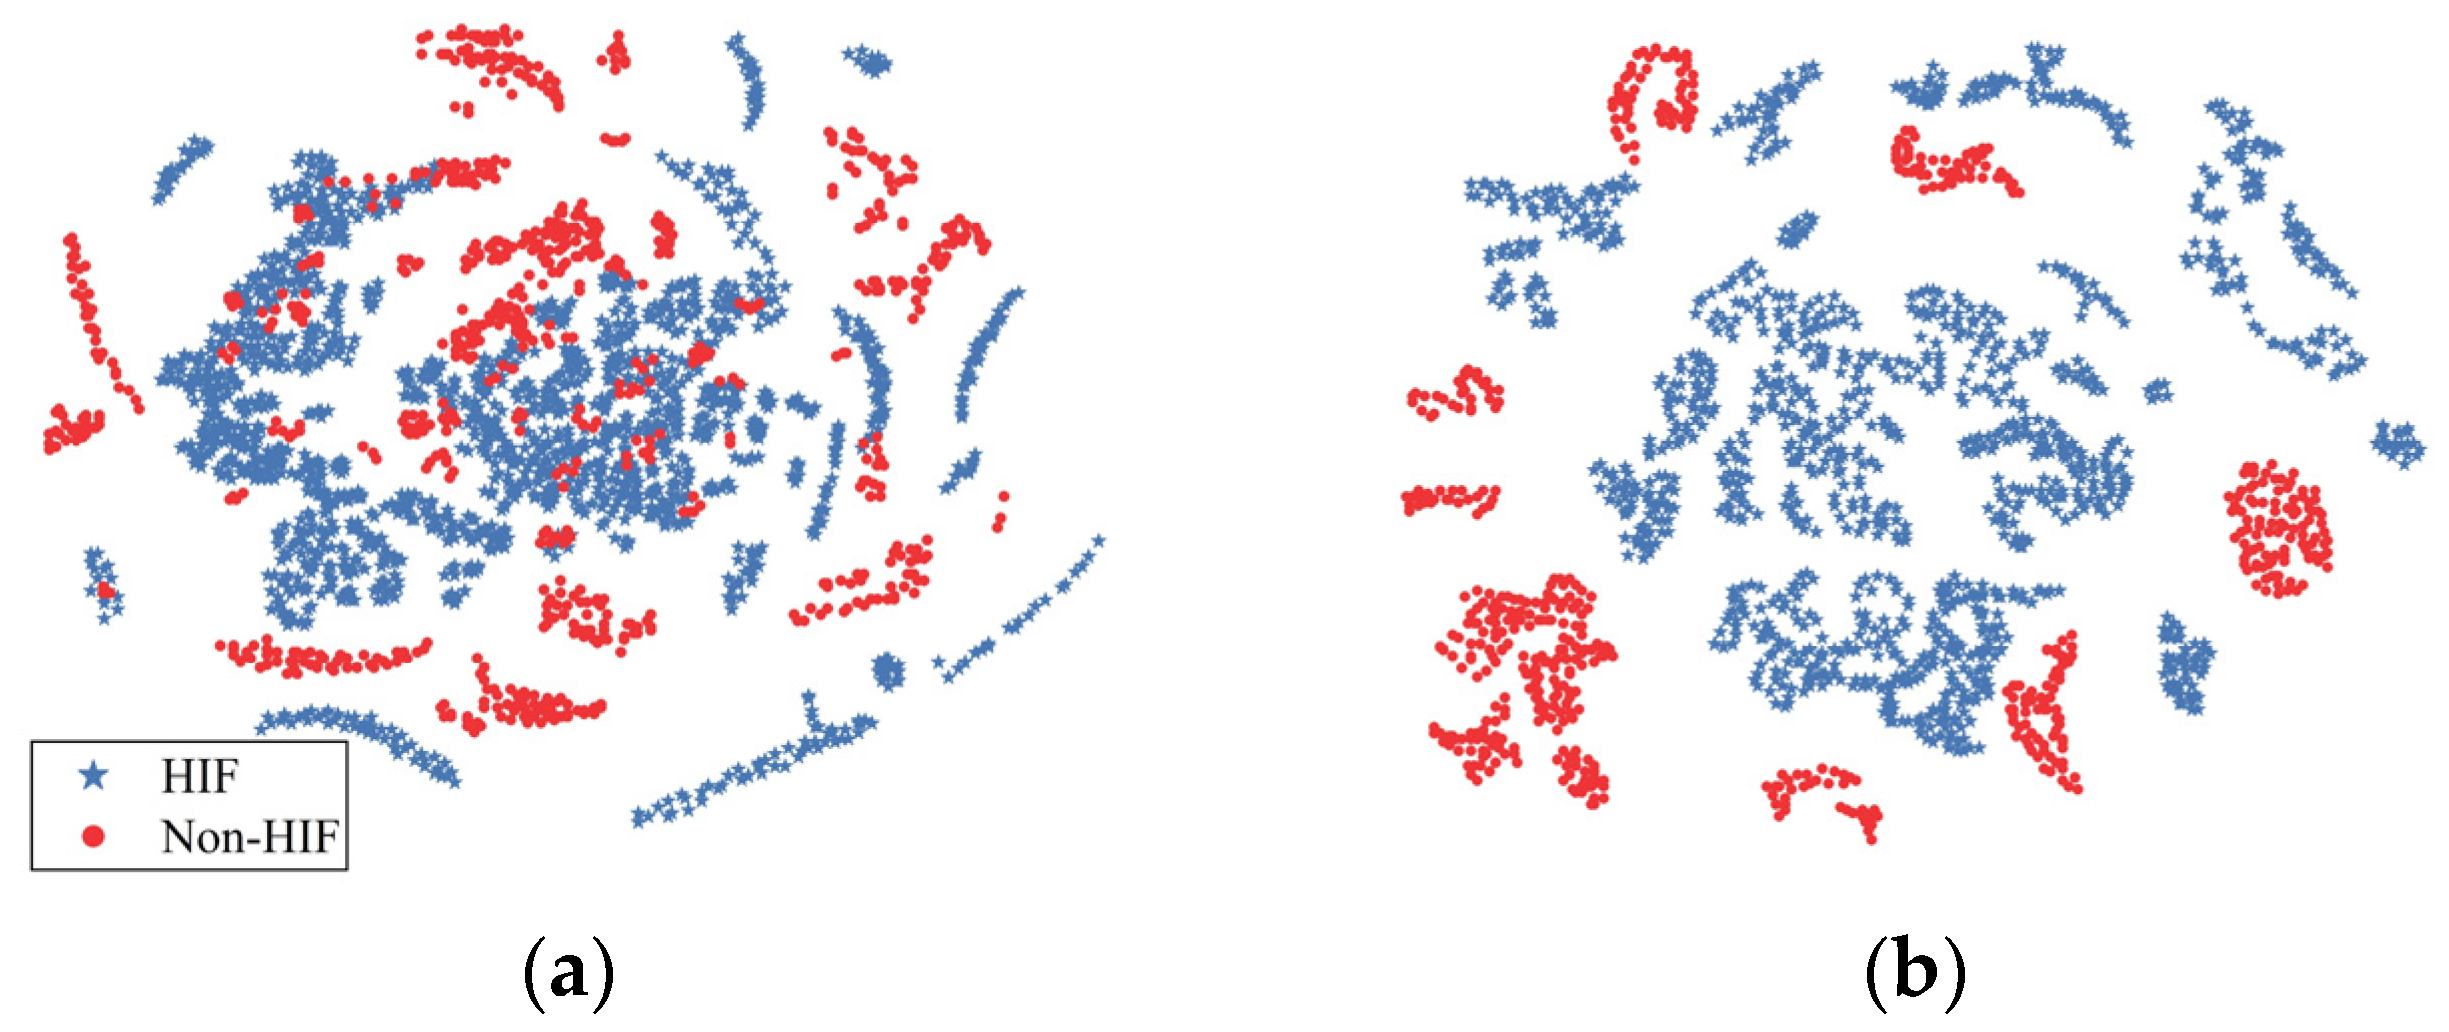
5.2.2. Explanatory Analysis of Grad-CAM

The ‘black box’ working mode of deep learning leads to its working principle not being known. In order to visually show the intrinsic reasons for the strong adaptability of the proposed method, this paper introduces the Grad-CAM interpretable algorithm [28], which visually explains the principle of model classification and detection. The specific steps of the algorithm are as follows:
(1) Input the image x into the image classification network f to obtain the corresponding scores of each category, as shown in Equation (10), where θ denotes the model parameters, and y c denotes the score corresponding to the category c obtained by forward propagation.
F ( x ; θ ) = ( y 1 , , y c , , y n )
(2) Calculate the gradient y c / A i j k obtained by backpropagation of category c on feature layer A. Pool the gradient globally averaged over the dimensions of width i and height j to obtain the importance weight α k c of category c on the kth channel of feature layer A.
α k c = 1 Z i i y c A i j k
In Equation (11), Z denotes the product of width i and height j, and A i j k denotes the pixel value of the coordinates on the kth channel of the feature layer A.
(3) Weight and sum the category weights corresponding to all feature maps and consider the pixel points that have a positive influence on category c (so that the final output is >0); then, the final weighted result is subjected to one ReLU activation process as shown in Equation (12) to obtain the final thermal map.
L G r a d C A M c = Re L U ( k α k c A k )
where A k denotes the weight matrix on the k-th channel of the feature layer A. Grad-CAM interpretability analysis: The more the image pixel color is biased towards darker colors, the greater the influence of this super-pixel image block region on the model decision result, which can be used as a basis for judging the extent of the influence of different regions of the image on the model decision result. The Grad-CAM interpretability analysis of the Hybrid-CNN detection process for HIF with perturbed conditions TFS and SDP was performed, and the results are shown in Figure 15, Figure 16, Figure 17 and Figure 18.
In Figure 15, Figure 16, Figure 17 and Figure 18, the top and bottom sides show the results of Grad-CAM interpretable analyses of TFS and SDP for each working condition, respectively. From the results, it can be seen that the CNN and the improved VGG16 network mainly investigated the IREZP characteristics of HIF in the time–frequency domain, and the petal contour and fullness of SDP in the spatial domain; for the TFS of CS, the CNN paid attention to the amount of mutation in the transient process, while the CNN paid attention to the amount of change in the transition from transient to steady state and its fluctuating process in the steady state for the TFS of IC, and the improved VGG16 network’s attention was still focused on the highlighted region of the image. In conclusion, both the CNN and improved VGG16 network can adaptively mine and extract the main features of TFS and SDP for different working conditions, which provides an explanation basis for the decision-making behaviors of the model and has some practical application value.

5.3. Model Adaptability Analysis

5.3.1. Effect of Different Fault Conditions

Since the database of both the training set and the test set contained fault sample data with different fault locations, different fault initial phase angles, and different fault transition resistances, it can be seen from the fact that the accuracy rate of both the training set and the test set reached 99.8% that the above different fault conditions did not affect the fault detection results of the model in this paper, but the above results did not take into account the effect of different grounding modes of the system neutral on the fault data, so the model’s performance in terms of fault detection in the system neutral was not influenced by the different fault conditions. The performance of the model under different grounding methods of the system neutral point was tested with 2560 test samples, and the results are shown in Table 6.
As shown in Table 6, under various fault conditions, such as different neutral point grounding methods, the HIF detection accuracy of the model fluctuated slightly, with a fluctuation range within 0.4%. In systems where the neutral point was grounded through an arc suppression coil, the model can still adaptively extract fault features in the time–frequency and spatial domains, achieving a detection accuracy of 99.96%. This demonstrates that the proposed method is robust under different fault conditions.

5.3.2. Effects of Noise Interference

Considering that the results of actual fault diagnosis are easily interfered by noise, the advantages of this paper’s method are verified under different signal-to-noise ratio conditions. For the topology shown in Figure 1, the number of test samples was selected to be 930, and the results of TFS images and HIF detection under each working condition were obtained, as shown in Figure 19 and Table 7.
As shown in Figure 18, when high-intensity noise signals were superimposed on the zero-sequence current waveform, the waveform characteristics were easily disrupted, resulting in pronounced burr-like features in the image contours, making it difficult to observe the original fundamental properties of the waveform. However, the HIF still retained its original basic shape, and the IREZP can be observed in the TFS, ensuring that HIF identification is not affected.
Table 7 indicates that changes in SNR can impact the accuracy of HIF detection to some extent. When the SNR was too low, the representation effectiveness of the TFS was compromised. At SNR = 2, the HIF detection accuracy was at its lowest, reaching 99.95%. Therefore, the proposed method demonstrated the ability to adaptively extract fault features even under noisy conditions, showing excellent robustness.

5.4. Comparative Analysis of Algorithms

Currently, there are various HIF detection methods. To verify the robustness and applicability of the proposed method, it was compared with VMD-SVD, S-transform, ANN, and short-time Fourier transform (STFT) [29]. In Test Scheme 1, 2240 sets of noise-free simulated data were used as the training set, while simulated data with SNR = 0, 5, 8, 10, 15, 20, and 30 dB (a total of 840 sets) were used as the test set. The system topology is shown in Figure 20.
In Test 2, 30% of the field dataset, where the topology remained unchanged (540 groups), was used for training, while the rest was used for testing. The real-type test site is shown in Figure 21.
The voltage level of the distribution network at this test site was 10 kV, consisting of one busbar and three feeders. The line composition included a 4 km overhead line, a 3 km overhead line, a 4 km overhead and 1 km cable hybrid line, and a 0.5 km cable line. A high-impedance fault occurred on Feeder 1, with load switching and capacitor switching performed on the busbar, as well as no-load line switching and surge current interference on Feeders 2 and 3. The zero-sequence current and SDP image results collected under high-impedance faults and various disturbance signals are shown in Figure 22.
As observed in Figure 22, the contours and fullness of the fault and various disturbance patterns’ petals differed, providing theoretical support for HIF detection. In Test 3, 1495 sets of field data with changed and unchanged topology were randomly mixed, of which 1007 sets were used as the training set and 388 sets of field data were used as the test set, and the test set HIF detection accuracy is shown in Figure 23.
From Figure 23, it can be seen that the detection accuracy of different models varied across testing scenarios. In general, the detection accuracy for simulation scenarios was higher than for field test scenarios. In Scenario 1, all models achieved optimal detection accuracy. In Scenario 2, the detection accuracy of all models declined. In the comprehensive topology variation Scenario 3, the detection accuracies of the VMD-CNN and S-transformer models were 69.34% and 79.16%, respectively, rendering them unsuitable. The proposed method achieved a minimum detection accuracy of 98.85% across all scenarios, demonstrating strong adaptability. In Figure 24, the t-SNE tool was used to visualize the zero-sequence current features extracted by Scenario 3 through the five methods described above.
Figure 24 illustrates that VMD-SVD was used to extract fault features, which were then classified using an SVM. However, VMD requires manual configuration of the number of IMFs. Improper IMF settings can easily compromise decomposition accuracy. Additionally, SVD produces data that are difficult to interpret, adding classification pressure to the classifier. While SVM can map data to a high-dimensional space to solve non-linear classification problems, its parameters and kernel functions are highly sensitive, making it effective only for simulated data but performing poorly for clustering field data. Even field data with the same label are challenging to cluster. The complexity of the S-transform can result in insufficient feature representation capability, making the feature extraction process unsuitable. Using wavelet transform to extract fixed-frequency fault features as ANN inputs is also limited by human expertise. Both methods exhibited limitations and monotonicity in utilizing fault band information. Moreover, ANN inputs are typically shallow, manually extracted features, which perform poorly in addressing significant differences between simulated and field fault waveforms in HIF detection, resulting in relatively poor classification accuracy. Figure 24 also shows that distribution differences can be observed based on the shapes of category labels, aligning with the test results in Figure 23. The results demonstrate that the proposed method leverages Hybrid-CNN to adaptively mine and extract features from TFS and SDP, rather than manually selecting fixed-band information as fault features. Therefore, when handling significant discrepancies between simulated and field fault waveforms in HIF detection, Hybrid-CNN exhibits robust two-dimensional image processing capabilities, maintaining high accuracy even under noisy conditions and demonstrating strong noise resistance. Overall, this algorithm outperforms other methods.

6. Conclusions

For distribution networks with DG, this paper proposes a distribution network HIF detection method based on time–frequency and spatial domain image generation combined with Hybrid-CNN and verified it using different network structures and experiments. The following conclusions are drawn:
(1)
The optimized MEWT algorithm has a better noise reduction effect compared to the traditional EWT noise reduction algorithm, helping to minimize the interference of noise on the effective feature extraction of zero-sequence current signals.
(2)
The SDP transformation can integrate each IMF obtained from the MEWT of a one-dimensional time–domain signal into a two-dimensional spatial domain image. Compared to traditional signal-to-image conversion methods, the transformed images contain richer fault features, providing better visualization of fault signals.
(3)
Through Hybrid-CNN, the deep feature extraction of time–frequency and spatial domain images of zero-sequence current signals can improve HIF detection accuracy. The Grad-CAM visualization results further validate the effectiveness and superiority of the proposed method.
(4)
The HIF detection method in this paper accurately detects HIFs under various conditions, including different topologies, noise interferences, and fault scenarios. Compared to other methods, it achieves the best results, offering a new perspective for research on HIF detection in distribution networks.
The model developed in this study is applicable to scenarios with topology variations within the same distribution network but cannot accommodate entirely different network topologies. Future work will involve using more field data, considering different distribution networks as case studies, and conducting further research to establish a generalizable and transferable HIF detection model for distribution networks. This aims to enhance the model’s topological generalization capability. Additionally, further investigation into the correlation of model parameter settings for various networks will be conducted to achieve better HIF detection performance.

Author Contributions

Conceptualization, C.W., L.F., S.H., G.R. and T.L.; methodology, S.H.; software, T.L.; validation, S.H., T.L. and L.F.; formal analysis, S.H.; investigation, T.L.; resources, S.H., T.L. and C.W.; data curation, T.L.; writing—original draft preparation, S.H., T.L. and G.R.; writing—review and editing, T.L.; visualization, S.H., T.L. and C.W.; supervision, S.H.; project administration, S.H. All authors have read and agreed to the published version of the manuscript.

Funding

This work was supported by State Grid Shanxi Electric Power Company through “Research on fault type identification and localization technology of distribution network based on multi-dimensional features”, grant number 5205M0230008.

Data Availability Statement

The data presented in this study are available on request from the corresponding author.

Conflicts of Interest

Authors Chen Wang, Lijun Feng and Guohui Ren were employed by the State Grid Yuncheng Power Supply Company. The remaining authors declare that the research was conducted in the absence of any commercial or financial relationships that could be construed as a potential conflict of interest.

References

  1. Li, J.; Wang, G.; Zeng, D.; Li, H. High-impedance ground faulted line-section location method for a resonant grounding system based on the zero-sequence current’s declining periodic component. Int. J. Electr. Power Energy Syst. 2020, 119, 105910. [Google Scholar] [CrossRef]
  2. Afshar, M.; Majidi, M.; Gashteroodkhani, O.A.; Amoli, M.E. Analyzing performance of relays for high impedance fault (HIF) detection using hardware-in-the-loop (HIL) platform. Electr. Power Syst. Res. 2022, 209, 108027. [Google Scholar] [CrossRef]
  3. Hao, B.; Lin, Y.-X.; Luo, J.-Y.; Liu, H.-W.; Liu, Y.-P.; Li, R.-G. High impedance fault detection device based on edge artificial intelligence. Energy Rep. 2023, 9, 546–550. [Google Scholar] [CrossRef]
  4. Jiang, C.; Bi, M.; Zhang, S.; Li, K.; Lei, S.; Jiang, T. Study on arc characteristics and combustion feature of tree-wire discharge fault in distribution line. Electr. Power Syst. Res. 2024, 230, 110210. [Google Scholar] [CrossRef]
  5. Gao, J.-H.; Guo, M.-F.; Lin, S.; Chen, D.-Y. Application of semantic segmentation in high-impedance fault diagnosis combined signal envelope and Hilbert marginal spectrum for resonant distribution networks. Expert Syst. Appl. 2023, 231, 120631. [Google Scholar] [CrossRef]
  6. Yang, D.; Lu, B.; Lu, H. High-Resistance Grounding Fault Detection and Line Selection in Resonant Grounding Distribution Network. Electronics 2023, 12, 4066. [Google Scholar] [CrossRef]
  7. He, Y.; Zhang, X.; Wang, R.; Cheng, M.; Gao, Z.; Zhang, Z.; Yu, W. Faulty Section Location Method Based on Dynamic Time Warping Distance in a Resonant Grounding System. Energies 2022, 15, 4923. [Google Scholar] [CrossRef]
  8. Hu, J.; Wei, L.; McGuire, J.; Liu, Z. Flux linkage detection based ground fault identification and system diagnosis in high-resistance grounding systems. IEEE Trans. Ind. Appl. 2016, 53, 2967–2975. [Google Scholar] [CrossRef]
  9. Wang, X.; Gao, J.; Wei, X.; Guo, L.; Song, G.; Wang, P. Faulty feeder detection under high impedance faults for resonant grounding distribution systems. IEEE Trans. Smart Grid 2022, 14, 1880–1895. [Google Scholar] [CrossRef]
  10. Zhu, J.-R.; Tang, H.-G.; Leng, H.; Jiao, S.; Chun, H. High impedance grounding fault detection in resonance grounding system based on nonlinear distortion of zero-sequence current. In Proceedings of the 2020 5th International Conference on Smart Grid and Electrical Automation (ICSGEA), Zhangjiajie, China, 13–14 June 2020; pp. 74–78. [Google Scholar] [CrossRef]
  11. Li, Z.; Cao, Y.; Chen, C.; Li, Y.; Li, J. Fault handling and localization strategy based on waveform characteristics recognition with coordination of Peterson coil and resistance grounding method. Energies 2024, 17, 3510. [Google Scholar] [CrossRef]
  12. Hearst, M.A.; Dumais, S.T.; Osuna, E.; Platt, J.; Scholkopf, B. Support vector machines. IEEE Intell. Syst. Their Appl. 1998, 13, 18–28. [Google Scholar] [CrossRef]
  13. Huang, G.-B.; Zhu, Q.-Y.; Siew, C.-K. Extreme learning machine: Theory and applications. Neurocomputing 2006, 70, 489–501. [Google Scholar] [CrossRef]
  14. Myles, A.J.; Feudale, R.N.; Liu, Y.; Woody, N.A.; Brown, S.D. An introduction to decision tree modeling. J. Chemom. 2004, 18, 275–285. [Google Scholar] [CrossRef]
  15. Lei, Y.; Yang, B.; Jiang, X.; Jia, F.; Li, N.; Nandi, A.K. Applications of machine learning to machine fault diagnosis: A review and roadmap. Mech. Syst. Signal Process. 2020, 138, 106587. [Google Scholar] [CrossRef]
  16. Biswal, M.; Prasad, C.D.; Ray, P.; Kishor, N. Modified complete ensemble empirical mode decomposition based HIF detection approach for microgrid system. Int. J. Electr. Power Energy Syst. 2022, 141, 108254. [Google Scholar] [CrossRef]
  17. Biswal, S.; Biswal, M. Fault-swing discrimination using Hilbert–Huang transform integrated discrete teager energy operato. IET Sci. Meas. Technol. 2018, 12, 829–837. [Google Scholar] [CrossRef]
  18. Bai, H.; Tang, B.; Cheng, T.; Liu, H. High impedance fault detection method in distribution network based on improved Emanuel model and DenseNet. Energy Rep. 2022, 8, 982–987. [Google Scholar] [CrossRef]
  19. Chaitanya, B.K.; Yadav, A.; Pazoki, M. An intelligent detection of high-impedance faults for distribution lines integrated with distributed generators. IEEE Syst. J. 2019, 14, 870–879. [Google Scholar] [CrossRef]
  20. Mishra, M.; Routray, P.; Rout, P. A universal high impedance fault detection technique for distribution system using S-transform and pattern recognition. Int. J. Electr. Power Energy Syst. 2016, 1, 9. [Google Scholar] [CrossRef]
  21. Baqui, I.; Zamora, I.; Mazón, J.; Buigues, G. High impedance fault detection methodology using wavelet transform and artificial neural networks. Electr. Power Syst. Res. 2011, 81, 1325–1333. [Google Scholar] [CrossRef]
  22. Tawhid, M.N.A.; Siuly, S.; Wang, H. Diagnosis of autism spectrum disorder from EEG using a time–frequency spectrogram image-based approach. Electron. Lett. 2020, 56, 1372–1375. [Google Scholar] [CrossRef]
  23. Gilles, J. Empirical wavelet transform. IEEE Trans. Signal Process. 2013, 61, 3999–4010. [Google Scholar] [CrossRef]
  24. Sun, Y.; Li, S.; Wang, Y.; Wang, X. Fault diagnosis of rolling bearing based on empirical mode decomposition and improved manhattan distance in symmetrized dot pattern image. Mech. Syst. Signal Process. 2021, 159, 107817. [Google Scholar] [CrossRef]
  25. Feng, Y.; Chen, J.; Zhang, T.; He, S.; Xu, E.; Zhou, Z. Semi-supervised meta-learning networks with squeeze-and-excitation attention for few-shot fault diagnosis. ISA Trans. 2022, 120, 383–401. [Google Scholar] [CrossRef]
  26. Furse, C.M.; Kafal, M.; Razzaghi, R.; Shin, Y.J. Fault diagnosis for electrical systems and power networks: A review. IEEE Sens. J. 2020, 21, 888–906. [Google Scholar] [CrossRef]
  27. Cieslak, M.C.; Castelfranco, A.M.; Roncalli, V.; Lenz, P.H.; Hartline, D.K. t-Distributed Stochastic Neighbor Embedding (t-SNE): A tool for eco-physiological transcriptomic analysis. Mar. Genom. 2020, 51, 100723. [Google Scholar] [CrossRef] [PubMed]
  28. Selvaraju, R.R.; Das, A.; Vedantam, R.; Cogswell, M.; Parikh, D.; Batra, D. Grad-CAM: Why did you say that? arXiv 2016, arXiv:1611.07450. [Google Scholar] [CrossRef]
  29. Sirojan, T.; Lu, S.; Phung, B.T.; Zhang, D.; Ambikairajah, E. Sustainable deep learning at grid edge for real-time high impedance fault detection. IEEE Trans. Sustain. Comput. 2018, 7, 346–357. [Google Scholar] [CrossRef]
Figure 1. Structural model of 10 kV active distribution network.
Processes 12 02712 g001
Figure 2. Transient signal of HIF current.
Processes 12 02712 g002
Figure 3. Fault transient current signal time–frequency spectrum. (a) HIF; (b) NLLS; (c) CS; (d) LS; (e) IC.
Processes 12 02712 g003
Figure 4. The flowchart of the MEWT.
Processes 12 02712 g004
Figure 5. EWT decomposition results of HIF zero-sequence current. (a) EWT; (b) MEWT.
Processes 12 02712 g005
Figure 6. The basic principle of SDP.
Processes 12 02712 g006
Figure 7. Spatial domain images of fault features under various conditions. (a) HIF; (b) NLLS; (c) CS; (d) LS; (e) IC.
Processes 12 02712 g007
Figure 8. HIF detection scheme based on the hybrid convolutional network. (a) HIF detection framework; (b) HIF detection flowchart.
Processes 12 02712 g008
Figure 9. SE attention mechanism module network structure.
Processes 12 02712 g009
Figure 10. HIF Emanuel model.
Processes 12 02712 g010
Figure 11. Accuracy curves for different network structures. (a) Training sample accuracy; (b) validation sample accuracy.
Processes 12 02712 g011
Figure 12. Hybrid neural network feature visualization results: (a) input layer; (b) hybrid modular fully connected layer.
Processes 12 02712 g012
Figure 13. Model training accuracy: (a) training set confusion matrix; (b) test set confusion matrix.
Processes 12 02712 g013
Figure 14. Performance comparison of the model under different data split ratios: (a) accuracy; (b) loss.
Processes 12 02712 g014
Figure 15. CNN interpretability analysis results. (a) HIF; (b) NLLS; (c) CS; (d) LS; (e) IC.
Processes 12 02712 g015
Figure 16. VGG16 interpretability analysis results. (a) HIF; (b) NLLS; (c) CS; (d) LS; (e) IC.
Processes 12 02712 g016
Figure 17. Improved VGG16 interpretability analysis results. (a) HIF; (b) NLLS; (c) CS; (d) LS; (e) IC.
Processes 12 02712 g017
Figure 18. Interpretability analysis results of the proposed method. (a) HIF; (b) NLLS; (c) CS; (d) LS; (e) IC.
Processes 12 02712 g018
Figure 19. TFS of test data. (a) HIF; (b) NLLS; (c) CS; (d) LS; (e) IC.
Processes 12 02712 g019
Figure 20. System topology of scheme 1.
Processes 12 02712 g020
Figure 21. Real-type test site of the distribution network.
Processes 12 02712 g021
Figure 22. SDP of actual data. (a) HIF; (b) NLLS; (c) CS; (d) LS; (e) IC.
Processes 12 02712 g022
Figure 23. Comparison results of various algorithm test sets.
Processes 12 02712 g023
Figure 24. Results of t-SNE visualization of zero sequence current characteristics for various methods. (a) VMD-SVD; (b) S-transformer; (c) ANN; (d) STFT; (e) the proposed method.
Processes 12 02712 g024
Table 1. Simulation model line parameters.
Line TypeResistance/(Ω·km−1)Inductance/(mH·km−1)Ground Capacitance/(μF·km−1)
Positive
Sequence
Zero
Sequence
Positive
Sequence
Zero
Sequence
Positive
Sequence
Zero
Sequence
Overhead line0.1780.251.2105.540.0150.012
Cable line0.2702.700.2551.020.3390.280
Table 2. DG parameters.
DGTypeCapacity/(MW)Transmission Length/(km)
DG1Wind farm58
DG2Photovoltaic power station0.45
DG3Photovoltaic power station0.44
Table 3. DG parameters.
Variable ResistorResistance/ΩDC PowerVoltage/kV
R n , R p 250–350 V n , V p 3.05–3.77/3.91–4.63
300–4003.24–3.96/4.10–4.82
350–450
400–500
450–5504.05–4.77/4.91–5.63
Table 4. Simulation sample parameters.
Sample TypeHIFCSLSNLLSIC
Positionf1f17Bus barBus barl2l5l2l5
Initial phase angle0°, 30°, 60°, 90°, 120°, 150°
PhaseABC
Parameter values0.5 kΩ1200 kvar0.25 MW3 kV8/20 μs
2 kΩ
4 kΩ2400 kvar0.75 MW
6 kΩ6 kV5/320 μs
8 kΩ4800 kvar1 MW
10 kΩ
Sample size18365454144144
Table 5. Training and execution times of different models.
ModelTraining Time/minExecution Time/ms
SDP+CNN7.112.07
TFS+CNN6.351.85
TFS+VGG1625.374.26
SDP+VGG1620.853.74
SDP+SE+VGG1635.464.93
The proposed40.126.58
Table 6. Detection results under different fault conditions.
Neutral Point Grounding MethodFault Initial Phase Angle/(°)Transition Resistance/(kΩ)Fault Location/(km)Accuracy/(%)
Ungrounded302l2, 499.98
l7, 16.5100
l15, 5.5100
Neutral point earthed by high resistance04l11, 14.599.97
6099.98
12099.99
Neutral point earthed via arcing coil (compensation 10%)602l11, 14.599.99
699.97
1099.96
Table 7. Detection results under noise interference.
Sample Signal-to-Noise Ratio SNR(dB)Fault Initial
Phase Angle/(°)
Transition
Resistance/(kΩ)
Fault Location/(km)Accuracy/(%)
50303l1, 1.5100
406010l4 11.5100
3590500l8 1799.99
201206l9 699.98
1015050l17 1399.97
21801l21 2199.95
Disclaimer/Publisher’s Note: The statements, opinions and data contained in all publications are solely those of the individual author(s) and contributor(s) and not of MDPI and/or the editor(s). MDPI and/or the editor(s) disclaim responsibility for any injury to people or property resulting from any ideas, methods, instructions or products referred to in the content.

