Article

Experimental Research on Behavior of Spontaneous Imbibition and Displacement After Fracturing in Terrestrial Shale Oil Based on Nuclear Magnetic Resonance Measurements

State Key Laboratory of Petroleum Resources and Prospecting, China University of Petroleum (Beijing), Beijing 102249, China
*
Author to whom correspondence should be addressed.
Processes 2024, 12(12), 2685; https://doi.org/10.3390/pr12122685
Submission received: 18 November 2024 / Revised: 26 November 2024 / Accepted: 27 November 2024 / Published: 28 November 2024
(This article belongs to the Section Energy Systems)

Abstract

:
Spontaneous imbibition (SI) effectively enhances oil recovery in shale reservoirs, significantly changing well shut-in and flowback design. This study conducted SI and displacement experiments to simulate the well shut-in and flowback stages so that the mechanism of imbibition and displacement between crude oil and fracture fluid can be discussed. In addition, the relative contribution to oil recovery of different types of pores in various stages and the effect of wettability were determined with low-field nuclear magnetic resonance (LF-NMR) via each sample’s T2 transverse relaxation time at each time. The experimental results show that shale has multiscale pore structure characteristics combined with micropores, small mesopores, and mesopores. During the SI process, crude oil is displaced from micropores by fracture fluid at first, and then a large amount of oil production comes from small mesopores. Oil recovery of water-wet core samples is approximately 40.7%. Oil recovery of oil-wet core samples is about 26%. The wettability significantly affects the imbibition and displacement oil recovery of samples. For the process of SI, oil recovered from small mesopores takes the lead in the complete sample recovery. For the displacement process, oil recovered from small mesopores and mesopores take the lead in the complete sample recovery. After displacement, only 12% of fracture fluid flooded from the samples. This research, demonstrating the imbibition and displacement characteristics of terrestrial shale and several relevant affecting factors, contributes to understanding the fracturing fluid retention mechanism in shale reservoirs and provides crucial theoretical foundations for the development of shale oil reservoirs.

1. Introduction

As the recoverable reserves of conventional oil and gas resources decrease yearly, shale oil, as a highly potential new unconventional resource, has become an important component of global resources. Chinese recoverable shale oil resources rank third in the world, with about 32.2 billion barrels, accounting for about 8% of the world’s recoverable shale oil resources. Drilling and hydraulic fracturing of long horizontal wells in low-permeability (shale) unconventional reservoir rocks has resulted in a revolution in hydrocarbon production in the span of 20 years in China and elsewhere [1]. Through large-scale and multi-cluster fracturing, hydraulic fractures can communicate and expand natural fractures or induce fractures to produce secondary micro-fractures. Hence, an interconnected complex fracture network is formed to increase reservoir reconstruction volume and significantly improve single-well productivity. Compared with traditional fracturing technology, unconventional fracturing requires injecting a large volume of low-viscosity fracturing fluids like slickwater to create a complex fracture network near the horizontal well. Due to the low porosity and permeability characteristic in shale reservoirs, a large amount of fracturing fluid is retained in the reservoir, thus the low flowback efficiency [2,3,4]. However, the field data indicate that production well with a long shut-in time and low flowback efficiency has higher early-time productivity [4,5,6,7].
SI is partly responsible for the high volumes of fracturing fluid loss during long shut-in times of wells. The trapped fracture fluid can displace the oil in the porous medium through SI, which mainly results from the capillary force during the shut-in period [8,9,10,11]. Therefore, the capillary force plays a significant role in the SI process of shale [12,13,14]. According to the flow directions of two fluids, SI can be classified into concurrent and countercurrent imbibition. Both modes have been deemed an effective EOR (enhance oil recovery) method to exploit naturally fractured, low-permeability, and shale oil reservoirs [6]. For the phenomenon of SI in porous media, the definition of two-phase (gas–water) SI was first proposed by Hand [15] and verified by experiments. The experimental results showed a linear relationship between the SI time and the square of the SI volume. Micro- and nano-scale pores are widely distributed in shale reservoirs. According to the relevant literature, how SI happens depends on the boundary conditions in some cases where other driving forces can be neglected (gravity or viscous forces). Because high-pressure fracturing fluids surround the rock matrix around the fracture, the SI process mainly occurs in countercurrent form [16,17,18,19]. Hence, many kinds of research were studied to figure out the mechanism of the oil displacement of countercurrent SI. The factors of core permeability, fluid properties, clay mineral difference, wettability alteration, and boundary conditions were also investigated to work out the influence of countercurrent SI [1,3,20,21]. The aforementioned research proved that the wettability of formation played a decisive role in the process of SI. Water-wet reservoirs have strong hydrophilicity and low resistance to water imbibition into the reservoir. More water can be imbibed into the reservoir. And the stronger the degree of water humidity, the better the SI effect. According to documentation, the strong water-wet formation had a shorter oil appearance time and higher initial oil production due to the stronger SI [22]. However, some scholars believe there is a potential for well productivity impairment or formation damage due to the loss of fracturing fluids into the rock matrix [23,24]. In addition, the boundary conditions and shape factors greatly influence ultimate oil recovery. There is little difference in UOR (ultimate oil recovery) under different boundary conditions in high-permeability core samples, while the SI rate is significantly affected by the capillary force. However, the water/rock interactions are more complex because the pore structure is more complicated in unconventional reservoirs. SI becomes more complex during the well shut-in time. So, recent research reveals an inverse correlation between the characteristic length and UOR in tight sandstone core samples [6,25].
Moreover, the experimental method is the most common one to study SI in the previous references, including (1) the volume method, (2) the weighing method, (3) the 1D glass tube, and (4) the 2D micro-model. The volume and weighing methods are two conventional methods to quantify oil production by SI. However, these two methods cannot identify the internal oil–water distribution in cores, which limits their application [16,18,19,26,27,28]. In recent years, more and more advanced techniques were also introduced to observe fluid distribution for SI, such as low-field nuclear magnetic resonance (LF-NMR) and X-ray CT scanning. LF-NMR measurement is regarded as an effective auxiliary tool in the petroleum field to analyze petrophysical properties, such as pore structure identification, well log testing, wettability clarity, and phase distribution observation [29,30,31]. Furthermore, an LF-NMR measurement is also used to study the UOR affected by the SI phenomenon quantitatively [32,33,34]. It is a fast and non-destructive method to characterize the absolute pore size distribution compared to other pore size measurement techniques [35]. Some scholars have compared the pore structure of tight sandstones between the LF-NMR measurement and MICP (mercury injection capillary pressure) [31]. The core tested by LF-NMR can still be used in experiments, which is irreplaceable and advantageous.
In addition, hydrocarbon migration in complex porous media can be reflected by the LF-NMR test. The signal is derived primarily from protons and magnetic field interactions. The most commonly used protons in the oil industry are hydrogen nuclei H1. The LF-NMR total signal is proportional to the fluid volume containing H1 (oil or water). In previous SI experimental research, D2O or MnCl2 solution is often used as experimental water, which the T2 signal cannot detect by LF-NMR. Kerosene, mixed oil, or perfluoro compound oil was always used in previous SI experimental research [3,34,36,37]. However, the interfacial tension between simulated oil and water differs significantly from crude oil and water. The simulated oil cannot reflect the real oil–water interaction in reservoir conditions. And few studies are available on SI with crude oil in shale reservoirs with experiments and LF-NMR testing.
In this paper, a comprehensive study of SI and oil–water displacement is conducted with the LF-LF-NMR technique to reveal the internal mechanism of imbibition during the well shut-in time in shale oil reservoirs. First, the core samples were tested to clarify their petrophysical properties (mineral content, porosity, and permeability) using X-ray diffraction (XRD) and pulse decay methods. Then, the core samples were treated to create irreducible water by the displacement method. After that, the SI experiments were performed under LF-NMR testing using real fracturing fluid and crude oil. Finally, the perfluoro compound was used to drive the samples after SI to understand the retention of fracturing fluid, qualitatively revealing the well shut-in and flowback processes and quantitatively characterizing the oil recovery and the percentage of fluid retained. Implications of the results for increasing the initial productivity of wells in shale oil reservoirs are also discussed. This will also provide guidance for the well shut-in and flowback design.

2. Materials

2.1. Core Samples

In this study, six core samples selected from the Jimsar shale formation in the Jungar Basin, China, were chosen in the experiments. The basic properties of the target rock samples shown in Table 1 were measured by the corresponding test methods. The entire cleaning process lasts approximately 6 weeks. Before the measurements, preparatory work is needed to clean the core samples as listed [25]:
  • Put the rock samples and toluene and methanol into the Soxhlet extractor.
  • Distill until the Soxhlet extractor’s liquid becomes colorless and transparent.
  • Soak the rock samples for 8 h. If there is no obvious change in the liquid, stop the experiment; otherwise, repeat Steps 2 and 3.
  • Dry the core samples at 105 °C for 48 h.
  • Gas porosity was determined by the helium porosity method.
  • Gas permeability was determined using a pulse decay permeameter by nitrogen conducted at a net confining pressure of 2.07 MPa at 25 °C.

2.2. Fluid Properties

The experimental oil throughout the SI experiment was degassed crude oil taken from the production well wellhead. Deuterium oxide (D2O), purchased from Aladdin Biochemical Technology, with a purity of 99.9% atom D, was used as a solvent for making fracturing fluids. The oil in the displacement experiment was the perfluoro compound (BAF-1) purchased from Sinopec Lubricant Company Limited. Deuterium oxide (D2O) water and perfluoro oil are substances that do not generate NMR signals in a magnetic field. Deuterium oxide (D2O) water has the same physical and chemical properties as ordinary water (1H2O). Hence, the NMR signals were generated only from crude oil. Therefore, the interference of the water signal is eliminated, and the migration of oil in the pores during countercurrent imbibition can be observed using the NMR instrument. The physicochemical properties of crude oil, perfluoro compound, and deuterium oxide for imbibition and displacement are listed in Table 2.
The formation water was prepared in the lab with a salinity of 14,053 mg/L. To produce the fracturing fluids, 0.3% demulsifier, 0.3% cleanup additive, 0.2% swelling inhibitor, and 0.02% gel breaker were added to the deuterium oxide.

3. Experiment and Methods

The core experimental procedure in this study is shown in Figure 1.

3.1. XRD Analysis

Bulk and clay mineralogies of core samples were investigated using a TTR III multifunctional X-ray diffractometer by the “K-value method”. The experimental procedure followed the standard experimental procedure. The result of XRD is discussed in the section on results.

3.2. Contact Angle Measurements

Contact angle measurement is the most widely used method to determine wettability between two- and three-phase because of the simple principle and intuitive process. This study used a sessile drop method using a contact angle tester (drop shape analyzer, KRüSS DSA-52S: contact angle measurement range: 0–180°, resolution: 0.01°) to measure contact angle. Before measurements, core samples were polished with 600-mesh, 800-mesh,1500-mesh, and 2000-mesh polishers and then aged in oil for at least 300 h at reservoir temperature. After that, the core samples were reduced to indoor temperature for cooling. Then, the core sample was set on the top of the quartz box, which was filled with formation water. The U-shaped needle tube is placed 1~2 cm below the sample. Then, a drop (1~2 μL) of crude oil was dripped on the core sample. Finally, the oil drops spread stably on the rock surface. About one hour later, the oil–water-core three-phase system contact angle was calculated from a camera screenshot (Figure 2).

3.3. LF-NMR Measurements

Carr−Purcell−Meiboom−Gill (CPMG) pulse sequences were used in the LF-NMR test. T2 distributions were inversed by SIRT (simultaneous iterative reconstruction technique) inversion algorithms. The measurements were performed using an LF-NMR core analysis system (SPEC-RC035) with a magnetic field intensity of 0.23 T + 0.03 T (proton resonance frequency 10 MHz). The major testing parameters included dominant frequency (14.06 MHz), echo spacing (TE = 100 us), polarization time (TW = 3000 ms), echo number (NECH = 4096), number of scans (SCAN = 64), and sample time (DW = 1 us).
LF-NMR transverse relaxation time (T2) in porous media is generally governed using the following equation:
1 T 2 = 1 T 2 , b u l k + 1 T 2 , s u r f a c e + 1 T 2 , d i f f u s i o n
where T2,bulk represents the relaxation time measured in an infinite container, ms; T2,surface represents the relaxation time caused by surface relaxation, ms; T2,diffusion represents the relaxation time due to diffusion under magnetic field gradient, ms.
Due to the small pore size in shale reservoirs, T2,bulk, and T2,diffusion are close to zero and generally not considered. So, the equation can be rewritten as follows:
1 T 2 = 1 T 2 , s u r f a c e = ρ S V p o r e = ρ C R
where ρ is surface relaxivity, um/ms; S is pore surface area, cm2; V is pore volume, cm3; R is pore radius, mm; C is a constant parameter (C ¼ 1, 2, 3 stand for the planar, cylindrical, and spherical model, respectively); the amplitude of spin echo string attenuation can be accurately fitted by the sum of a set of exponential attenuation:
S t = A i exp t T 2 i
where S(t) is the echo amplitude at time t; Ai is the signal size at zero time of the i component; T2i is the transverse relaxation time of the i relaxation component.

3.4. Oil–Water T2 Contrast Measurements

In past research, white oil, kerosene, or perfluoro compound oil were used in the SI experiment because of their low viscosity. The oil–water contrast experiment was designed to prove that crude oil can also be used as the experimental oil. The detailed procedure is as follows:
  • Put the core sample into a vacuum dish for vacuum pumping, then add simulated formation water made of H2O to the dish to continue vacuum pumping, and finally, pressurize saturated with formation water.
  • Measure the T2 distribution of the core sample after saturated water.
  • Dry the core samples at 105 °C for 6 h.
  • Put the core sample into a vacuum dish for vacuum pumping, then add simulated formation water, which is made of D2O, to the dish to continue vacuum pumping, and finally, pressurize saturated with formation water.
  • The core is saturated to irreducible water saturation by displacement with crude oil after the step.
  • Measure the T2 distribution of the core sample with irreducible water saturation.

3.5. SI Measurements

The procedure for SI experiments combined with the LF-NMR test at each time is as follows:
  • Put the core sample into a vacuum dish for vacuum pumping, then add simulated formation water made of D2O to the dish to continue vacuum pumping and pressurize saturated with formation water.
  • Place the saturated water core sample into the holder and drive it at a constant speed of 0.01 mL/min until continuous crude oil flows out from the outlet and the displacement process is complete. Then, place the displaced saturated core sample into an intermediate container containing crude oil and set a pressure of 40 MPa to pressurize the saturated crude oil. Age in oil for at least 300 h at 80 °C.
  • Measure the T2 distribution of the core sample with irreducible water saturation.
  • The core is placed into a corresponding vessel containing break fracturing fluids vertically, ensuring the total core is immersed in the fluids. Put the experiment vessel at 80 °C thermostats, and the starting time is recorded for each sample.
  • The core is taken out from the vessel at a specific time, and surface fluids are instantly removed using test paper. Seal the core with PTFE tape to reduce fluid evaporation.
  • Measure the T2 distribution of the core sample until the core temperature drops to room temperature. Then, put the sample back into the vessel to continue the imbibition process until the next specific time point.
  • Repeat Steps 4 through 6 until the end of the experiment. The whole experiment lasts for 21 days.

3.6. Displacement Measurements

In order to measure the flowback of fracturing fluid and crude oil during displacement, perfluoro oil is used in the displacement process as a non-nuclear magnetic signal displacement fluid. The procedure for oil displacement experiments combined with the LF-NMR test is as follows:
  • Measure the T2 distribution of the core sample after the SI experiment as the initial displacement spectrum.
  • Put the core sample into the core holder. Set constant flow 0.03 mL/min for displacement with tracking confining pressure to 3 MPa at 80 °C; the perfluoro compound oil is used for constant flow displacement. Place a measuring cylinder at the outlet end of the core holder to measure the volume of displaced fracturing fluid.
  • Displace 10 PV perfluoro compound oil and take the core sample out of the core holder after the expelled liquid is pure and transparent. Seal the core with PTFE tape to reduce fluid evaporation.
  • Measure the T2 distribution of the core sample until the core temperature drops to room temperature.
As the imbibition process is water absorption and oil drainage, there is a difference in the nuclear magnetic resonance signal quantity between the inhaled fracturing fluid and the discharged crude oil. Hence, the nuclear magnetic resonance signal quantity of the core gradually decreases. The imbibition oil recovery, imbibition recovery rate, and flowback ratio at each time can be calculated as the following equations [22]:
R o = T 2 t 0 T 2 t n T 2 t 0
v = Δ R o Δ t = R o 2 R o 1 t 2 t 1
f r = V w d V w i
where Ro is imbibition oil recovery, %; T 2 t 0 is the area formed by the T2 spectrum and x-axis at the initial time of t0, which represents the relative content of crude oil in the core at the initial time; T 2 t n is the area formed by the T2 spectrum and x-axis at the initial time of tn which represents the relative content of crude oil in the core at the initial time; v is imbibition recovery rate, %/h; fr is flowback ratio, %; Vwd is displaced fracturing fluid, cm3; Vid is imbibition fracturing fluid volume, which is equal to the displaced oil volume, cm3.

4. Results and Discussion

4.1. Mineral Composition Result from XRD Experiments

Figure 3 shows the XRD analysis result of bulk-rock mineralogy for six core samples. Table 3 shows the specific numerical values measured in XRD in the experiment. The mineral content for the core samples mainly consists of quartz (10.6 to 21.7 wt%) and feldspar (50.5 to 60.8 wt%) and contains moderate amounts of dolomite (5.5 to 12.6 wt%), pyrite (1 to 5.8% wt%), and clays (2.3 to 7.9 wt%). Clay mineralogy can be categorized into three types: smectite (70 to 85% wt%), illite (10 to 20 wt%), and mixed-layer chlorite/smectite (5 to 30%).

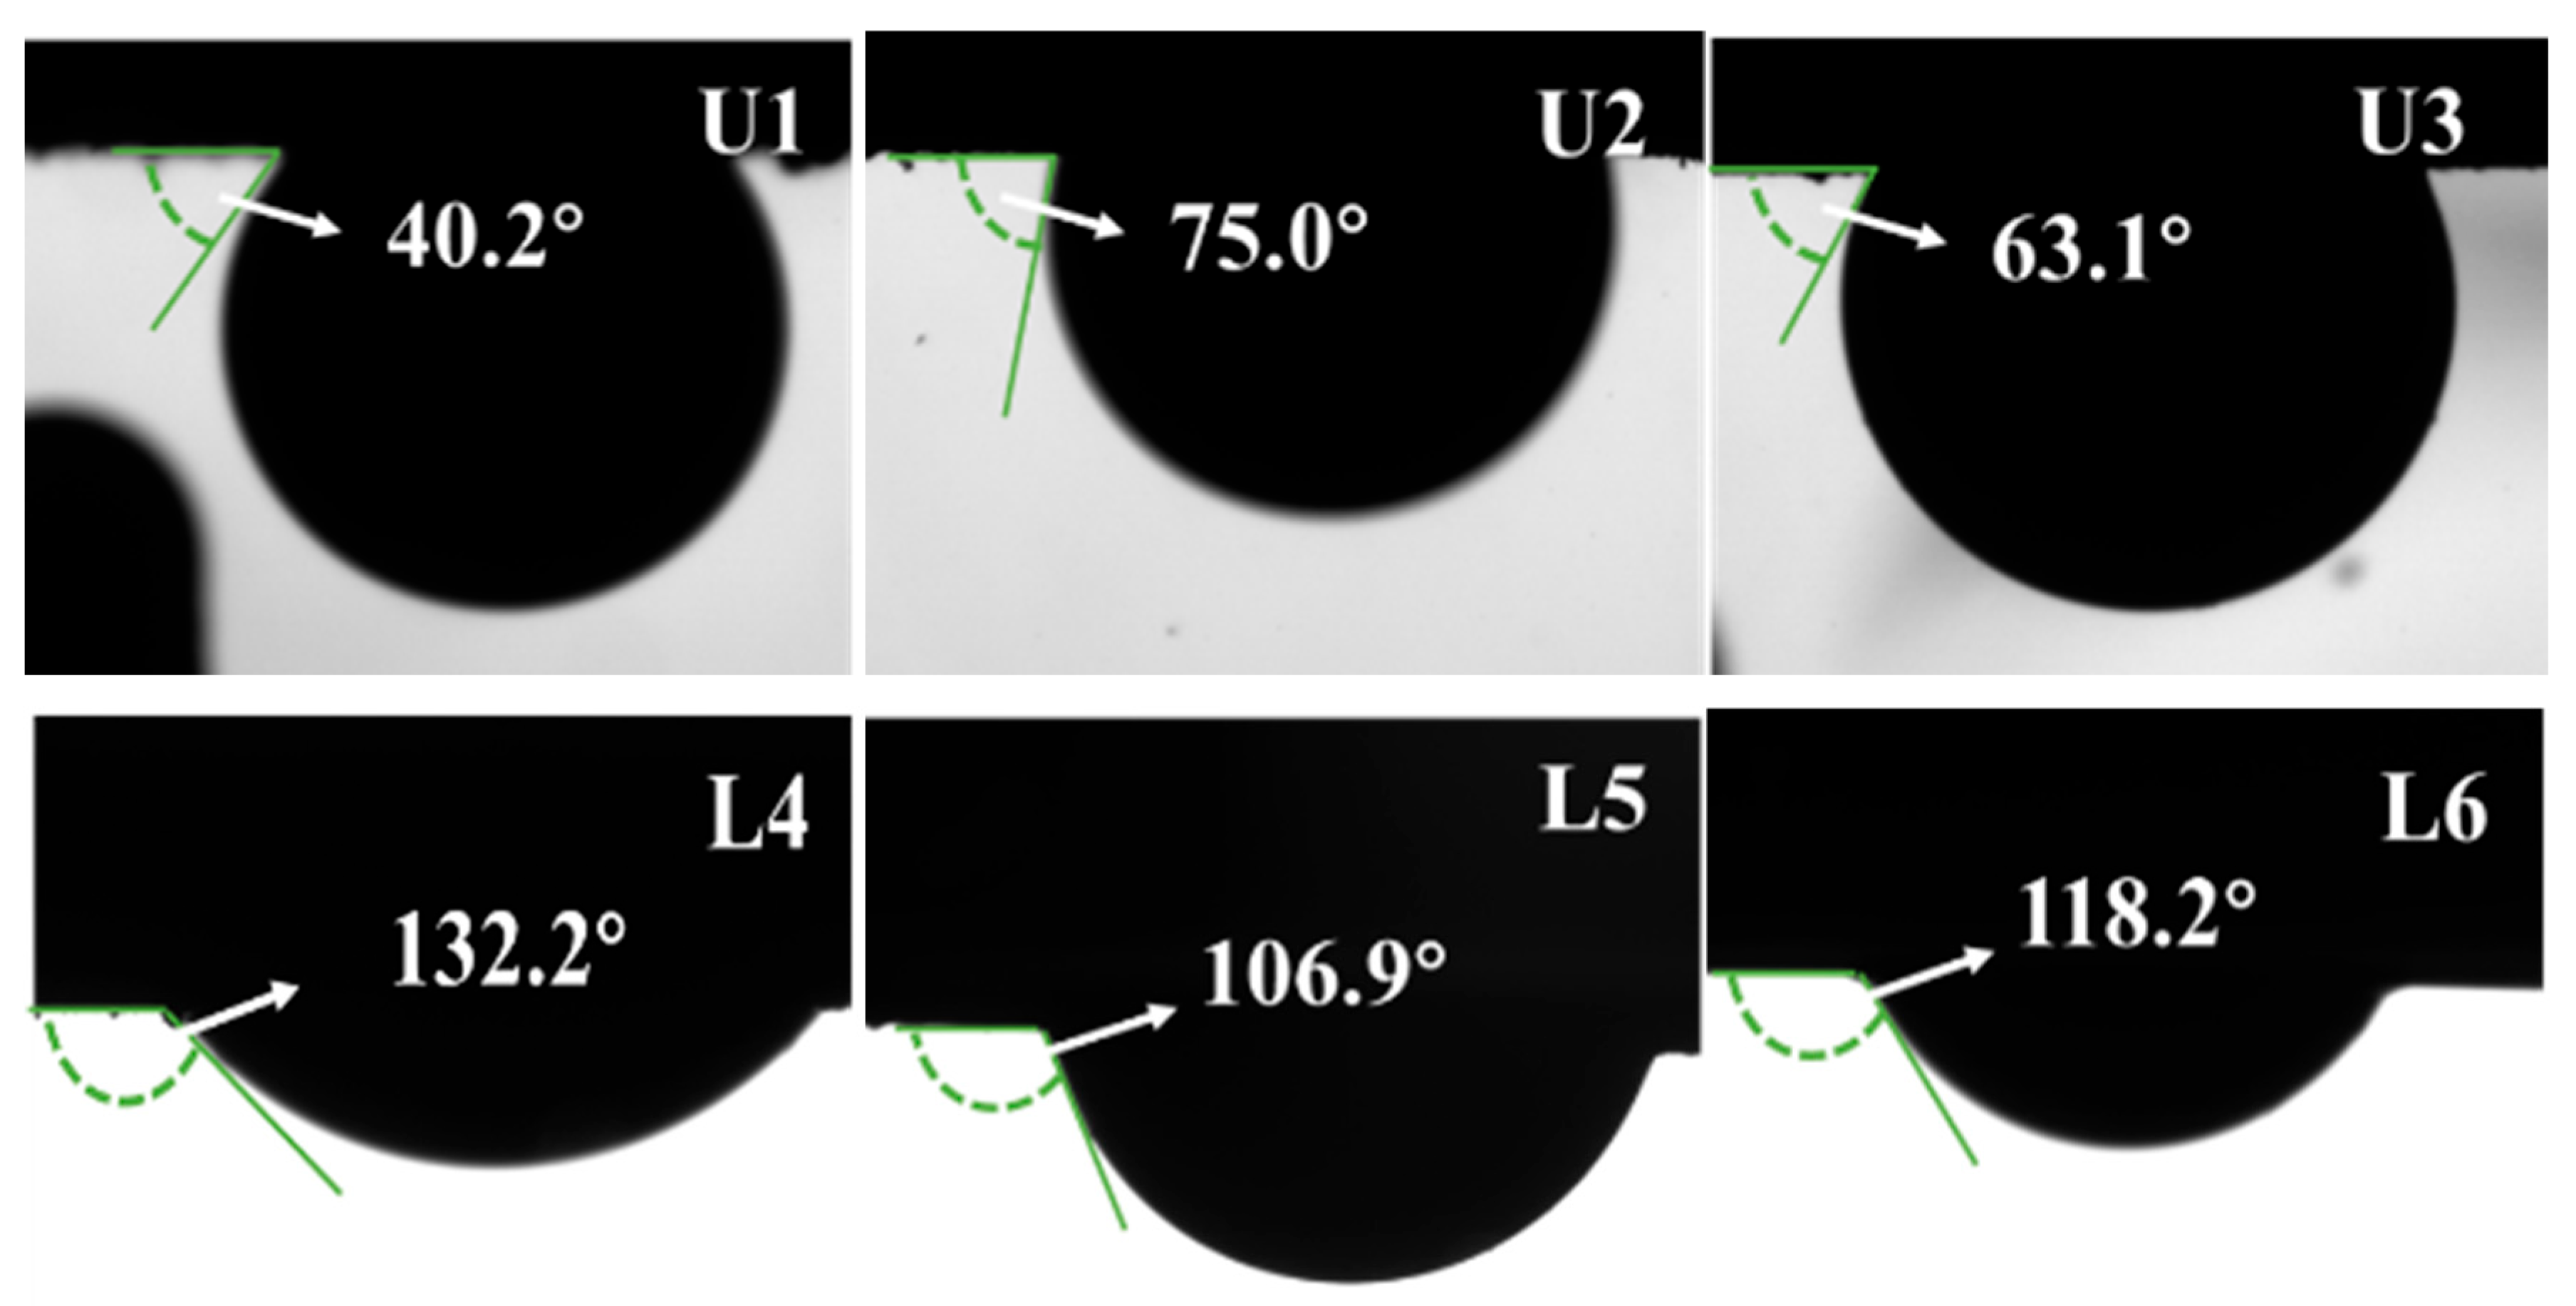
4.2. The Results of Contact Angle Measurements

E.J. Peters proposed that a system was defined as water-wet when the contact angle was between 0° and 60°–75°. The system was defined as oil-wet when the contact angle ranged from 105°–120° to 180°, and neutral-wet was defined when the contact angle was in the range of 75°–105° [38]. The oil–water core’s three-phase contact angle is measured by constant temperature immersion and sample aging of crude oil to reduce the three-phase contact angle of the reservoir under formation conditions. In this study, the three-phase contact angle of the oil–water core was measured. The experimental method restores the three-phase contact angle under the reservoir condition. The contact angle (Figure 4) was 40.2°, 75°, 63.1°, 132.2°, 106.9°, and 118.2°, respectively. Thus, the samples of U1, U2, and U3 were water-wet. The samples of L4, L5, and L6 were oil-wet. The fracturing fluid–oil sample contact angles were 98.3°, 94.0°, and 93.3° (Figure 5). The wettability of No. 4, 5, and 6 cores became neutral wettability. The fracturing fluid can effectively change the wettability of oil-wet samples.

4.3. Oil–Water T2 Spectrum Contrast from Experiment

Figure 6 shows the T2 spectrum of a core sample with H2O and crude oil. The measurement results of transverse relaxation time show that the left side of the T2 spectrum peak after saturated water accounts for 59% of the total area, and the left side of the T2 spectrum peak after saturated crude oil accounts for 62% of the entire region. The dimensionless amplitude distribution of the T2 spectrum of core sample saturated crude oil and saturated water was the same. Then, the core samples saturated with crude oil can also identify the internal oil distribution in the shale cores.

4.4. T2 Relaxation Distribution Characterizes the Rock SI Process

The relation between T2 transverse relaxation time and pore radius is presented in Table 4, following the procedures [34,39]. The relaxation time can be divided into four intervals representing different pore types. Figure 6 presents the T2 distribution of six core samples during SI. The relaxation time of six core samples from 0.03 to 100 ms confirms three kinds of pores. It has been proven that shale core samples have multiscale pore structure characteristics. Figure 7 shows that the sample used in this experiment had three kinds of pores—micropore, small mesopore, and mesopore. The oil-saturated samples had the same trend of T2 curves, from which approximately one peak can be seen. The micropore area covered accounts for 23.6 to 25.3%. The small mesopore area covered accounts for 47.1 to 60.9%. The mesopore area covered accounts for 15.0 to 27.9%. Micropores and small mesopores take the dominant position of pores, accounting for about 80%, which agrees qualitatively with the results [6]. The L4, L5, and L6 samples had higher amplitude than the U1, U2, and U3 samples because of the higher porosity.
During SI, capillary force depends on the porous media’s fluid types and pore structure [40,41]. The capillary force shows an inverse proportional trend to the pore radius. So, the smaller the pore radius, the stronger the capillary force. Therefore, the water is prior imbibed into the micropores. However, Yang et al. [42,43] declare that the frictional resistance in the smaller pores might be higher. The frictional resistance is mainly caused by roughness on the pore and throat wall, poor connectivity between pores and throats, and boundary conditions of fluids. From the part of the spectrum with a relaxation time of less than 0.1 ms, it can be concluded that resistance significantly affects SI in shale media. Furthermore, the peak of the T2 curve moved to the right with the imbibition time in the water-wet samples but moved to the left in the oil-wet samples.
Because of the water-wet U1–U3 samples, the fracture fluids imbibed from the surface into the pores. The imbibed rate is faster than the displace rate due to the oil and fracture fluids difference. As a result, the residual oil will be partly distributed in the pores when fracture fluids outflow from pores ahead, as illustrated in Figure 8. Due to the unsigned fracturing fluid covering the rock surface, crude oil exists in the form of small oil droplets. It means that the small oil droplets in the larger pores here were detected as preserved oil in the smaller pores. The wettability of L4–L6 samples used here was oil-wet. But, considering that fracturing fluid can change the wettability of samples, the wettability was neutral-wet. The mesopore has lower frictional resistance, so the fracture fluid entered the mesopore first. Additionally, the contact angle of U1–U3 samples is smaller than that of L4–L6 samples. Therefore, the ultimate T2 spectra moved to the left or right, mainly distributed in the interval of small mesopores.

4.5. Imbibition Oil Recovery and Imbibition Rate

Figure 9 shows imbibition oil recovery and rate in all kinds of pores under different SI times. The imbibition oil recovery and rate were calculated by Equation (4) and Equation (5), respectively. The initial T2 amplitude in Figure 6 represents the initial oil content in each type of pore. The oil recovery within the micropore, small mesopores, and mesopores for all water-wet samples gradually rose during the SI experiment. In the early periods (less than 14 h), the water is imbibed into the samples rapidly at the max rate of about 10%/h for the upper and 2% for the lower. The high rate of imbibition oil rate because of the bigger capillary fore is caused by the low water saturation. With more and more fracture fluids imbibed into the core samples, the imbibition oil rate decreases rapidly, which could result in an increase in water saturation and a reduction in oil mobility during countercurrent imbibition. After 100 h, the oil recovery for all types of pores increased slowly.
Figure 10 shows the specific values of imbibition oil recovery for different types of pores. For the water-wet core samples, approximately 50% of the crude oil in the micropore is displaced by fracture fluids, 30% for small mesopore, and 10% for the mesopore. But, for the absolute amount of oil, approximately 50% of the recovered oil comes from small mesopores, 35% from the micropore, and 15% from the mesopore. The oil recovery and oil recovery rate in micropores are the highest, but the absolute amount of oil recovered from small mesopores takes the lead in the whole sample recovery. The results are consistent with the conclusion in Figure 7 that the small mesopores take the dominant position of pores in oil production. Also, the previous analysis can clarify the difference between the oil recovery in different pores (Figure 8). SI can effectively produce oil from micropores by the capillary force.
For the oil-wet core samples, approximately 15% of the total oil in the micropore is displaced by water, 14% for the small mesopore, and 18.6~35% for the mesopore. But, for the absolute amount of oil, approximately 50% of the recovered oil comes from small mesopores, 25% from the micropores, and 25% from the mesopores. Because the fracture fluid entered the mesopore first, the oil recovery in mesopores is the highest. The oil recovery in the oil-wet sample was smaller than in the water-wet samples because of the wettability. Oil-wet samples have little potential for water imbibition and oil displacement. However, the imbibition potential can be trapped through wettability inversion.

4.6. Displacement Oil Recovery and Flowback Ratio

Figure 11 presents the T2 distribution of six core samples before and after perfluoro oil flooding. The displacement process represents the flowback and production physical stage, indicating that the oil far from the well is displaced to the matrix near the fracture system. Due to the pressure difference, crude oil and fracture fluid retained in the sample are gradually displaced by perfluoro oil, which represents the crude oil far from the well. This process represents the physical process of flowback and long-term production. Then, the signal amplitude of T2 decreased remarkably. For all samples, the amplitude for the right side of the peak declined faster than that for the left side, which slightly decreased. This phenomenon indicates that oil is mainly produced from the small mesopores and mesopores. The pore production size of the water-wet samples is significantly smaller than that of the oil-wet samples. The permeability difference between the water-wet and oil-wet supports the above conclusion.
Figure 12 shows displacement oil recovery in all types of pores of displacement. The displacement oil recovery and flowback ratio were calculated by Equation (4) and Equation (6), respectively. The 500 h T2 amplitude in Figure 6 represents the initial oil content in each type of pore. For the water-wet core samples, approximately 5.6% of the total oil in the micropore is flooded by perfluoro oil, 5.0% within the small mesopore, and 17% for the mesopore. But, for the absolute amount of oil, approximately 20% of the recovered oil comes from small mesopores, 22% from the micropore, and 57% from the mesopore. The oil recovery in mesopores is the highest, and oil recovered from mesopores takes the lead in the complete sample recovery. The results are consistent with the conclusion in Figure 11 that the mesopores take the dominant position of pores in oil production. Also, displacement can effectively produce oil from mesopores by the pressure difference. The oil in the mesopore has great potential to produce after SI. The residual oil formed during SI in micropores or detected as small pores cannot easily flood by the production.
For the oil-wet core samples, approximately 1.4% of the total oil in the micropore is flooded by perfluoro oil, 9.5% within the small mesopore, and 12% for the mesopore. But, for the absolute amount of oil, approximately 68.5% of the recovered oil comes from small mesopores, 27.5% from the mesopore, and 4% from the micropore. The oil recovery in mesopores is the highest, but the absolute amount of oil recovered from small mesopores takes the lead in the complete sample recovery. Mesopore recovery is the highest because of the largest pore size and smallest seepage resistance. The proportion of small mesopores is the largest, so the absolute amount of oil from small mesopores is the largest. The residual oil is distributed in the micropore and small oil droplets in the small mesopores. So, there is huge potential to enhance oil recovery from micropores. Oil trapped in micropores should be seen as a direction for improving oil recovery in lower sweet spot reservoirs.
Figure 13 shows different samples’ imbibition recovery, displacement recovery, and flowback ratio. As the results show, the oil recovery of water-wet core samples is approximately 40.7%. The oil recovery of oil-wet core samples is about 26%. The wettability significantly affects the oil recovery in shale reservoirs. About 12% of fracture fluid flooded from the samples. A large amount of fracturing fluid is trapped in the formation, which cannot be produced to the surface. The phenomenon is consistent with the low flowback ratio of the actual well in the shale oil well production data in the past ten years.

5. Conclusions

In this paper, the characteristics of crude oil/fracture fluid imbibition and displacement in various pores in shale oil reservoirs were investigated with imbibition and displacement experiments combined with LF-NMR and some other physic testing. Based on the results presented in this study, we have resealed the mechanism of the imbibition and displacement on oil recovery enhancement; conclusions can be obtained as follows:
  • The imbibition oil recovery rate is fast in the early stage of SI, and oil recovery begins to increase steadily and slowly after 100 h. The high imbibition recovery indicates that the shale has a specific imbibition potential.
  • The crude oil present in the pores is gradually displaced by fracturing fluid because of the capillary force, but the contribution of oil recovery mainly comes from these small mesopores and mesopores. Water-wet core samples’ imbibition oil recovery is about 31.9%; oil-wet core samples’ imbibition oil recovery is about 18.4%.
  • The fracturing fluid can effectively change the wettability of oil-wet samples. Oil recovery of water-wet core samples is approximately 40.7%. The oil recovery of oil-wet core samples is about 26%. The wettability significantly affects samples’ imbibition and displacement oil recovery. The additives added to the fracture fluid can effectively alter the wettability of samples from oil-wet to intermediate.
  • Oil in small mesopores and mesopores can be effectively displaced. In total, 8% of oil can be flooded from core samples after displacement. After displacement, a large amount of imbibed fracture fluid is trapped in the shale sample pore. Only 12% of fracture fluid flooded from the samples.
  • These results demonstrate the imbibition and displacement characteristics of terrestrial shale and several relevant affecting factors and provide guidance for the optimization of fracturing flowback.

Author Contributions

Methodology, J.Z.; Software, X.M.; Validation, S.Z.; Investigation, F.W.; Writing—original draft, J.Z. and F.W. All authors have read and agreed to the published version of the manuscript.

Funding

This work is supported by the National Natural Science Foundation of China (No. 51974332).

Data Availability Statement

The data presented in this study are available on request from the corresponding author. The data are not publicly available due to data coming from oilfield confidential documents.

Conflicts of Interest

The authors declare no conflicts of interest.

References

  1. Mason, G.; Morrow, N.R. Developments in Spontaneous Imbibition and Possibilities for Future Work. J. Pet. Sci. Eng. 2013, 110, 268–293. [Google Scholar] [CrossRef]
  2. Makhanov, K.; Habibi, A.; Dehghanpour, H.; Kuru, E. Liquid Uptake of Gas Shales: A Workflow to Estimate Water Loss during Shut-In Periods after Fracturing Operations. J. Unconv. Oil Gas. Resour. 2014, 7, 22–32. [Google Scholar] [CrossRef]
  3. Lin, H.; Zhang, S.; Wang, F.; Pan, Z.; Mou, J.; Zhou, T.; Ren, Z. Experimental Investigation on Imbibition-Front Progression in Shale Based on Nuclear Magnetic Resonance. Energy Fuels 2016, 30, 9097–9105. [Google Scholar] [CrossRef]
  4. Chen, X.; Liao, K.; Lv, Z.; Zhu, J.; Wang, J.; Li, Y.; Wang, F. Numerical Simulation Study on Optimal Shut-In Time in Jimsar Shale Oil Reservoir. Front. Energy Res. 2022, 10, 849064. [Google Scholar] [CrossRef]
  5. Progress and development trend of water huff-n-puff technology for horizontal wells in tight oil reservoirs in China Pu, C. Acta Petrolei Sin. 2023, 44, 188–206.
  6. Ghanbari, E.; Dehghanpour, H. The Fate of Fracturing Water: A Field and Simulation Study. Fuel 2016, 163, 282–294. [Google Scholar] [CrossRef]
  7. Fu, L.Q.; Chen, H.A.; Lan, Y.B.; Deng, S.; Dong, D. Experimental Research on Transformation from Huff-n-Puff Imbibition to Displacement of Tight Sandstone with NMR; Springer Series in Geomechanics and Geoengineering; Springer Nature: Singapore, 2024; pp. 940–953. [Google Scholar]
  8. Wijaya, N.; Sheng, J.J. Shut-In Effect in Removing Water Blockage in Shale-Oil Reservoirs with Stress-Dependent Permeability Considered. SPE Reserv. Eval. Eng. 2020, 23, 81–94. [Google Scholar] [CrossRef]
  9. Hatiboglu, C.U.; Babadagli, T. Primary and Secondary Oil Recovery From Different-Wettability Rocks by Countercurrent Diffusion and Spontaneous Imbibition; Society of Petroleum Engineers: Houston, TX, USA, 2006. [Google Scholar] [CrossRef]
  10. Yaich, E.; Williams, S.; Bowser, A.; Goddard, P.; Souza OD, D.; Foster, R.A. A Case Study The Impact of Soaking on Well Performance in the Macelts. In Proceedings of the Unconventional Resources Technology Conference, San Antonio, TX, USA, 20–22 July 2015. [Google Scholar] [CrossRef]
  11. Wang, M.; Leung, J.Y. Numerical Investigation of Coupling Multiphase Flow and Geomechanical Effects on Water Loss During Hydraulic Fracturing Flow Back Operation. SPE Reserv. Eval. Eng. 2015, 19, 520–537. [Google Scholar] [CrossRef]
  12. Kerunwa, A.; Onyekonwu, M.O.; Anyadiegwu CI, C.; Olafuyi, A.O. Spontaneous Imbibition in Niger Delta Cores; Society of Petroleum Engineers: Houston, TX, USA, 2016. [Google Scholar] [CrossRef]
  13. Olafuyi, O.A.; Cinar, Y.; Knackstedt, M.A.; Pinczewski, W.V. Spontaneous Imbibition in Small Cores. In Proceedings of the Asia Pacific Oil and Gas Conference and Exhibition, Jakarta, Indonesia, 30 October–1 November 2007; p. SPE-109724-MS. [Google Scholar] [CrossRef]
  14. Habibi, A.; Binazadeh, M.; Dehghanpour, H.; Bryan, D.; Uswak, G. Advances in Understanding Wettability of Tight Oil Formations. In Proceedings of the SPE Annual Technical Conference and Exhibition, Houston, TX, USA, 28–30 September 2015; p. SPE-175157-MS. [Google Scholar] [CrossRef]
  15. Cheng, Z.; Wang, Q.; Ning, Z.; Li, M.; Lyu, C.; Huang, L.; Wu, X. Experimental Investigation of Countercurrent Spontaneous Imbibition in Tight Sandstone Using Nuclear Magnetic Resonance. Energy Fuels 2018, 32, 6507–6517. [Google Scholar] [CrossRef]
  16. Handy, L.L. Determination of effective capillary pressures for porous media from imbibition data. Trans. AIME 1960, 219, 75–80. [Google Scholar] [CrossRef]
  17. Yildiz, H.O.; Gokmen, M.; Cesur, Y. Effect of Shape Factor, Characteristic Length, and Boundary Conditions on Spontaneous Imbibition. J. Pet. Sci. Eng. 2006, 53, 158–170. [Google Scholar] [CrossRef]
  18. Kim, T.W.; Kovscek, A.R. The Role of Boundary Conditions and Characteristic Length on Imbibition in Both Sandstones and Limestones. In Proceedings of the SPE Western North American and Rocky Mountain Joint Meeting, Denver, CO, USA, 17–18 April 2014; p. SPE-169540-MS. [Google Scholar] [CrossRef]
  19. Lan, Q.; Ghanbari, E.; Dehghanpour, H.; Hawkes, R. Water Loss versus Soaking Time: Spontaneous Imbibition in Tight Rocks. Energy Technol. 2014, 2, 1033–1039. [Google Scholar] [CrossRef]
  20. Tinni, A.; Odusina, E.; Sulucarnain, I.; Sondergeld, C.; Rai, C.S. Nuclear-Magnetic-Resonance Response of Brine, Oil, and Methane in Organic-Rich Shales. SPE Res. Eval. Eng. 2015, 18, 400–406, SPE-168971-PA. [Google Scholar] [CrossRef]
  21. Roychaudhuri, B.; Tsotsis, T.T.; Jessen, K. An Experimental Investigation of Spontaneous Imbibition in Gas Shales. J. Pet. Sci. Eng. 2013, 111, 87–97. [Google Scholar] [CrossRef]
  22. Cao, G.; Cheng, Q.; Liu, Y.; Bu, R.; Zhang, N.; Wang, P. Influencing Factors of Surfactant Stripping Crude Oil and Spontaneous Imbibition Mechanism of Surfactants in a Tight Reservoir. ACS Omega 2022, 7, 19010–19020. [Google Scholar] [CrossRef]
  23. Ma, M.; Zhu, J.; Li, J.; Liao, K.; Wang, J.; Wang, F. Imbibition Law of Shale Oil Reservoirs in the Lucaogou Formation in Jimsar Sag. Xing Jiang Pet. Geol. 2021, 42, 702–708. [Google Scholar] [CrossRef]
  24. Peta, K. Multiscale Wettability of Microtextured Irregular Surfaces. Materials 2024, 17, 5716. [Google Scholar] [CrossRef]
  25. Sayed, A.M.A.E.; Sayed, N.A.E. Petrophysical Properties of Clastic Reservoirs Using NMR Relaxometry and Mercury Injection Data: Bahariya Formation, Egypt. IOP Conf. Ser. Earth Environ. Sci. 2016, 44, 042018. [Google Scholar] [CrossRef]
  26. Xu, G.; Shi, Y.; Jiang, Y.; Jia, C.; Gao, Y.; Han, X.; Zeng, X. Characteristics and Influencing Factors for Forced Imbibition in Tight Sandstone Based on Nuclear Magnetic Resonance Measurements. Energy Fuels 2018, 32, 8230–8240. [Google Scholar] [CrossRef]
  27. Shen, Y.; Ge, H.; Li, C.; Yang, X.; Ren, K.; Yang, Z.; Su, S. Water Imbibition of Shale and Its Potential Influence on Shale Gas Recovery-A Comparative Study of Marine and Continental Shale Formations. J. Nat. Gas. Sci. Eng. 2016, 35, 1121–1128. [Google Scholar] [CrossRef]
  28. Yang, L.; Ge, H.; Shi, X.; Cheng, Y.; Zhang, K.; Chen, H.; Shen, Y.; Zhang, J.; Qu, X. The Effect of Microstructure and Rock Mineralogy on Water Imbibition Characteristics in Tight Reservoirs. J. Nat. Gas. Sci. Eng. 2016, 34, 1461–1471. [Google Scholar] [CrossRef]
  29. Andersen, P.; Lohne, A.; Stavland, A.; Hiorth, A.; Brattekås, B. Core Scale Modeling of Polymer Gel Dehydration by Spontaneous Imbibition. SPE J. 2019, 24, 1201–1219. [Google Scholar] [CrossRef]
  30. Mai, A.; Kantzas, A. Porosity Distributions in Carbonate Reservoirs Using Low-Field NMR. J. Can. Pet. Technol. 2007, 46, 30–36. [Google Scholar] [CrossRef]
  31. Eslami, M.; Kadkhodaie-Ilkhchi, A.; Sharghi, Y.; Golsanami, N. Construction of Synthetic Capillary Pressure Curves from the Joint Use of NMR Log Data and Conventional Well Logs. J. Pet. Sci. Eng. 2013, 111, 50–58. [Google Scholar] [CrossRef]
  32. Zhao, H.; Ning, Z.; Zhao, T.; Che, F.; Zhang, R.; Hou, T. Applicability Comparison of Nuclear Magnetic Resonance and Mercury Injection Capillary Pressure in Characterisation Pore Structure of Tight Oil Reservoirs. In Proceedings of the SPE Asia Pacific Unconventional Resources Conference and Exhibition, Brisbane, Australia, 9–11 November 2015; p. SPE-177026-MS. [Google Scholar] [CrossRef]
  33. Meng, M.; Ge, H.; Ji, W.; Shen, Y.; Su, S. Monitor the Process of Shale Spontaneous Imbibition in Co-Current and Counter-Current Displacing Gas by Using Low Field Nuclear Magnetic Resonance Method. J. Nat. Gas. Sci. Eng. 2015, 27, 336–345. [Google Scholar] [CrossRef]
  34. Jiang, Y.; Shi, Y.; Xu, G.; Jia, C.; Meng, Z.; Yang, X.; Zhu, H.; Ding, B. Experimental Study on Spontaneous Imbibition under Confining Pressure in Tight Sandstone Cores Based on Low-Field Nuclear Magnetic Resonance Measurements. Energy Fuels 2018, 32, 3152–3162. [Google Scholar] [CrossRef]
  35. Liu, X.; Chen, H.; Yang, J.; Yang, S. Dynamic Behavior of Salt Dissolution and Its Effect on Imbibition in Inter-Salt Oil Reservoir Due to Fracturing Fluid Injection. In Proceedings of the SPE EuropEC—Europe Energy Conference featured at the 83rd EAGE Annual Conference & Exhibition, Madrid, Spain, 6–9 June 2022; p. SPE-209641-MS. [Google Scholar] [CrossRef]
  36. Wang, H.T.; Lun, Z. Nuclear Magnetic Resonance Study on Mechanisms of Oil Mobilization in Tight Reservoir Exposed to CO2 in Pore Scale. In Proceedings of the SPE Improved Oil Recovery Conference, Tulsa, OK, USA, 11–13 April 2016; p. SPE-179554-MS. [Google Scholar] [CrossRef]
  37. Liu, J.; Sheng, J. Investigation of Countercurrent Imbibition in Oil-Wet Tight Cores Using NMR Technology. SPE J. 2020, 25, 2601–2614, SPE-201099-PA. [Google Scholar] [CrossRef]
  38. Xu, G.; Han, Y.; Jiang, Y.; Shi, Y.; Wang, M.; Zeng, X. Reducing Residual Oil Saturation: Underlying Mechanism of Imbibition in Oil Recovery Enhancement of Tight Reservoir. SPE J. 2021, 26, 2340–2351, SPE-205491-PA. [Google Scholar] [CrossRef]
  39. Zou, C.; Zhu, R.; Bai, B.; Yang, Z.; Wu, S.; Su, L.; Quang, Đ.Đ.; Li, X. First Discovery of Nano-pore Throat in Oil and Gas Reservoir in China and Its Scientific Value. Acta Petrol. Sin. 2011, 27, 1857–1864. [Google Scholar]
  40. Gao, S.; Hu, Z.; Liu, H.; Ye, L.; An, W. Microscopic Pore Characteristics of Different Lithological Reservoirs. Acta Petrol. Sin. 2016, 37, 248–256. [Google Scholar]
  41. Jackson, M.D.; Valvatne, P.H.; Blunt, M.J. Prediction of wettability variation and its impact on flow using pore- to reservoir-scale simulations. J. Pet. Sci. Eng. 2003, 39, 231–246. [Google Scholar] [CrossRef]
  42. Valvatne, P.H.; Blunt, M.J. Predictive pore-scale modeling of two-phase flow in mixed wet media. Water Resour. Res. 2004, 40, 187. [Google Scholar] [CrossRef]
  43. Yang, L.; Ge, H.; Shen, Y.; Zhang, J.; Yan, W.; Wu, S.; Tang, X. Imbibition Inducing Tensile Fractures and Its Influence on In-Situ Stress Analyses: A Case Study of Shale Gas Drilling. J. Nat. Gas. Sci. Eng. 2015, 26, 927–939. [Google Scholar] [CrossRef]
Figure 1. Experimental flow chart of the main steps for the core samples.
Processes 12 02685 g001
Figure 2. Schematic of the experimental setup used for contact angle measurement.
Processes 12 02685 g002
Figure 3. Mineralogy of six core samples: (a) bulk-rock mineralogy; (b) relative content of clay mineralogy.
Processes 12 02685 g003
Figure 4. Water–oil-core three-phase contact angle for six shale samples.
Processes 12 02685 g004
Figure 5. Fracture fluid–oil-core three-phase contact angle for L4, L5, and L6.
Processes 12 02685 g005
Figure 6. T2 spectrum of a core sample with H2O and crude oil.
Processes 12 02685 g006
Figure 7. T2 spectra of different core samples during SI: (a) U1, (b) U2, (c) U3, (d) L4, (e) L5, and (f) L6. The crude oil present in the pores is gradually displaced by fracturing fluid during the SI experiment. Then, the signal amplitude of T2 decreased remarkably. The single crest decreased with the increase in SI time, but the decline of amplitude decreased with time. Taking U1 as a water-wet core example (Figure 8a), the amplitude for the left side of the peak dropped faster than that for the right side, which slightly decreased. This phenomenon indicates that oil is mainly produced from micropores and small mesopores. Nevertheless, with L4 as an oil-wet core example (Figure 7d), the T2 curve is just the opposite of that of the water-wet core sample. This implies that oil production mainly came from the small mesopores and mesopores.
Processes 12 02685 g007
Figure 8. (a) Schematic diagram of oil distribution in different pores before SI. (b) Schematic diagram of oil and water distribution in different pores after SI.
Processes 12 02685 g008
Figure 9. Recovery and rate versus different imbibition times under different core samples: (a) U1, (b) U2, (c) U3, (d) L4, (e) L5, and (f) L6.
Processes 12 02685 g009
Figure 10. The specific values of imbibition oil recovery for different types of pores.
Processes 12 02685 g010
Figure 11. T2 spectra of different core samples before and after displacement: (a) U1, (b) U2, (c) U3, (d) L4, (e) L5, and (f) L6.
Processes 12 02685 g011
Figure 12. The specific values of oil recovery for different types of pores.
Processes 12 02685 g012
Figure 13. The imbibition recovery, displacement recovery, and flowback ratio in different samples.
Processes 12 02685 g013
Table 1. The petrophysical properties of rock samples.
SampleLength (cm)Helium Porosity (%)Gas Permeability (mD)Confining Pressure (MPa)
U-13.329.80.03652.07
U-23.356.40.02822.07
U-33.347.30.01842.07
L-43.3213.00.00852.07
L-53.3715.00.01782.07
L-63.3515.00.01862.07
Table 2. Physicochemical properties of the fluids.
Fluid TypeDensity (g/cm3)Viscosity (mPa·s)Surface Tension (mN/m)
Crude oil (up)0.88840 (50 °C)51.07
Crude oil (low)0.902125 (50 °C)43.7
BAF-11.821.85 (25 °C)26.82
Deuterium oxide1.1051.12 (25 °C)72.75
Table 3. Specific numerical values of XDR experiment.
SampleQuartz + Feldspar + PyriteTotal CarbonatedTotal ClaySmectiteIlliteChlorite/Smectite
U-163.332.52.3751015
U-227.969.42.7701515
U-377.719.23.1502030
L-472.411.47.985105
L-579.212.97.9801010
L-675.519.94.6751510
Table 4. Relationship between T2 relaxation time, pore radius, and pore type [34,39].
T2 relaxation time, mspore radius, μmpore type
≤1≤2micropore
1 < T2 relaxation time ≤ 102 < pore radius ≤ 10small mesopore
10 < T2 relaxation time ≤ 10010 < pore radius ≤ 20mesopore
100 < T2 relaxation time ≤ 100020 < pore radius ≤ 200macropore
Disclaimer/Publisher’s Note: The statements, opinions and data contained in all publications are solely those of the individual author(s) and contributor(s) and not of MDPI and/or the editor(s). MDPI and/or the editor(s) disclaim responsibility for any injury to people or property resulting from any ideas, methods, instructions or products referred to in the content.

