Article

Analysis of the Effect of Structural Parameters on the Internal Flow Field of Composite Curved Inlet Body Hydrocyclone

1
School of Mechanical and Vehicle Engineering, Linyi University, Linyi 276000, China
2
Institute of Intelligent Manufacturing and Smart Transportation, Suzhou City University, Suzhou 215100, China
*
Authors to whom correspondence should be addressed.
Processes 2024, 12(12), 2654; https://doi.org/10.3390/pr12122654
Submission received: 24 October 2024 / Revised: 20 November 2024 / Accepted: 22 November 2024 / Published: 25 November 2024
(This article belongs to the Special Issue Fault Diagnosis Process and Evaluation in Systems Engineering)

Abstract

:
To enhance the classification efficiency of hydrocyclones, this study introduces a novel hydrocyclone design featuring a composite curved-inlet-body structure. Through numerical simulations, the internal flow field characteristics of this structure are thoroughly investigated. The results reveal several key findings: when the diameter of the overflow tube is reduced below a critical threshold, the axial velocity exhibits predominantly downward movement within the outer cyclone, accompanied by substantial recirculation, leading to a loss of effective separation. Moreover, both static pressure and tangential velocity are largely independent of the insertion depth of the overflow tube. In contrast, the diameter of the bottom flow opening plays a crucial role in determining flow dynamics within the hydrocyclone. An excessively large or small bottom opening leads to flow instabilities, causing fluctuations that disrupt the uniformity of the flow field. Additionally, a small height-to-diameter ratio exacerbates flow instability, increasing turbulence intensity and resulting in irregular fluctuations in the LZVV. These findings provide important theoretical insights for the design of more efficient hydrocyclone separation structures.

1. Introduction

The demand for highly refined classification processes has led to significant challenges for traditional hydrocyclone equipment, with low classification accuracy being a key limitation [1,2]. Hydrocyclones are widely used in grinding and classification operations due to their high efficiency in physical separation. However, particle–particle interactions within the cyclone lead to substantial mixing, which hinders the effective separation of particles. Currently, multiple classification stages and repeated ball milling are employed to enhance product quality. However, the phenomenon of “underflow pinch”—where fine particles are inadvertently entrained in the underflow—results in over-grinding, leading to poor concentrate recovery and considerable raw material waste [3,4,5,6,7,8]. For this reason, researchers have conducted extensive research. For example, S.P [9] predicted the separation performance of a cyclone. The present study focuses on performing multi-objective optimization of the cyclone separator geometry to lower the pressure losses and enhance the collection efficiency. For this, six geometrical entities, including the main body diameter of the cyclone, the vortex finder diameter and its insertion length, the cone tip diameter, and the height of the cylindrical and conical segments, are assessed for optimization, and the Muschelknautz method of modeling is used as an objective function for genetic algorithms. To date, this is one of the most popular mathematical models that accurately predicts cyclone performance. To achieve greater computational accuracy, a digital model of the cyclone made of specific volumetric elements is developed, thus expanding the grid and stepping to form a boundary zone. As a result, the numerical simulation results differ by no more than 12.8% compared to the results of other experimental studies [10]. In order to suppress particle deposition on the vortex finder, a series of gas cyclones with secondary swirling clean gas are developed, inspired by the gas purge effect. The results show that the ultrafine particles (Stokes number Stk < 0.0358) are mainly loosely deposited on the walls under the secondary gas. Compared to a conventional cyclone with a single tangential inlet, the total deposited particle mass of the improved cyclone has a maximum reduction of more than 60%, and the collecting efficiency is increased up to 97.5% under basically the same pressure drop. The corresponding no-deposition area is increased by about 13% and remains constant in spite of extending the running time. Moreover, an interesting phenomenon of the vortex finder named the “self-cleaning effect” is captured for the gas cyclones, and the mechanism of the secondary clean gas on the particle deposition is preliminarily analyzed. These results can deepen our understanding of particle deposition on the vortex finder and guide the design of anti-coking gas cyclones [11]. Consequently, minimizing underflow pinch and improving classification accuracy have become critical research challenges both domestically and internationally. The feed body plays a crucial role as the primary entry channel for multiphase flow into cyclones. A well-designed feed body structure facilitates the orderly arrangement and settling of particles, contributing to enhanced cyclone performance. This study proposes a novel composite curved-feed-body structure, composed of three distinct geometric profiles: a straight line, an involute line, and a vortex line. Notably, the junction between the vortex and involute lines is connected by a circular arc, while the feed body also incorporates a semi-cylindrical camber and a deflector plate. These design elements collectively accelerate the formation of the stable particle layer. The composite curved-feed-body offers several key advantages:
(1)
In the straight section of the feed body, the multiphase flow is evenly distributed. Upon passing through the semi-cylindrical camber, a pressure differential between the upper and lower fluid regions promotes the relocation of finer particles towards the feed body wall, thereby increasing the proportion of fine particles that enter the cyclonic flow.
(2)
As particles transition into the involute section, the interplay of grading forces induces a transformation from irregular bulk flow to orderly settling, ultimately forming a stable particle layer. This process achieves effective pre-grading of the particles before they enter into the cyclone.
(3)
In the vortex line section, the minimal change in the curvature radius near the cyclone column, coupled with the tangential alignment of the vortex line to the column, reduces particle–wall impacts. This results in smoother particle motion and improved grading performance. By controlling both the flow field and particle dynamics, the composite curved-feed-body structure addresses the issue of “underflow pinch fine” and improves the cyclone’s classification accuracy. Thus, the proposed design offers a feasible solution for enhancing the cyclone’s efficiency and performance in particle separation processes.

2. Model Description

The numerical calculation conditions for the continuous phase medium assume incompressible and steady-state fluid movement [12]. The control equation for the incompressible fluid is Equation (1):
ui¯xi=0 u i ¯ t + u j ¯ u i ¯ x j = 1 ρ P ¯ x i + v 2 u i ¯ x i x j x i R i j
where u i ¯ represents the mean velocity, x i represents the location of the fluid, P ¯ represents the mean pressure, ρ represents the liquid density, v represents the kinematic viscosity, and R i j represents the Reynolds stress tensor.
The RSM for turbulent flow can account for the turbulence anisotropy in various directions [13]. This model has good predictive capabilities for the high-turbulence fields generated by high-speed rotation motion. The transport equation is given by Equation (2):
t R i j + u k ¯ x k R i j = x i ( v t σ k x k R i j ) [ R i k u i ¯ x k + R j k u i ¯ x k ] C 1 ε K [ R i j 2 3 δ i j k ] C 2 [ P i j 2 3 δ i j p ] 2 3 δ i j ε
where the turbulence production terms P i j are defined in Equation (3):
P i j = [ R i k u j ¯ x k + R j k u i ¯ x k ] , P = 1 2 P i j
where P is the fluctuating kinetic energy production; μ t is the turbulent viscosity; σ k = 1, C 1 = 1.8, and C 2 = 0.6 are empirical constants; and ε is turbulence dissipation.
The VOF multiphase flow model can provide good predictions for the internal flow field of gas-liquid phases and accurately capture the gas-liquid interface. This model facilitates the analysis of the mechanism for the formation of the air core.
The control equation for the volume fraction is given by Equation (4):
α q t + u α q = 0
where α q is the volume fraction of the ith-phase fluid. When the entire volume is filled with the same phase, α q equals 1. When the volume contains two phases, the sum of the volume fractions of the two phases equals 1.
The mixture model for multiphase flow can provide good predictions for the particle separation performance within the hydrohydrocyclone.
The continuity equation of the mixture model is Equation (5):
t ρ m + ρ m v m = 0
The momentum equation can be represented as Equation (6):
t ρ m v m + ρ m v m v m = p + μ m v m + v m T + ρ m g + F + k = 1 n α k ρ k v k r v k r
where ρ m is the mixture density of multiple particles, v m = k = 1 n α k ρ k v k ρ m , α k is the volume fraction of the ith phase, n is the number of phases, F is the force per unit volume, μ m is the mixture phase viscosity, μ m = k = 1 n α k μ k , p is the static pressure, ρ k is the density of the kth phase, v k r is the slip velocity between the kth phase and the mixture phase, and v ¯ k r = v k v m .

3. Numerical Method

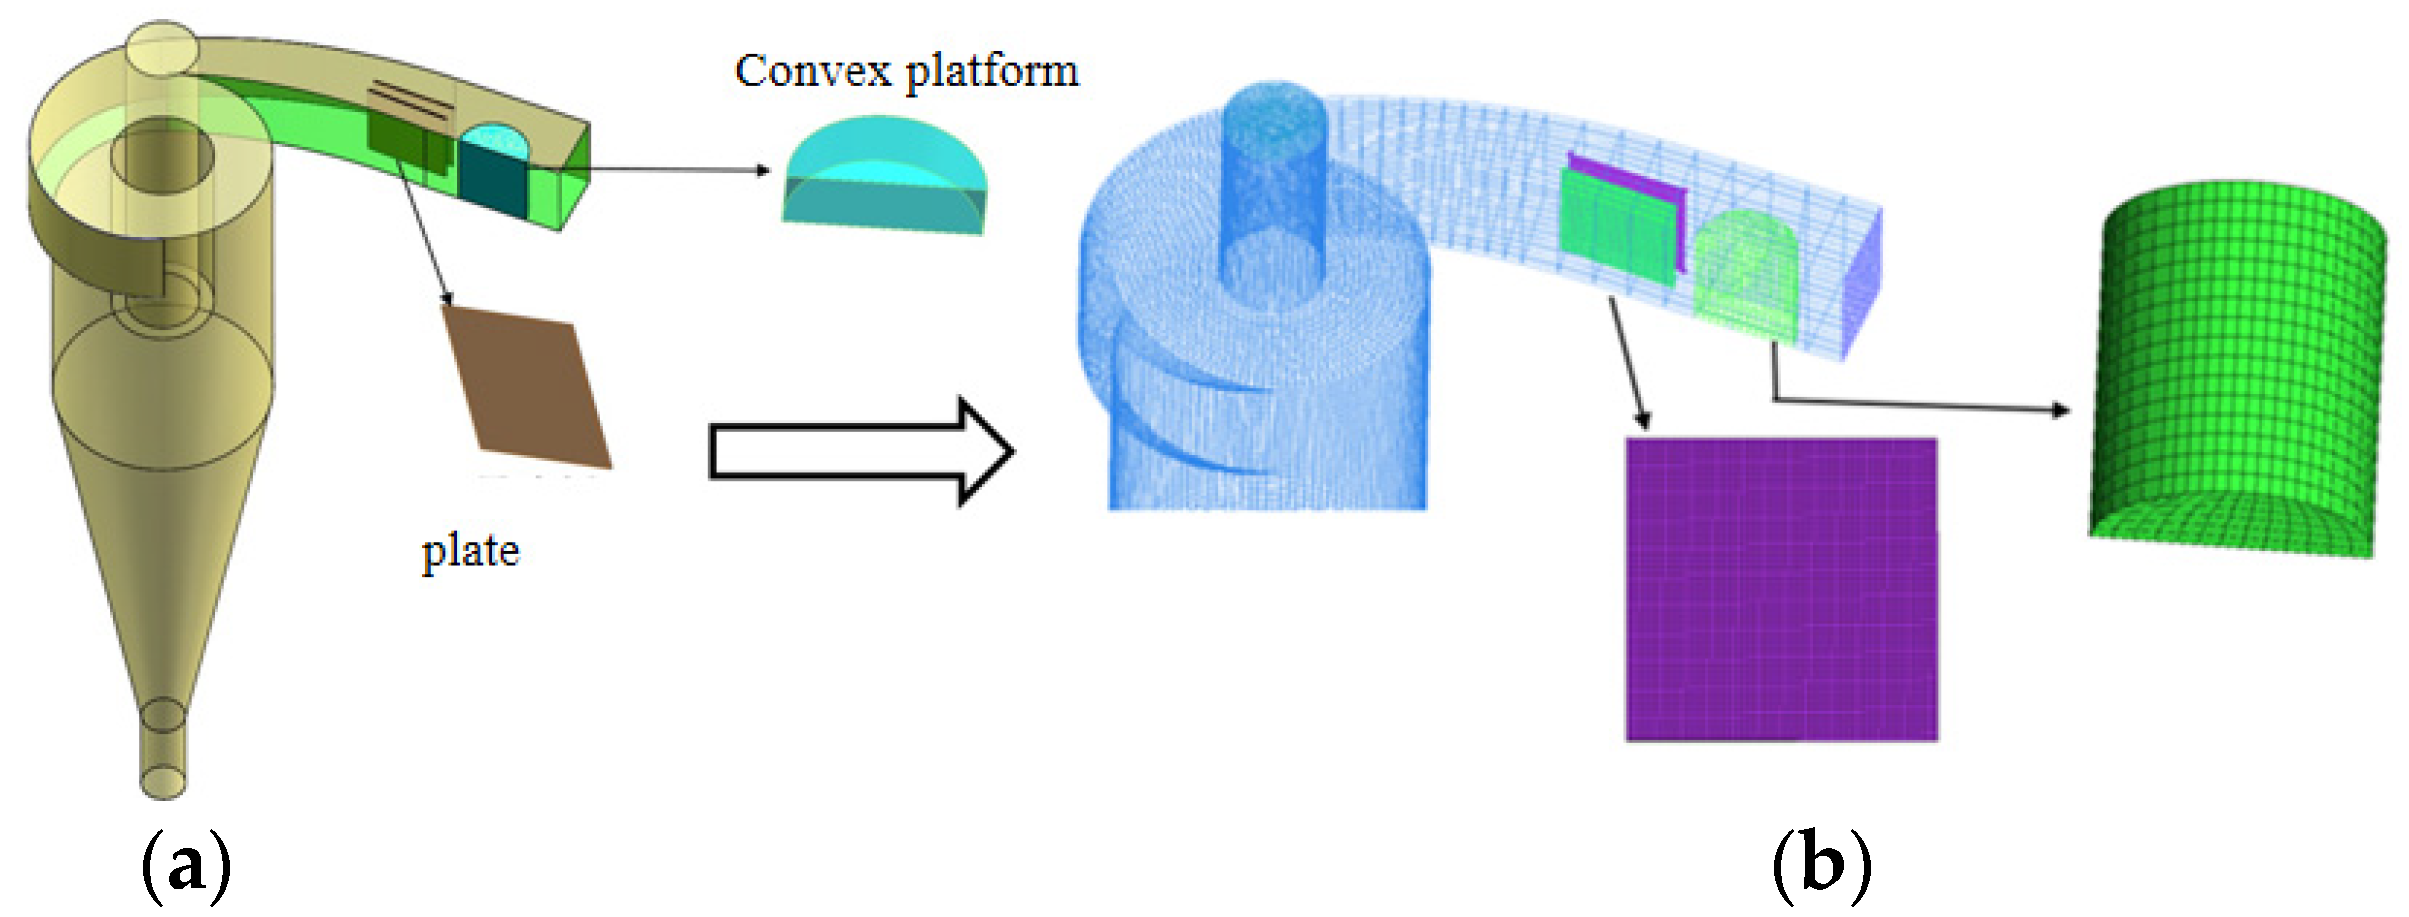
3.1. Geometrical Structures and Meshing

Solidworks software (Solidworks 2020) was used for 3D modeling of the composite curvilinear inlet body cyclone, as shown in Figure 1a, in which the height of the camber is half of the height of the inlet body, and a double-layer deflector is set up, with specific structural parameters, as shown in Table 1.
Before subjecting the physical model to numerical analysis, it first had to be meshed [14,15]. Hexahedral meshing, known for its efficiency in achieving both a low cell count and high accuracy, is commonly employed. In this study, hexahedral meshing was used, as illustrated in Figure 1b. To determine the optimal mesh density, a grid independence study was conducted, as shown in Figure 2. The results indicate that when the number of mesh cells reaches 2.8 × 10⁵, further increases in mesh count do not significantly affect the pressure drop. To balance computational efficiency and accuracy, a mesh with 3.2 × 10⁵ cells was selected for the numerical simulations.

3.2. Boundary Conditions

The inlet of the hydrocyclone was designated as a velocity inlet with solid and liquid velocities set to 5 m/s. The overflow and underflow ports were configured as pressure outlets with absolute pressures of 1 atm. In the VOF model, the reflux coefficient of the outlet was set to 1 to ensure that air entered the hydrocyclone via at least one outlet. In the mixture model, the diameter of the air was set to 1 × 10⁻⁵ mm, and the density of the silica used as solid feed was set to 2.65 g/cm3, with the feed particle size listed in Table 2. A no-slip boundary condition was imposed on the wall. The SIMPLE algorithm was used for pressure–velocity coupling, the PRESTO algorithm for pressure discretization, and the QUICK algorithm for momentum discretization [16,17,18].

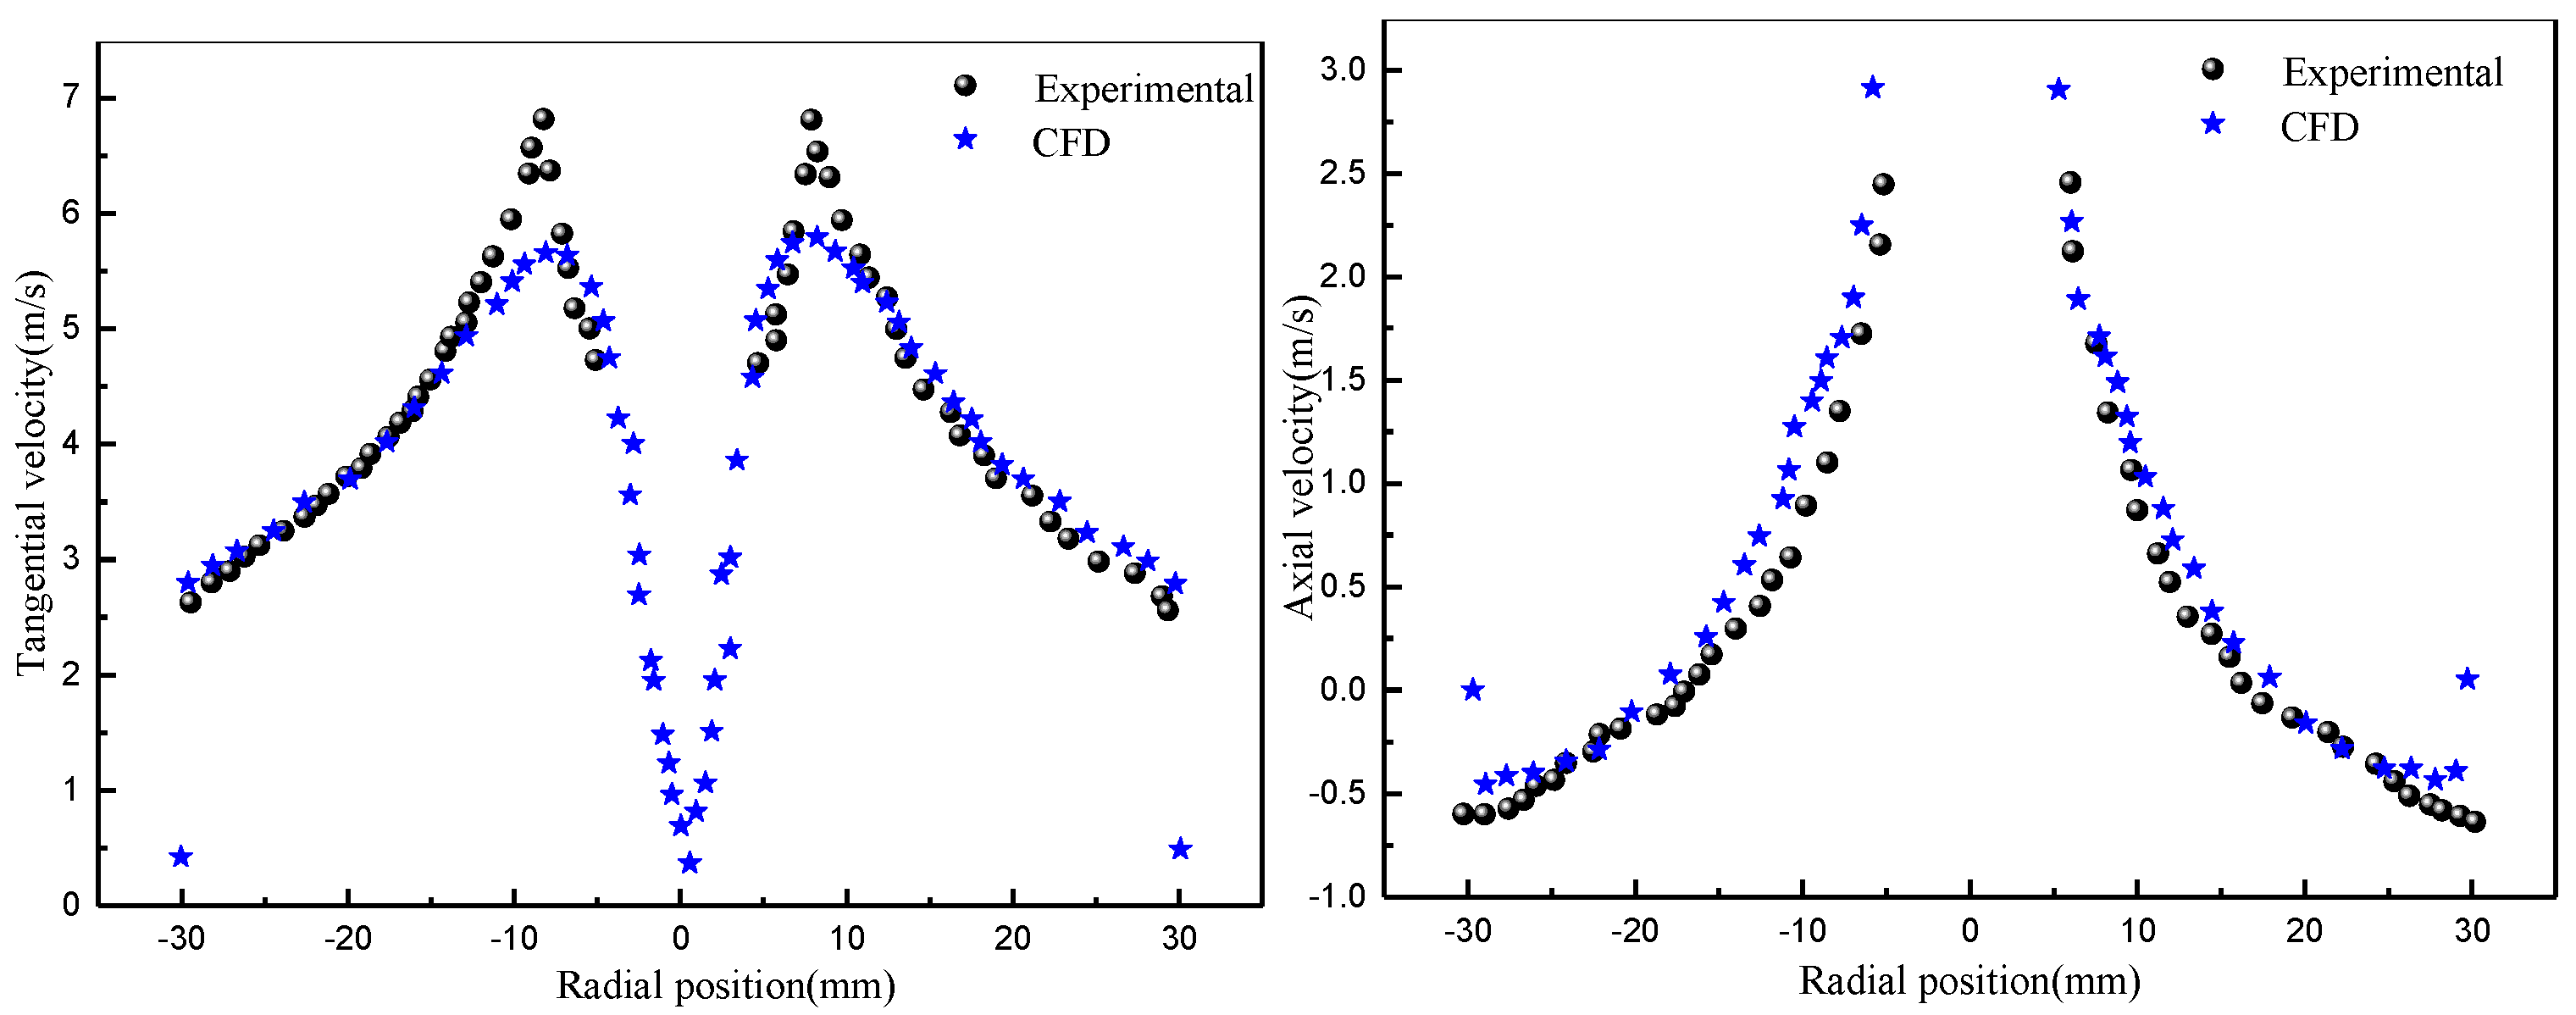
3.3. Model Validation

Before applying the mathematical models to the numerical analysis, it was crucial to verify their accuracy and reliability. First, the RSM/VOF model was employed to predict the variation in the flow field inside the hydrocyclone and was compared with the experimental data obtained by Hsieh [19] using laser Doppler velocimetry (LDV), as illustrated in Figure 3. The simulated and experimental data fit well, with minor differences at the maximum tangential velocity; these differences appeared mainly due to operational errors incurred during experimentation. Overall, the RSM/VOF model could effectively predict changes in the flow field inside the hydrocyclone.

4. Results and Discussion

4.1. Influence of Overflow Pipe Diameter on Internal Flow Field of Composite Curved-Inlet Hydrocyclone

The overflow pipe is one of the important structural parameters of the cyclone [20,21,22,23,24,25], and not only affects the flow distribution of the cyclone but also determines the trajectory of the particles and energy loss. The overflow tube mainly has two important roles: the first is to discharge fine-grained products, and the second is to cut off the short-circuit flow. In order to investigate the influence of the overflow pipe diameter on the flow field of the composite curved cyclone, overflow pipe diameters of 10 mm, 15 mm, 20 mm, 25 mm, and 30 mm were used for the qualitative analysis.

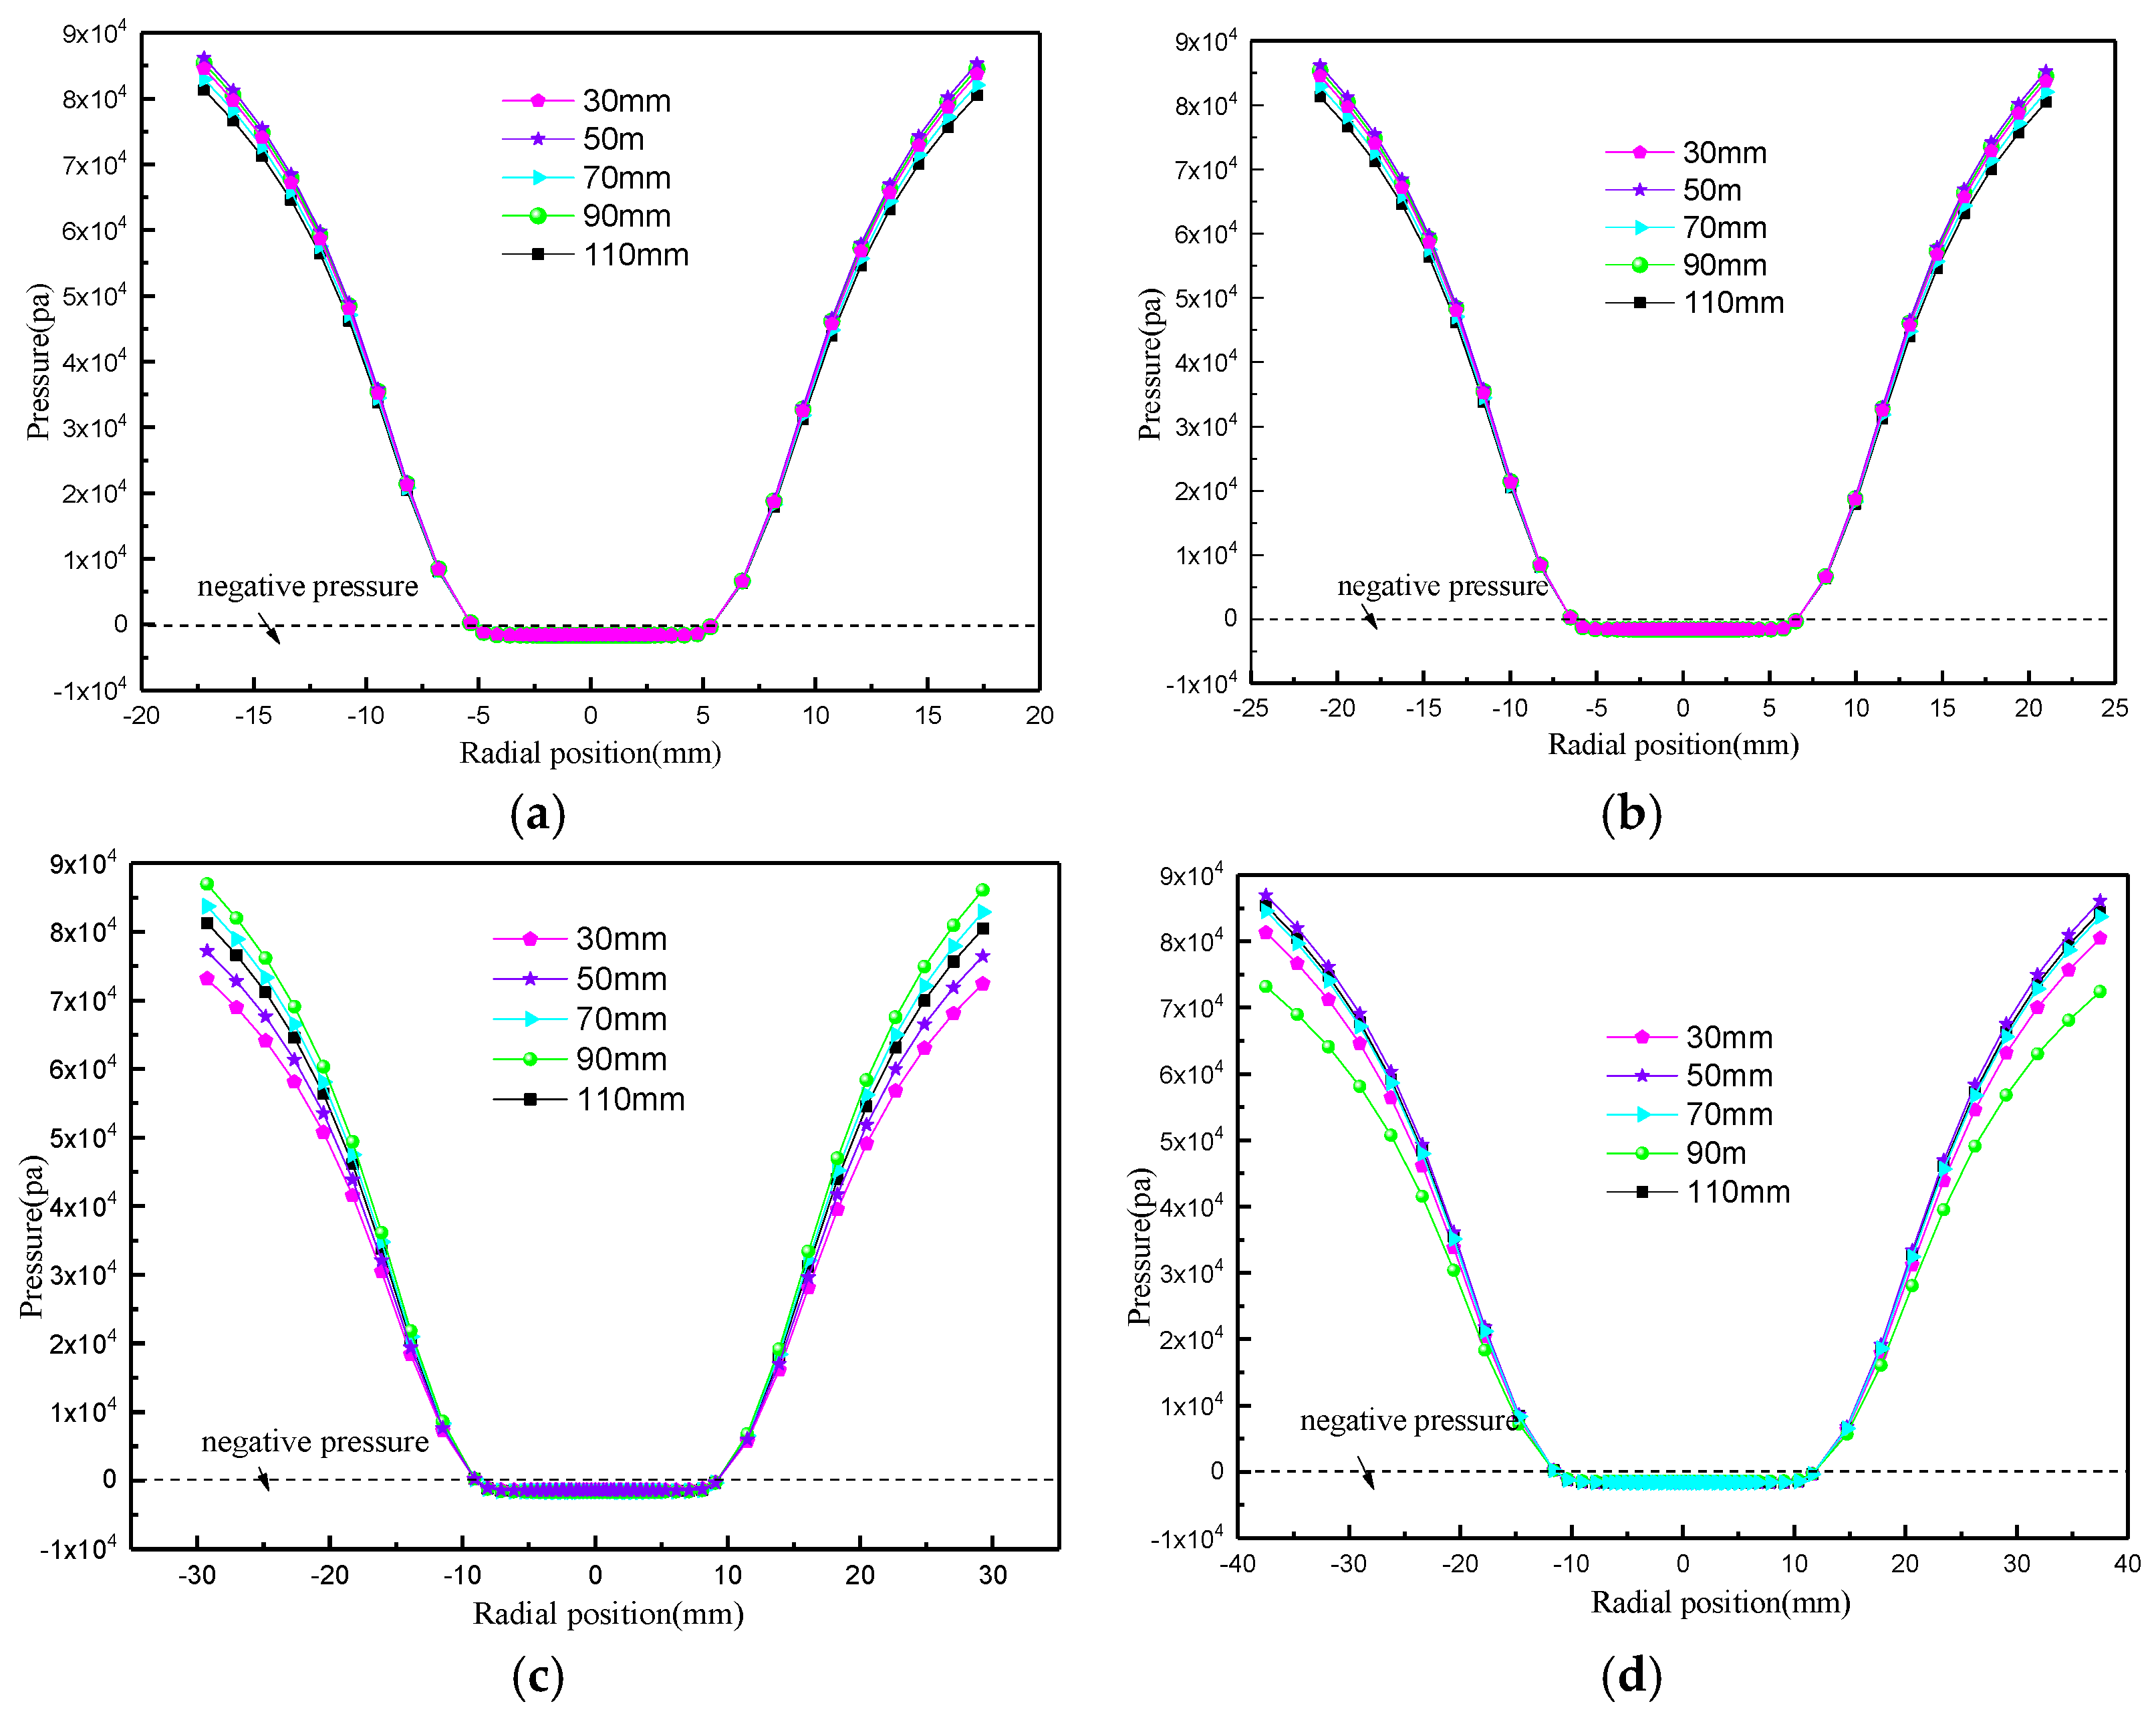
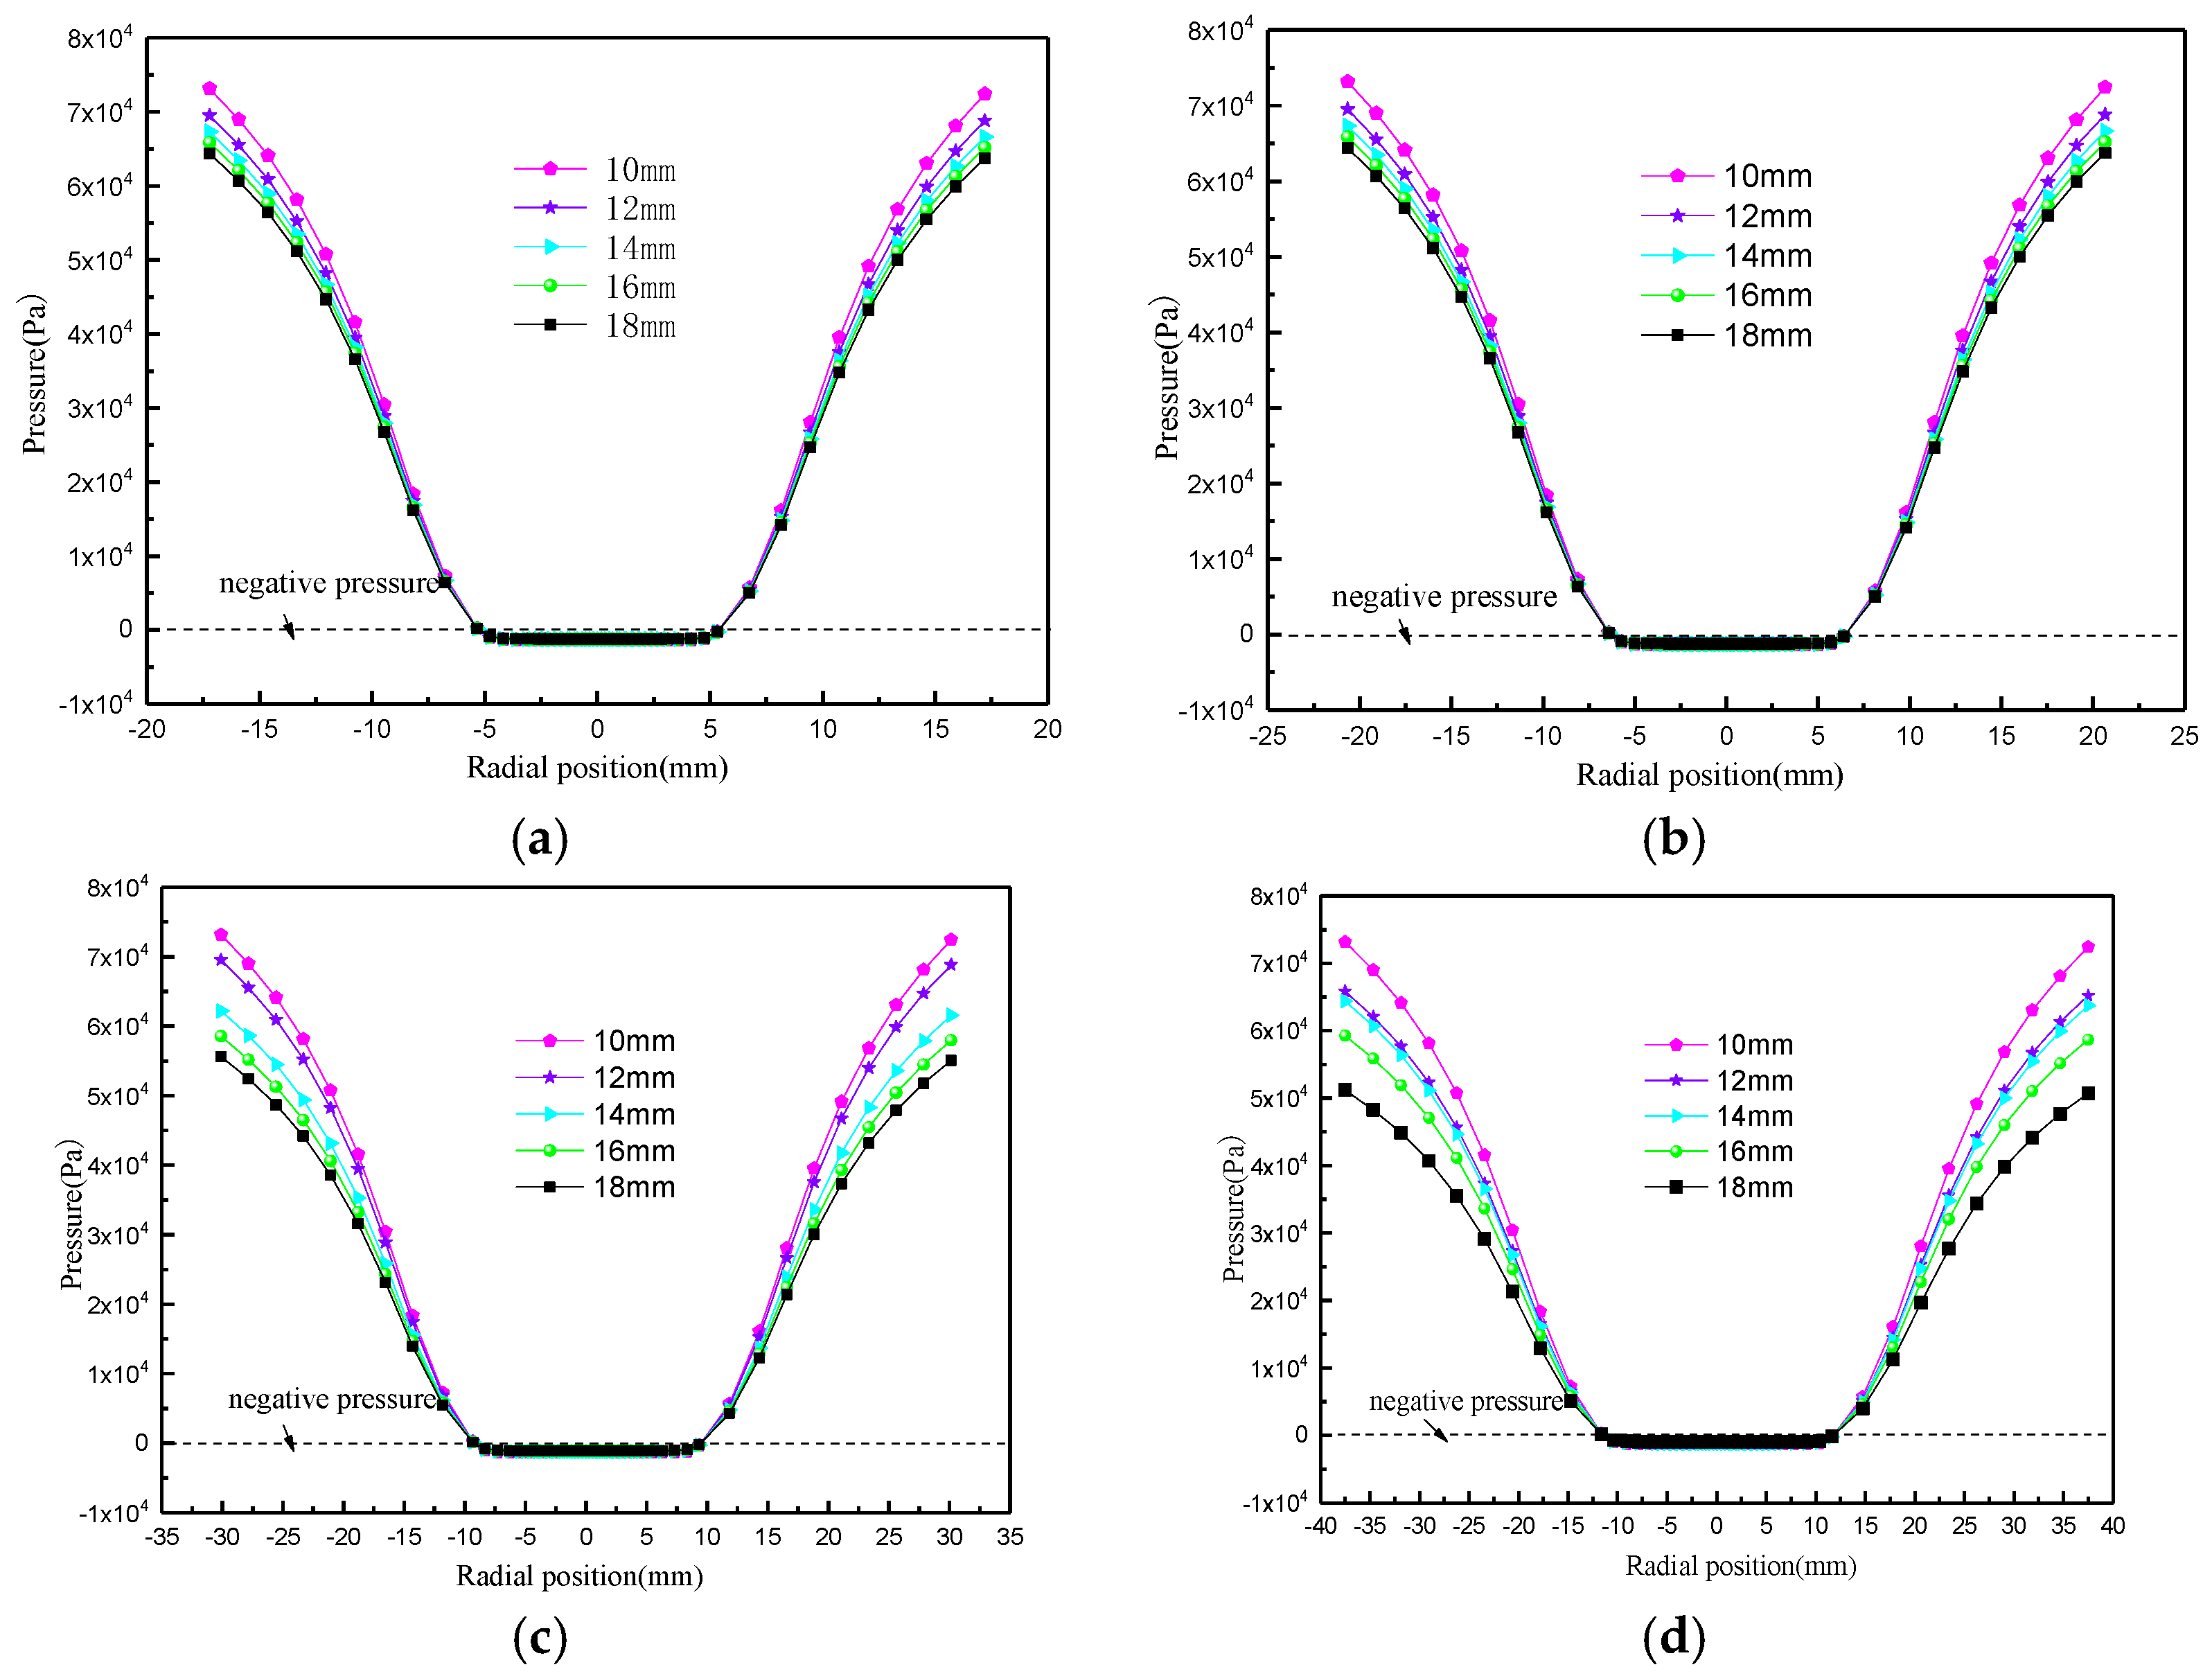
4.1.1. The Effect of Overflow Pipe Diameter on the Pressure Field

The effect of overflow pipe diameter on static pressure is shown in Figure 4. As the diameter of the overflow pipe increases, the static pressure gradually decreases. This can be attributed to the reduced resistance to fluid discharge as the overflow pipe diameter increases, which lowers the overall flow resistance. Additionally, the “narrow-mouth effect” at the bottom flow is diminished, leading to a reduction in the flow disturbance near the bottom flow mouth of the annulus. This reduction in flow disturbance results in less energy loss, ultimately decreasing the pressure drop, as depicted in Figure 4.
It can also be observed from Figure 5 that the diversion ratio decreases as the diameter of the overflow pipe increases. This is primarily because the increase in the diameter of the overflow pipe enables a greater amount of fluid to be discharged from the overflow.
Figure 6 shows the effects of different overflow pipe diameters on the pressure efficiency (the ratio of effective pressure to total pressure). It can be seen that, with an increase in the overflow pipe diameter, the pressure efficiency first increases and then decreases. When the diameter of the overflow pipe is 25 mm, the pressure efficiency is the largest, and the pressure energy is converted into the highest efficiency of kinetic energy.

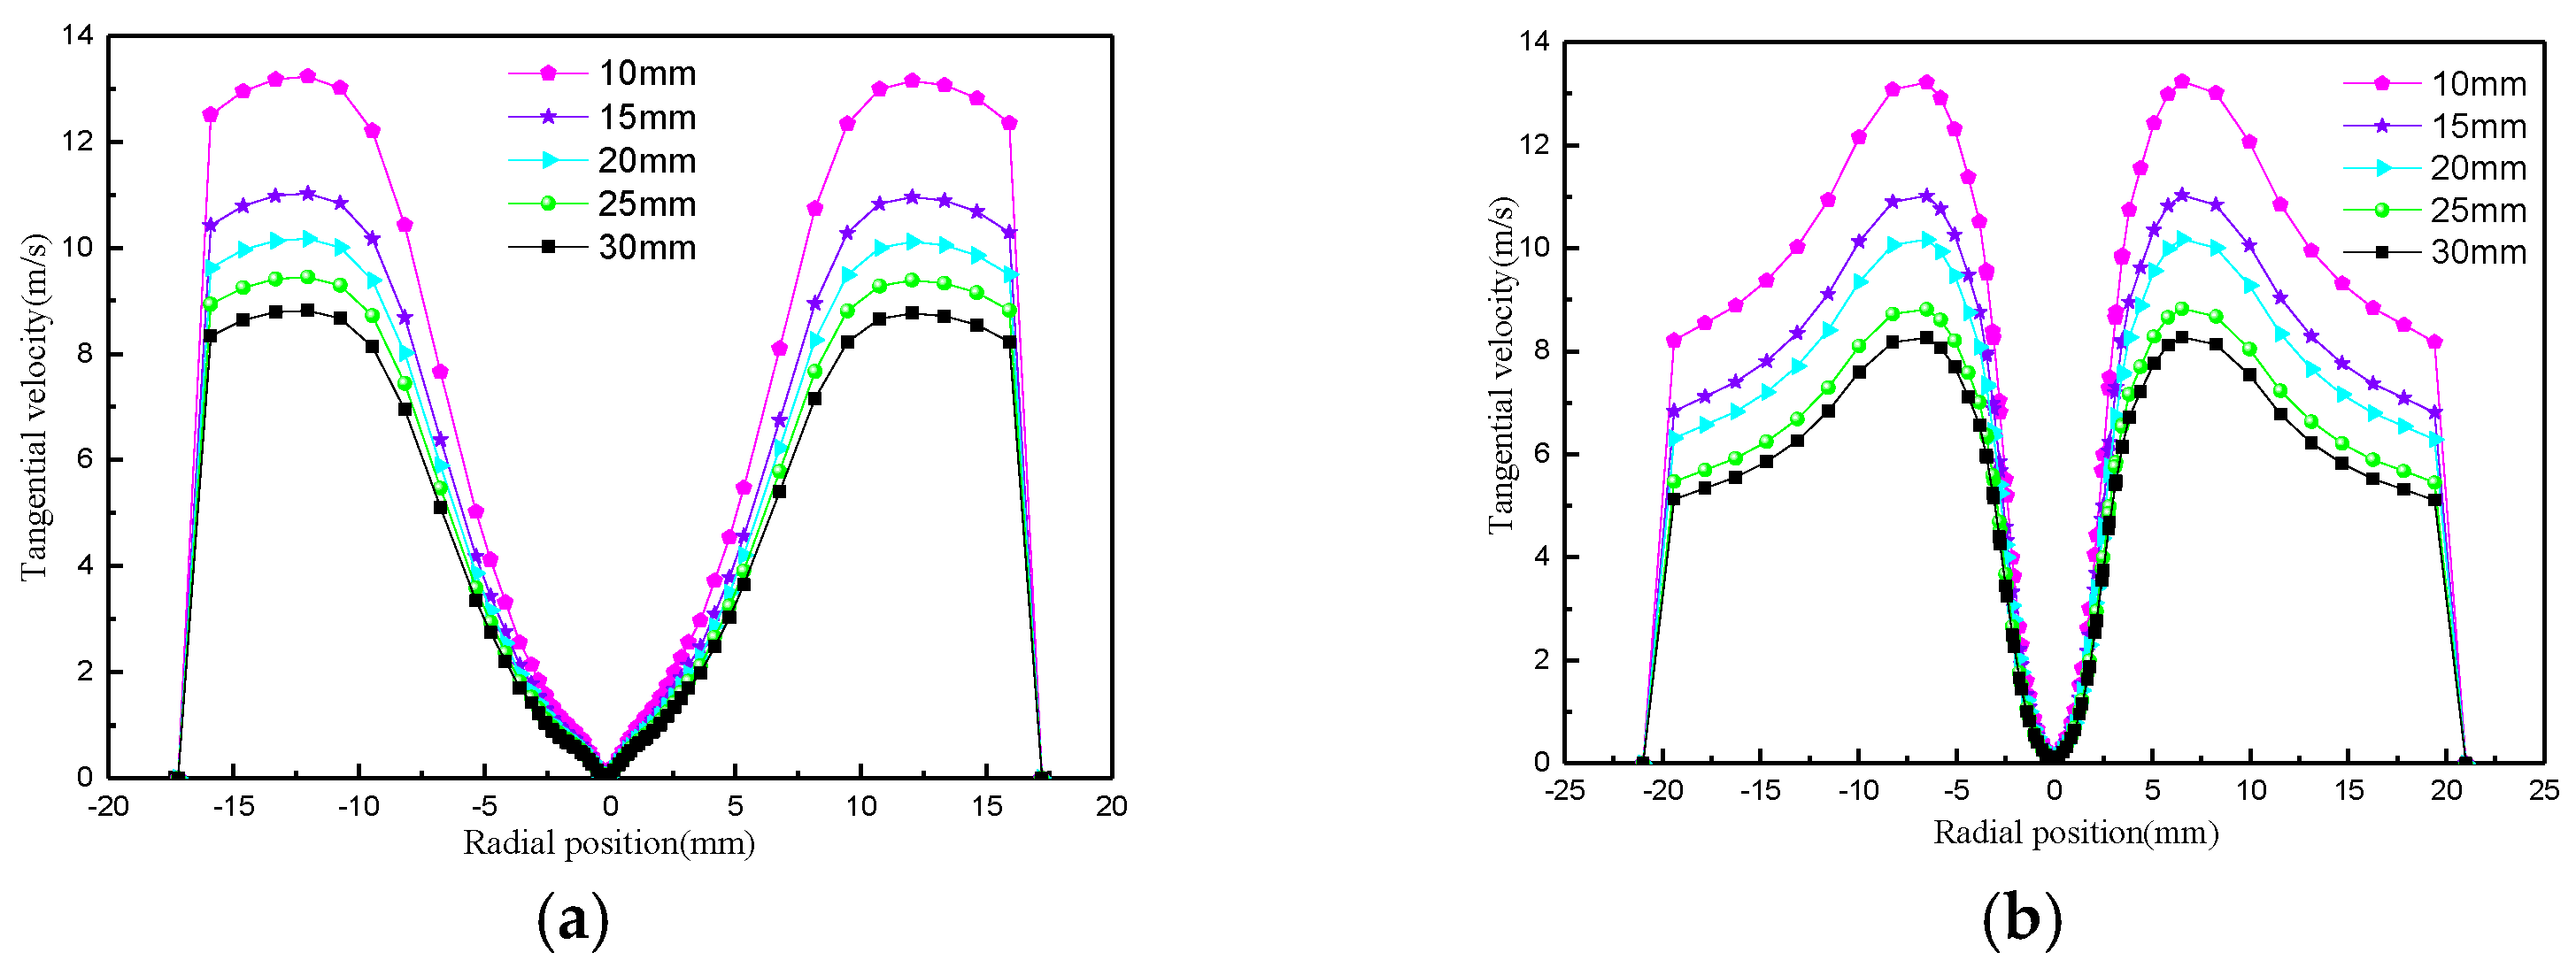
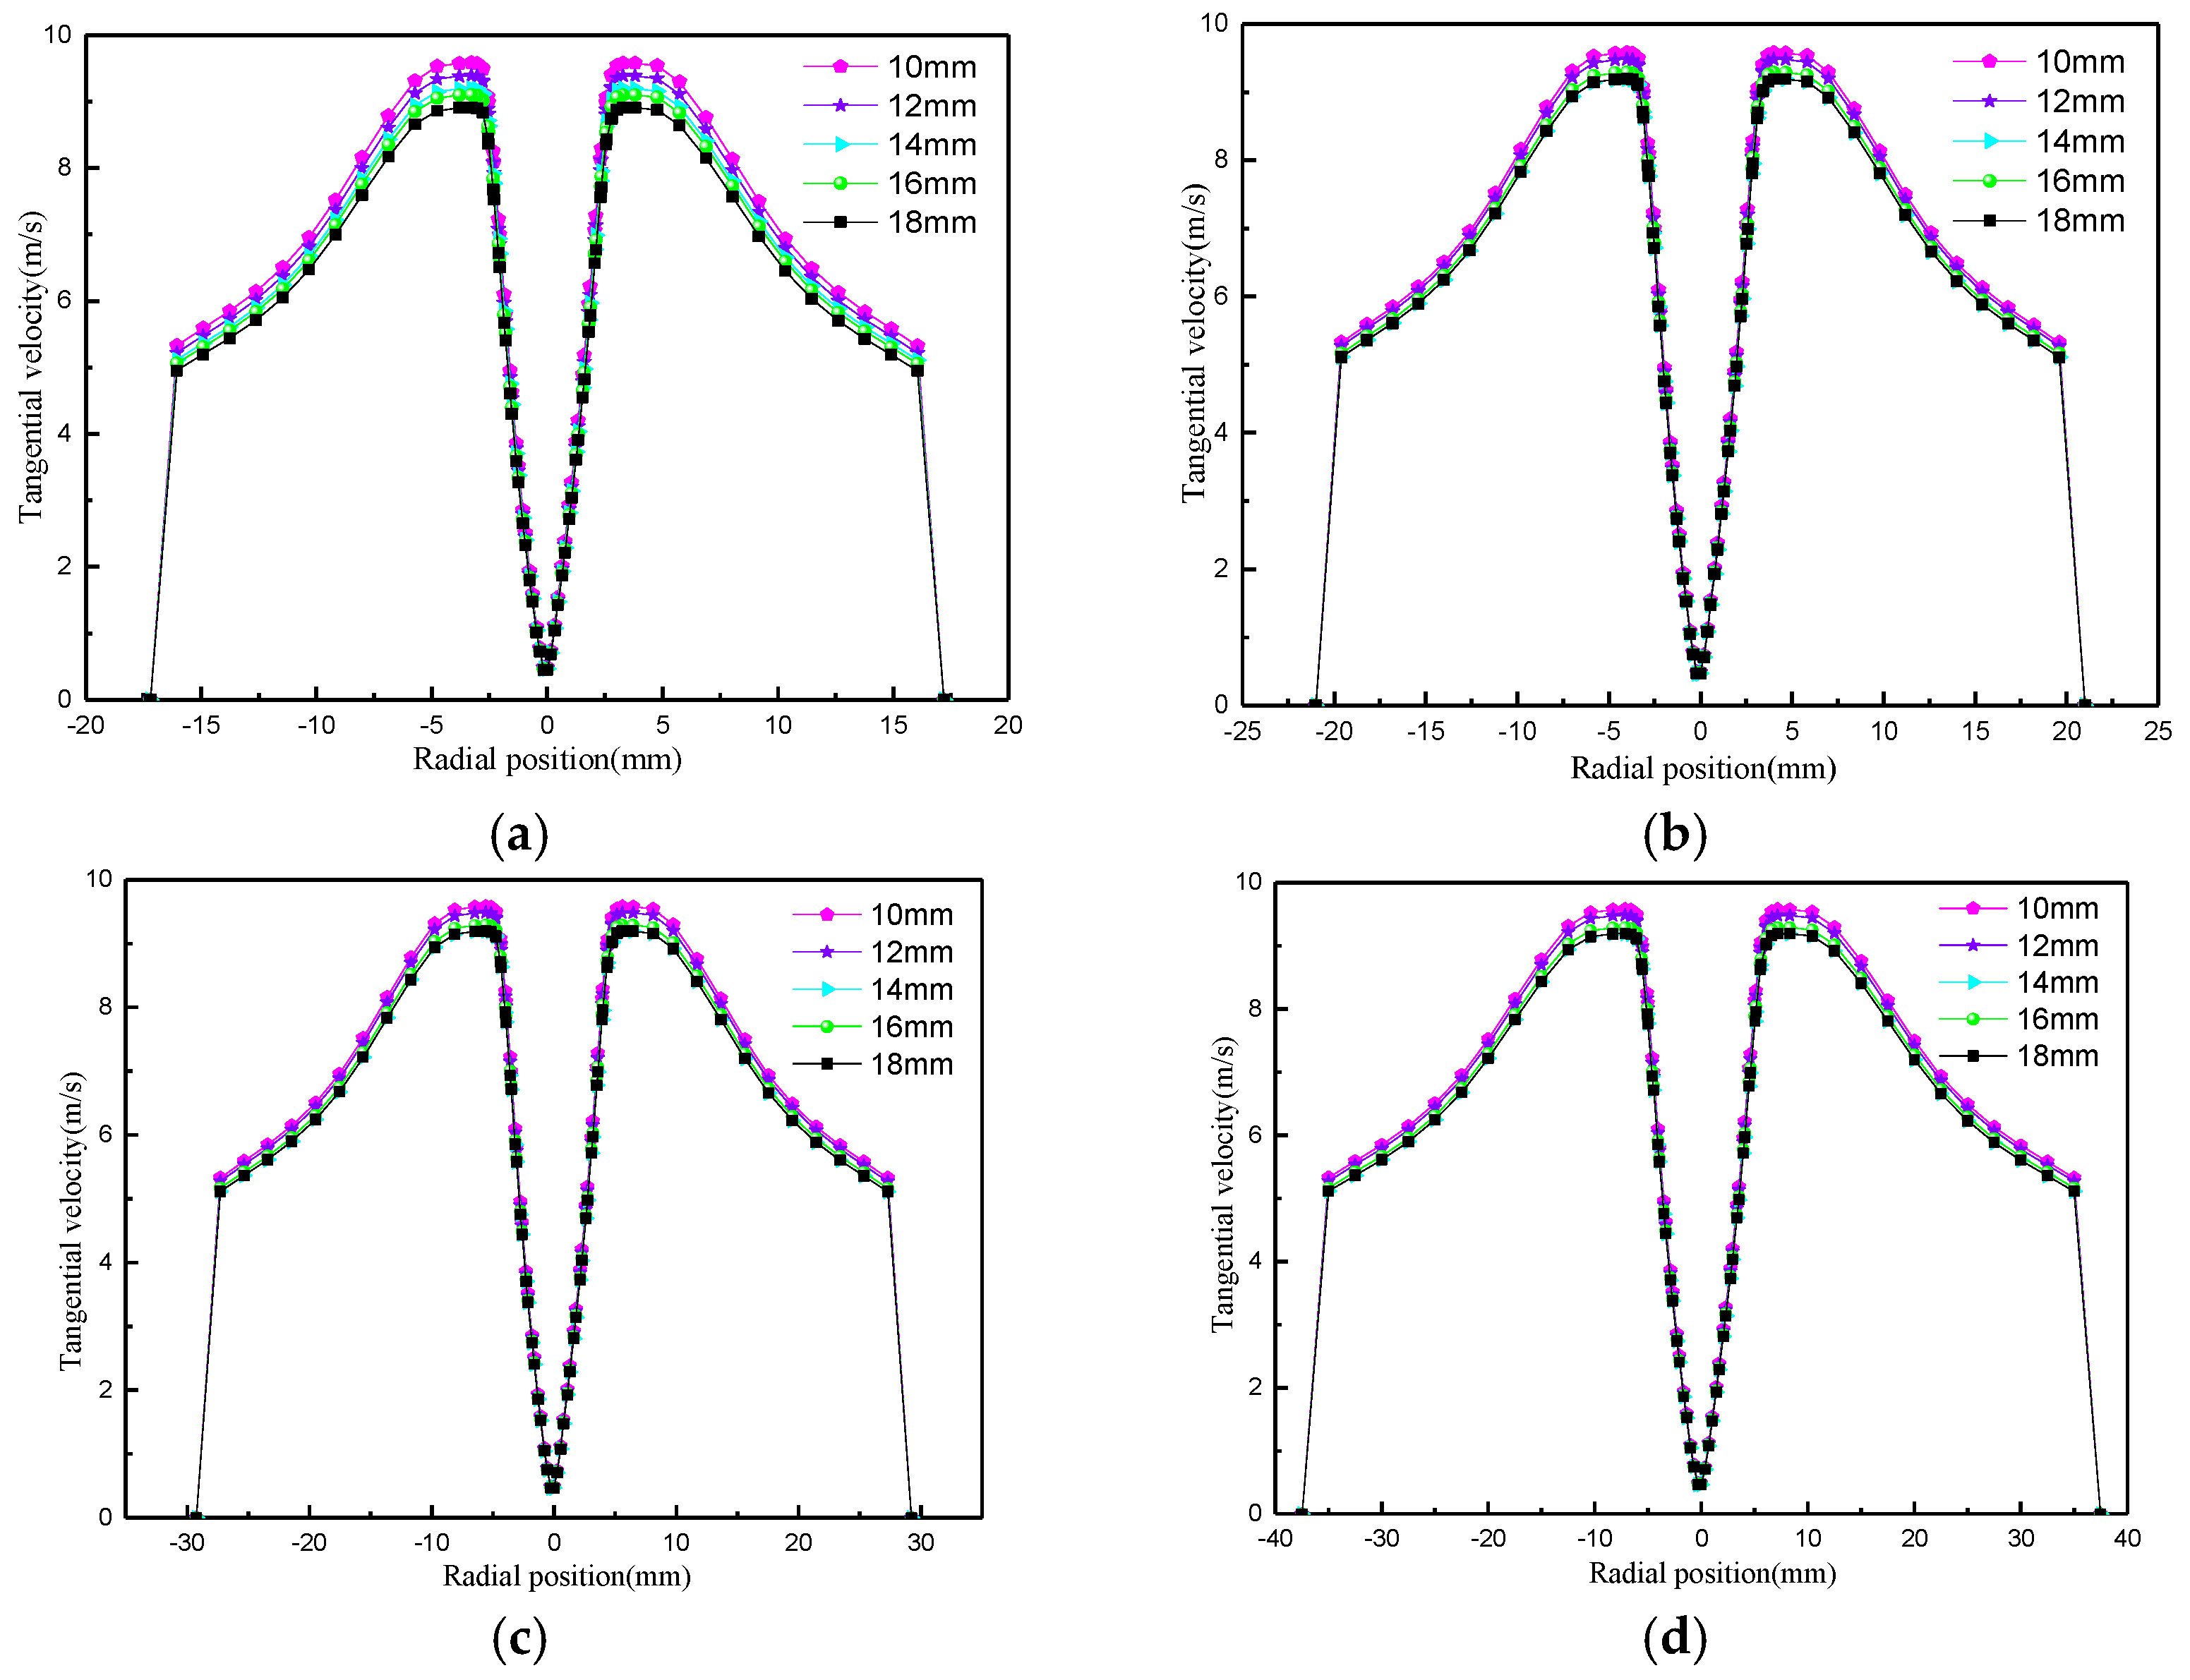
4.1.2. Impact of Overflow Pipe Diameter on Tangential Velocity

The change in tangential velocity with the diameter of the overflow tube is shown in Figure 7. The tangential velocity follows an ‘M’-type distribution, which is in line with the typical combination of vortex morphology. From the wall to the center, the velocity slowly increases and then sharply reduces. Near the center, the tangential velocity is almost zero, indicating that the gas inside the air column cannot undergo centrifugal movement. This is also the reason why the air column does not participate in particle classification. As the diameter of the overflow tube increases, the tangential velocity gradually decreases. The decrease becomes more obvious closer to the bottom of the flow. For example, with Z = 180 mm, the maximum tangential velocity decreases from 13.12 m/s to 10.18 m/s. A larger tangential velocity can help with particle classification, but it can also easily produce a tangential vortex, which disturbs the flow field. On the other hand, a small tangential velocity cannot generate enough centrifugal propulsion, making it difficult to meet the grading requirements. Therefore, selecting an appropriate tangential velocity is crucial for flow field stability and particle classification. This can be achieved by adjusting the size of the overflow pipe diameter to regulate the flow field.

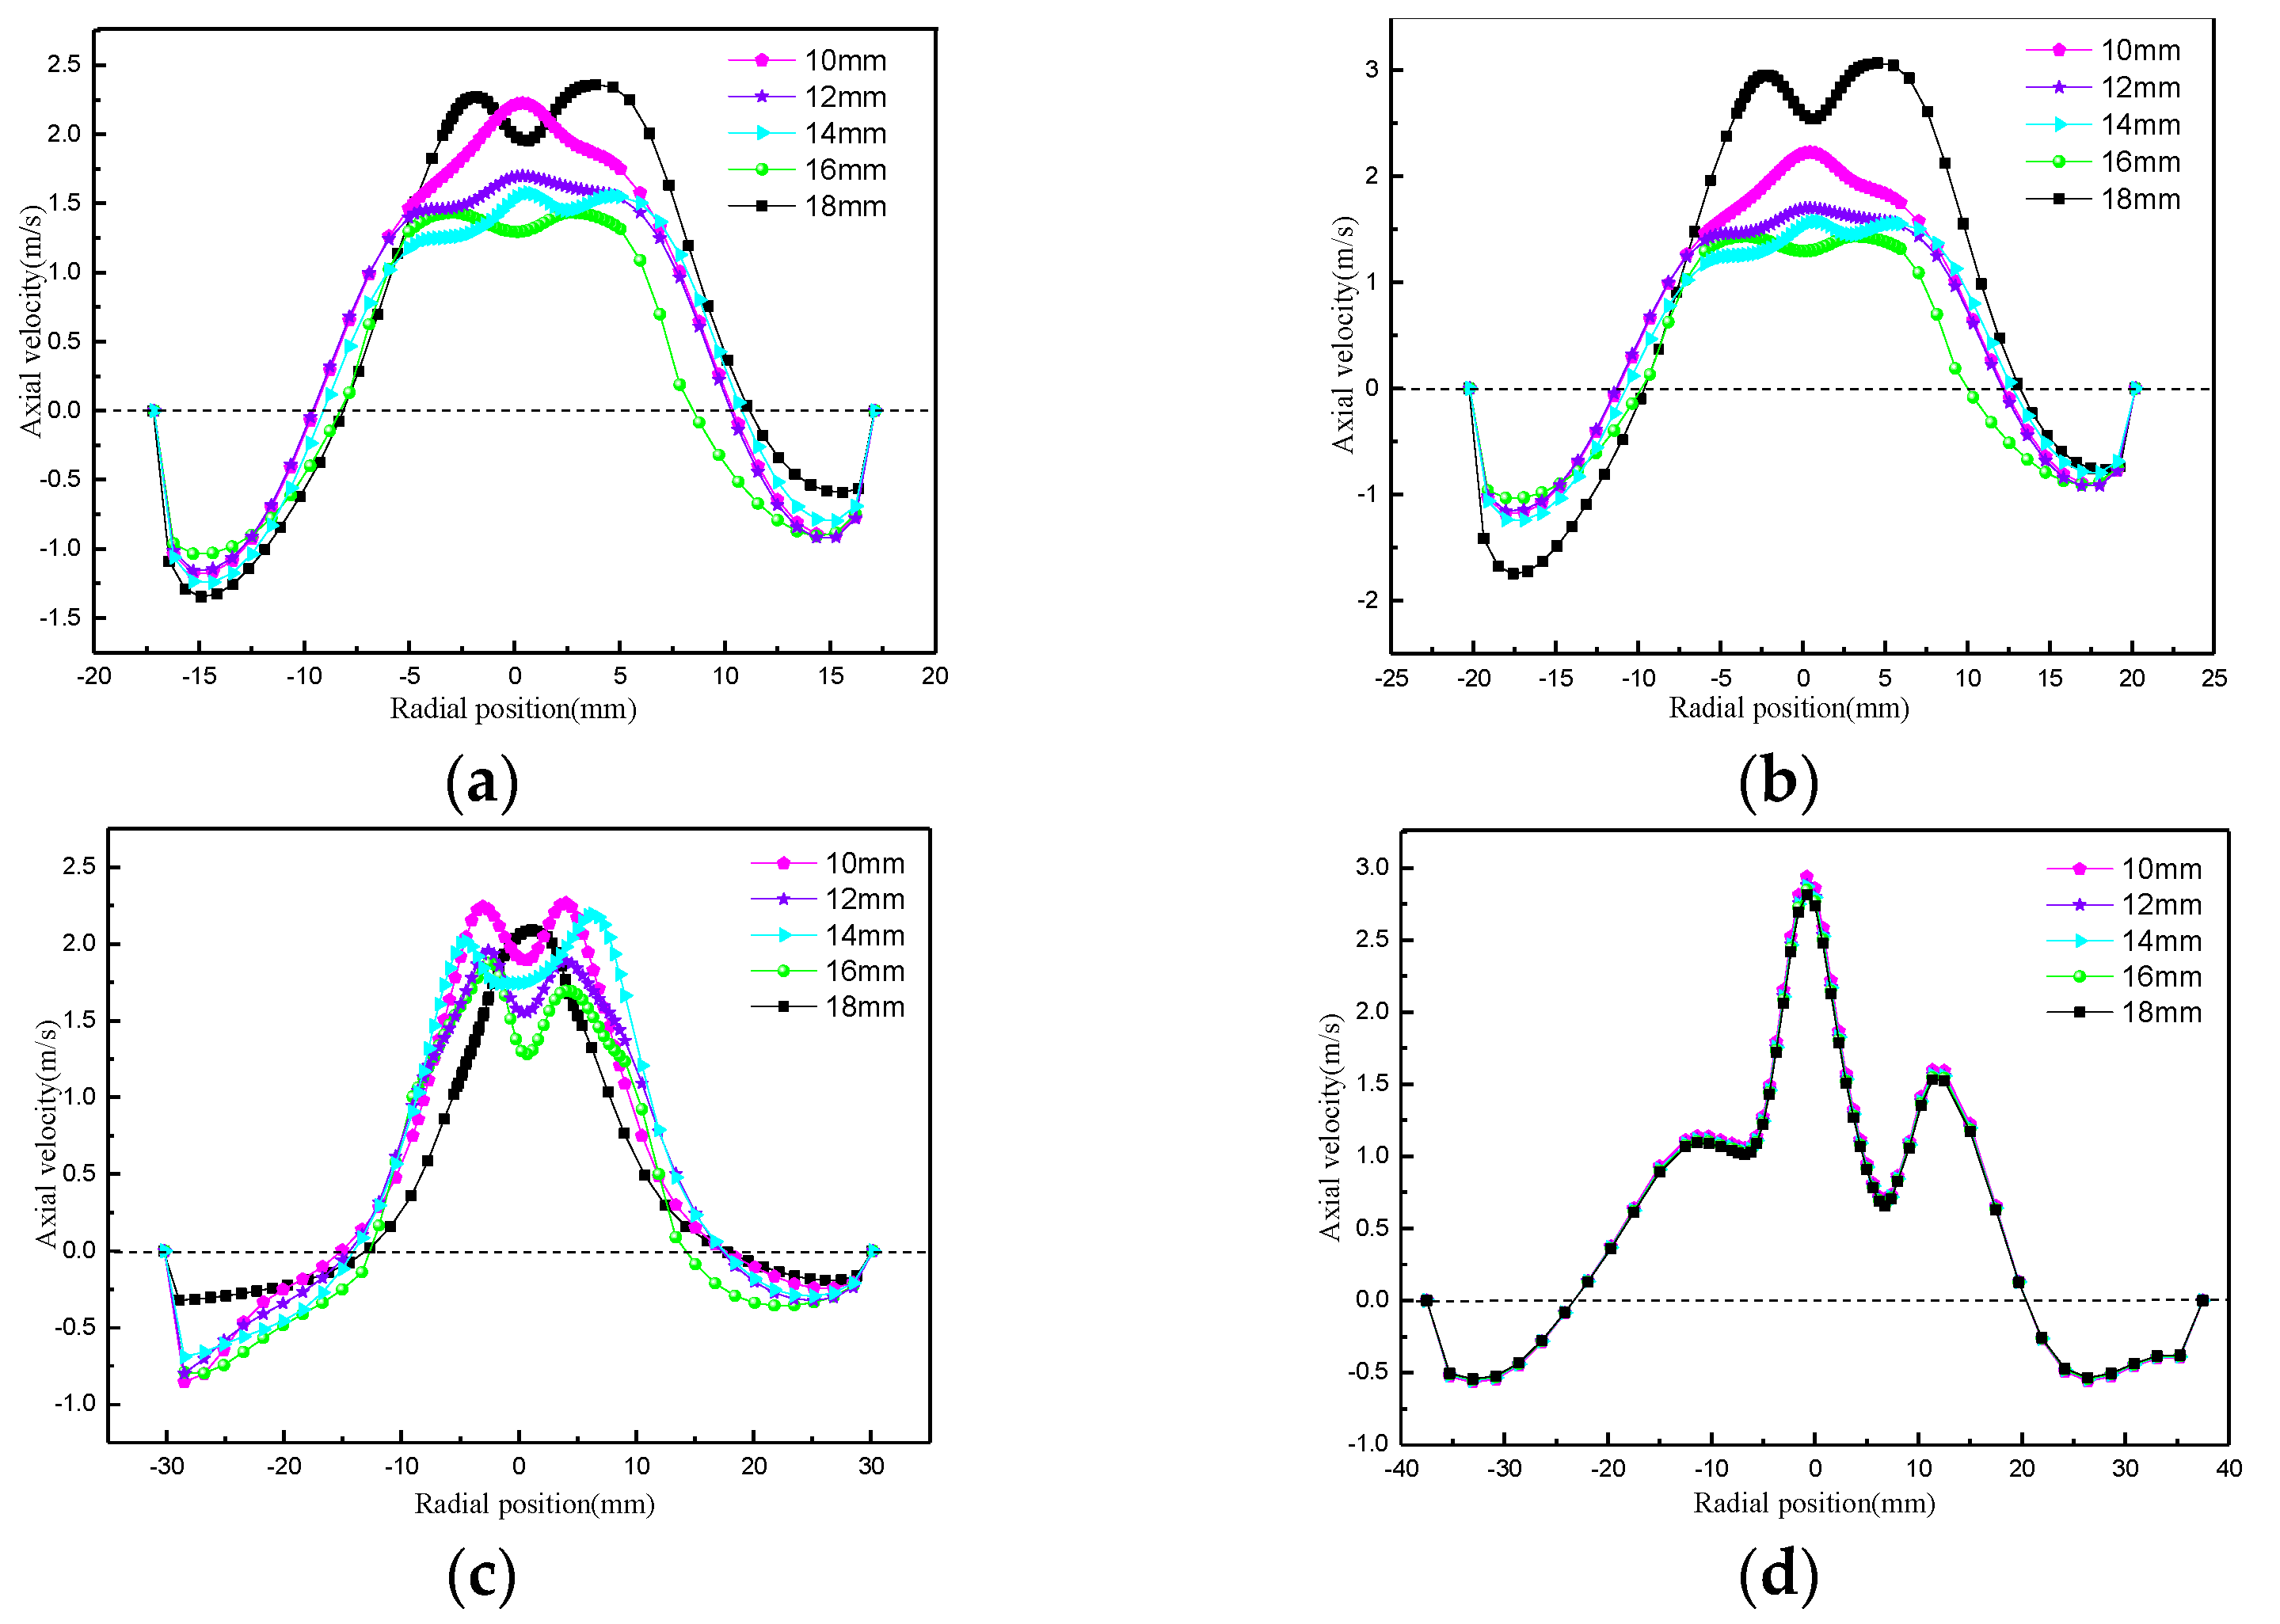
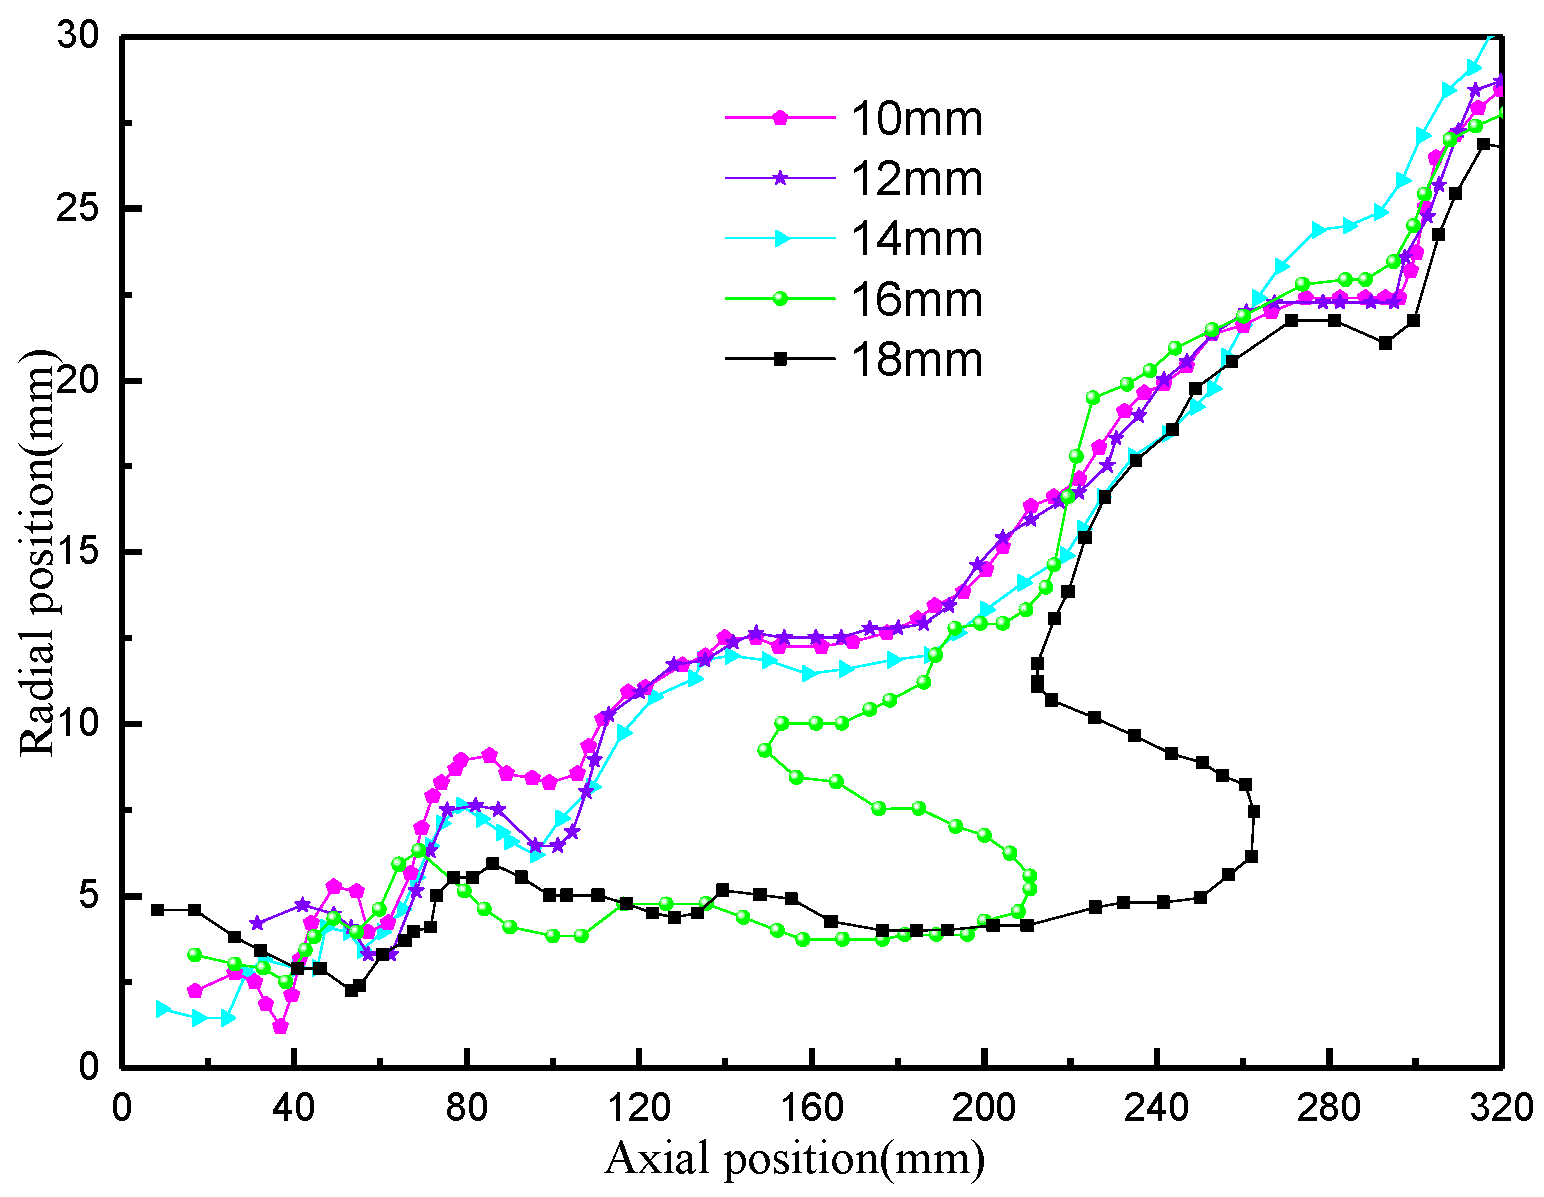
4.1.3. Effect of Overflow Pipe Diameter on Axial Velocity and LZVV (Zero-Speed Envelope Surface)

The effect of overflow pipe diameter on axial velocity is shown in Figure 8. When the diameter of the overflow pipe is less than 20 mm, the direction of axial velocity in both the main separation region (Z < 205 mm) and the pre-separation region (Z > 205 mm) changes from downward to upward. In the pre-separation region, the axial velocity increases as the diameter of the overflow pipe increases. In the main separation area, when the diameter of the overflow pipe is 10 mm, the main separation area has only downward movement of the external rotating flow. This is due to the overflow port being too small to cause the fluid to flow back. This not only causes a surge in annular flow in the cyclone, but also destroys the stability of the flow field, accompanied by a large amount of energy loss. At this time, the cyclone has lost the significance of classification and sorting.
LZVV changes under different overflow pipe diameters, as shown in Figure 9. With an increase in overflow pipe diameter, LZVV gradually migrates outward, which makes the inner cyclone space larger and the outer cyclone space smaller. More fluid is discharged from the overflow, which is consistent with the change in the diversion ratio. There are two extreme value points at the positions of Z = 30 mm and Z = 55 mm, and the direction of the change is reversed. This is due to the extrusion of the surrounding fluid by the air column.

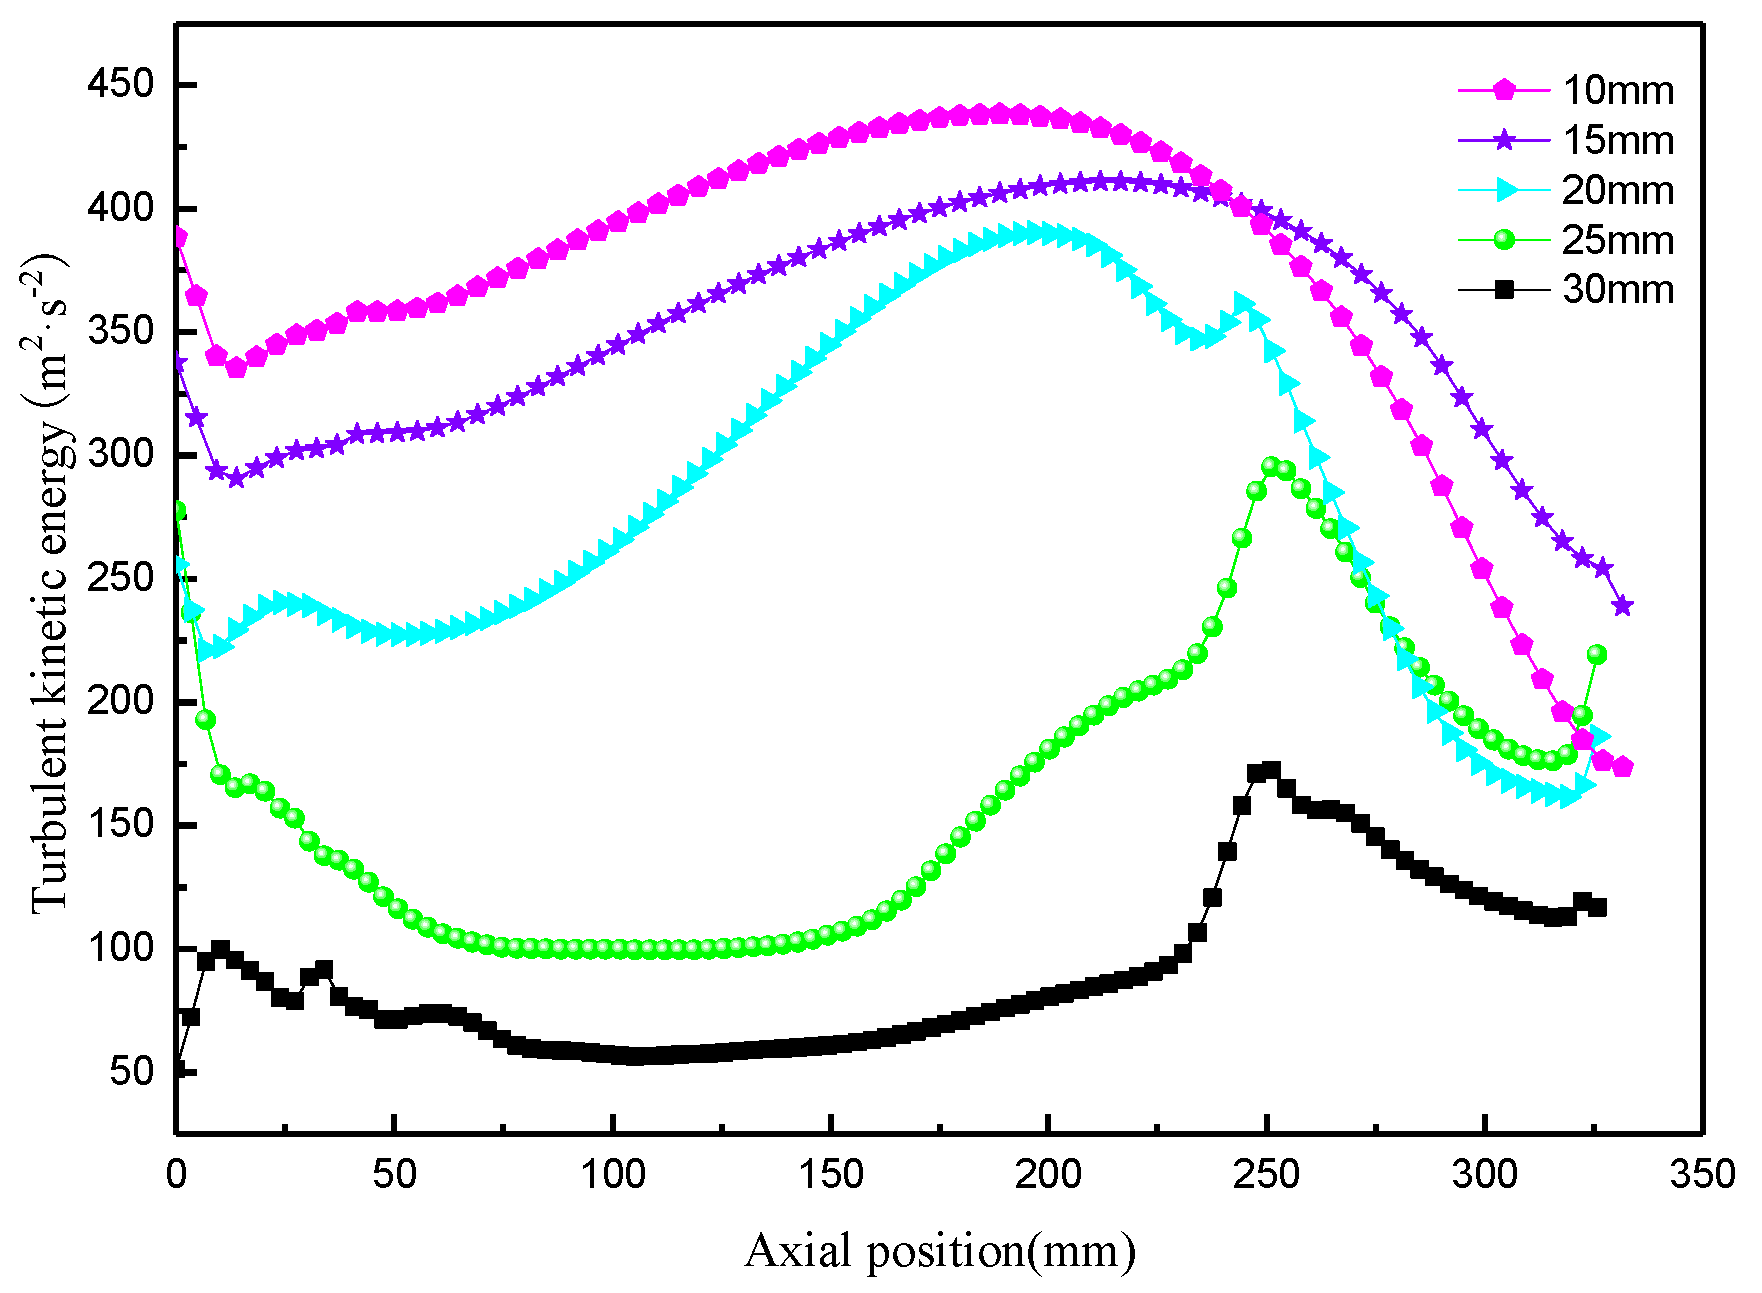
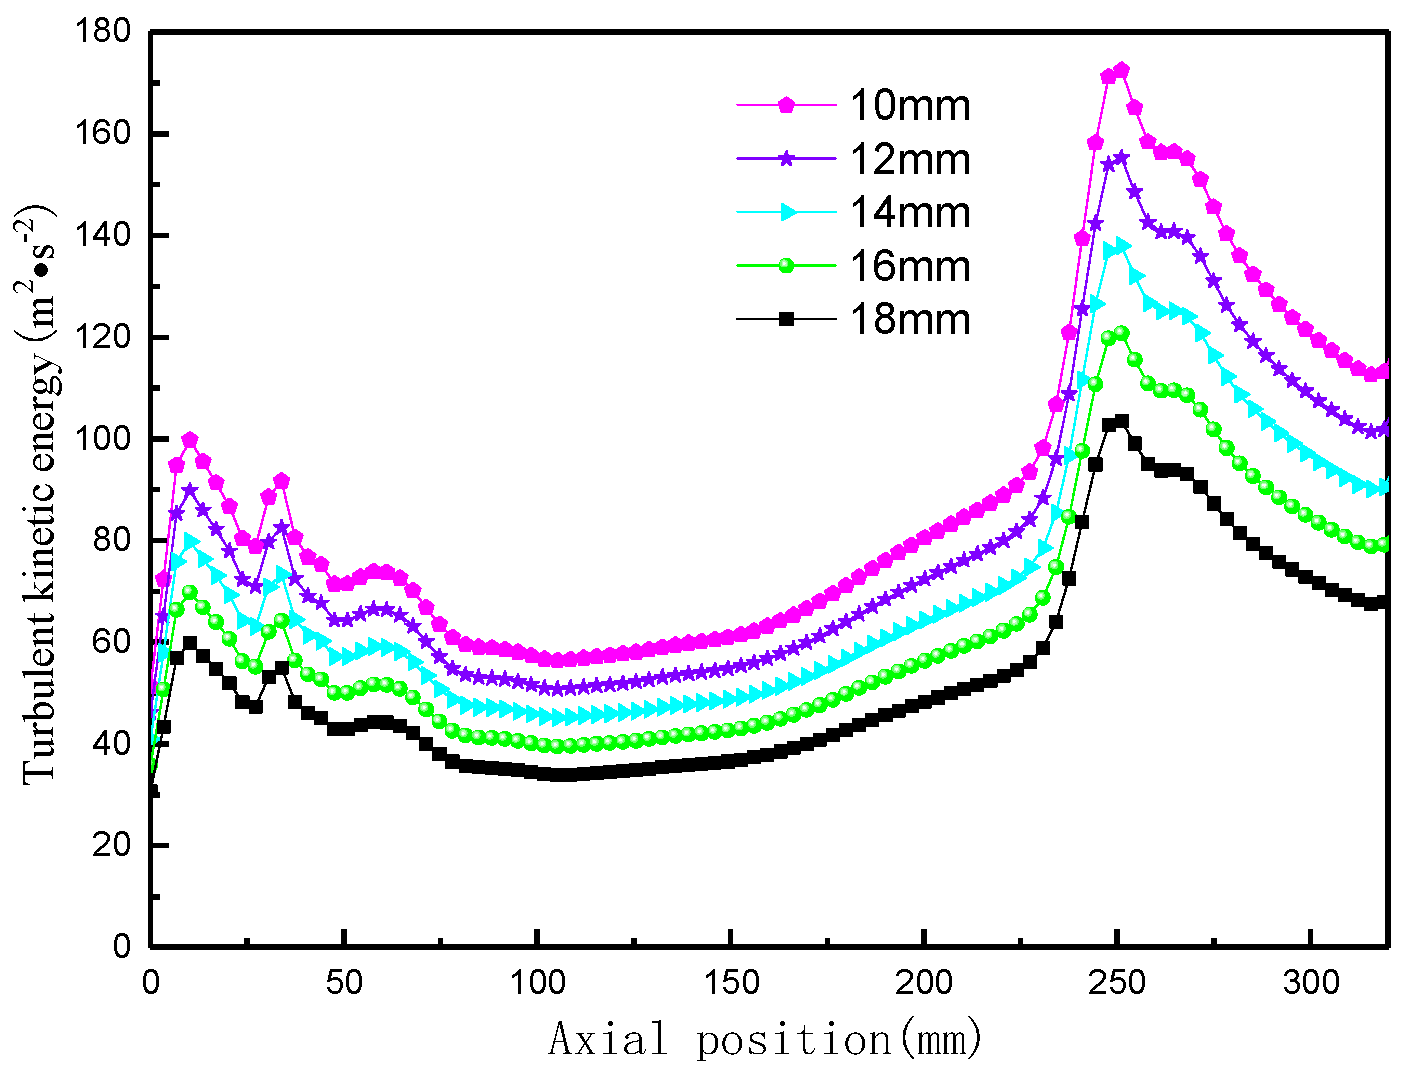
4.1.4. Effect of Overflow Pipe Diameter on Turbulent Kinetic Energy

Turbulent kinetic energy is one of the characterization factors used to measure the size of turbulent energy [26,27,28]. The turbulent kinetic energy changes with the diameter of the overflow pipe, as shown in Figure 10. Along the axial direction, the turbulent kinetic energy increases and then decreases, reaching a peak point. It is not difficult to observe that the peak point occurs near the bottom of the overflow pipe. With an increase in the diameter of the overflow pipe, the turbulent kinetic energy gradually decreases.

4.2. Impact of Overflow Tube Insertion Depth on Internal Flow Field of Composite Curvilinear Inlet Body Hydrocyclone

The insertion depth of the overflow tube has an important influence on the fine particle recovery rate, flow field stability, and short-circuit flow rate [29,30]. In order to investigate the influence of the overflow tube insertion depth on the flow characteristics in the composite curved-inlet-body cyclone, insertion depths of 30 mm, 50 mm, 70 mm, 90 mm, and 110 mm were taken as the objects of study.

4.2.1. The Effect of Overflow Tube Insertion Depth on the Pressure Field

The variation in static pressure with insertion depth of the overflow pipe is shown in Figure 11, and the static pressure fluctuates slightly in the range of Z = 180 mm to 220 mm. The variation in pressure drop and shunt ratio with insertion depth is shown in Figure 12, and the pressure drop is almost stable between 8.45 × 10⁴ and 8.5 × 10⁴ Pa, which indicates that the insertion depth does not have much effect on the cyclone energy consumption. The diversion ratio decreases with an increase in the insertion depth of the overflow pipe, and the closer the overflow pipe is to the cone section, the easier it is for the fluid to be discharged from the overflow port, but one should avoid the bottom end of the overflow pipe entering the cone, as this could cause a wide range of flow field disturbances. The effect of the insertion depth on the pressure efficiency is shown in Figure 13, the pressure efficiency increases first and then decreases, and the pressure efficiency is highest when the insertion depth is 70 mm.

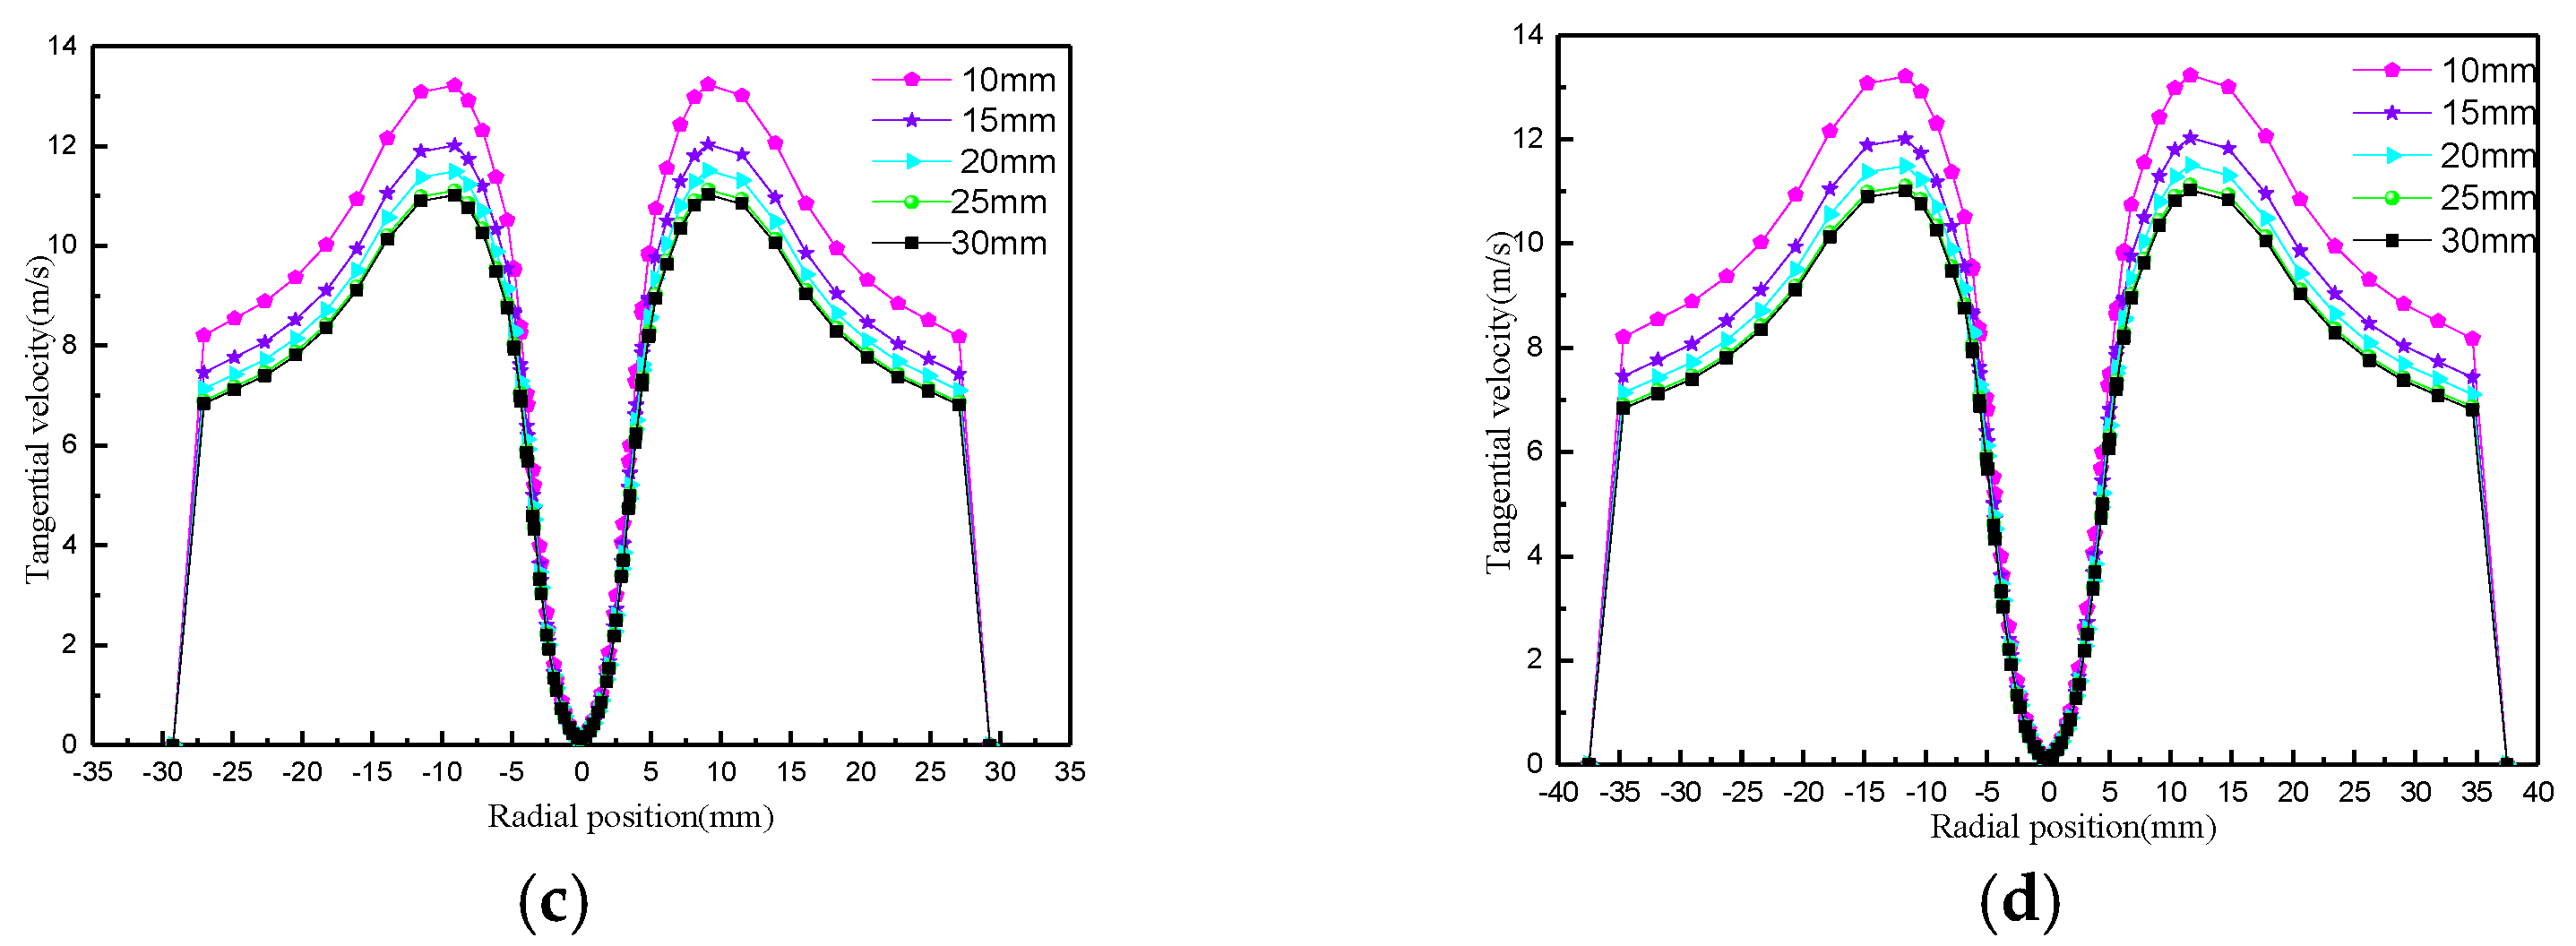
4.2.2. Effect of Overflow Pipe Insertion Depth on Tangential Velocity

The change in tangential velocity with the insertion depth of the overflow pipe is shown in Figure 14. With an increase in the insertion depth of the overflow pipe, the tangential velocity slightly fluctuates, but the change is not significant. The tangential velocity only changes slightly at Z = 220 mm, which is caused by the disturbance of the flow field resulting from the circulation in the pre-separation region.

4.2.3. Effect of Overflow Tube Insertion Depth on Axial Velocity and LZVV

The effect of the overflow tube insertion depth on the axial velocity is shown in Figure 15. The axial velocity decreases with an increase in the insertion depth, which is due to the fact that the upward traveling distance of the fluid becomes shorter. The fluid enters the overflow tube quickly, weakening the influence of the annular flow on the internal cyclone, which is then discharged through the stable guiding effect of the overflow tube. The closer the bottom flow opening (Z = 80 mm) and the bottom end of the overflow tube (Z = 220 mm), the larger the magnitude of the axial velocity change. In the middle region of the cone section (Z = 120 mm), the axial velocity is almost unaffected, and there is a difference in the maximum value only at the center, indicating that the insertion depth of the overflow tube has a certain effect on the flow velocity of the gas in the air column.
The effect of the insertion depth on the LZVV at the cone section is shown in Figure 16, which shows that the LZVV gradually migrates outward with an increase in the insertion depth. More fluid is discharged from the overflow, and this change is consistent with the diversion ratio. From the figure, it can also be observed that the LZVV at Z = 30 mm and Z = 50 mm changes drastically in the radial position and the opposite direction. This is mainly due to the irregular and frequent squeezing of the surrounding fluid by the gas inside the air column and is one of the reasons for the instability of the flow field.

4.2.4. Effect of Overflow Pipe Insertion Depth on Turbulent Kinetic Energy

The change in turbulent kinetic energy with the insertion depth of the overflow pipe is shown in Figure 17. The turbulent kinetic energy increases with an increase in insertion depth. This is because the distance between the fluid in the main separation region and the bottom of the overflow pipe becomes smaller, allowing more fluid to enter the overflow pipe. The increase in flow rate causes the overflow pipe to be unable to discharge the fluid in time, leading to the generation of a large range of circulating currents at the periphery of the overflow pipe and the inner wall surface of the cyclone. This results in the turbulent kinetic energy becoming larger.

4.3. Effect of Underflow Orifice Diameter on Internal Flow Field of Composite Curved-Inlet-Body Hydrocyclone

The underflow orifice is one of the important factors affecting the classification performance of a cyclone, especially for coarse particle recovery. It plays a decisive role. In order to explore the influence of the underflow orifice diameter on the flow characteristics of a composite curved-inlet-body cyclone, five underflow orifice diameters were selected for exploration.

4.3.1. Effect of Underflow Orifice Diameter on Pressure Field

The change in static pressure with the diameter of the bottom flow port is shown in Figure 18. As the diameter of the bottom flow port increases, the static pressure gradually decreases. The further away the bottom flow port, the more obvious the decrease in static pressure becomes. This is mainly due to the increased size of the bottom flow port, allowing more fluid to be discharged, and the resulting reduction in fluid resistance leading to a decrease in static pressure.
Figure 19 shows the effect of the diameter of the bottom flow orifice on the pressure drop and diversion ratio. The pressure drop decreases with an increase in the bottom flow orifice, and the energy consumption decreases gradually. Therefore, the energy consumption can be controlled by adjusting the size of the bottom flow orifice. The diversion ratio increases with an increase in the bottom flow orifice; more fluid is discharged from the bottom flow orifice, which produces more secondary liquid. At the same time, the oversized bottom flow orifice also entraps a large number of fine particles, which reduces the classification accuracy of the cyclone. Therefore, it is not feasible to increase the diameter of the bottom flow orifice as a means of reducing energy consumption and increasing treatment capacity. Additionally, too large a diameter of the underflow orifice makes the fluid throughput larger, which is extremely unfavorable for the stability of the flow field. Therefore, it is necessary to choose the appropriate diameter of the underflow orifice according to the actual working conditions. In order to seek the optimal value of static pressure, the pressure efficiency was analyzed, as shown in Figure 20. This figure demonstrates that for the 75 mm diameter composite curve-type inlet body cyclone, when the diameter of the bottom flow opening is 14 mm, the pressure efficiency is the largest. This means that the effective pressure is converted into kinetic energy with the highest efficiency and the lowest energy consumption, effectively saving on operational costs and improving operational efficiency.

4.3.2. The Effect of the Diameter of the Bottom Flow Port on the Tangent Velocity

The effect of underflow orifice diameter on the tangential velocity of the cyclone is shown in Figure 21, which shows that the tangential velocity along the axial position does not change much. The tangential velocity along the radial position decreases with an increase in the underflow orifice diameter, but the decrease is not large. This indicates that the diameter of the underflow orifice does not have a significant effect on the particles settling along the radial direction.

4.3.3. Effect of Overflow Orifice Diameter on Axial Velocity and LZVV

Regarding the effect of the underflow port diameter on the composite curved-inlet-body cyclone’s axial velocity, as shown in Figure 22, with the changes in the diameter of the underflow port, the axial velocity in the center of the peak number changes, which is due to the air column around the fluid extrusion air column caused by the underflow port diameter being larger and close to the bottom of the mouth. The axial velocity of the fluid is larger, resulting in the center of the air column in the area of the axial pressure drop decreasing dramatically, forming the phenomenon of double peaks. Away from the bottom of the mouth, the pressure drop inside the air column is basically stable, forming a single peak. As the diameter of the bottom flow opening increases, the axial velocity in the cone section gradually increases (Z < 205 mm), and the closer the bottom flow opening, the more obvious the phenomenon. This is mainly because the bottom flow opening increases to accelerate the discharge of fluid. The further away the bottom flow opening, the less affected the axial velocity (Z = 220 mm), so the diameter of the bottom flow opening does not have a great effect on the axial movement of fluid in the pre-separation area of the cyclone.
In order to investigate the effect of the diameter of the bottom flow opening on the separation space, the LZVV was analyzed, as shown in Figure 23. When the diameter of the bottom flow opening is 10 mm to 14 mm, the position of the LZVV does not change much. When the diameter of the bottom flow opening is more than 14 mm, the LZVV is seriously twisted and migrates outward. The twisted position appears at Z = 120 mm to 240 mm, which is exactly the center of the main separation region. This region is also the center of the main separation region and the pre-separation region, and it is the intersection region of various flows. This shows that although an increase in the diameter of the underflow opening increases the separation space of the internal cyclone, the flow field is seriously disturbed. It also causes a large amount of kinetic energy loss at the exit, and phenomena such as secondary flow are caused by the oscillation of the air column extruding the surrounding fluids. The stability of the flow field is greatly reduced, so the appropriate size of the underflow opening should be selected according to the actual situation.

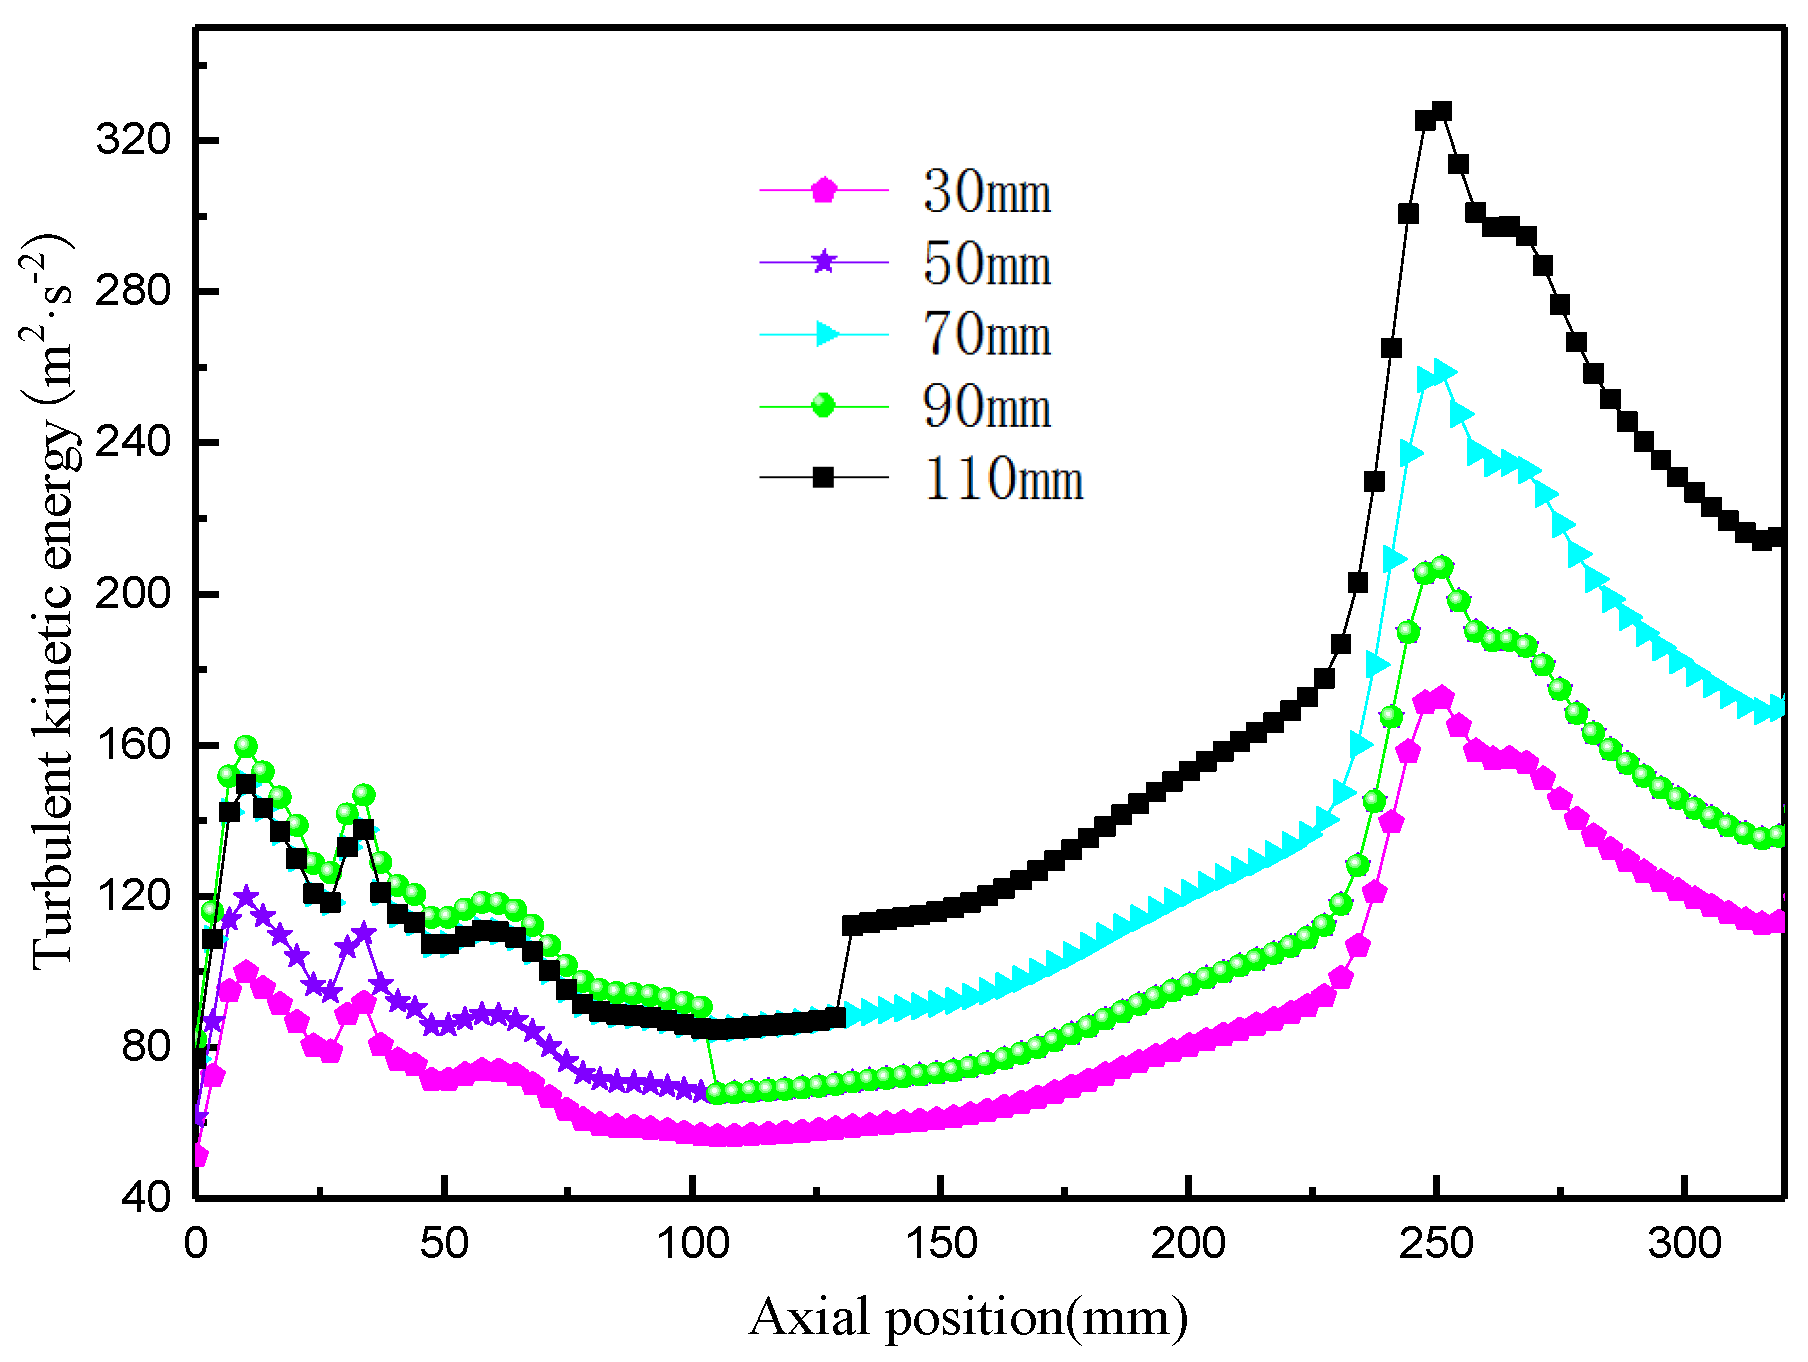
4.3.4. Effect of Underflow Orifice Diameter on Turbulent Kinetic Energy

The effect of underflow orifice diameter on the turbulent kinetic energy of the composite curvilinear inlet body cyclone is shown in Figure 24. The figure shows that the turbulent kinetic energy decreases and then increases along the axial position. There is a peak point (near the bottom of the overflow pipe) at a certain position in the pre-separation region (220 mm to 300 mm), which also fully explains the existence of a variety of flow intersections in the column section region. As the bottom flow opening increases, the turbulent kinetic energy gradually decreases. This is because the increase in the bottom flow opening makes it easier for the fluid to be discharged from the bottom flow opening, and the ratio of vortex occurrence decreases. Additionally, the increase in the bottom flow rate reduces the fluid resistance, resulting in a decrease in turbulent kinetic energy.

4.4. Effect of Inlet Aspect Ratio on Internal Flow Field of Composite Curved-Feed-Body Hydrocyclone

A rectangular inlet cross-section has better classification performance than a circular cross-section. In the case of the same equivalent diameter, the appropriate aspect ratio has an important impact on the stability of the internal flow field of the cyclone. In order to explore the influence of the inlet aspect ratio on the flow pattern within the cyclone, and then determine the appropriate aspect ratio of the composite curved-inlet-body cyclone, six different aspect ratios of 0.5, 0.8, 1, 2, 3, and 4 are selected for numerical investigation.

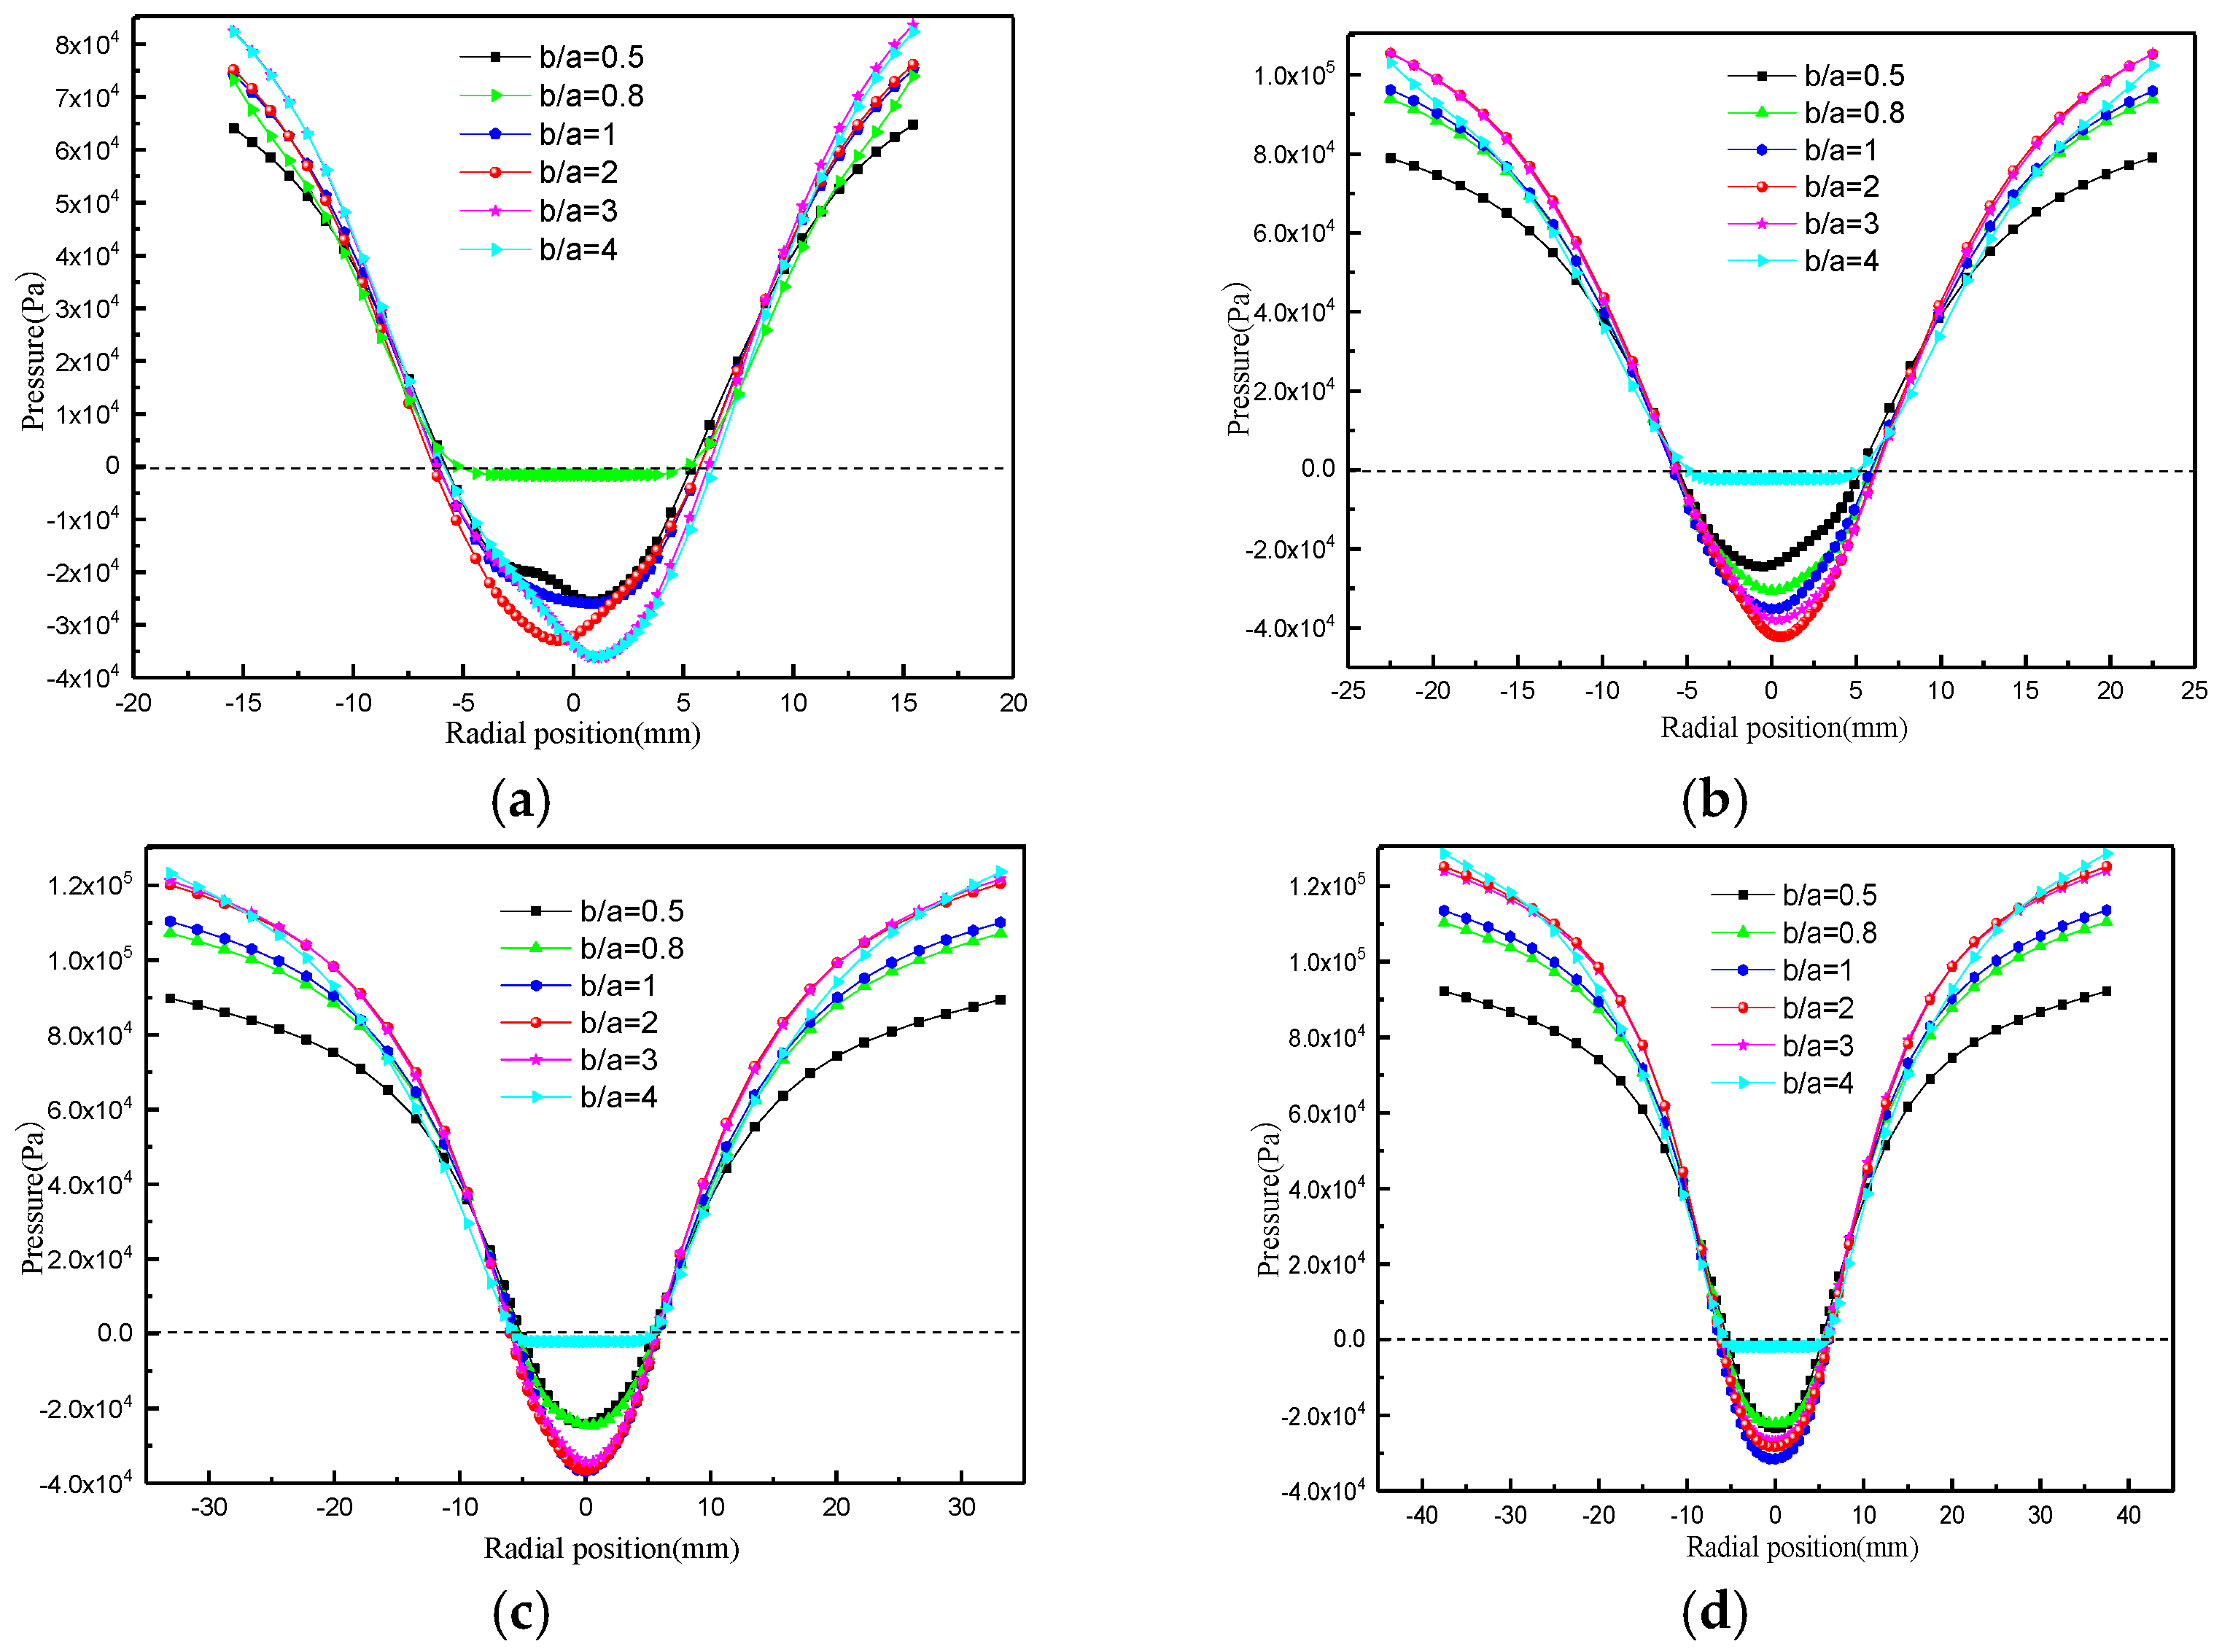
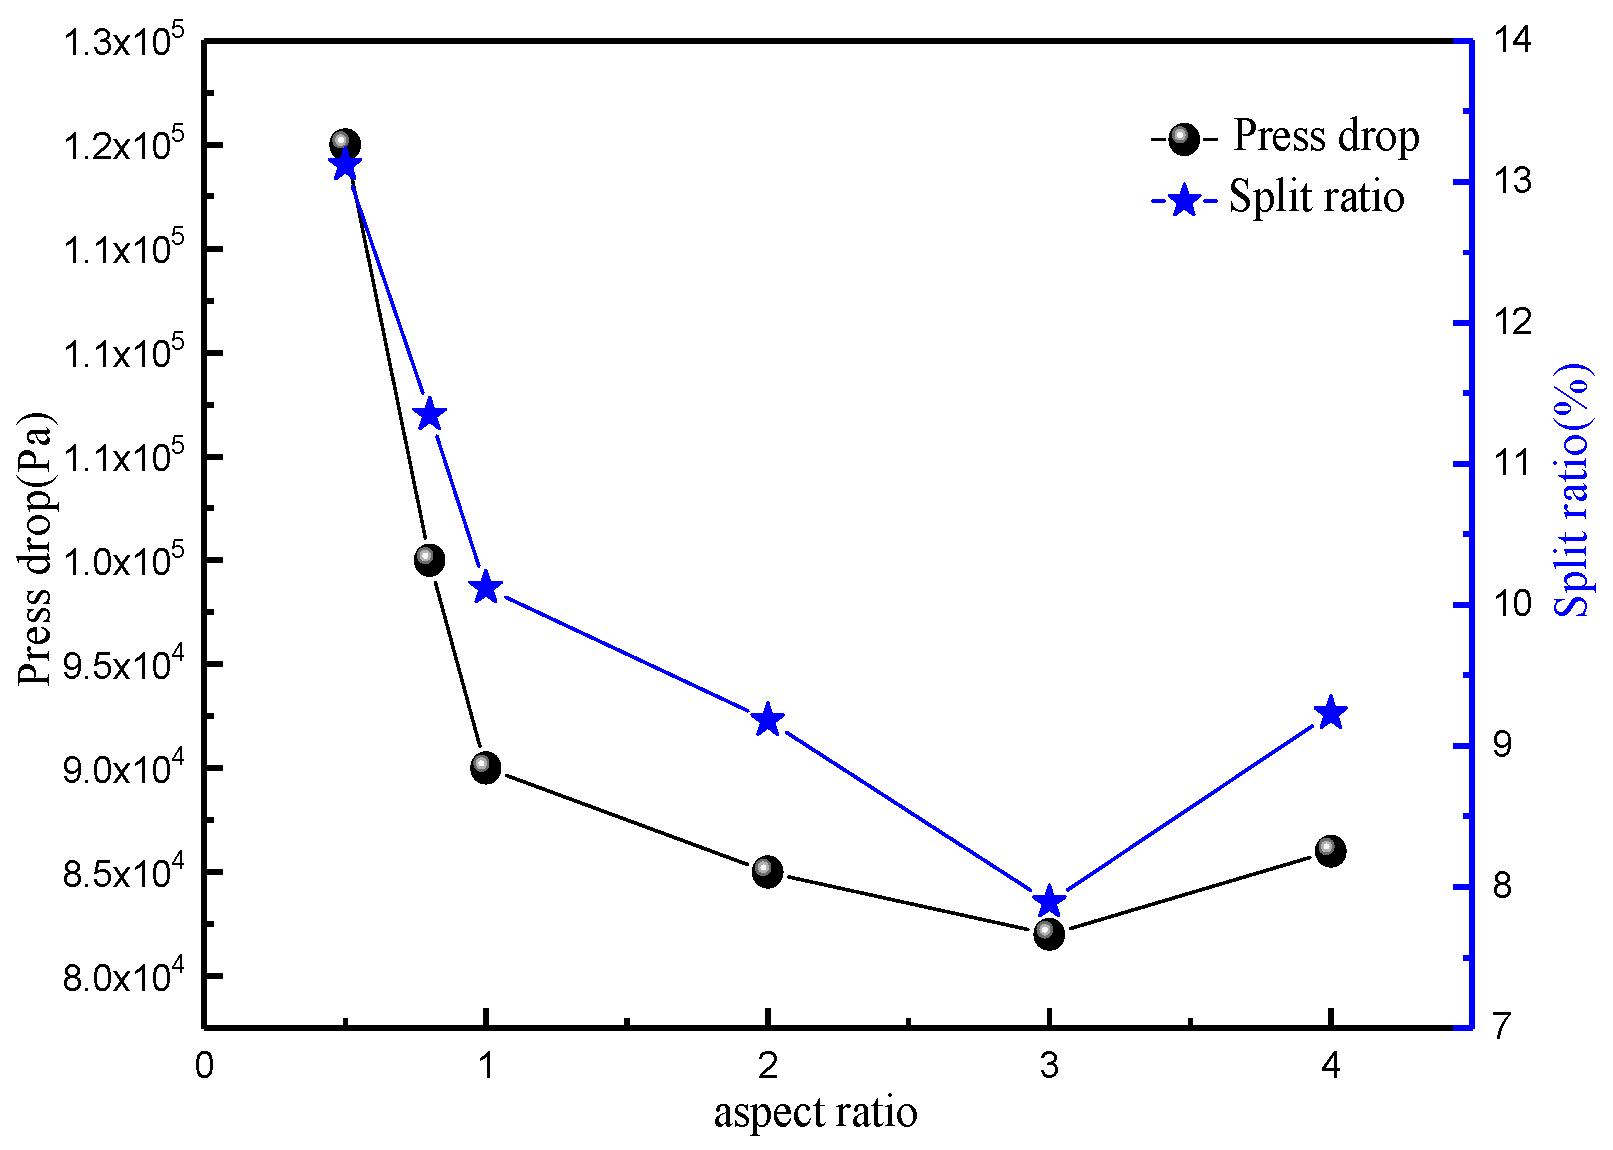
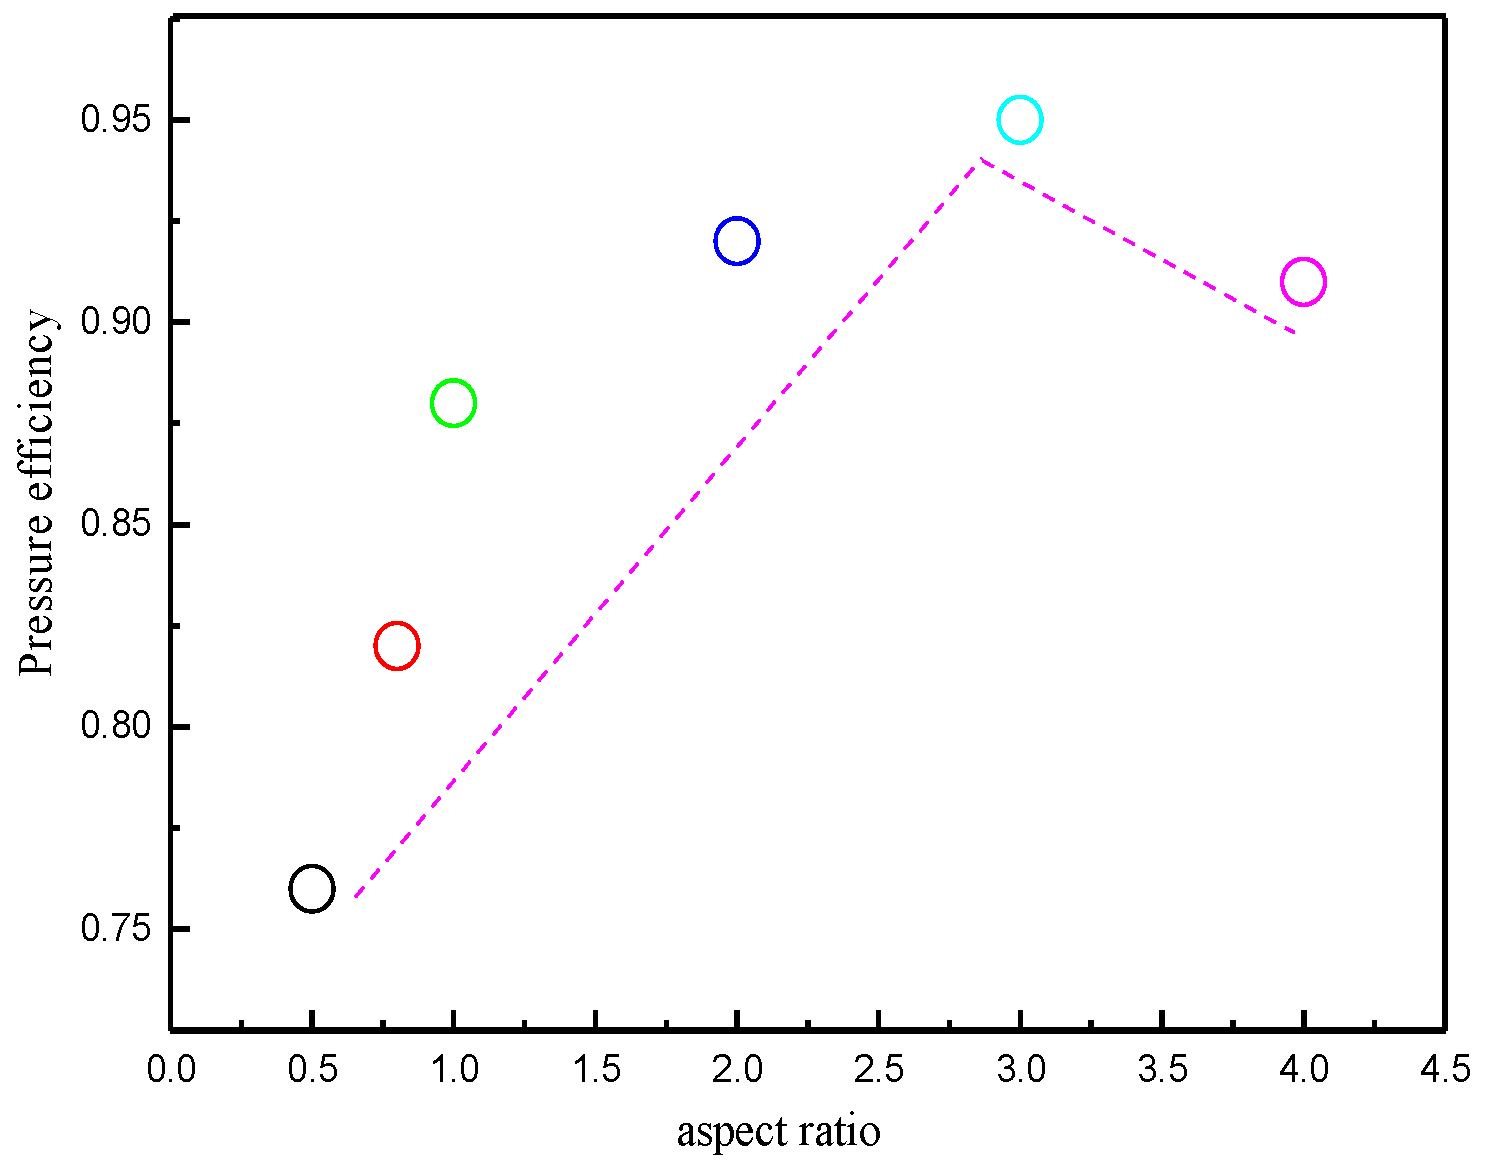
4.4.1. Effect of Inlet Aspect Ratio on Pressure Field

The effect of the inlet aspect ratio on static pressure is shown in Figure 25. As the aspect ratio increases, the static pressure shows a trend of increasing and then decreasing along the radial direction. When the aspect ratio is 3, the static pressure is the largest and shows a trend of gradually increasing along the axial position, but the overall change is not large. The effect of aspect ratio on pressure drop is shown in Figure 26. With an increase in the aspect ratio, the pressure drop and shunt ratio decrease and then increase. When the aspect ratio is 3, the pressure drop is the smallest and the energy consumption is the lowest.
Pressure efficiency changes with the aspect ratio, as shown in Figure 27. The pressure efficiency increases with the aspect ratio and then decreases. This is because smaller and larger aspect ratios can cause a dramatic ‘narrow mouth effect’, which is not conducive to the stability of the flow field. When the aspect ratio is 3, the pressure efficiency is the largest. At this point, the efficiency of converting fluid pressure energy into kinetic energy is the highest.

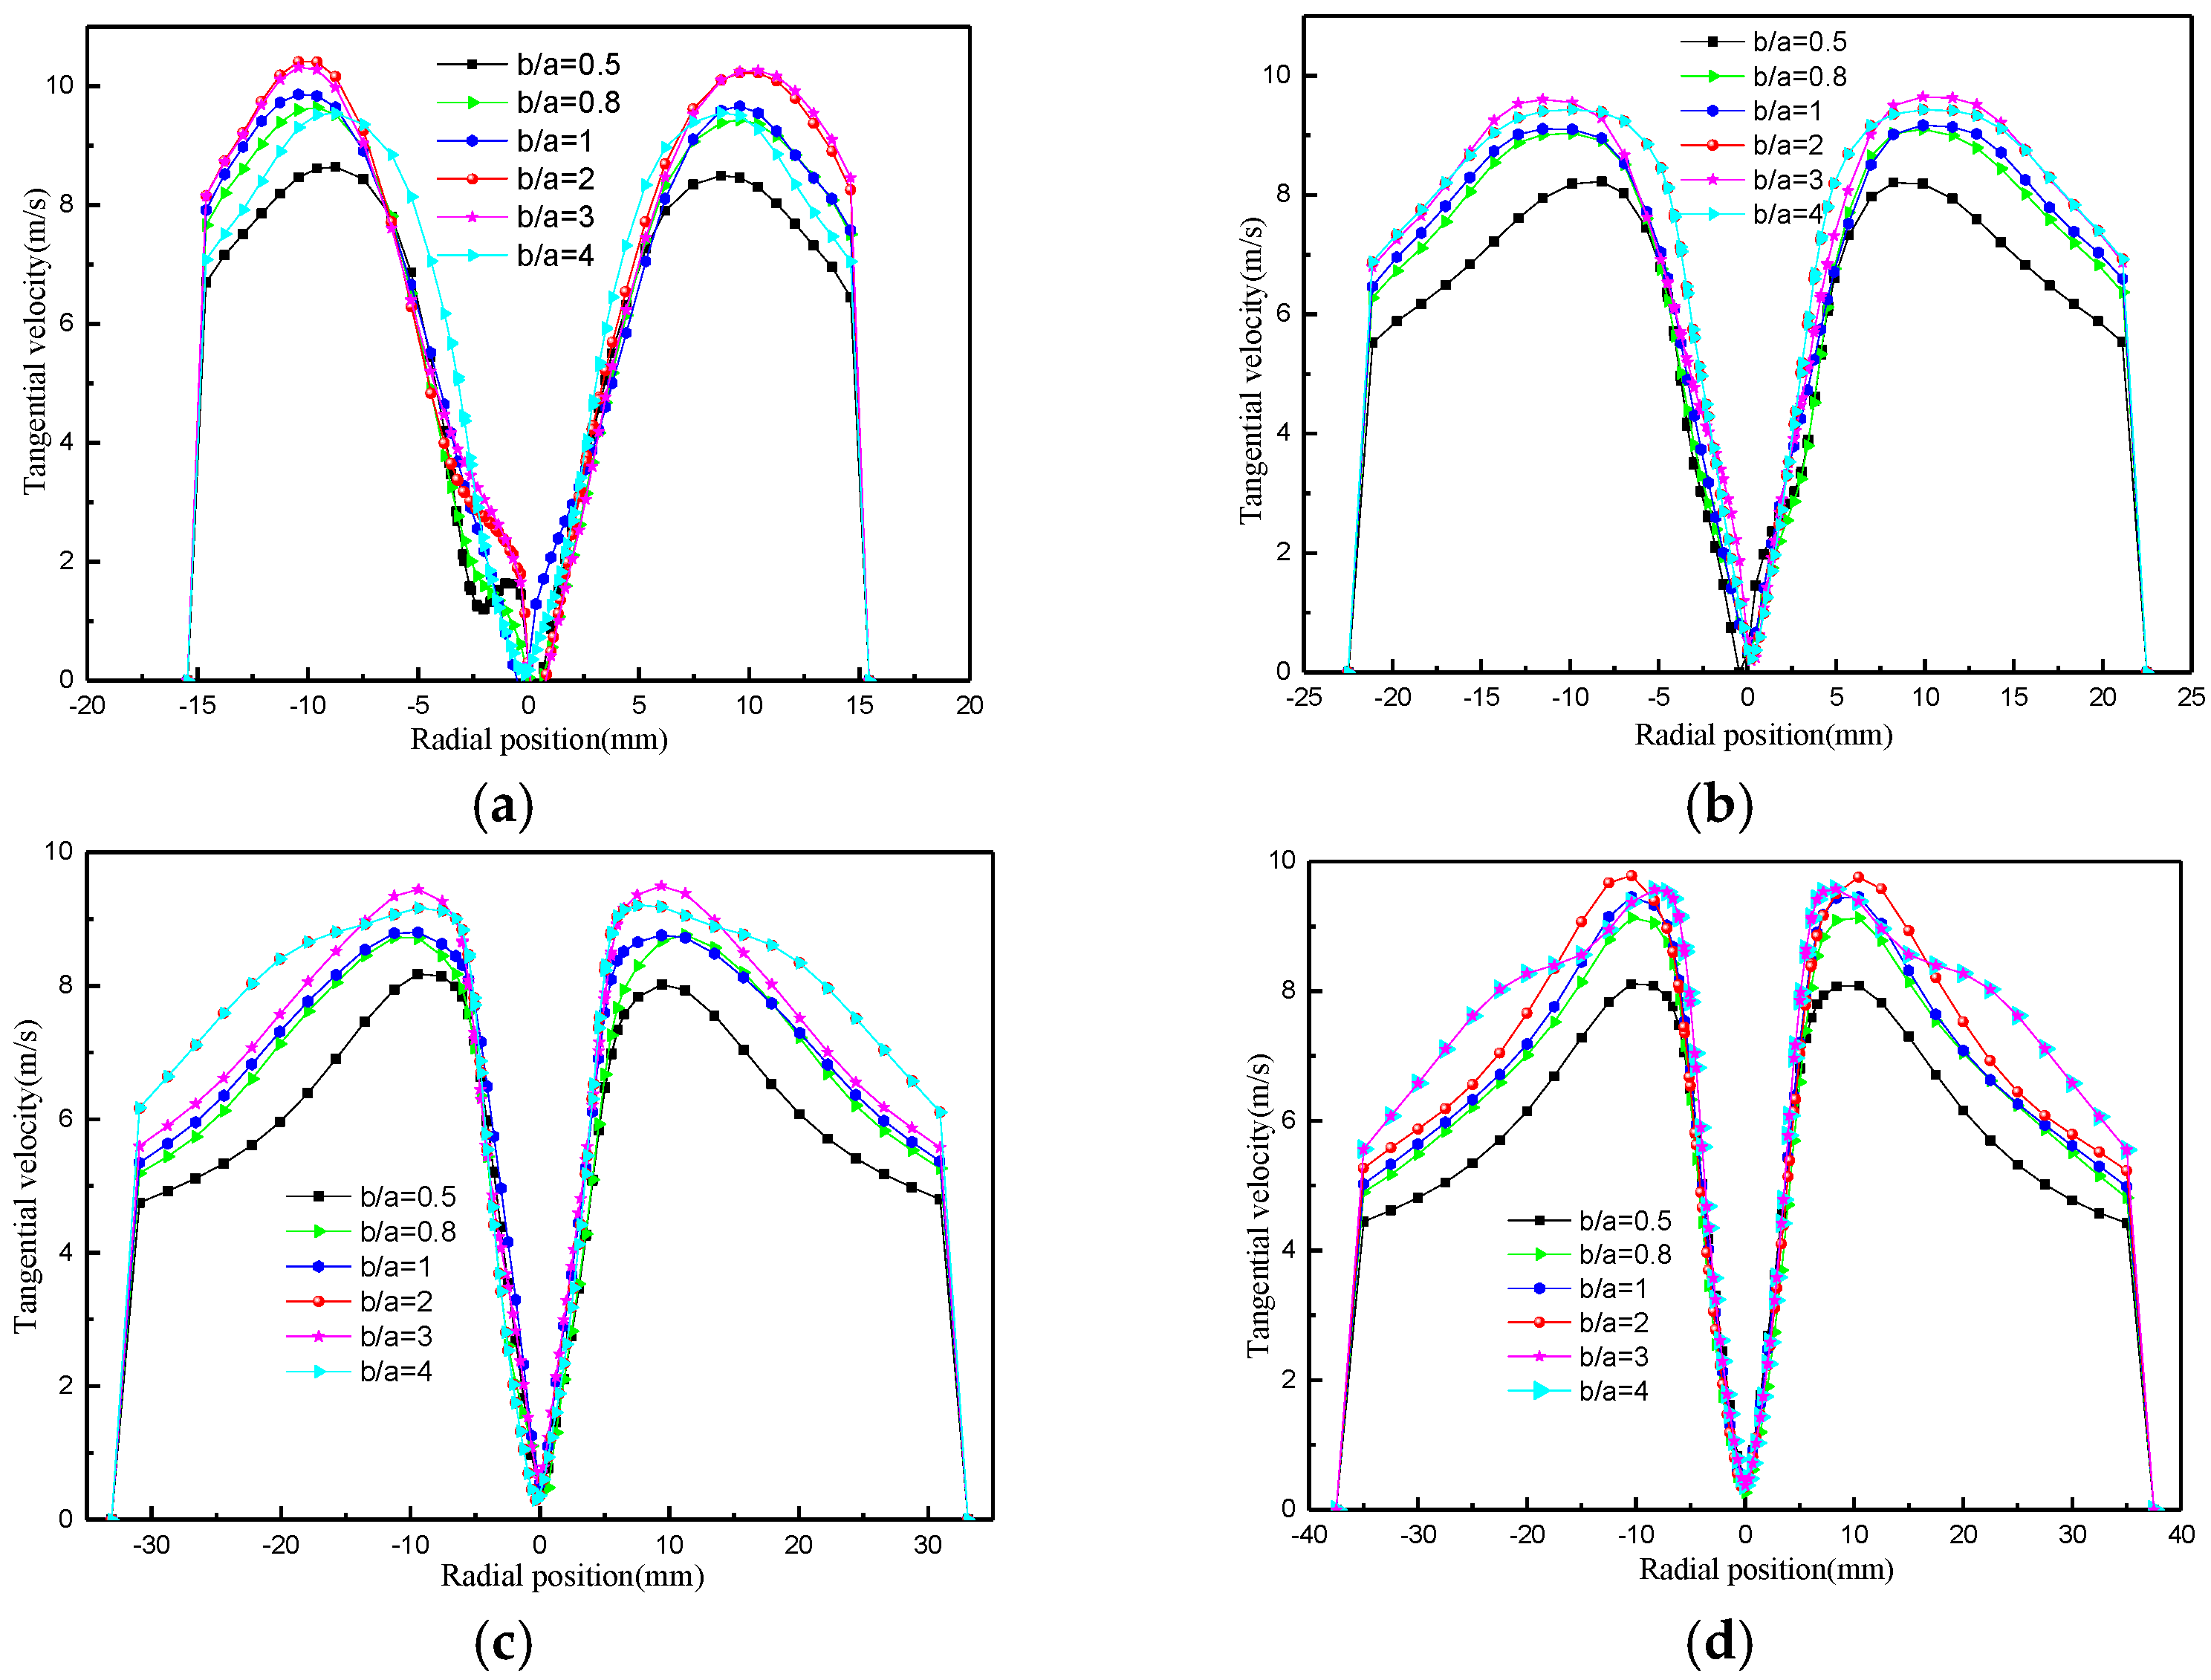
4.4.2. Effect of Inlet Aspect Ratio on Tangential Velocity

The effect of the inlet aspect ratio on tangential velocity is shown in Figure 28. Tangential velocity, with an increase in the aspect ratio, shows a trend of increasing and then decreasing. When the aspect ratio is 3, the tangential velocity is the largest. Upon continuing to increase the aspect ratio, the tangential velocity becomes smaller. A ratio that is too large or too small will cause violent turbulence pulsation, which is not conducive to the stability of the flow field and can also cause excessive energy loss. Therefore, the selection of a suitable aspect ratio should be based on the actual situation.

4.4.3. Effect of Inlet Aspect Ratio on Axial Velocity

The effect of aspect ratio on axial velocity is shown in Figure 29. In the outer rotating flow, the axial velocity shows a tendency to increase and then decrease with an increase in the aspect ratio, and in the inner rotating flow, the axial velocity increases with an increase in the aspect ratio. When the aspect ratio is very small (0.5–0.8), the symmetry of the axial velocity graph line is poor, and the value of the axial velocity fluctuates greatly in the range of Z = 80 mm–120 mm. The larger fluctuating velocity not only generates an axial vortex, but also causes turbulence in the flow field.
The effect of the inlet aspect ratio on the LZVV is shown in Figure 30. When the aspect ratio is very small (0.5), the LZVV changes repeatedly with the radial position in the central position region of the conical section. The LZVV nearly coincides with the outer edge of the air column at the position of Z = 15 mm, and the inner cyclonic space is severely compressed. The frequent squeezing of the fluid on the air column leads to an increase in the reaction force of the air column on the fluid, which not only exacerbates the fluctuation of the flow field, but also causes an increase in turbulent kinetic energy, resulting in additional energy loss and turbulence pulsation. This is also an important manifestation of the instability of the flow field. When the aspect ratio is greater than 0.5, the LZVV does not change much, and there is only a slight change in the upper part of the cone section. The change in the internal rotation space is small.

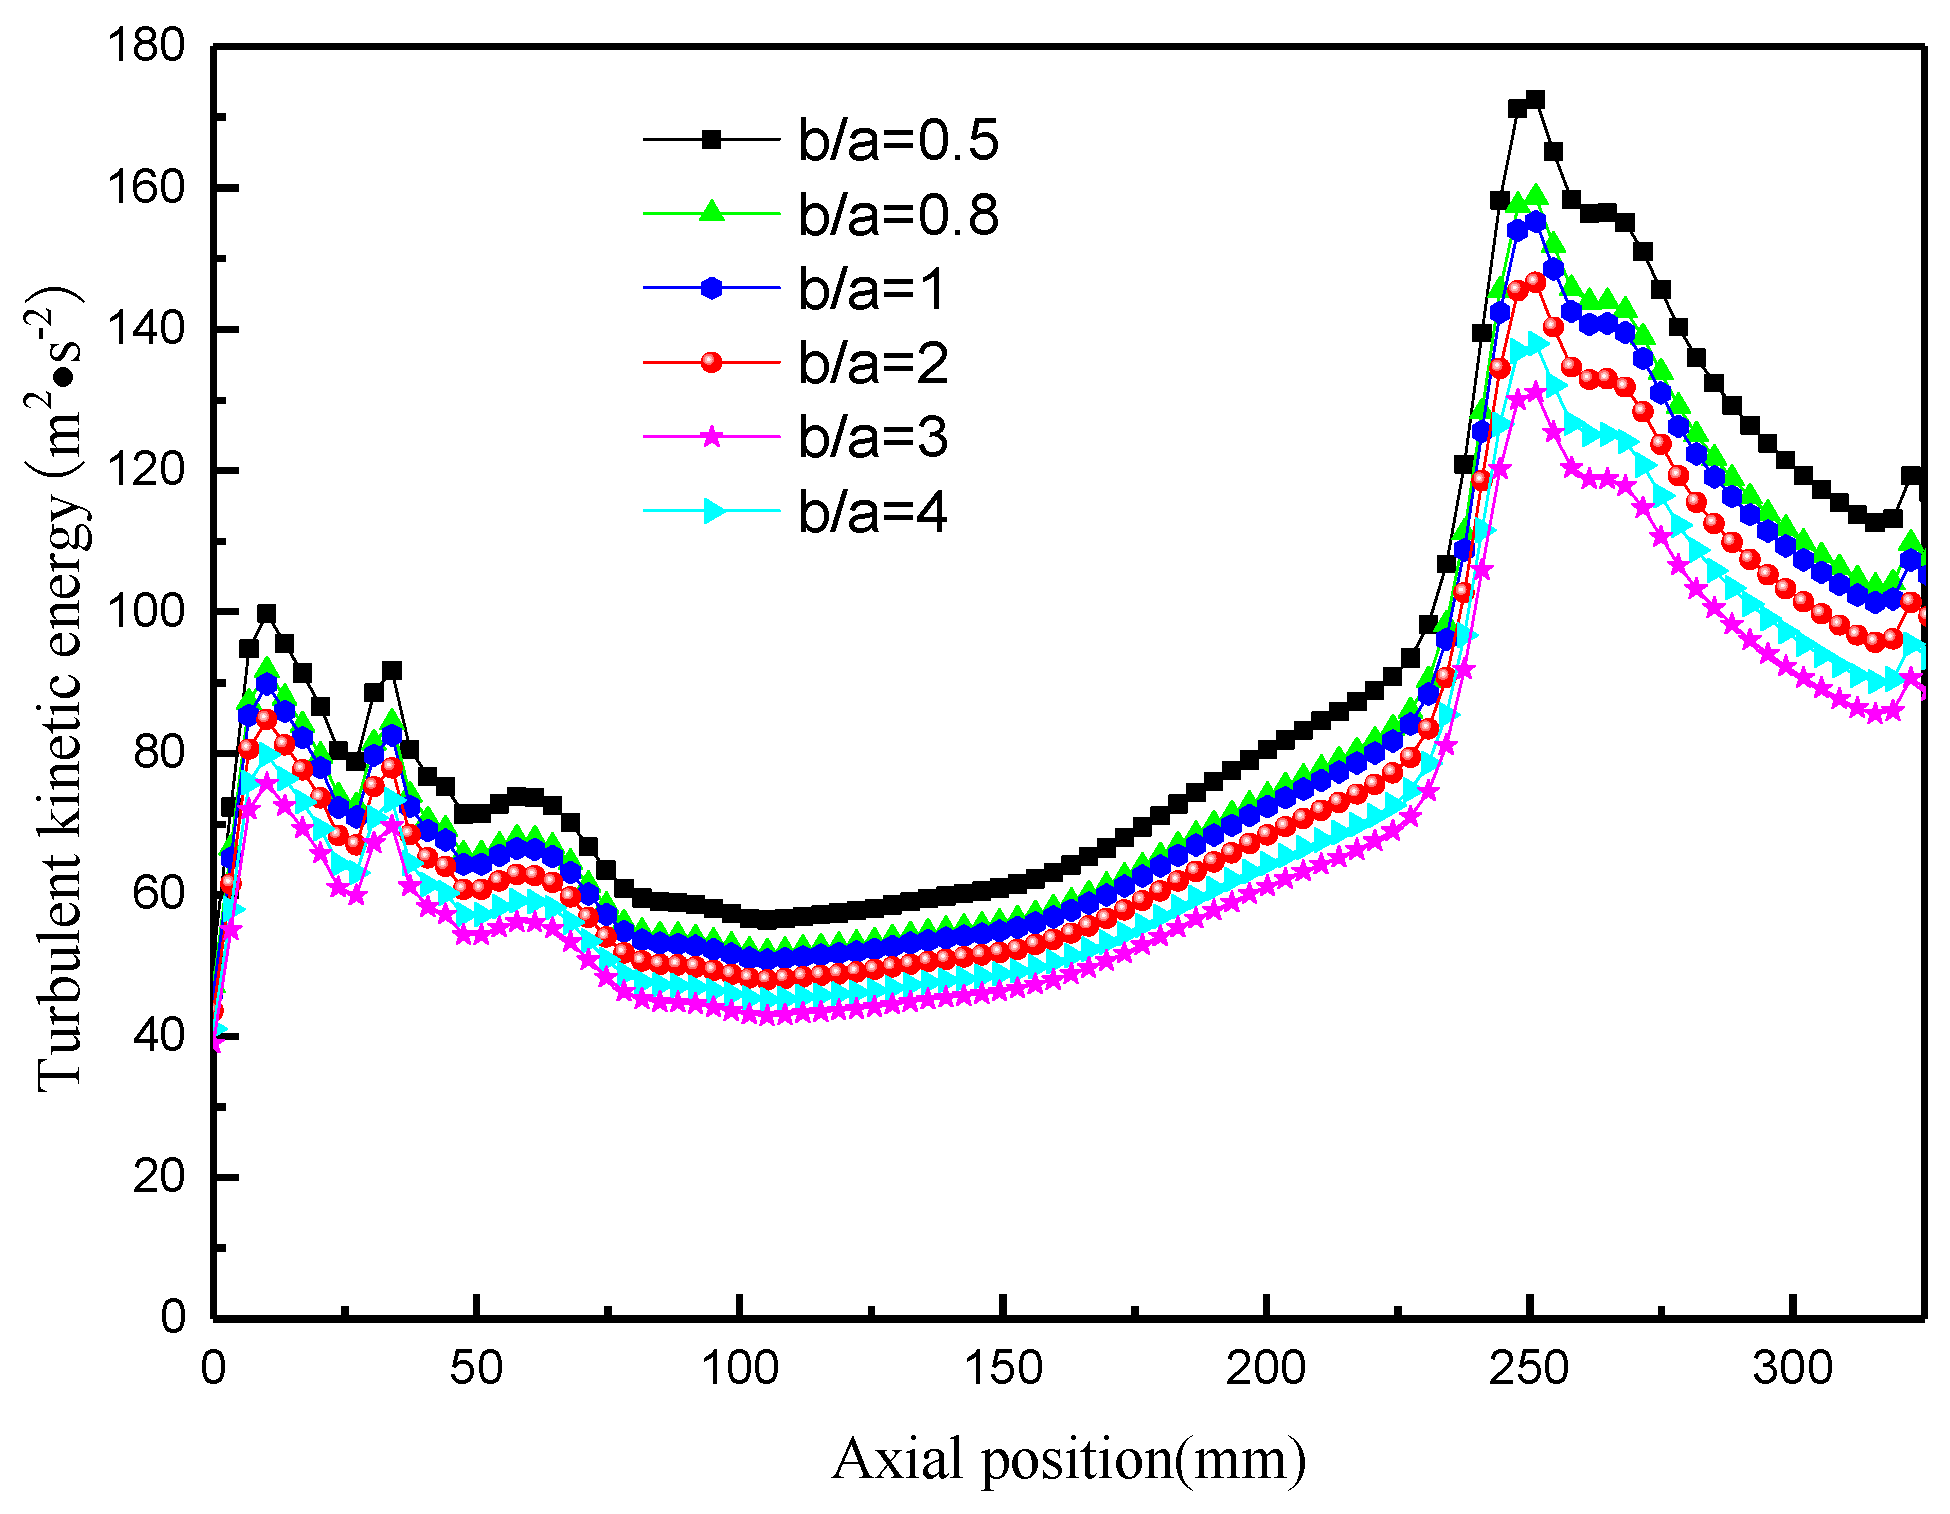
4.4.4. Effect of Aspect Ratio on Turbulent Kinetic Energy

The change in turbulent kinetic energy with aspect ratio is shown in Figure 31. With an increase in aspect ratio, the turbulent kinetic energy decreases initially and then increases, which is consistent with the rate of change in velocity. If the aspect ratio is too large or too small, it will lead to a narrow inlet, exacerbating the fluctuation of the flow field and enhancing internal turbulence, resulting in increased energy consumption.

5. Conclusions

(1)
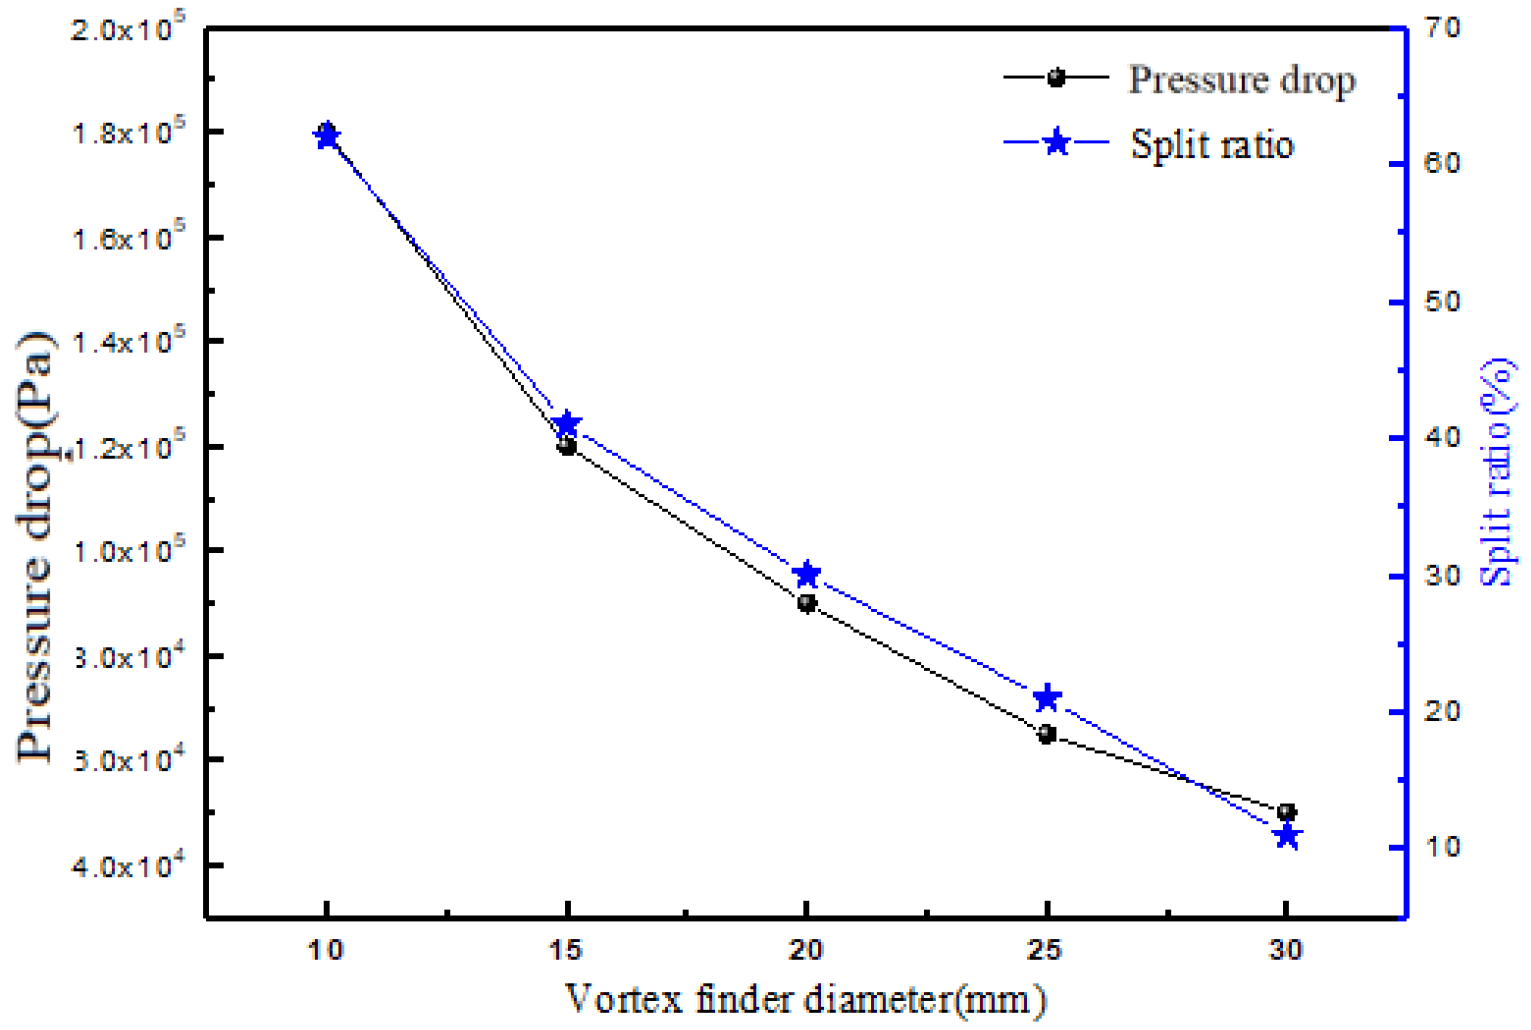
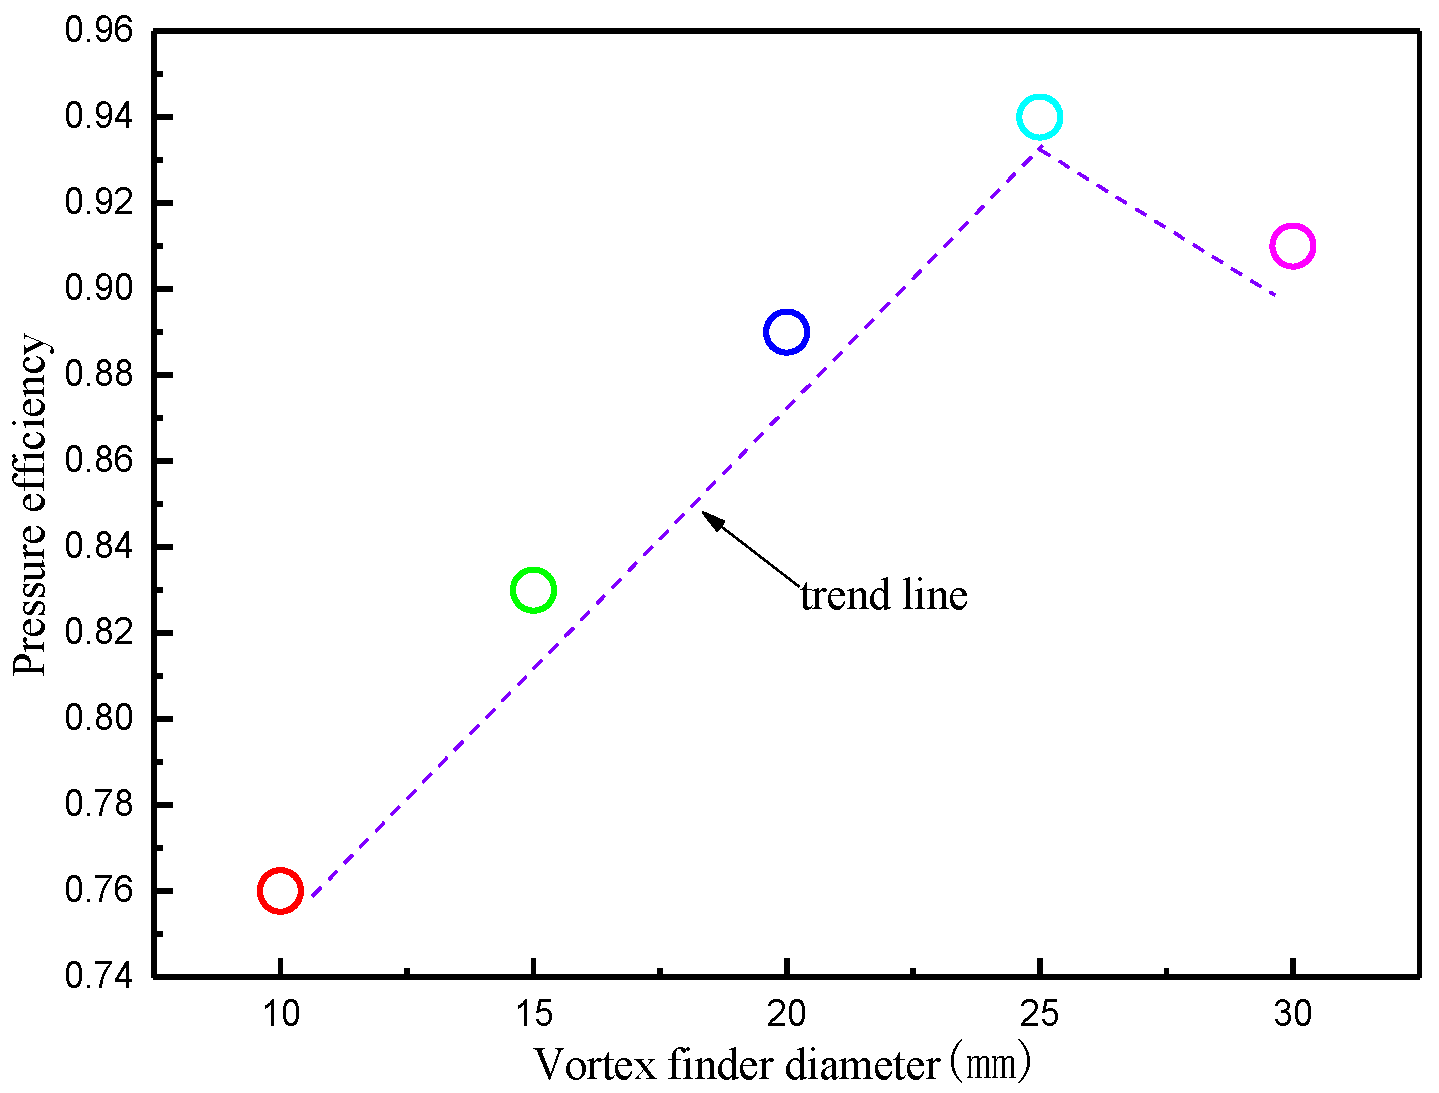
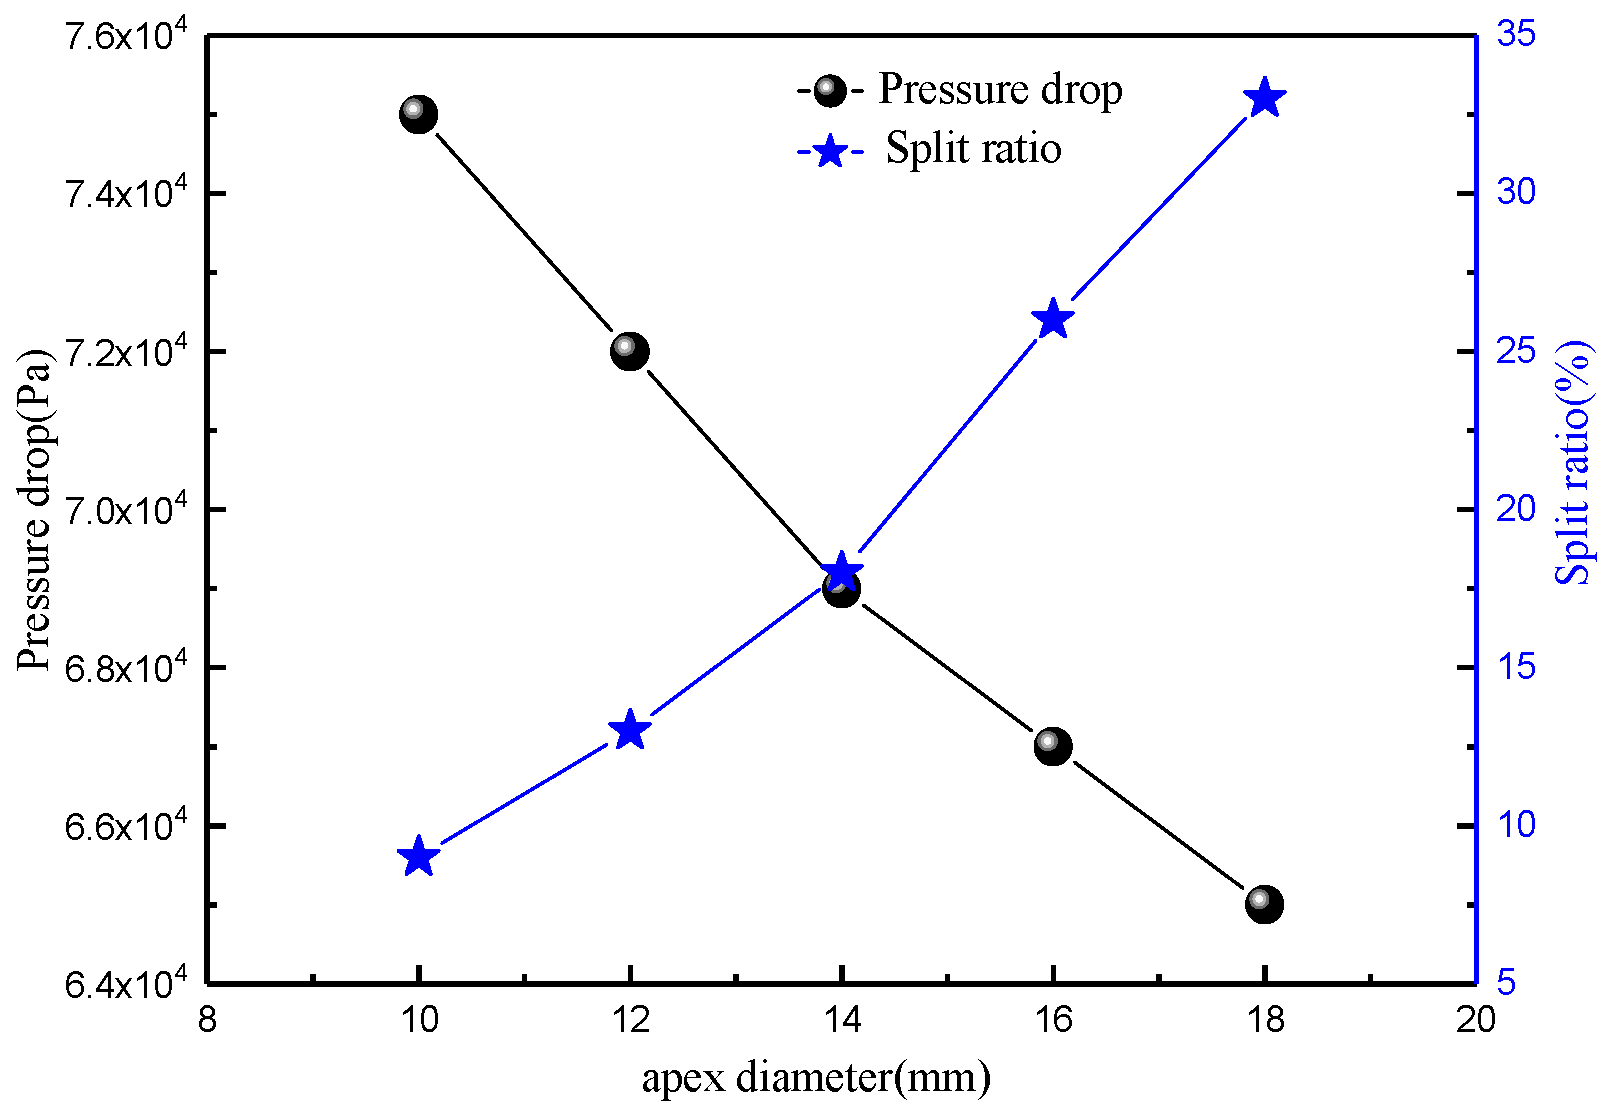
When the diameter of the overflow pipe is smaller than a certain critical value, the axial velocity is only the downward movement of the external cyclone, accompanied by a large number of circulations. The cyclone loses its classification significance. As the diameter of the overflow tube increases, the axial velocity of the inner cyclone gradually increases, and the LZVV gradually moves outward. The pressure drop, tangential velocity, splitting ratio, and turbulence intensity are greatly reduced.
(2)
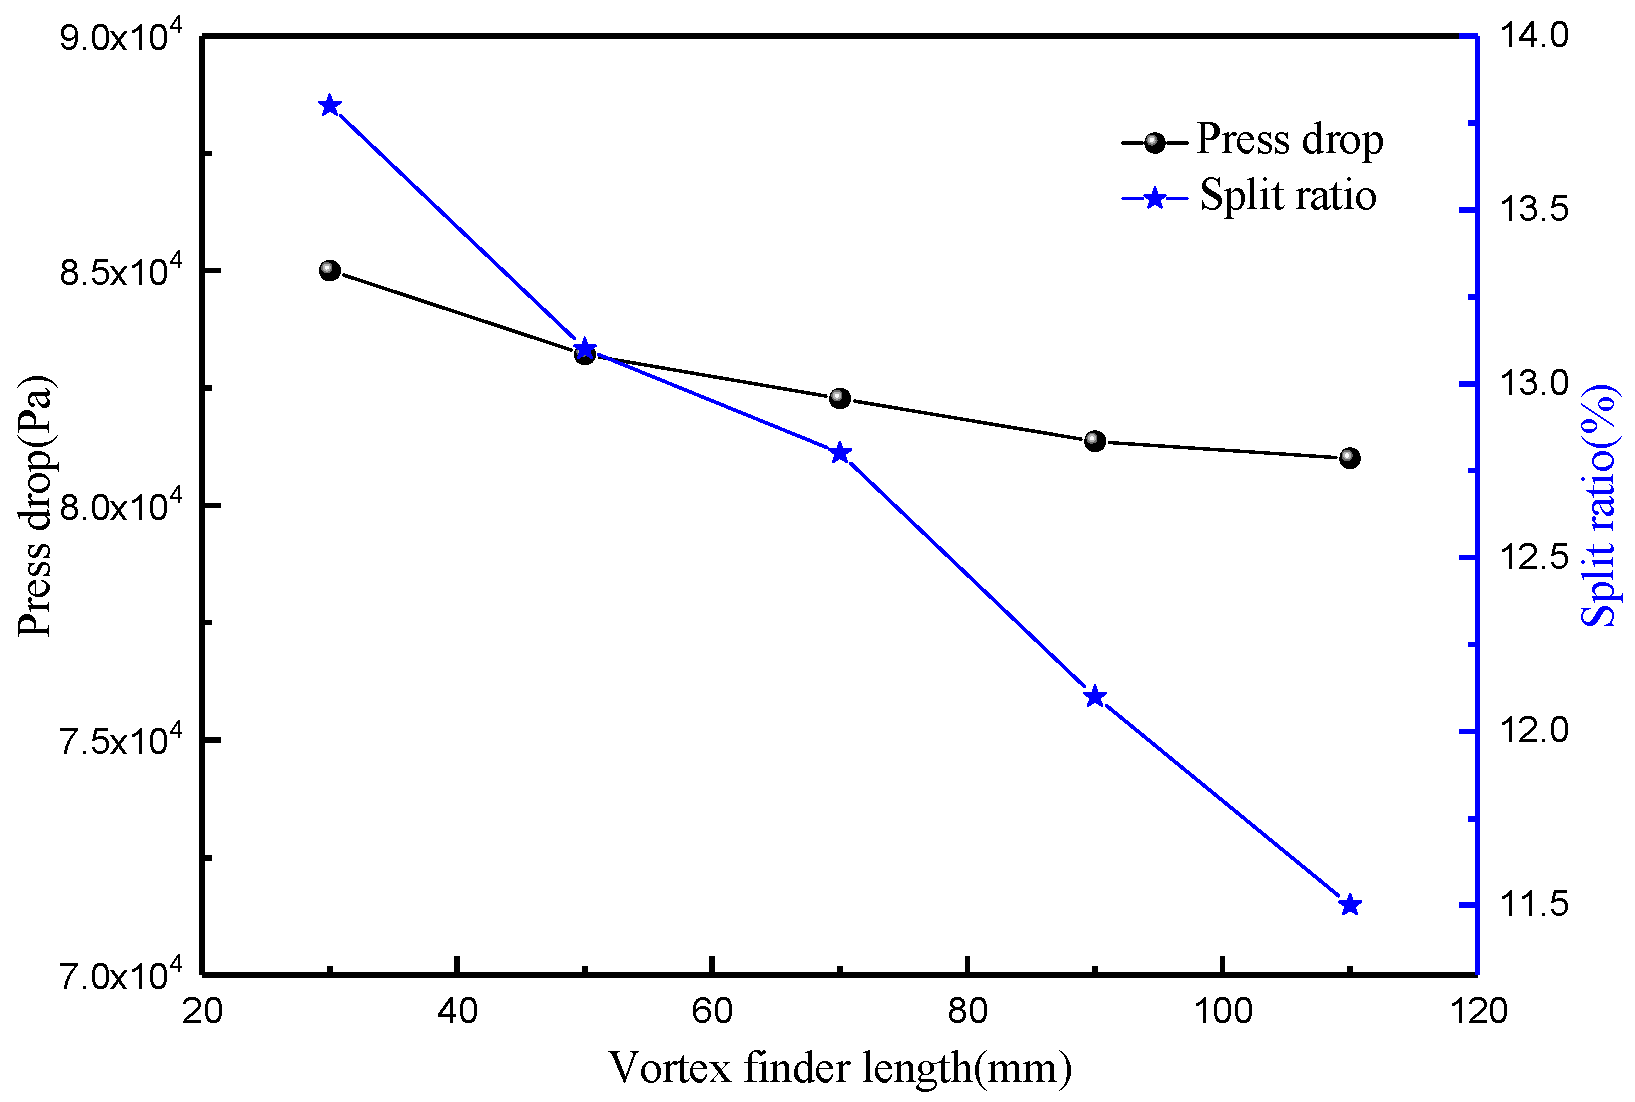
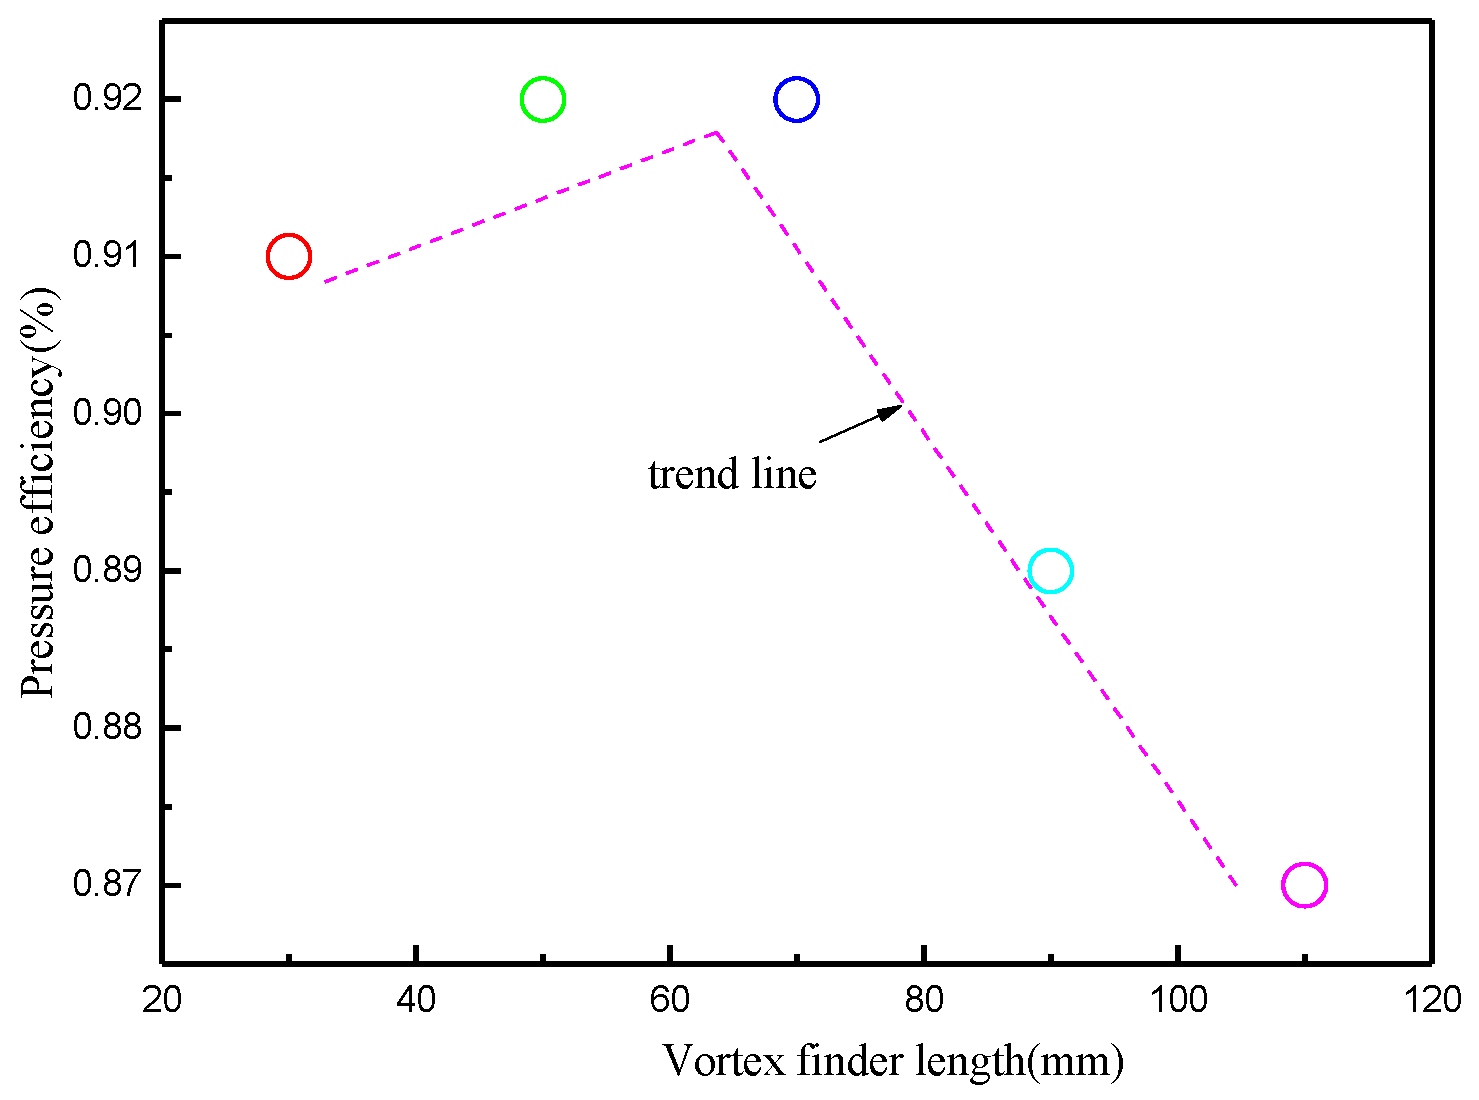
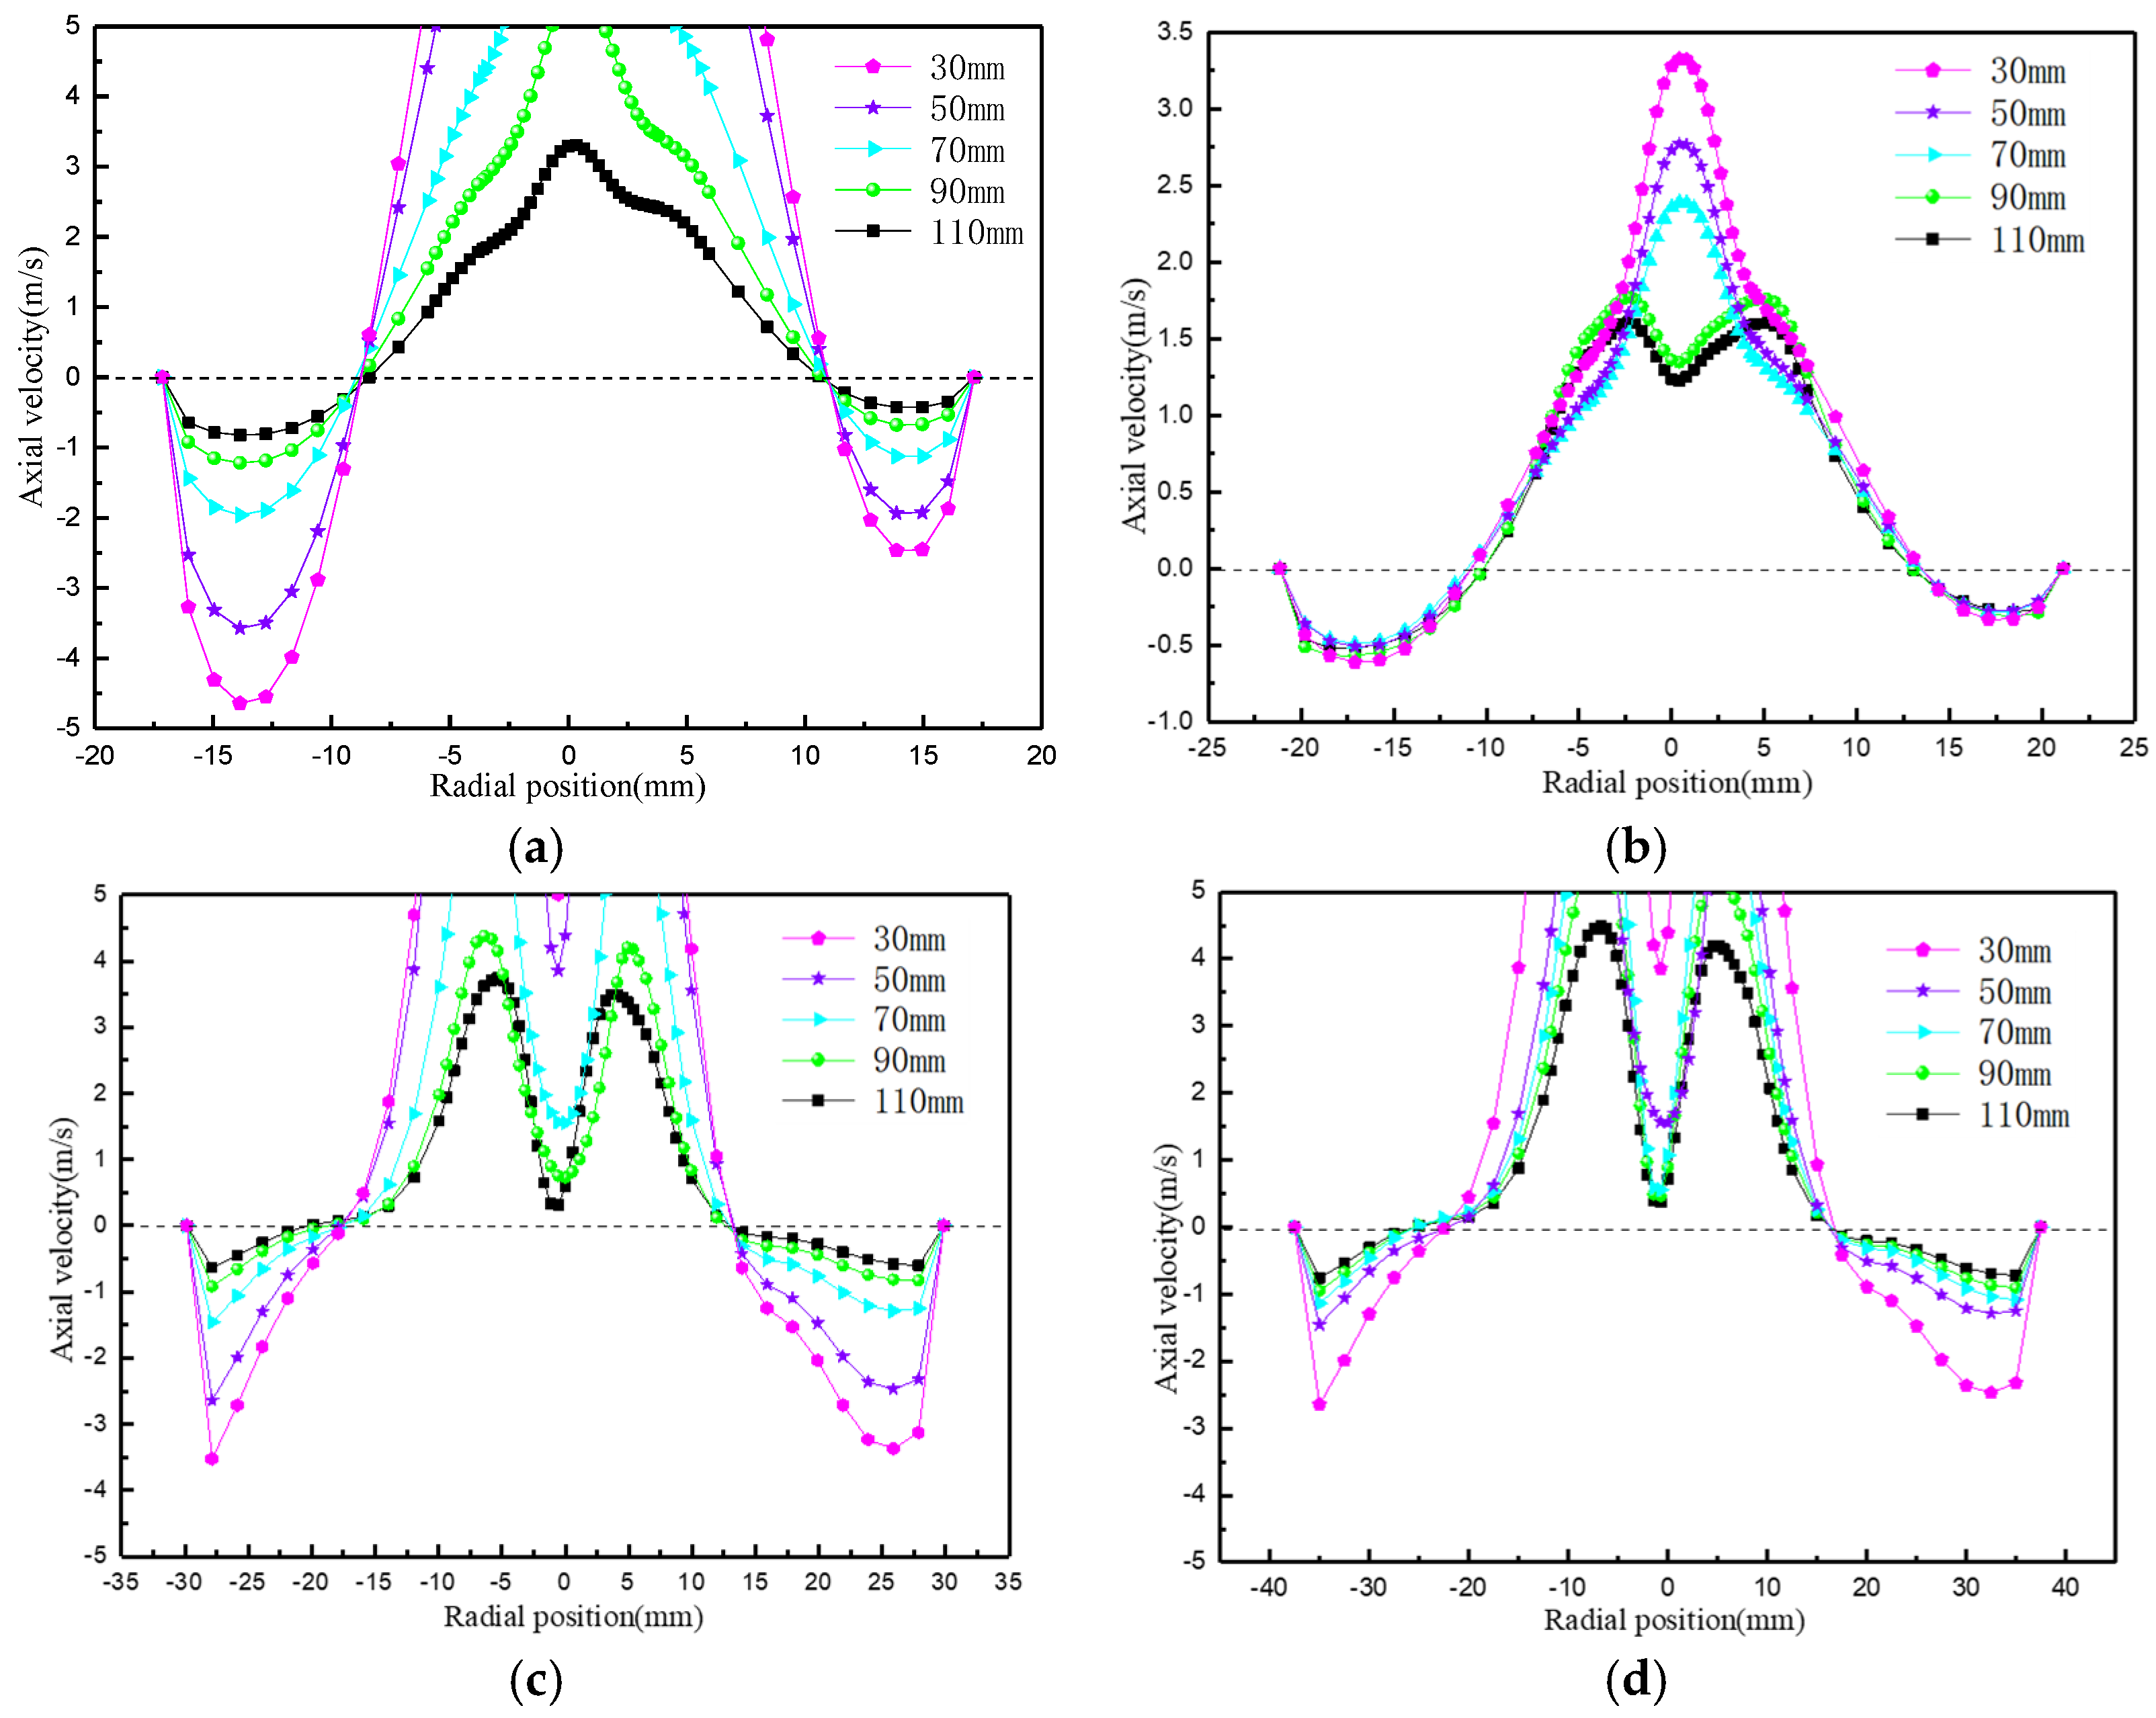
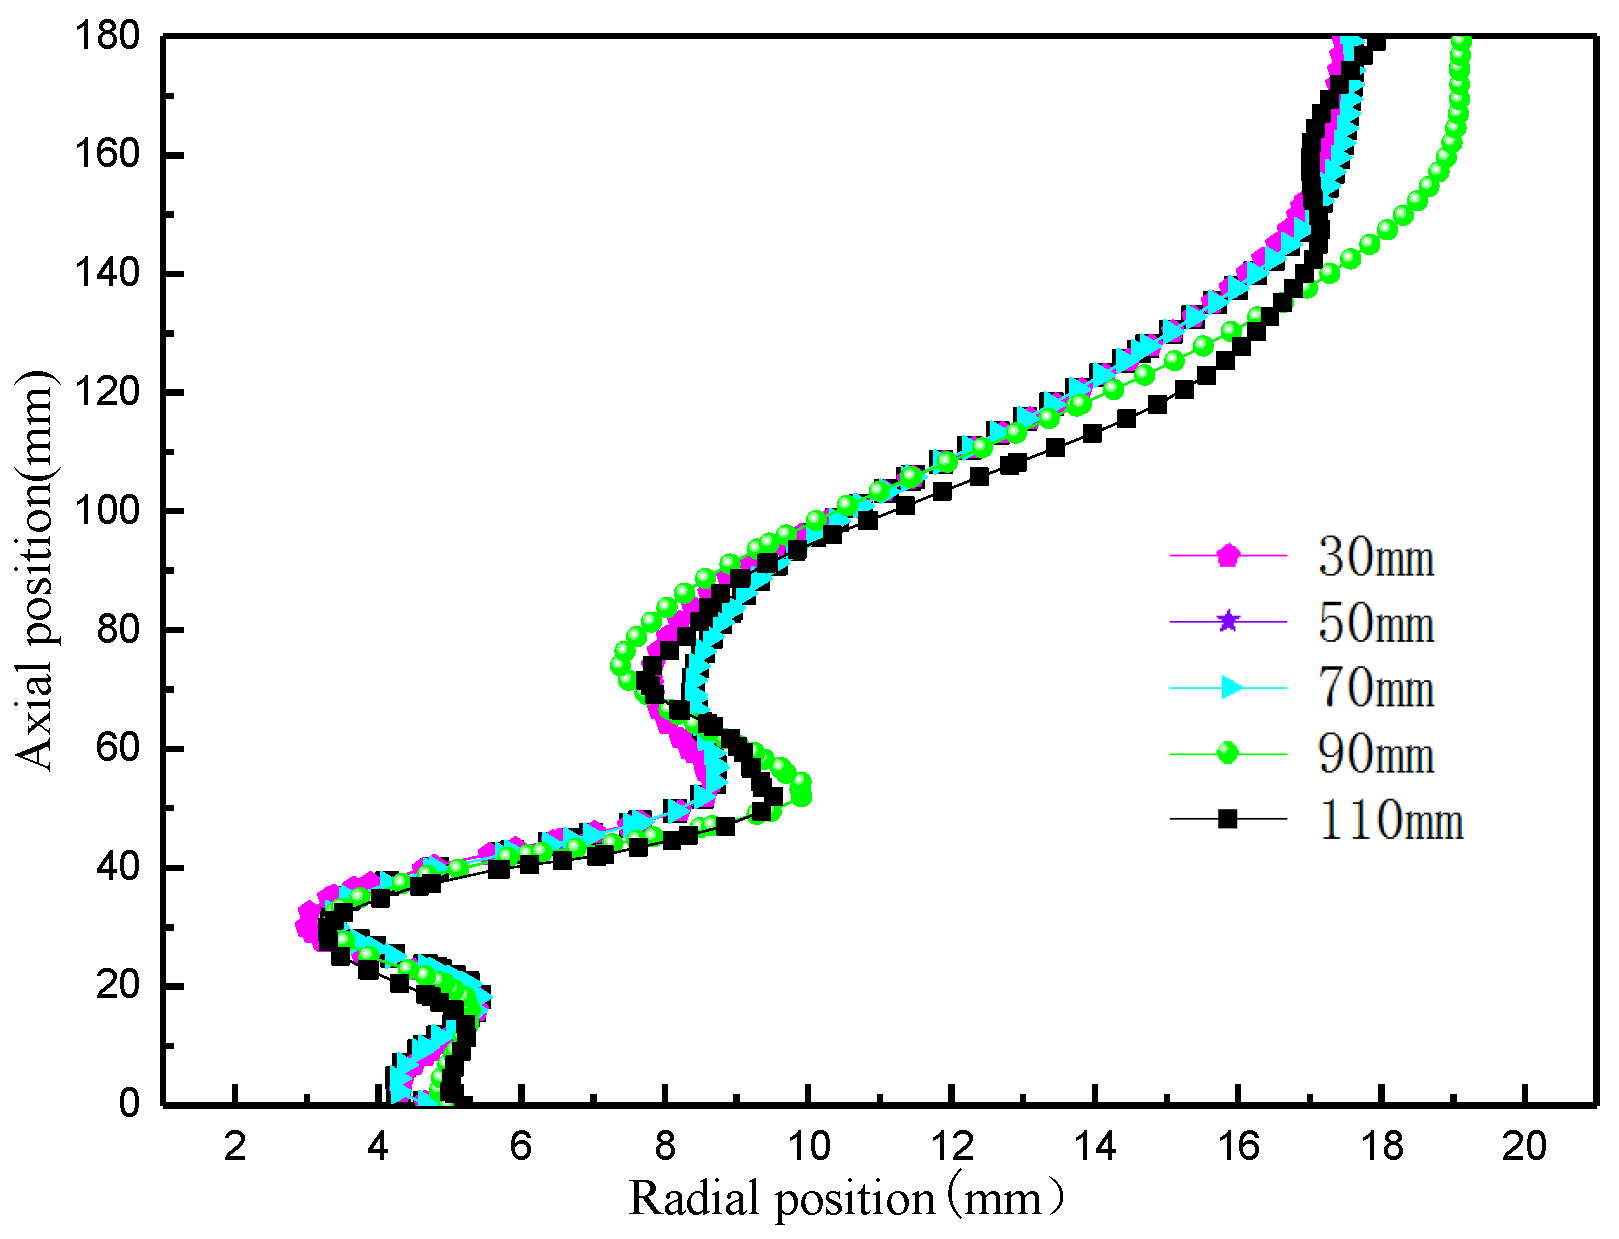
The static pressure and tangential velocity are almost unaffected by the insertion depth of the overflow pipe, but the axial velocity decreases with increasing insertion depth while the LZVV migrates outward. The increase in insertion depth results in a slight decrease in the pressure drop and divergence ratio and a gradual increase in turbulence intensity.
(3)
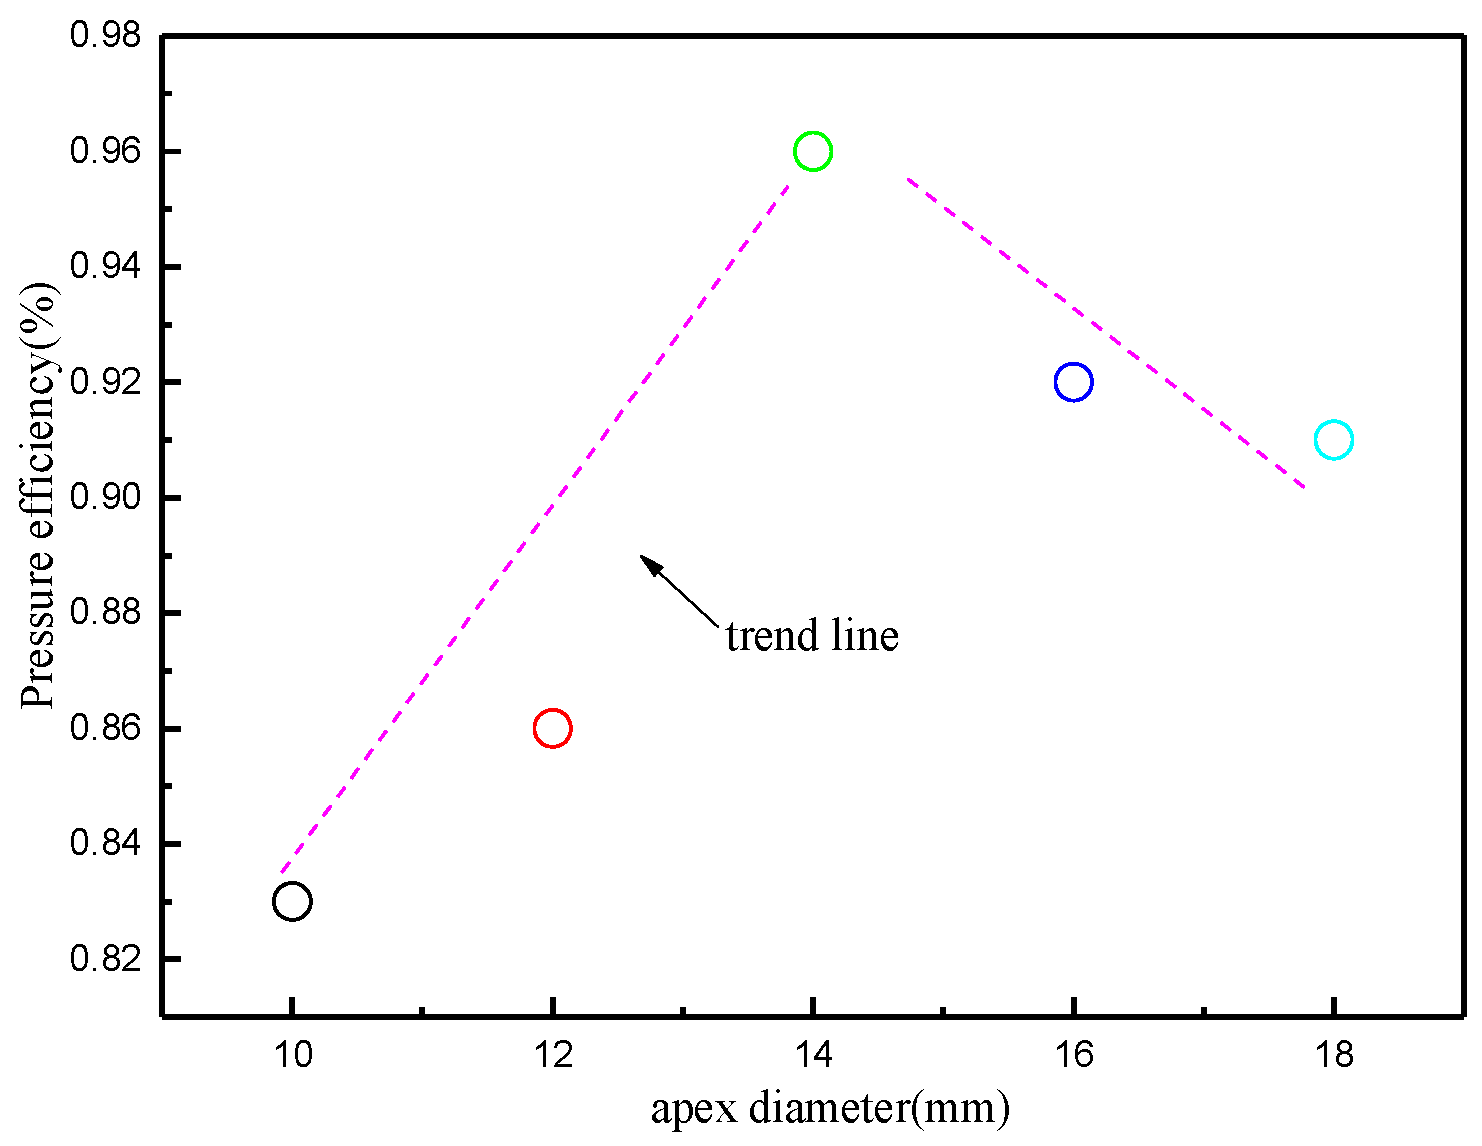
The underflow orifice diameter has a significant effect on the cyclone flow field. With an increase in the underflow orifice diameter, the pressure drop and turbulence intensity are reduced, and the divergence ratio gradually increases. A change in the bottom orifice diameter has a small effect on the tangential velocity and the axial velocity of the external cyclone, but the axial velocity of the internal cyclone increases with an increase in the bottom orifice diameter.
(4)
The inlet aspect ratio has a direct influence on the stability of the flow field. With an increase in the aspect ratio, the static pressure and tangential velocity gradually increase, while the pressure drop and diversion ratio gradually decrease. Increasing the aspect ratio also causes the axial velocity of the internal cyclone to gradually increase. Too small an aspect ratio is prone to causing flow field fluctuations, increased turbulence intensity, and irregular changes in the LZVV.

Author Contributions

Data curation, Y.W., F.L. and H.Y.; Investigation, Y.W., W.Z. and Y.Z.; Methodology, Y.W. and Z.L.; Project Administration, H.Y.; Validation, Y.W., F.L. and H.Y.; Writing—Original Draft, W.Z.; Writing—Review and Editing, Z.L. and H.H. All authors have read and agreed to the published version of the manuscript.

Funding

This work was financially supported by the Shandong Provincial Natural Science Foundation (ZR2024QE381).

Data Availability Statement

Data are contained within the article.

Acknowledgments

We are grateful to Jinwen You for providing funding support.

Conflicts of Interest

The authors declare no conflicts of interest.

References

  1. Rajamani, R.K.; Milin, L. Fluid-flow model of the hydrohydrocyclone for concentrated slurry classification. In Hydrohydrocyclone, Analysis and Application: 4th International Conference, Southampton, UK, 23–25 September 1992; Springer: Dordrecht, The Netherlands, 1992; pp. 95–108. [Google Scholar]
  2. Vakamalla, T.R.; Kumbhar, K.S.; Gujjula, R.; Mangadoddy, N. Computational and experimental study of the effect of inclination on hydrohydrocyclone performance. Sep. Purif. Technol. 2014, 138, 104–117. [Google Scholar] [CrossRef]
  3. Brennan, M. CFD simulations of hydrohydrocyclones with an air core: Comparison between large eddy simulations and a second moment closure. Chem. Eng. Res. Des. 2006, 84, 495–505. [Google Scholar] [CrossRef]
  4. Wang, S.; Wang, L.; Huang, W. Bismuth-based photocatalysts for solar energy conversion. J. Mater. Chem. A 2020, 8, 24307–24352. [Google Scholar] [CrossRef]
  5. Li, F.; Liu, P.; Yang, X.; Zhang, Y. Numerical simulation on the effects of different feeding body structures on the flow field and separation performance in a hydrohydrocyclone. Powder Technol. 2020, 373, 254–266. [Google Scholar] [CrossRef]
  6. Misiulia, D.; Andersson, A.G.; Lundström, T.S. Effects of theinlet angleonthe flow pattern and pressure drop of a hydrocyclone with helical-roof inlet. Chem. Eng. Res. Des. 2015, 102, 307–321. [Google Scholar] [CrossRef]
  7. Motin, A.; Tarabara, V.V.; Petty, C.A.; Bénard, A. Hydrodynamics within flooded hydrohydrocyclones during excursion in the feed rate: Understanding of turndown ratio. Sep. Purif. Technol. 2017, 185, 41–53. [Google Scholar] [CrossRef]
  8. Farzanegan, A.; Khorasanizadeh, N.; Sheikhzadeh, G.A.; Khorasanizadeh, H. Laboratory and CFD investigations of the two-phase flow behavior in flotation columns equipped with vertical baffle. Int. J. Miner. Process. 2017, 166, 79–88. [Google Scholar] [CrossRef]
  9. Pandey, S.; Wasilewski, M.; Mukhopadhyay, A.; Prakash, O.; Ahmad, A.; Brar, L.S. Multi-Objective Optimization of Cyclone Separators Based on Geometrical Parameters for Performance Enhancement. Appl. Sci. 2024, 14, 2034. [Google Scholar] [CrossRef]
  10. Baltrėnas, P.; Crivellini, A.; Leonavičienė, T.; Chlebnikovas, A. Investigation on particulate matter and gas motion processes in the advanced multi-channel cyclone-separator with secondary gas inlets. Environ. Eng. Res. 2022, 27, 200550. [Google Scholar] [CrossRef]
  11. Sun, Z.; Yang, H.; Zhang, K.; Wang, Z.; Hong, Z.; Yang, G. Self-cleaning effect and secondary swirling clean gas for suppressing particle deposition on vortex finder of gas cyclones. Particuology 2024, 90, 72–87. [Google Scholar] [CrossRef]
  12. Zhang, T.; Li, J.; Yang, D.; Wang, Z.; Zhao, W.; Fu, P.; Wang, H. High-efficiency microplastic removal in water treatment based based on short flow control of hydrocyclone: Mechanism and performance. Sep. Purif. Technol. 2024, 353, 128445. [Google Scholar] [CrossRef] [PubMed]
  13. Chang, Y.F.; Ilea, C.G.; Aasen, Ø.L.; Hoffmann, A.C. Particleflowina hydrohydrocyclone investigated by positron emission particle tracking. Chem. Eng. Sci. 2011, 66, 4203–4211. [Google Scholar] [CrossRef]
  14. Tang, B.; Xu, Y.; Song, X.; Sun, Z.; Yu, J. Numerical study on the relationship between high sharpness and configurations of the vortex finder of a hydrohydrocyclone by central composite design. Chem. Eng. J. 2015, 278, 504–516. [Google Scholar] [CrossRef]
  15. Li, F.; Liu, P.; Yang, X.; Zhang, Y.; Li, X.; Jiang, L.; Fu, W. Purification of granular sediments from wastewater using a novel hydrohydrocyclone. Powder Technol. 2021, 393, 751–763. [Google Scholar] [CrossRef]
  16. Chu, L.; Chen, W.; Lee, X. Effects of geometric and operating parameters and feed characters on the motion of solid particles in hydrohydrocyclones. Sep. Purif. Technol. 2002, 26, 237–246. [Google Scholar] [CrossRef]
  17. Kelsall, D.F. A further study of the hydraulic hydrocyclone. Chem. Eng. Sci. 1953, 2, 254–272. [Google Scholar] [CrossRef]
  18. Frachon, M.; Cilliers, J.J. A general model for hydrohydrocyclone partition curves. Chem. Eng. J. 1999, 73, 53–59. [Google Scholar] [CrossRef]
  19. Hsieh, K.T.; Rajamani, K. Phenomenological model of hydrohydrocyclone: Model development and verification for single-phase flow. Int. J. Miner. Process 1988, 22, 223–237. [Google Scholar] [CrossRef]
  20. Tian, J.; Ni, L.; Song, T.; Olson, J.; Zhao, J. An overview of operating parameters and conditions in hydrohydrocyclones for enhanced separations. Sep. Purif. Technol. 2018, 206, 268–285. [Google Scholar] [CrossRef]
  21. Bradley, D.A. The Hydrohydrocyclone; Pergamon Press: Oxford/London, UK, 1965. [Google Scholar]
  22. Yang, L.; Tian, J.-L.; Yang, Z.; Li, Y.; Fu, C.-H.; Zhu, Y.-H.; Pang, X.-L. Numerical analysis of non-Newtonian rheology effect on hydrohydrocyclone flow field. Petroleum 2015, 1, 68–74. [Google Scholar] [CrossRef]
  23. Rietema, K. Performance and design of hydrohydrocyclones-IV design of hydrohydrocyclones. Chem. Eng. Sci. 1961, 15, 320–325. [Google Scholar] [CrossRef]
  24. Zhao, W.; Li, J.P.; Zhang, T.; Wei, A.S.; Li, S.Y.; Yang, D.H.; Wang, H. Separation characters of dewatering hydrocyclone with annular vortex finder based on particle image velocimetry and experiments. Sep. Purif. Technol. 2025, 353, 128619. [Google Scholar] [CrossRef]
  25. Tripathy, S.K.; Bhoja, S.K.; Kumar, C.R.; Suresh, N. A short review on hydraulic classification and its development in mineral industry. Powder Technol. 2015, 270, 205–220. [Google Scholar] [CrossRef]
  26. Ghodrat, M.; Yu, A.B.; Vince, A.; Barnett, G.D. Numerical analysis of hydrohydrocyclones with different conical section designs. Engineering 2014, 62, 74–84. [Google Scholar]
  27. Kuang, S.B.; Chu, K.W.; Yu, A.B.; Vince, A. Numerical study of liquid-gas-solid flow in classifying hydrohydrocyclones:Effect of feed solids concentration. Miner. Eng. 2021, 31, 17–31. [Google Scholar] [CrossRef]
  28. Delgadillo, J.A.; Rajamani, R.K. Exploration of hydrohydrocyclone designs using computational fluid dynamics. Int. J. Miner. Process 2007, 84, 252–261. [Google Scholar] [CrossRef]
  29. Cui, B.; Wei, D.; Gao, S.; Liu, W.; Feng, Y. Numerical and experimental studies of flowfield in hydrohydrocyclone with air core. Trans. Nonferrous Met. Soc. China 2014, 24, 2642–2649. [Google Scholar] [CrossRef]
  30. Yu, A.B.; Standish, N. A study of particle size distributions. Powder Technol. 1990, 62, 101–118. [Google Scholar] [CrossRef]
Figure 1. Hydrohydrocyclone 3D structure (a) and meshing (b).
Processes 12 02654 g001
Figure 2. Verification of mesh independence.
Processes 12 02654 g002
Figure 3. Validation of the numerical simulation for the flow field. Z = 120 mm.
Processes 12 02654 g003
Figure 4. Variation in static pressure with the vortex finder diameters. (a) Z = 80 mm; (b) Z = 120 mm; (c) Z = 180 mm; (d) Z = 220 mm.
Processes 12 02654 g004
Figure 5. Variation in pressure drop and split ratio with vortex finder diameter.
Processes 12 02654 g005
Figure 6. Variation in pressure efficiency with vortex finder diameter.
Processes 12 02654 g006
Figure 7. Variation in tangential velocity with different vortex finder diameters. (a) Z = 80 mm; (b) Z = 120 mm; (c) Z = 180 mm; (d) Z = 220 mm.
Processes 12 02654 g007aProcesses 12 02654 g007b
Figure 8. Variation in axial velocity with different vortex finder diameters. (a) Z = 80 mm; (b) Z = 120 mm; (c) Z = 180 mm; (d) Z = 220 mm.
Processes 12 02654 g008
Figure 9. LZVV under different vortex finder diameters.
Processes 12 02654 g009
Figure 10. Effect of vortex finder diameter on turbulent kinetic energy.
Processes 12 02654 g010
Figure 11. Variation in static pressure with different insertion depths of vortex finder. (a) Z = 80 mm; (b) Z = 120 mm; (c) Z = 180 mm; (d) Z = 220 mm.
Processes 12 02654 g011
Figure 12. Variation in pressure drop and split ratio.
Processes 12 02654 g012
Figure 13. Variation in pressure efficiency.
Processes 12 02654 g013
Figure 14. Variation in tangential velocity with insertion depth of vortex finder. (a) Z = 80 mm; (b) Z = 120 mm; (c) Z = 180 mm; (d) Z = 220 mm.
Processes 12 02654 g014
Figure 15. Variation in axial velocity with insertion depth of vortex finder. (a) Z = 80 mm; (b) Z = 120 mm; (c) Z = 180 mm; (d) Z = 220 mm.
Processes 12 02654 g015
Figure 16. Variation in LZVV with the different insertion depths of vortex finder.
Processes 12 02654 g016
Figure 17. Variation in turbulent kinetic energy with insertion depth of vortex finder.
Processes 12 02654 g017
Figure 18. Variation in static pressure with apex diameter. (a) Z = 80 mm; (b) Z = 120 mm; (c) Z = 180 mm; (d) Z = 220 mm.
Processes 12 02654 g018
Figure 19. Variation in pressure drop and split ratio with apex diameter.
Processes 12 02654 g019
Figure 20. Variation in pressure efficiency with apex diameter.
Processes 12 02654 g020
Figure 21. Variation in tangential velocity with apex diameter. (a) Z = 80 mm; (b) Z = 120 mm; (c) Z = 180 mm; (d) Z = 220 mm.
Processes 12 02654 g021
Figure 22. Variation in axial velocity with apex diameter. (a) Z = 80 mm; (b) Z = 120 mm; (c) Z = 180 mm; (d) Z = 220 mm.
Processes 12 02654 g022
Figure 23. Variation in LZVV under different apex diameters.
Processes 12 02654 g023
Figure 24. Variation in outlet velocity change rate with apex diameter.
Processes 12 02654 g024
Figure 25. Variation in static pressure with aspect ratio. (a) Z = 80 mm; (b) Z = 120 mm; (c) Z = 180 mm; (d) Z = 220 mm.
Processes 12 02654 g025
Figure 26. Variation in pressure drop and split ratio with aspect ratio.
Processes 12 02654 g026
Figure 27. Variation in pressure efficiency with aspect ratio.
Processes 12 02654 g027
Figure 28. Variation in tangential velocity with aspect ratio. (a) Z = 80 mm; (b) Z = 120 mm; (c) Z = 180 mm; (d) Z = 220 mm.
Processes 12 02654 g028
Figure 29. Variation in axial velocity with aspect ratio. (a) Z = 80 mm; (b) Z = 120 mm; (c) Z = 180 mm; (d) Z = 220 mm.
Processes 12 02654 g029
Figure 30. Variation in LZVV under different aspect ratios.
Processes 12 02654 g030
Figure 31. Variation in turbulent kinetic energy with aspect ratio.
Processes 12 02654 g031
Table 1. List of geometric parameters.
DesignationSize/mm
Height of column section120
Height of cone section180
Overflow pipe diameter25
Overflow pipe insertion depth75
Bottom flow opening diameter7.5
Thickness of deflector plate 1
Bump height10
Table 2. Size distribution of particles in feed.
Size Interval/umMean Size/umVolume Fraction/%
0–10.50.41
1–320.56
3–540.62
5–760.81
7–107.50.62
10–20150.53
20–30250.72
30–50400.31
50–70600.42
Disclaimer/Publisher’s Note: The statements, opinions and data contained in all publications are solely those of the individual author(s) and contributor(s) and not of MDPI and/or the editor(s). MDPI and/or the editor(s) disclaim responsibility for any injury to people or property resulting from any ideas, methods, instructions or products referred to in the content.

